mhfi investor day slides 3-18-2014
Post on 14-Sep-2014
327 views
DESCRIPTION
TRANSCRIPT
0
Welcome
Chip MerrittVice President, Investor Relations
March 18
2
Welcome to the Inaugural
McGraw Hill Financial
2
3
Comparison of Adjusted Information to US GAAP Information
This presentation includes adjusted financial measures that are derived from the Company’s continuing operations. This non‐GAAP information is provided in order to allow investors to make meaningful comparisons of the Company’s operating performance between periods and to view the Company’s business from the same perspective as Company management.
The Company’s quarterly earnings releases contain exhibits that reconcile the differences between the non‐GAAP measures and comparable financial measures calculated in accordance with US GAAP.

4
“Safe Harbor” Statement Under the Private Securities Litigation Reform Act of 1995
We caution readers not to place undue reliance on forward‐looking statements.
• worldwide economic, financial, political and regulatory conditions;
• currency and foreign exchange volatility;
• the effect of competitive products and pricing;
• the level of success of new product development and global expansion;
• the level of future cash flows;
• the levels of capital investments;
• income tax rates;
• restructuring charges;
• the health of debt and equity markets, including credit quality and spreads, the level of liquidity and future debt issuances;
• the level of interest rates and the strength of the capital markets in the US and abroad;
• the demand and market for debt ratings, including collateralized debt obligations, residential and commercial mortgage and asset‐backed securities and related asset classes;
• the state of the credit markets and their impact on Standard & Poor’s Ratings and the economy in general;
• the regulatory environment affecting Standard & Poor’s Ratings and our other businesses;
• the likely outcome and impact of litigation and investigations on our operations and financial condition;
• the level of merger and acquisition activity in the US and abroad;
• continued investment by the construction, automotive, and computer industries;
• the strength and performance of the domestic and international automotive markets;
• the volatility of the energy marketplace;
• and the contract value of public works, manufacturing and single‐family unit construction.
This presentation contains forward‐looking statements, including without limitation statements relating to our businesses and our prospects, new products, sales, expenses, tax rates, cash flows, and operating and capital requirements that are made pursuant to the safe harbor provisions of the Private Securities Litigation Reform Act of 1995. These forward‐looking statements are intended to provide management’s current expectations or plans for our future operating and financial performance and are based on assumptions management believes are reasonable at the time they are made.
Forward‐looking statements can be identified by the use of words such as “believe,” “expect,” “plan,” “estimate,” “project,” “target,” “anticipate,” “intend,” “may,” “will,” “continue” and other words of similar meaning in connection with a discussion of future operating or financial performance. These statements are not guarantees of future performance and involve certain risks, uncertainties and assumptions that are difficult to predict; therefore, actual outcomes and results could differ materially from what is expected or forecasted. These risks and uncertainties include, among others:
5
EU Regulation Affecting Investors in Credit Rating Agencies
European Union Regulation 1060/2009 (as amended) applies to credit rating agencies (CRAs) registered in the European Union and therefore to the activities of Standard & Poor’s Credit Market Services Europe Limited, Standard & Poor’s Credit Market Services France SAS and Standard & Poor’s Credit Market Services Italy Srl, (collectively, “Standard & Poor’s”), indirect wholly‐owned subsidiaries of McGraw Hill Financial, Inc., each of which is registered and regulated as a CRA with the European Securities and Markets Authority (“ESMA”).
Any person obtaining direct or indirect ownership or control of 5% or more or 10% or more of the shares in McGraw Hill Financial, Inc. may (i) impact how Standard & Poor’s can conduct its CRA activities in the European Union and/or (ii) themselves become directly impacted by EU Regulation 1060/2009 (as amended).
Persons who have or expect to obtain such shareholdings in McGraw Hill Financial, Inc. should promptly contact Chip Merritt at the McGraw Hill Financial, Inc. Investor Relations department ([email protected]) for more information and should also obtain independent legal advice in such respect.
6
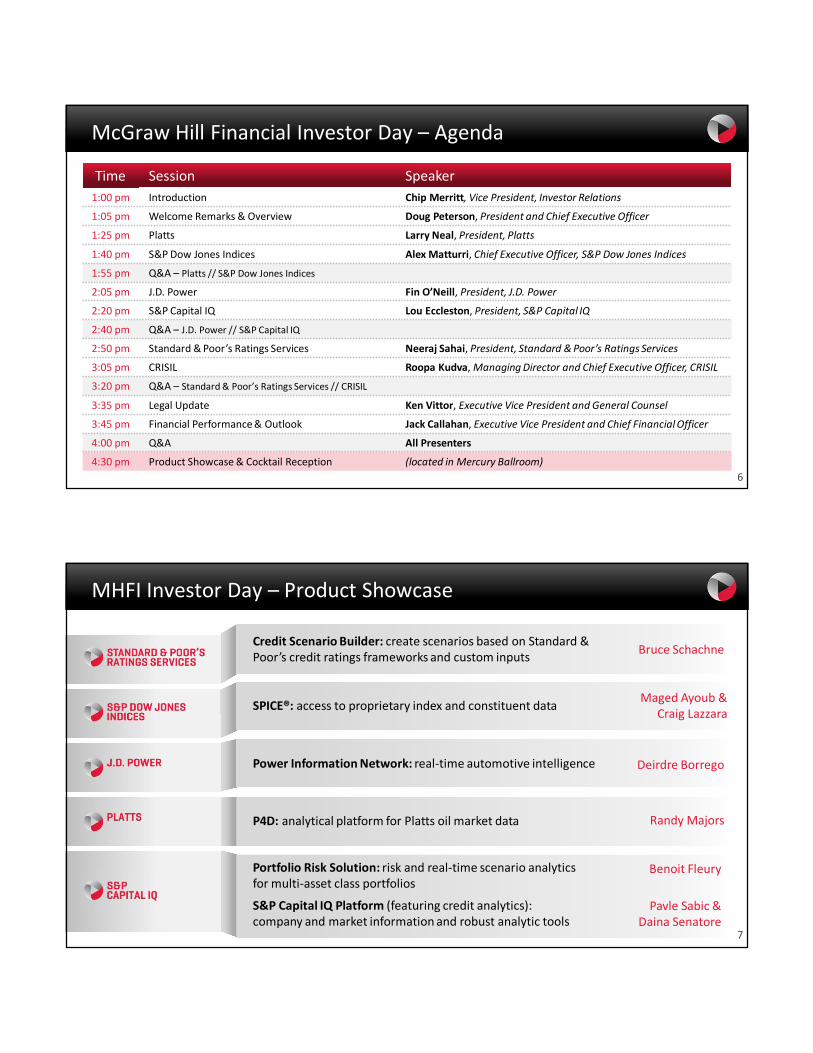
McGraw Hill Financial Investor Day – Agenda
Time Session Speaker
1:00 pm Introduction Chip Merritt, Vice President, Investor Relations
1:05 pm Welcome Remarks & Overview Doug Peterson, President and Chief Executive Officer
1:25 pm Platts Larry Neal, President, Platts
1:40 pm S&P Dow Jones Indices Alex Matturri, Chief Executive Officer, S&P Dow Jones Indices
1:55 pm Q&A – Platts // S&P Dow Jones Indices
2:05 pm J.D. Power Fin O’Neill, President, J.D. Power
2:20 pm S&P Capital IQ Lou Eccleston, President, S&P Capital IQ
2:40 pm Q&A – J.D. Power // S&P Capital IQ
2:50 pm Standard & Poor’s Ratings Services Neeraj Sahai, President, Standard & Poor’s Ratings Services
3:05 pm CRISIL Roopa Kudva, Managing Director and Chief Executive Officer, CRISIL
3:20 pm Q&A – Standard & Poor’s Ratings Services // CRISIL
3:35 pm Legal Update Ken Vittor, Executive Vice President and General Counsel
3:45 pm Financial Performance & Outlook Jack Callahan, Executive Vice President and Chief Financial Officer
4:00 pm Q&A All Presenters
4:30 pm Product Showcase & Cocktail Reception (located in Mercury Ballroom)
7
MHFI Investor Day – Product Showcase
SPICE®: access to proprietary index and constituent data
Portfolio Risk Solution: risk and real‐time scenario analyticsfor multi‐asset class portfolios
S&P Capital IQ Platform (featuring credit analytics):company and market information and robust analytic tools
P4D: analytical platform for Platts oil market data
Power Information Network: real‐time automotive intelligence
Credit Scenario Builder: create scenarios based on Standard & Poor’s credit ratings frameworks and custom inputs
Maged Ayoub &Craig Lazzara
Benoit Fleury
Randy Majors
Deirdre Borrego
Bruce Schachne
Pavle Sabic &Daina Senatore
7
8
Creating Growth & Driving Performance
Doug PetersonPresident and Chief Executive Officer
10
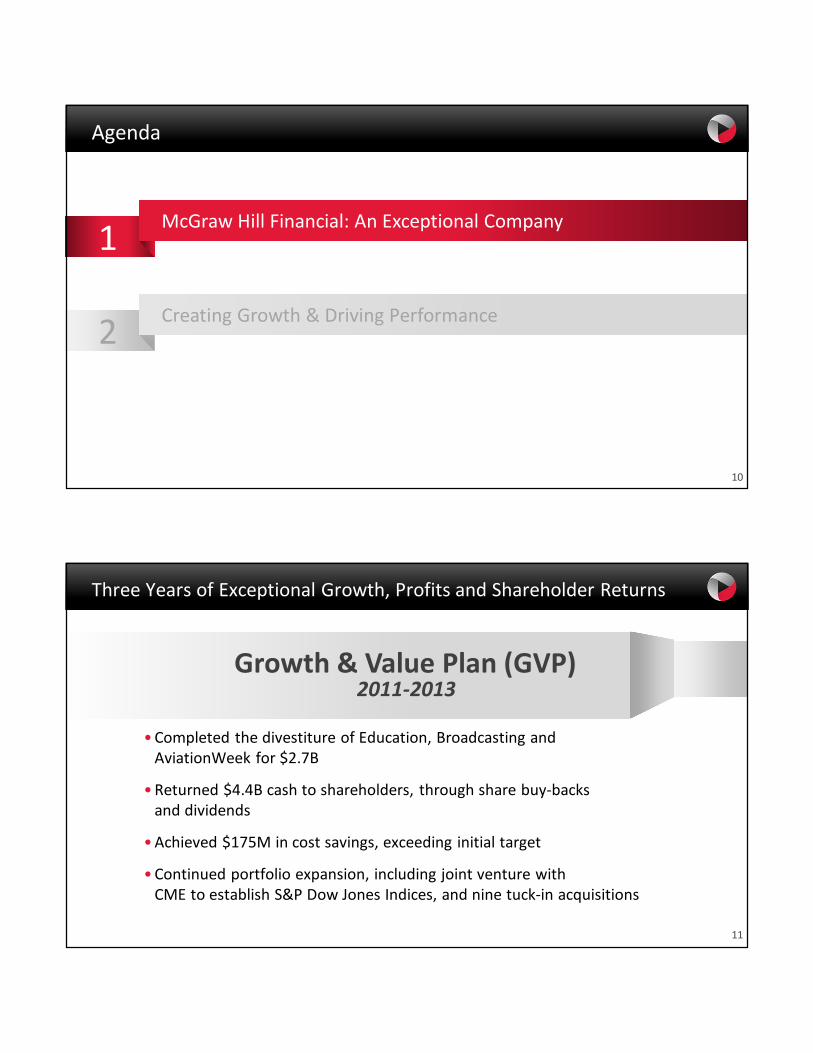
Agenda
McGraw Hill Financial: An Exceptional Company1
2Creating Growth & Driving Performance
11
Three Years of Exceptional Growth, Profits and Shareholder Returns
•Completed the divestiture of Education, Broadcasting andAviationWeek for $2.7B
•Returned $4.4B cash to shareholders, through share buy‐backsand dividends
•Achieved $175M in cost savings, exceeding initial target
•Continued portfolio expansion, including joint venture withCME to establish S&P Dow Jones Indices, and nine tuck‐in acquisitions
Growth & Value Plan (GVP)2011‐2013

12
Accelerated Revenue Growth
2.9%3.6%
‐6.3%
201120102009
9.6%
12.5%
8.6%
201320122011
Total MHP revenue as originally reported
13
Delivered Exceptional Shareholder Returns
2011 2013 Change
Revenue $6,246M $4,875M ‐22%
Operating Profit+ $1,498M $1,602M +7%
Operating Margin+
24% 33% +9pts
EPS+ $2.91 $3.33 +14%
CapEx $277M* $117M ‐58%
70%
100%
130%
160%
190%
220%
Jan '11 Dec '11 Dec '12 Dec '13
MHFI Share Price and Total Shareholder Return01/01/2011 to 12/31/2013
Share Price2
(+114%)
Total Shareholder Return1
(+140%)
1) Calculated using dividend adjusted closing share price
2) Calculated using non‐adjusted closing share price
Source:S&P Capital IQ
2011 Includes MHE+ As adjusted* Includes investment in prepublication costs
14
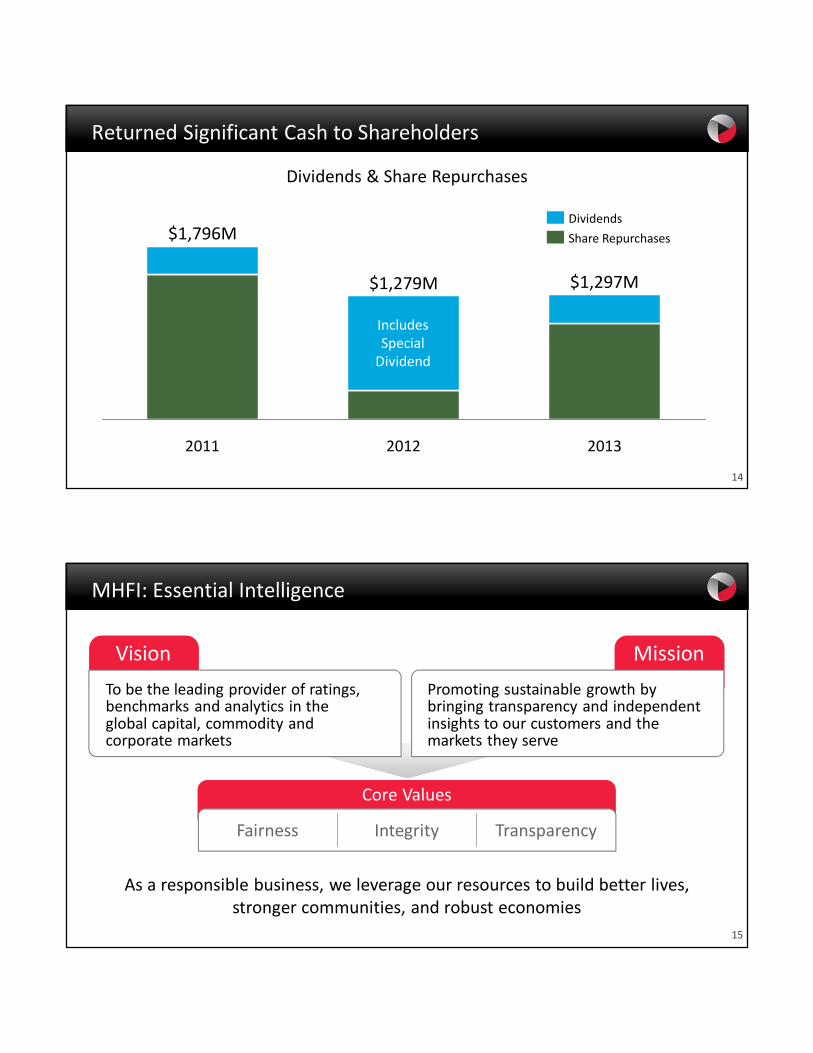
Returned Significant Cash to Shareholders
Dividends & Share Repurchases
$1,297M
20132012
$1,279M
2011
$1,796M Share Repurchases
Dividends
Includes Special Dividend
15
Mission
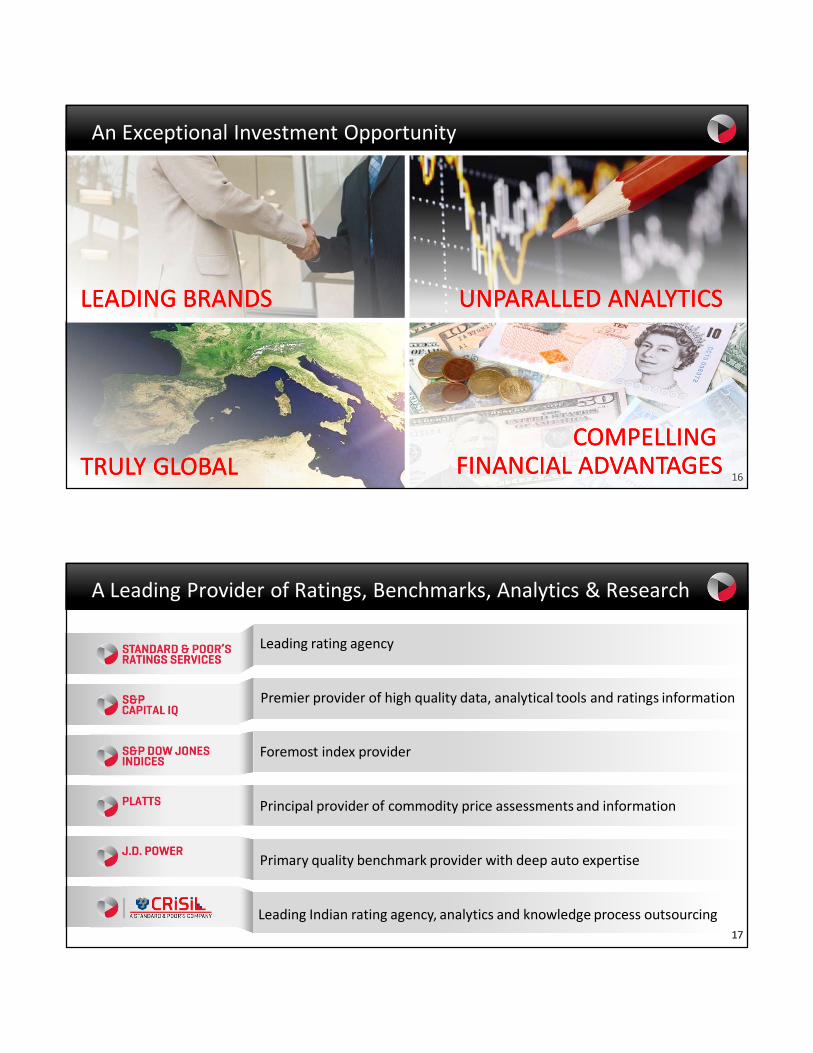
MHFI: Essential Intelligence
Vision
To be the leading provider of ratings, benchmarks and analytics in the global capital, commodity and corporate markets
Promoting sustainable growth by bringing transparency and independent insights to our customers and the markets they serve
Core Values
Integrity TransparencyFairness
As a responsible business, we leverage our resources to build better lives,stronger communities, and robust economies
16
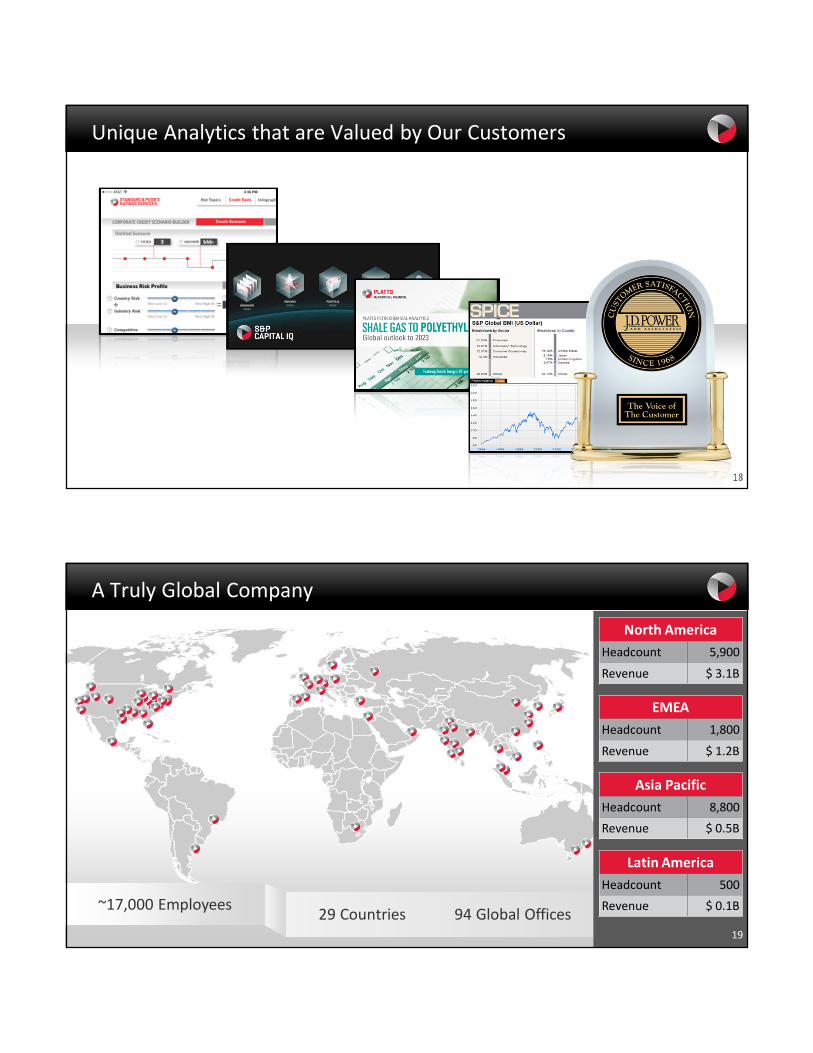
An Exceptional Investment Opportunity
UNPARALLED ANALYTICSUNPARALLED ANALYTICS
TRULY GLOBALTRULY GLOBALCOMPELLING
FINANCIAL ADVANTAGESCOMPELLING
FINANCIAL ADVANTAGES
LEADING BRANDSLEADING BRANDS
16
17
A Leading Provider of Ratings, Benchmarks, Analytics & Research
Premier provider of high quality data, analytical tools and ratings information
Foremost index provider
Principal provider of commodity price assessments and information
Primary quality benchmark provider with deep auto expertise
Leading rating agency
Leading Indian rating agency, analytics and knowledge process outsourcing17
18
Unique Analytics that are Valued by Our Customers
19
A Truly Global Company
North America
Headcount 5,900
Revenue $ 3.1B
29 Countries 94 Global Offices
EMEA
Headcount 1,800
Revenue $ 1.2B
Asia Pacific
Headcount 8,800
Revenue $ 0.5B
Latin America
Headcount 500
Revenue $ 0.1B~17,000 Employees
19
20
Compelling Financial Advantages
• Well positioned in growth markets
• Substantial recurring revenue through subscriptions
• High margins
• Minimal reinvestment andworking capital requirements
• Low asset intensity
• Strong free cash flow generation20
21
2
Agenda
Creating Growth & Driving Performance
1McGraw Hill Financial: An Exceptional Company
22
Growth & Performance Goals: 2014‐2016
Creating Growth & Driving Performance
• Setting annual growth goals:– Mid to high single‐digit revenue growth– Sustained margin expansion– Mid teens EPS growth– ~$1B per year free cash flow
• Maintaining disciplined capital allocation:– Continue to pursue attractive acquisitions – Sustain dividend growth and share repurchases
• Shifting from a holding company to an active management model
• Completing portfolio rationalization with evaluation of strategic alternatives for McGraw Hill Construction
• Targeting at least $100 million in productivity savings
23
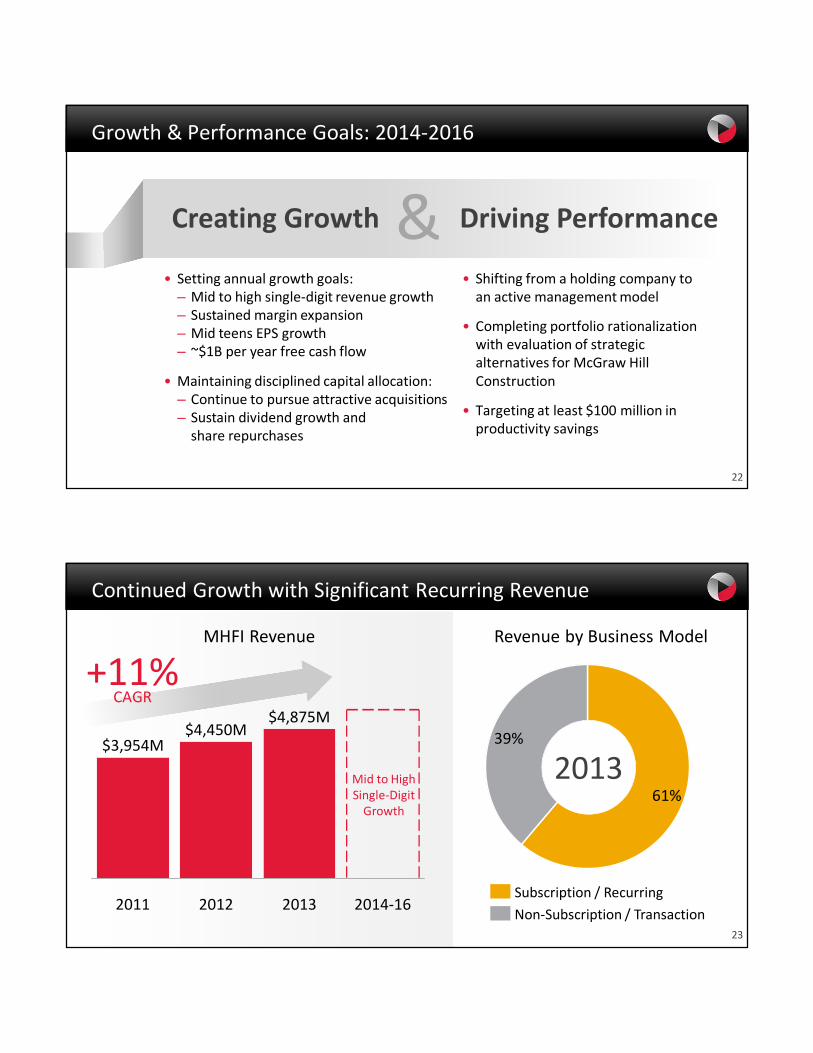
Continued Growth with Significant Recurring Revenue
39%
61%
MHFI Revenue
2014‐162013
$4,875M
2012
$4,450M
2011
$3,954M
Revenue by Business Model
Non‐Subscription / Transaction
Subscription / Recurring
Mid to High Single‐DigitGrowth
2013
+11%CAGR
24
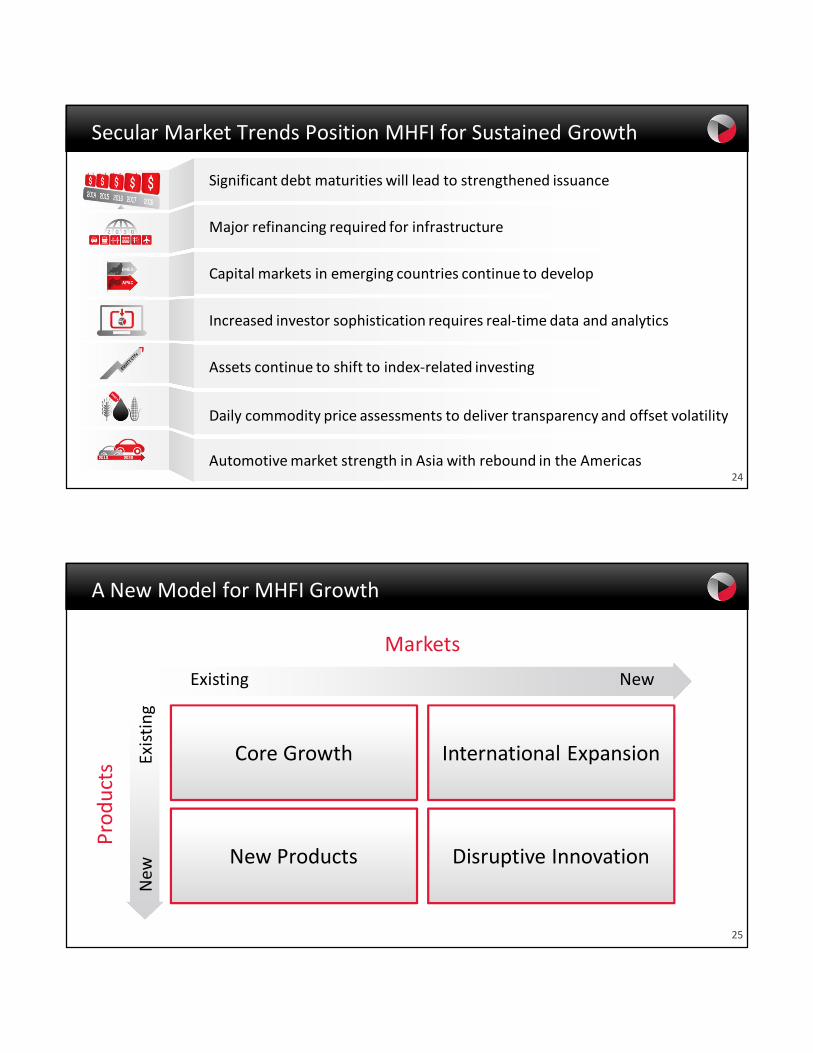
Secular Market Trends Position MHFI for Sustained Growth
Significant debt maturities will lead to strengthened issuance
Major refinancing required for infrastructure
Capital markets in emerging countries continue to develop
Increased investor sophistication requires real‐time data and analytics
Assets continue to shift to index‐related investing
Daily commodity price assessments to deliver transparency and offset volatility
Automotive market strength in Asia with rebound in the Americas
25
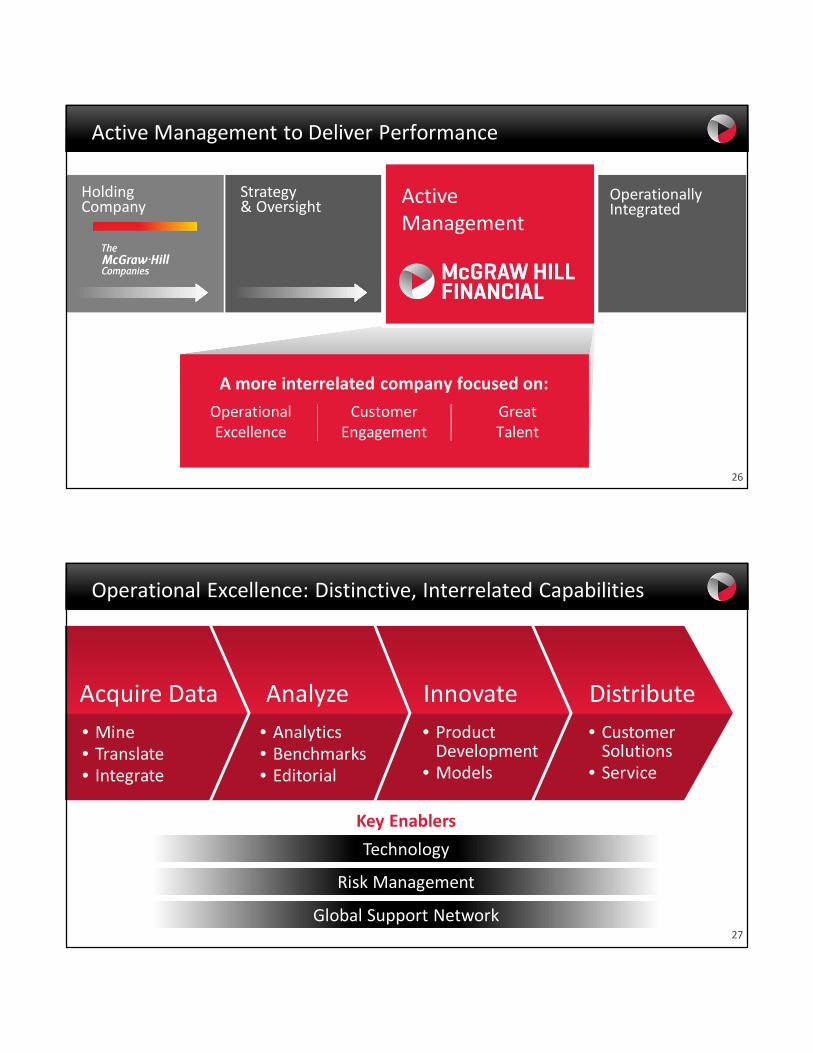
A New Model for MHFI Growth
Core Growth
New Products Disruptive Innovation
International Expansion
Existing New
New
Existing
Markets
Products
26
A more interrelated company focused on:
Operational Excellence
Customer Engagement
Great Talent
Active Management to Deliver Performance
Operationally Integrated
Holding Company
Strategy& Oversight
ActiveManagement
27
Operational Excellence: Distinctive, Interrelated Capabilities
Acquire Data
• Mine• Translate• Integrate
Analyze
• Analytics• Benchmarks• Editorial
Innovate
• Product Development
• Models
Distribute
• Customer Solutions
• Service
Key Enablers
Technology
Risk Management
Global Support Network

28
Customer Engagement: Diverse Customer Set
Revenue by Customer Segment
18%
14%
5%
19%
44%2013
Public Sector
Investment Management
Financial Institutions & Banks
Corporates
Investment Banks & Private Equity
29
Customer Engagement: Strong Outreach
29

30
Great Talent: Foundational to Driving Performance
30
31
Growth & Performance Across Our Businesses
&
CreatingGrowth
Driving Performance

32
Platts
Larry NealPresident, Platts
34
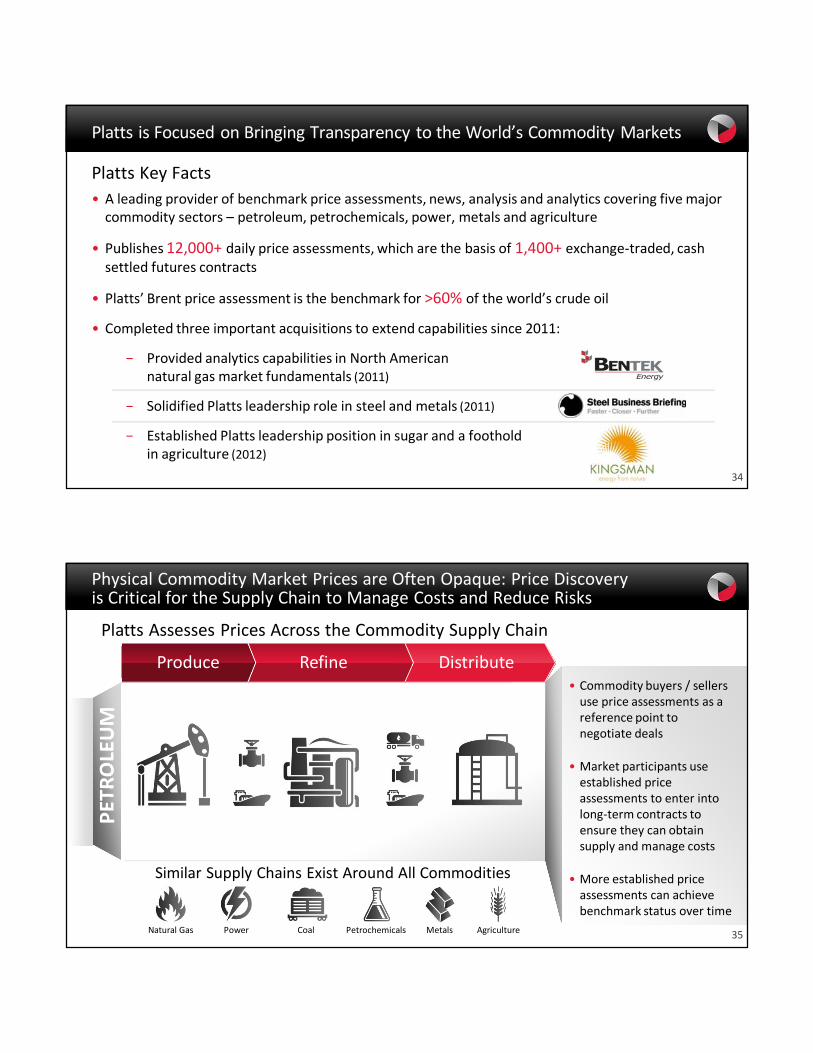
Platts is Focused on Bringing Transparency to the World’s Commodity Markets
Platts Key Facts
• A leading provider of benchmark price assessments, news, analysis and analytics covering five major commodity sectors – petroleum, petrochemicals, power, metals and agriculture
• Publishes 12,000+ daily price assessments, which are the basis of 1,400+ exchange‐traded, cash settled futures contracts
• Platts’ Brent price assessment is the benchmark for >60% of the world’s crude oil
• Completed three important acquisitions to extend capabilities since 2011:
− Provided analytics capabilities in North American natural gas market fundamentals (2011)
− Solidified Platts leadership role in steel and metals (2011)
− Established Platts leadership position in sugar and a foothold in agriculture (2012)
35
Physical Commodity Market Prices are Often Opaque: Price Discovery is Critical for the Supply Chain to Manage Costs and Reduce Risks
RefineProduce Distribute
PETROLEUM
Similar Supply Chains Exist Around All Commodities
• Commodity buyers / sellers use price assessments as a reference point to negotiate deals
• Market participants use established price assessments to enter into long‐term contracts to ensure they can obtain supply and manage costs
• More established price assessments can achieve benchmark status over time
Platts Assesses Prices Across the Commodity Supply Chain
Natural Gas Power Coal Petrochemicals Metals Agriculture
36
Platts Publishes More Than 12,000 Daily Prices to Supportthe Physical Commodity Market Flows and the World’s Supply Chains
Integrated Oil Major AirlineRefinery ManufacturerUtilitiesMining Company Steel Mill
ProcessorsProducers End Users
Oil Exporters
Oil Importers
37
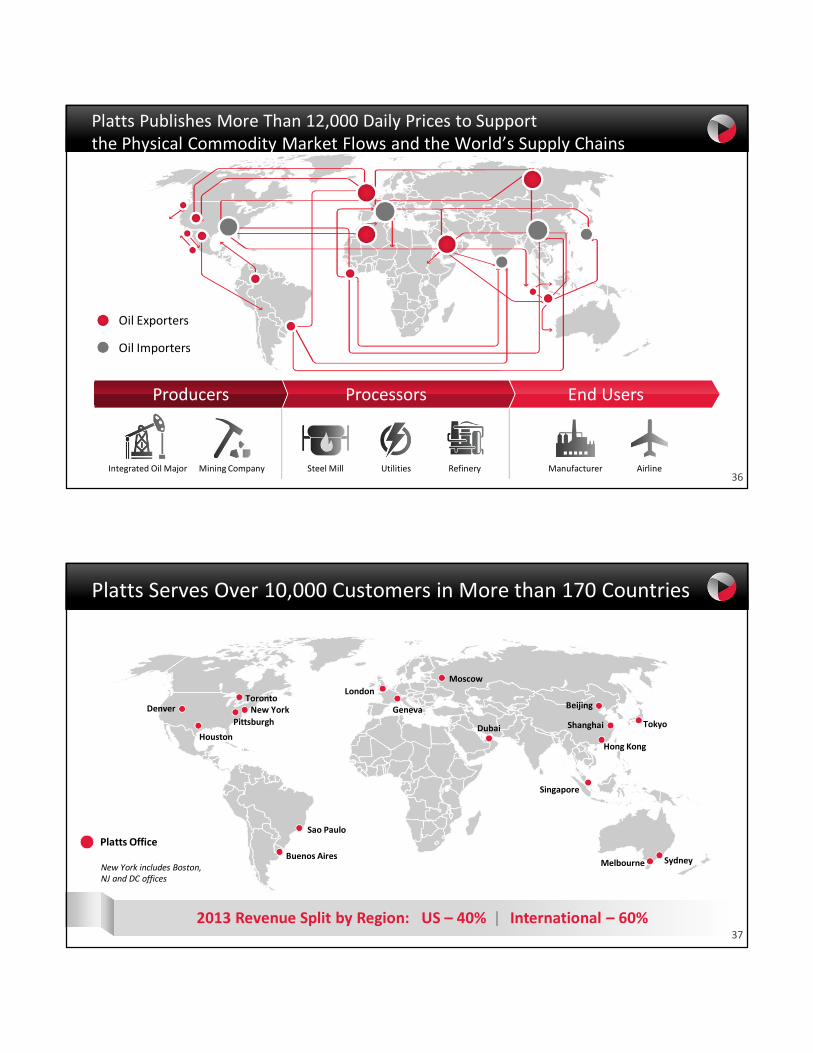
Platts Serves Over 10,000 Customers in More than 170 Countries
Sao Paulo
Pittsburgh
New YorkToronto
London
Geneva
Moscow
Dubai
Singapore
Hong Kong
Tokyo
Beijing
Shanghai
Sydney
Platts Office
2013 Revenue Split by Region: US – 40% International – 60%
Buenos Aires
Houston
Denver
MelbourneNew York includes Boston, NJ and DC offices
38
Commodity Markets have Evolved in their Use of Different Price Mechanisms
Market Players Coalesce Around One or Two Benchmarks with Futures Settled Against One
Pricing Mechanism
Use ofPrice • Used to negotiate contracts
• Bi‐lateral contracts use floating prices linked to a benchmark index
• Used to settle futures contracts in lieu of physical delivery
Market Benefit
• Source of pricing intelligence• Informs price trends
• Enables buyers and sellers to manage risks of temporary price movements
• Cash settlement reduces transaction costs incurred in physical delivery
Reference Price Price Benchmark Cash Settled Futures
Market Importance
Number of Providers
Multiple One or Two One
39
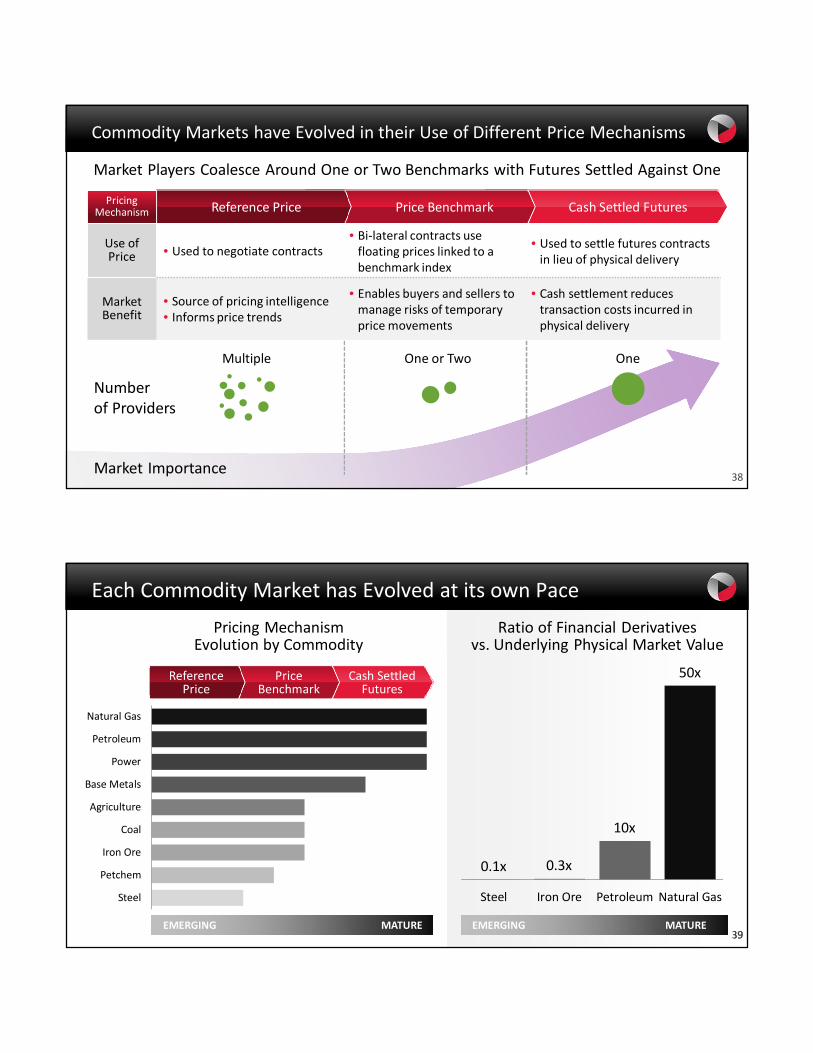
Each Commodity Market has Evolved at its own Pace
Steel
Petchem
Iron Ore
Coal
Agriculture
Base Metals
Power
Petroleum
Natural Gas
0.1x 0.3x
10x
50x
Steel Iron Ore Petroleum Natural Gas
Pricing MechanismEvolution by Commodity
Ratio of Financial Derivatives vs. Underlying Physical Market Value
ReferencePrice
Price Benchmark
Cash Settled Futures
EMERGING MATURE EMERGING MATURE 39
40
2013
Market Data FeedsReal‐time InformationNewsletters / ReportsConferences, Consulting, Other
Platts’ Strategy is Focused on Elevating Price Assessmentsto Benchmark Prices Across Physical Commodity Markets
Market Data Feeds
• Price data feeds serving front, middle and back office
Real‐time Information
• Market news & commentary, live globalbids / offers and intra‐day spot price assessments in real‐time
Newsletters / Reports
• Covering pricing, data, company news, changes in regulation, M&A and new legislation
Revenue Breakdown
41
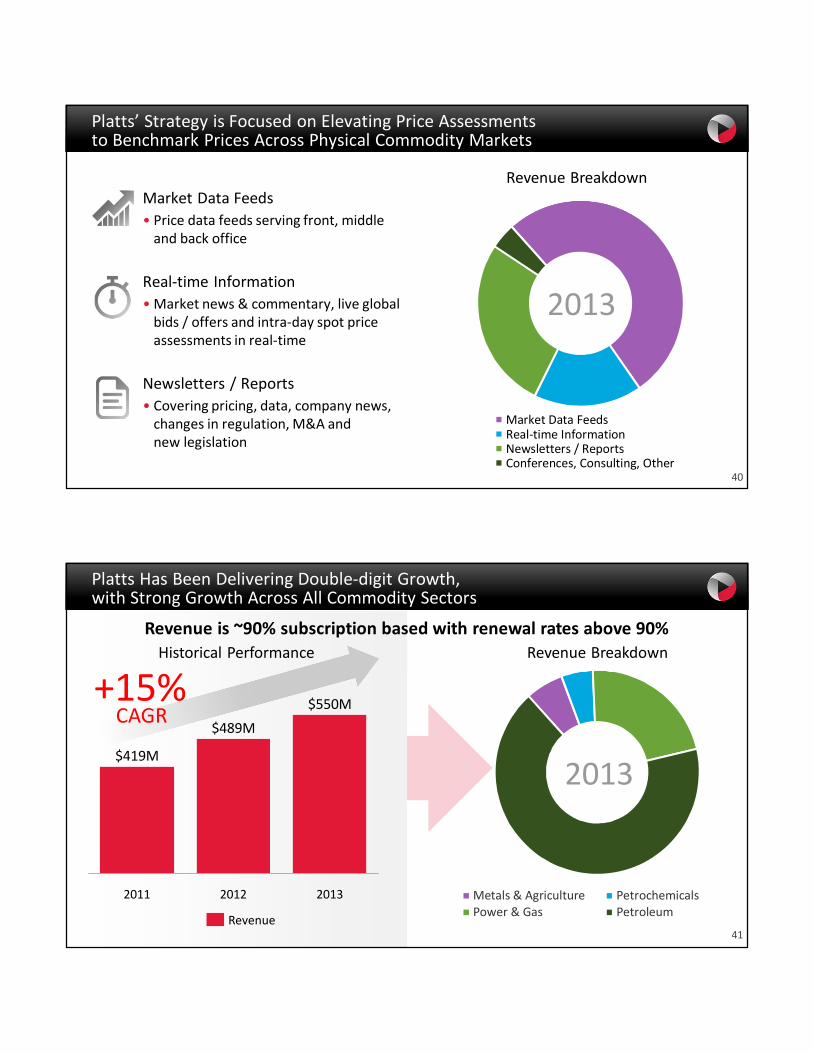
2013
Metals & Agriculture PetrochemicalsPower & Gas Petroleum
Platts Has Been Delivering Double‐digit Growth,with Strong Growth Across All Commodity Sectors
Historical Performance Revenue Breakdown
2012 20132011
$419M
$550M
$489M
+15%CAGR
Revenue
Revenue is ~90% subscription based with renewal rates above 90%
42
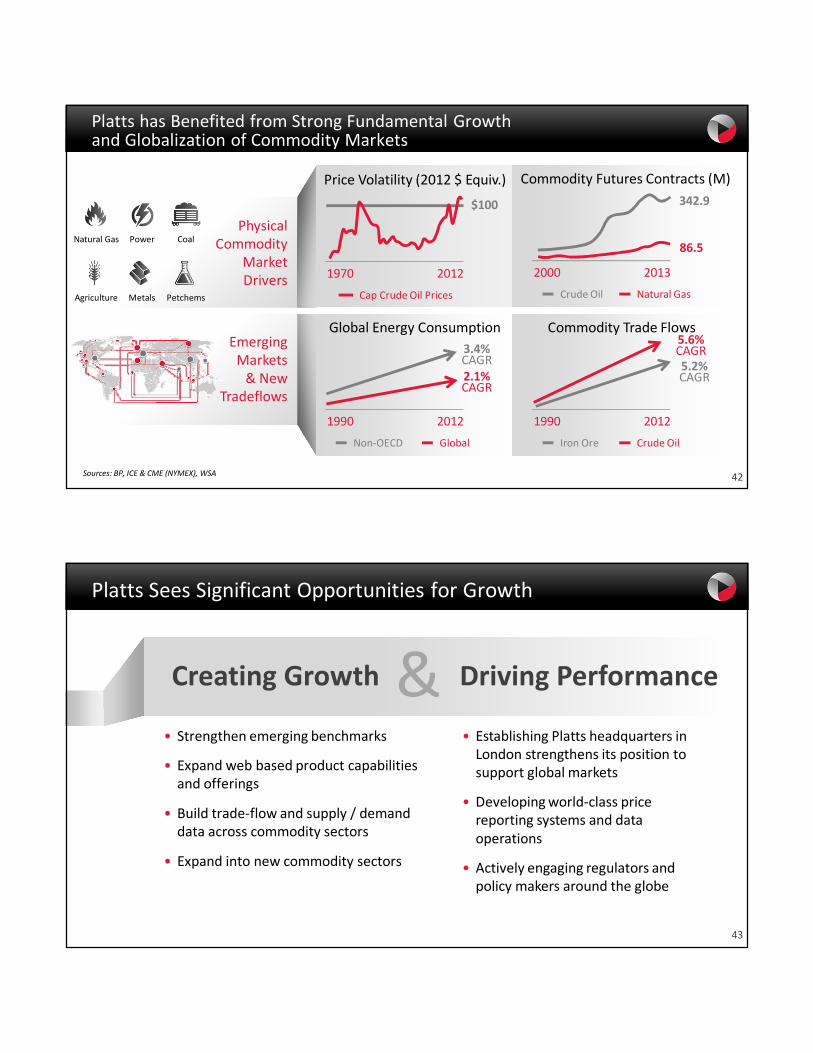
Platts has Benefited from Strong Fundamental Growthand Globalization of Commodity Markets
Sources: BP, ICE & CME (NYMEX), WSA
Physical Commodity
MarketDrivers
Commodity Futures Contracts (M)
2000 2013
342.9
86.5
Natural GasCrude Oil
Global Energy Consumption
1990 2012
3.4%CAGR2.1%CAGR
GlobalNon‐OECD
Commodity Trade Flows
1990 2012
5.2%CAGR
5.6%CAGR
Crude OilIron Ore
Price Volatility (2012 $ Equiv.)
1970 2012
$100
Cap Crude Oil Prices
Natural Gas Power Coal
PetchemsMetalsAgriculture
Emerging Markets& New
Tradeflows
43
Platts Sees Significant Opportunities for Growth
Creating Growth & Driving Performance
• Establishing Platts headquarters in London strengthens its position to support global markets
• Developing world‐class price reporting systems and data operations
• Actively engaging regulators and policy makers around the globe
• Strengthen emerging benchmarks
• Expand web based product capabilities and offerings
• Build trade‐flow and supply / demand data across commodity sectors
• Expand into new commodity sectors

S&P Dow Jones Indices
Alex MatturriChief Executive Officer, S&P Dow Jones Indices
45
The World’s Leading Index Provider
S&P Dow Jones Indices has over 115 years of experience constructing innovative and transparent solutions that span asset classes, geographies, and investment strategies
The S&P 500 is the world’s most followed stock market index with in benchmarked assets and in indexed assets in 2012
AUM for ETFs based on our indices increased to
S&P Dow Jones Indices calculates over indices daily
VIX is the world’s most traded volatility index, with approximately options contracts and futures contracts traded every day
E‐mini S&P 500 futures and options (CME) average daily volume was over
$5.7 trillion $1.6 trillion
43% $668 billion
1,000,000
570K160K
2.1 million
All statistics are as of 12/31/2013 unless otherwise indicated. Sources: S&P Dow Jones Indices; Futures Industry Association
46
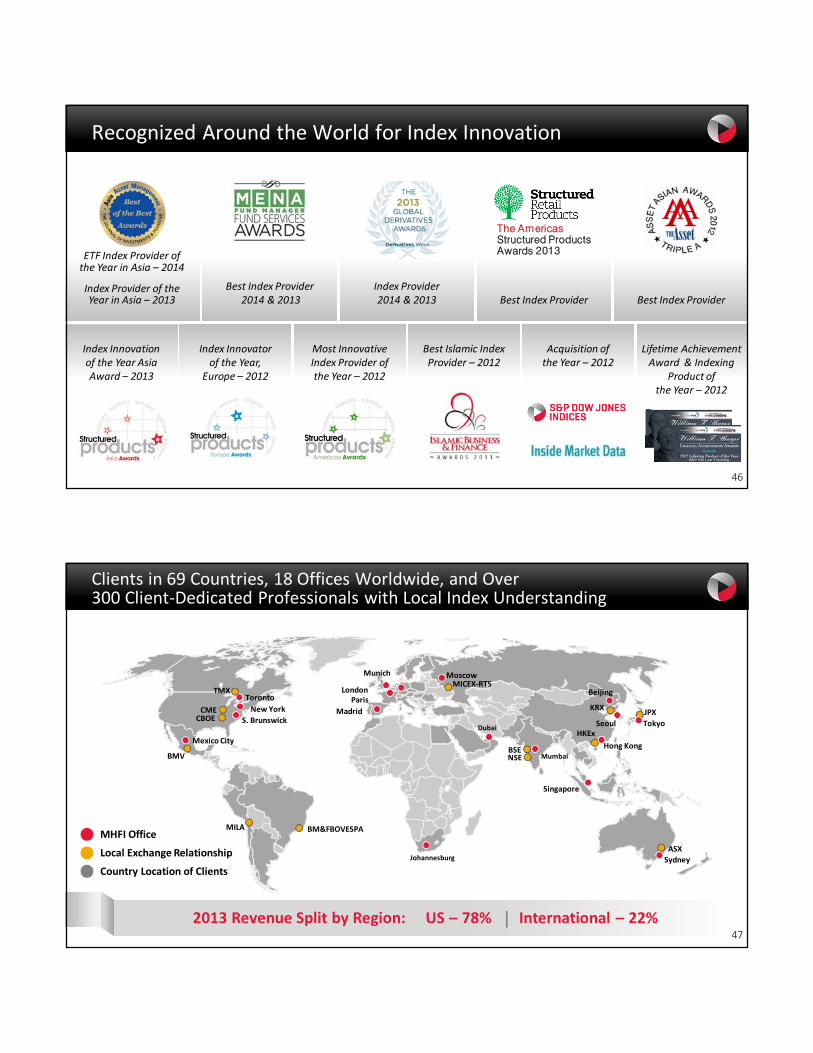
Recognized Around the World for Index Innovation
ETF Index Provider of the Year in Asia – 2014
Index Provider of the Year in Asia – 2013
Best Index Provider2014 & 2013 Best Index Provider
The AmericasStructured ProductsAwards 2013
Index Provider 2014 & 2013
Index Innovator of the Year,
Europe – 2012
Most Innovative Index Provider of the Year – 2012
Acquisition of the Year – 2012
Best Islamic Index Provider – 2012
Best Index Provider
Index Innovation of the Year Asia Award – 2013
Lifetime Achievement Award & Indexing
Product of the Year – 2012
47
Clients in 69 Countries, 18 Offices Worldwide, and Over 300 Client‐Dedicated Professionals with Local Index Understanding
BM&FBOVESPA
BMV
Mexico City
MILA
S. Brunswick
New York
TorontoTMX
CBOECME
Johannesburg
Madrid
ParisLondon
Munich MoscowMICEX‐RTS
Dubai
BSENSE Mumbai
Singapore
Hong Kong
HKExTokyo
JPX
Beijing
Seoul
KRX
ASX
Sydney
Country Location of Clients
Local Exchange Relationship
MHFI Office
2013 Revenue Split by Region: US – 78% International – 22%
48
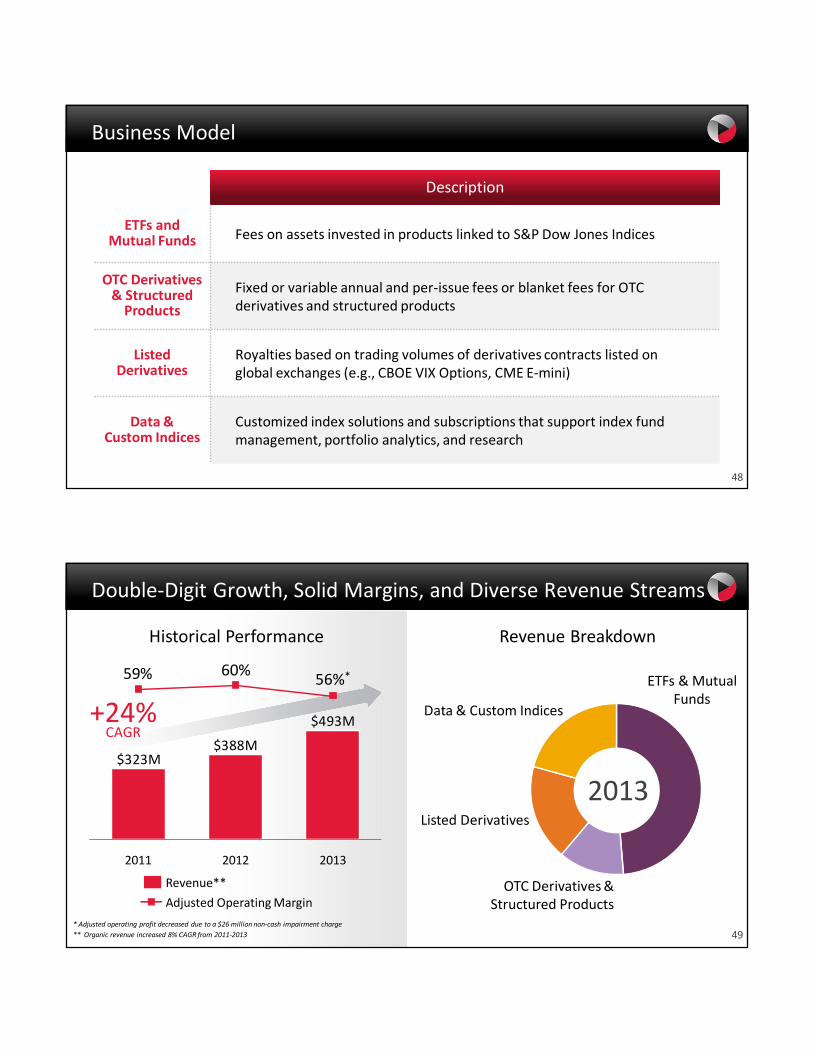
Business Model
Description
ETFs and Mutual Funds Fees on assets invested in products linked to S&P Dow Jones Indices
OTC Derivatives & Structured Products
Fixed or variable annual and per‐issue fees or blanket fees for OTC derivatives and structured products
Listed Derivatives
Royalties based on trading volumes of derivatives contracts listed on global exchanges (e.g., CBOE VIX Options, CME E‐mini)
Data & Custom Indices
Customized index solutions and subscriptions that support index fund management, portfolio analytics, and research
49
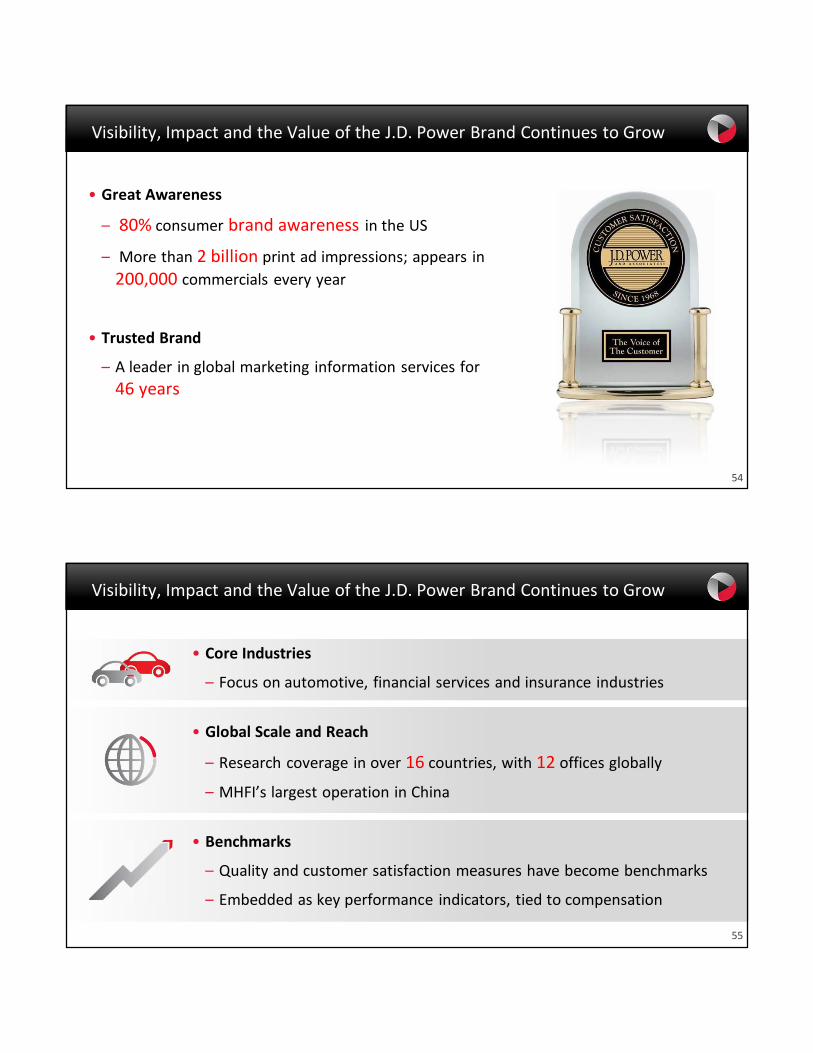
$493M
$388M$323M
60%59%
2013
56%*
20122011
Double‐Digit Growth, Solid Margins, and Diverse Revenue Streams
Historical Performance Revenue Breakdown
Adjusted Operating Margin
Revenue**
* Adjusted operating profit decreased due to a $26 million non‐cash impairment charge
** Organic revenue increased 8% CAGR from 2011‐2013
Data & Custom Indices
Listed Derivatives
OTC Derivatives &Structured Products
ETFs & MutualFunds
2013
+24%CAGR

50
Strong Underlying Growth in Passive Investing
Passive Funds TakingShare from Active
Index ETFs
Index Mutual Funds
Active Mutual Funds
Source: Strategic Insight Simfund, Wells Fargo Securities, LLC
Strong Growth in ETP Industry Assets
Global ETP AUM
+27%CAGR
Source: BlackRock ETP Landscape
3%
9%
2003
88%
13%
2013
13%
74%
ETP Growth Across Regions
Asia Pacific
EMEA
Americas
2003‐2013CAGR
Source: BlackRock ETP Landscape
$1,772B
$461B
$168B+17%
+37%
+27%
2013ETP AUM
$218B
2003
$2,401B
2013
Exchange Traded Product AUM
50
51
S&P Dow Jones Indices Growth Strategy
Strengthen position as one of the world’s largest providers of financial market indices with strong brands across all asset classes
Creating Growth & Driving Performance
• Grow revenue with core clients, including key global exchanges
• Diversify portfolio of index offerings through asset class expansion, new geographies, and investment strategies
• Expand local presence in emerging markets
• Pursue strategic partnerships globally
• Build the brands globally through targeted brand marketing and channel outreach
• Promote thought leadership and index education
• Maintain high standards of integrity & independence

52
J.D. Power
Fin O’NeillPresident, J.D. Power
54
Visibility, Impact and the Value of the J.D. Power Brand Continues to Grow
• Great Awareness
– 80% consumer brand awareness in the US
– More than 2 billion print ad impressions; appears in
200,000 commercials every year
• Trusted Brand
– A leader in global marketing information services for
46 years
55
Visibility, Impact and the Value of the J.D. Power Brand Continues to Grow
• Core Industries
– Focus on automotive, financial services and insurance industries
• Global Scale and Reach
– Research coverage in over 16 countries, with 12 offices globally
– MHFI’s largest operation in China
• Benchmarks
– Quality and customer satisfaction measures have become benchmarks
– Embedded as key performance indicators, tied to compensation

56
Value Proposition
Research
Syndicated Benchmarks Independent industry research and benchmark studies of quality and customer satisfaction
Ad Claims Brand licensing for syndicated study award recipients
Proprietary and TrackingClient‐commissioned research to understand drivers of customer experience
Power Information Network
Data and AnalyticsData driven solutions to help clients understand the automotive retail marketplace and optimize planning
Data Driven Consulting
Performance Improvement and Training
Advisory services to help clients understand and integrate Voice of the Customer into planning and operations
Diversified Business Model: Helps Clients Measure, Understandand Improve Drivers of Growth and Profitability
57
Historical Performance
J.D. Power has Delivered Profitable Growth
Revenue Breakdown
Diversified
Financial Services & Insurance
Automotive2013
$265M
2012
$256M
2011
$239M
+5%CAGR
Revenue
2013

58
J.D. Power has an Increasingly Global Footprint with More than 40% of Revenue Generated Outside of the US
Sao Paulo
Mexico City
TorontoTroyMunich
Singapore
Shanghai
Tokyo
Beijing
Market Coverage
J.D. Power Office
2013 Revenue Split by Region: US – 59% International – 41%
Bangkok
Orange
Westlake Village
59
The Global Automotive Market is Forecast to See Steady Growth, with the Industry’s Center of Gravity Moving East
Global New Light Vehicle Unit Sales (M) Market Dynamics
Source: LMC Automotive Forecasting
1817171614
12
3533
29
24
1917
202020182016201420122010
• Record global sales in 2013 driven by China and US, despite sluggish global economic conditions
• China vehicle demand expected to grow with expanding middle class
• US largely recovered from recession with increases in selling rates, retail sales penetration and average transaction prices
+7%CAGR
+4%CAGR
60
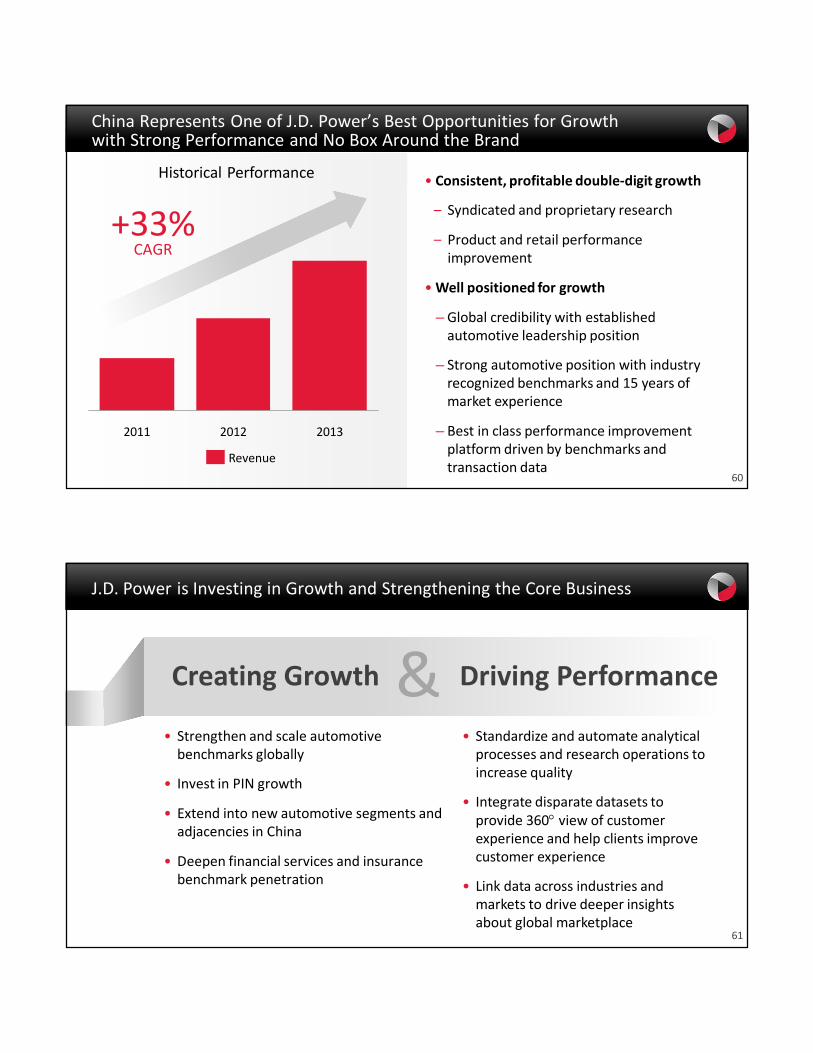
China Represents One of J.D. Power’s Best Opportunities for Growth with Strong Performance and No Box Around the Brand
• Consistent, profitable double‐digit growth
– Syndicated and proprietary research
– Product and retail performance improvement
•Well positioned for growth
– Global credibility with established automotive leadership position
– Strong automotive position with industry recognized benchmarks and 15 years of market experience
– Best in class performance improvement platform driven by benchmarks and transaction data
Historical Performance
201320122011
Revenue
+33%CAGR
61
J.D. Power is Investing in Growth and Strengthening the Core Business
Creating Growth & Driving Performance
• Strengthen and scale automotive benchmarks globally
• Invest in PIN growth
• Extend into new automotive segments and adjacencies in China
• Deepen financial services and insurance benchmark penetration
• Standardize and automate analytical processes and research operations to increase quality
• Integrate disparate datasets to provide 360 view of customer experience and help clients improve customer experience
• Link data across industries and markets to drive deeper insights about global marketplace
62
S&PCapital IQ
Lou EcclestonPresident, S&P Capital IQ

64
S&P Capital IQ Timeline
2014
Launch & Brand
• Launch new capabilities
• Kick‐off global branding initiative
• Re‐tool Equity Research
2011 2012
Acquire & Create
• Three capabilitydriven acquisitions
• Created global “Talent Centers”
• Created IQLanguage
Organize & Establish
• Merged multiple business units
• Integrated Sales, Data Ops & IT
• Established Innovation Lab
• Verified “Market Gaps”
2013
Build & Rationalize
• Simplified business model
• Built new solutions& capabilities
• Wound down or sold multiple non‐core operations
+7%CAGR
65
S&P CAPITAL IQ MARKET SEGMENTS
Simplified Model: 3 Business Lines Selling to 5 Market Segments
Investment Management
Financial Institutions
Investment Banking /
Private EquityCorporates
WealthManagement
• S&P Capital IQ Desktop• Portfolio Risk • Compustat• Consolidated Feeds
S&P Capital IQ Desktop & Enterprise Solutions
• RatingsDirect• RatingsXpress
• Global Markets Intelligence (GMI)
• Leveraged Commentary& Data (LCD)
• Equity Research Services (ERS)
S&P Credit Solutions
S&P Capital IQ Markets Intelligence

66
Investment Management
Financial Institutions
Investment Banking /
Private Equity CorporatesWealth
Management
Revenue by Business Lines and Market Segments
S&P CAPITAL IQ MARKET SEGMENTS
36% 32% 22% 5% 5%
Note: Market Segment data reflects 2013 Actuals
S&P Capital IQ Desktop & Enterprise Solutions
S&P Credit Solutions
S&P Capital IQ Markets Intelligence
61% of Revenue 30% of Revenue 9% of Revenue
67
We Play in a Large & Fragmented Market
Note: Top 10 Competitors includes: S&P Capital IQ, Bloomberg, FactSet, IDC, Moody’s , Morningstar, MSCI, SIX Financial Information, SunGard & Thomson Reuters
$18.2B Off‐Trading Floor Market by Segment
All Others43%
Top 10 Competitors
(Includes
S&P Capital IQ)
57%
• Large market, little step change innovation• Fragmented market, large portion to a multitude of small players• Growth is possible without having to displace largest competitors
Competitive Landscape
Wealth Management
CorporatesInvestment Banking / Private Equity
Financial Institutions
Investment Management
68
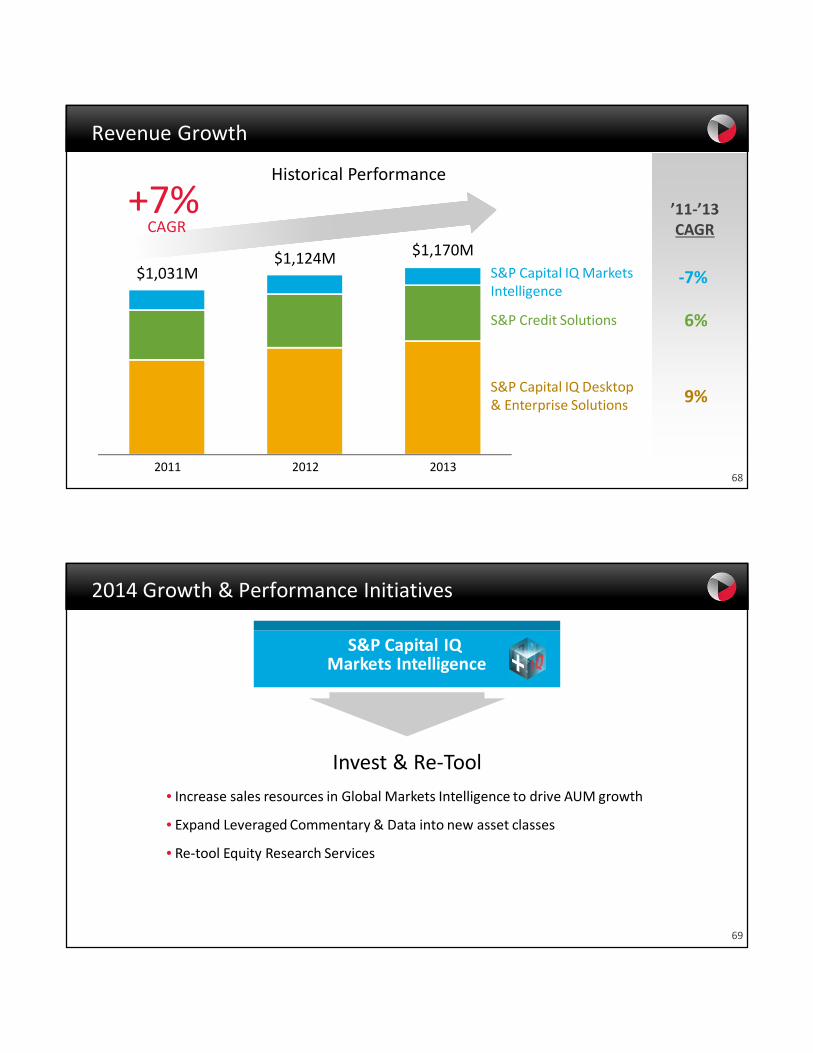
Revenue Growth
S&P Capital IQ MarketsIntelligence
2012
$1,031M$1,124M
2011 2013
S&P Credit Solutions
S&P Capital IQ Desktop& Enterprise Solutions
$1,170M
Historical Performance
’11‐’13CAGR
6%
9%
‐7%
+7%CAGR
69
2014 Growth & Performance Initiatives
• Increase sales resources in Global Markets Intelligence to drive AUM growth
• Expand Leveraged Commentary & Data into new asset classes
• Re‐tool Equity Research Services
S&P Capital IQ Markets Intelligence
Invest & Re‐Tool
70
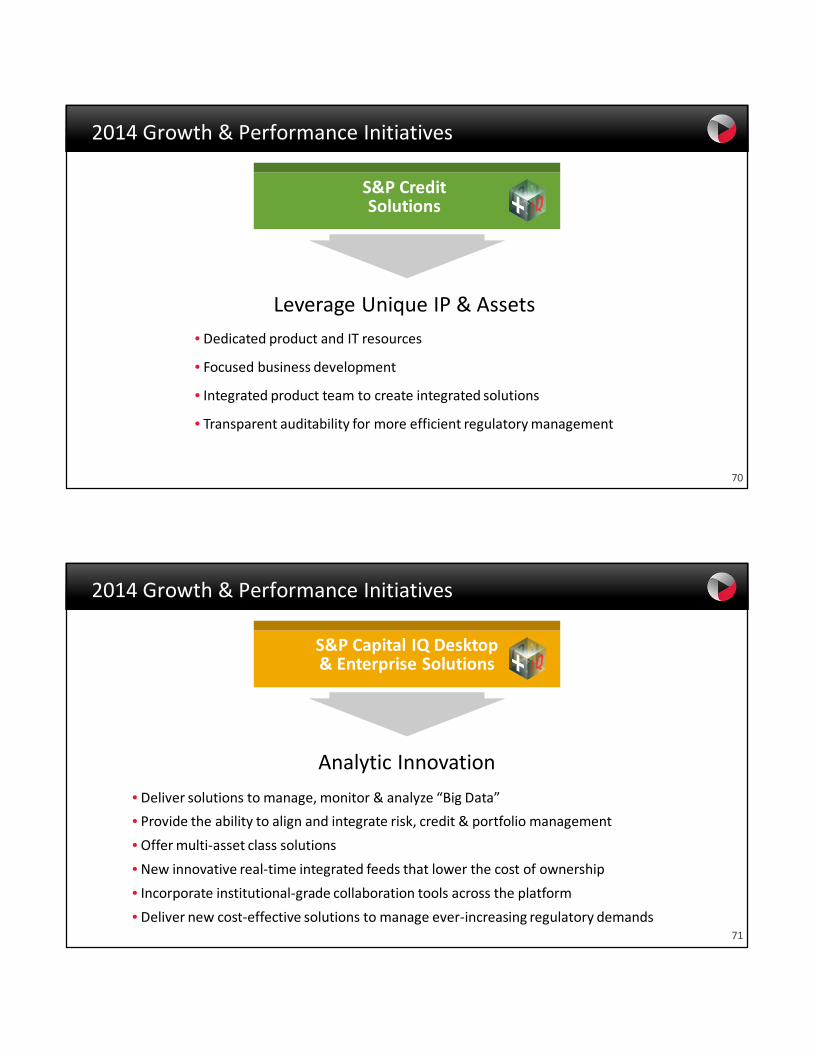
2014 Growth & Performance Initiatives
• Dedicated product and IT resources
• Focused business development
• Integrated product team to create integrated solutions
• Transparent auditability for more efficient regulatory management
S&P Credit Solutions
Leverage Unique IP & Assets
71
2014 Growth & Performance Initiatives
• Deliver solutions to manage, monitor & analyze “Big Data”
• Provide the ability to align and integrate risk, credit & portfolio management
• Offer multi‐asset class solutions
• New innovative real‐time integrated feeds that lower the cost of ownership
• Incorporate institutional‐grade collaboration tools across the platform
• Deliver new cost‐effective solutions to manage ever‐increasing regulatory demands
S&P Capital IQ Desktop& Enterprise Solutions
Analytic Innovation
72
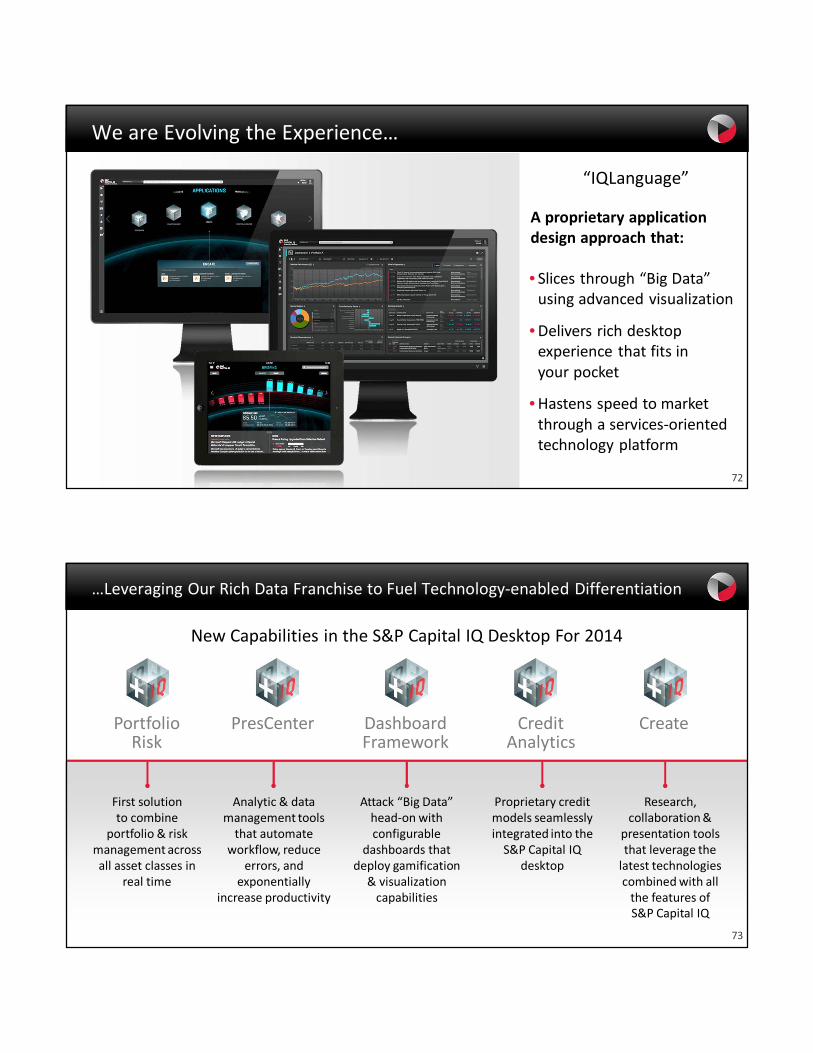
We are Evolving the Experience…
• Slices through “Big Data” using advanced visualization
•Delivers rich desktop experience that fits in your pocket
•Hastens speed to market through a services‐oriented technology platform
A proprietary application design approach that:
“IQLanguage”
73
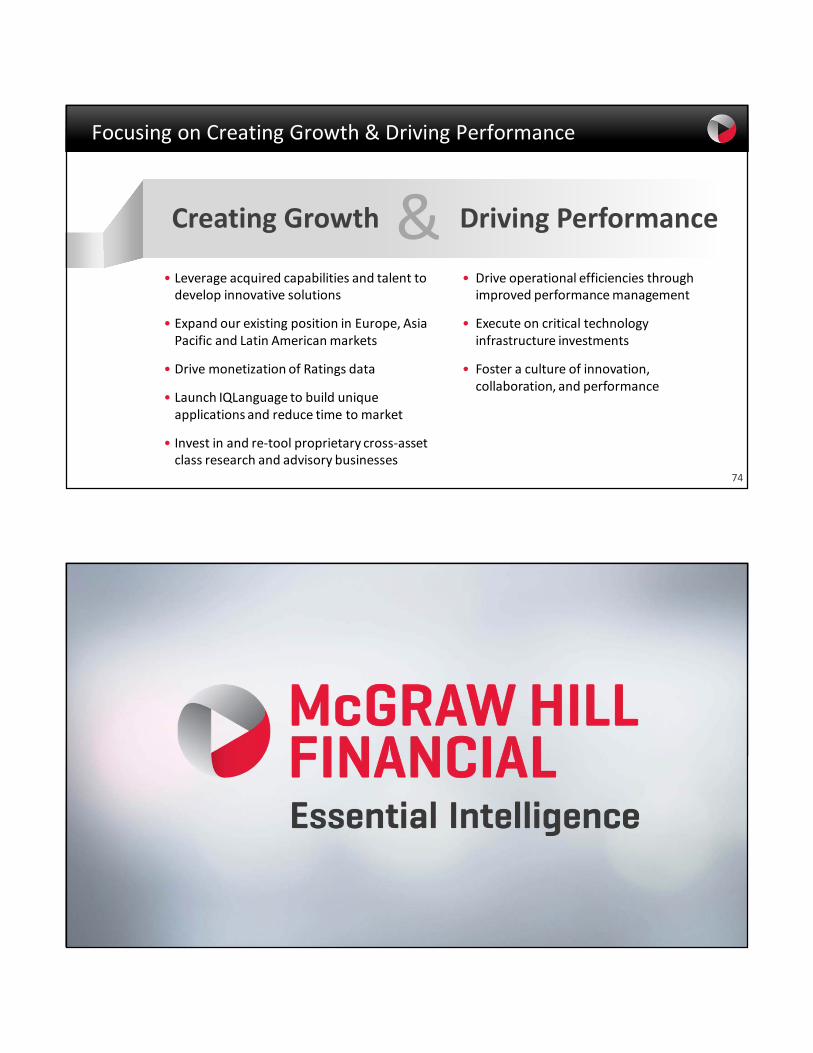
…Leveraging Our Rich Data Franchise to Fuel Technology‐enabled Differentiation
Research, collaboration &
presentation tools that leverage the latest technologies combined with all the features ofS&P Capital IQ
Proprietary credit models seamlessly integrated into the S&P Capital IQ
desktop
Attack “Big Data” head‐on with configurable
dashboards that deploy gamification
& visualization capabilities
Analytic & data management tools that automate
workflow, reduce errors, and
exponentially increase productivity
First solutionto combine
portfolio & risk management across all asset classes in
real time
CreateCredit Analytics
DashboardFramework
PresCenterPortfolio Risk
8
New Capabilities in the S&P Capital IQ Desktop For 2014
74
Focusing on Creating Growth & Driving Performance
Creating Growth & Driving Performance
• Leverage acquired capabilities and talent to develop innovative solutions
• Expand our existing position in Europe, Asia Pacific and Latin American markets
• Drive monetization of Ratings data
• Launch IQLanguage to build unique applications and reduce time to market
• Invest in and re‐tool proprietary cross‐asset class research and advisory businesses
• Drive operational efficiencies through improved performance management
• Execute on critical technology infrastructure investments
• Foster a culture of innovation, collaboration, and performance
75
Standard & Poor's Ratings Services
Neeraj SahaiPresident, Standard & Poor’s Ratings Services
77
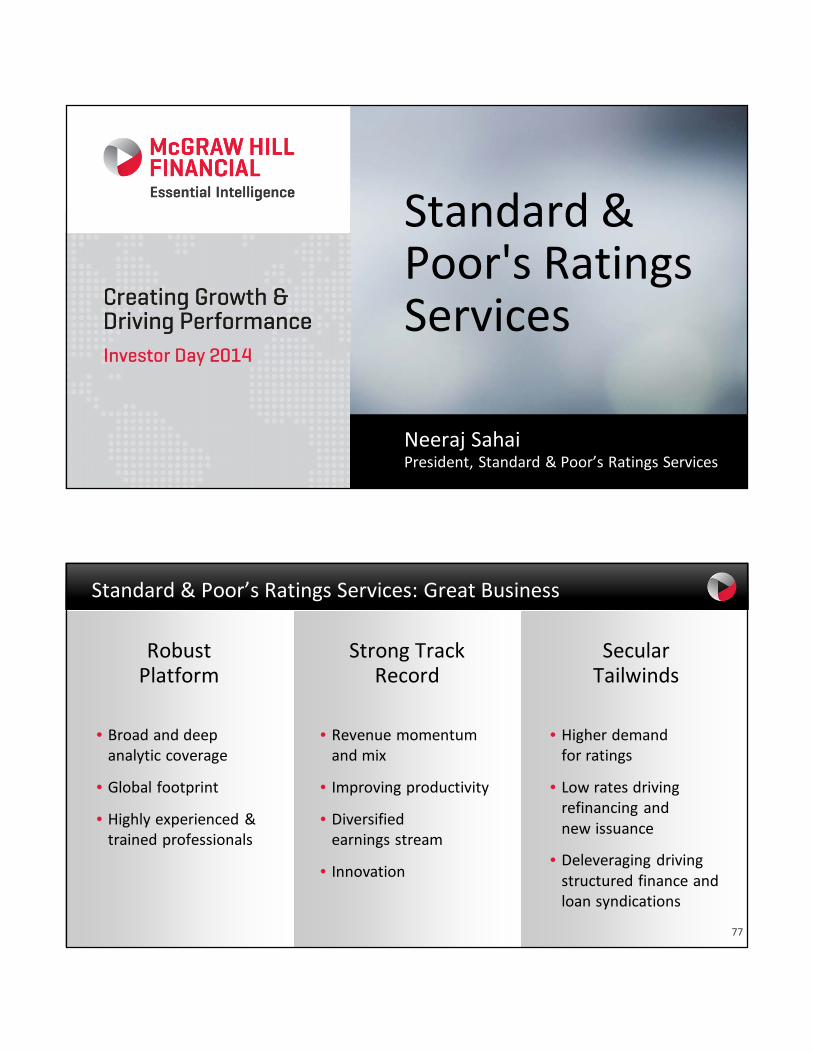
Strong Track Record
Robust Platform
Secular Tailwinds
Standard & Poor’s Ratings Services: Great Business
• Revenue momentum and mix
• Improving productivity
• Diversifiedearnings stream
• Innovation
• Higher demandfor ratings
• Low rates driving refinancing andnew issuance
• Deleveraging driving structured finance and loan syndications
77
• Broad and deep analytic coverage
• Global footprint
• Highly experienced & trained professionals
78
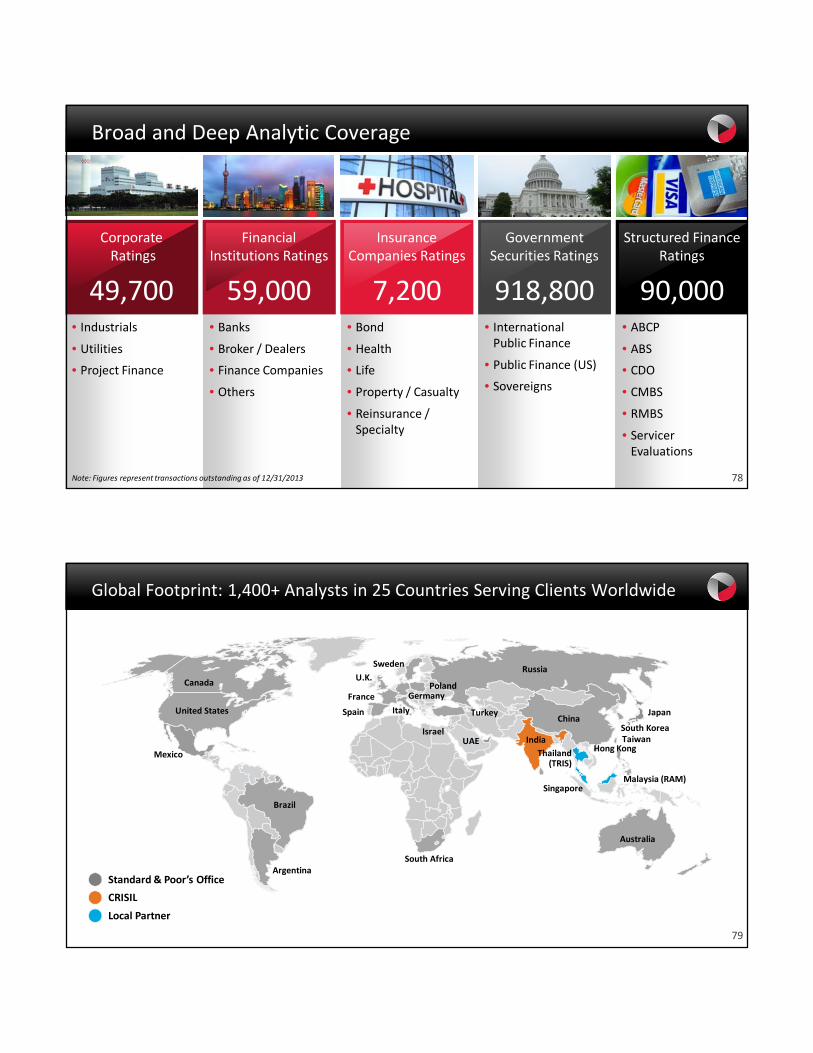
Broad and Deep Analytic Coverage
• Industrials
• Utilities
• Project Finance
• Banks
• Broker / Dealers
• Finance Companies
• Others
• Bond
• Health
• Life
• Property / Casualty
• Reinsurance / Specialty
• International Public Finance
• Public Finance (US)
• Sovereigns
• ABCP
• ABS
• CDO
• CMBS
• RMBS
• Servicer Evaluations
CorporateRatings
49,700
Financial Institutions Ratings
59,000
Insurance Companies Ratings
7,200
Government Securities Ratings
918,800
Structured Finance Ratings
90,000
Note: Figures represent transactions outstanding as of 12/31/2013
79
Global Footprint: 1,400+ Analysts in 25 Countries Serving Clients Worldwide
Brazil
Mexico
Canada
United States
Germany
Singapore
Taiwan
Japan
Local Partner
Standard & Poor’s Office
Thailand(TRIS)
CRISIL
Russia
ArgentinaSouth Africa
Poland
Italy
Israel
Spain
France
U.K.
Sweden
UAE
Turkey
Malaysia (RAM)
ChinaSouth Korea
Australia
IndiaHong Kong
80
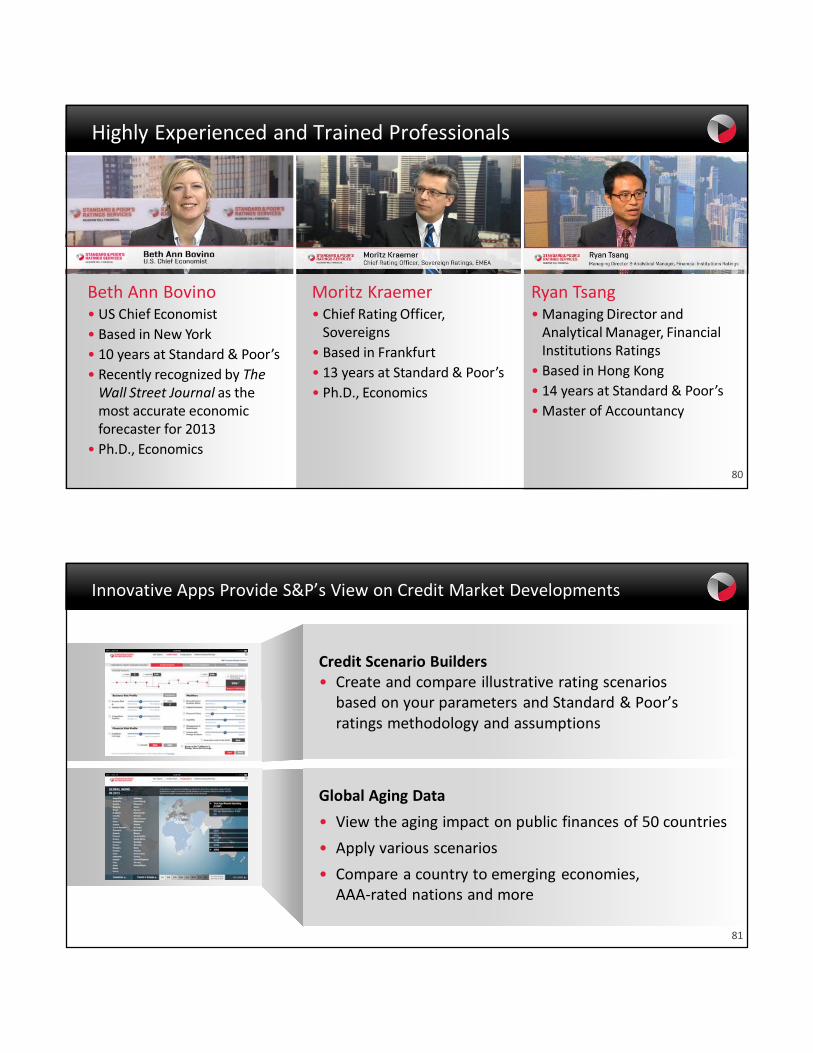
Highly Experienced and Trained Professionals
Ryan Tsang• Managing Director and Analytical Manager, Financial Institutions Ratings
• Based in Hong Kong
• 14 years at Standard & Poor’s
• Master of Accountancy
Moritz Kraemer• Chief Rating Officer, Sovereigns
• Based in Frankfurt
• 13 years at Standard & Poor’s
• Ph.D., Economics
Beth Ann Bovino• US Chief Economist
• Based in New York
• 10 years at Standard & Poor’s
• Recently recognized by The Wall Street Journal as the most accurate economic forecaster for 2013
• Ph.D., Economics
80
81
Credit Scenario Builders• Create and compare illustrative rating scenarios based on your parameters and Standard & Poor’s ratings methodology and assumptions
Global Aging Data
• View the aging impact on public finances of 50 countries
• Apply various scenarios
• Compare a country to emerging economies,AAA‐rated nations and more
Innovative Apps Provide S&P’s View on Credit Market Developments

82
Revenue Momentum
44%
43%
41%
2013
$2,274M
$2,034M
20122011
$1,767M
Adjusted Operating Profit Margin
CRISIL, Other*
Structured Finance
Governments
Financial Institutions
Corporates
*Other includes intersegment royalty, TRC, and adjustments
+13%CAGR
Historical Performance
83
Revenue Mix
50%
2008
$1,583M
9%
27%
12%
20%
31%
2007
$2,138M
6%
44%
2013
$2,274M
11%
14%
9%
16%9%
15%
27%
Revenue 2007‐2013
CRISIL, Other*Structured FinanceGovernmentsFinancial InstitutionsCorporates
*Other includes intersegment royalty, TRC, and adjustments
Note: Details may not sum due to rounding

84
2011 2012 2013
Operating Profit Margin1(adjusted) 42.2% 43.5% 44.9%
Revenue per Employee1($K) $520.0 $607.5 $674.6
Adjusted Operating Profit per Employee1($K) $219.3 $264.2 $303.2
Improving Productivity
(1) Excludes CRISIL
85
Diversified Earnings Stream
Structured Finance
Governments
Financial Institutions
Corporates
2013
$5,506B
15%
24%
27%
34%
2008
$4,599B
20%
22%
36%
22%
2007
$6,863B
41%
14%
28%
16%
51%70% 54%
49%30% 46%
$2,138M
Non‐Transaction
Transaction
2013
$2,274M
2008
$1,583M
2007
40% 49% 47%
60% 51% 53%
2007
$2,138M
Non‐US
US
2013
$2,274M
2008
$1,583M
Geographic Diversification
Issuance Mix Fee Type Diversification
Note: Details may not sum due to rounding

86
Higher Demand for Ratings
• From 2011 to 2014, investors reported using ratings almost twice as much as they had previously for:
– Fundamental analysis of securities
– Initial screening tool
– Compliance with capital adequacy requirements
– Selection of asset allocation
• S&P’s investor survey indicated a strong user preference for our ratings and research
Note: Greenwich Associates conducted nearly 900 interviews of investors beginning late 2013 and continuing into 2014
87
Low Rates Driving Refinancing and New Issuance
2013
598
2012
450
2008
201
Americas
Asia Pacific
Europe
0.5%
1.0%
1.5%
2.0%
2.5%
3.0%
3.5%
4.0%
100 bps
50 bps
0 bps
2014201220102008
250 bps
200 bps
150 bps
Credit Default Swaps (right)
10‐Year Treasury Note (left)
Source: Standard & Poor’s, Federal Reserve Bank*Excludes financial institutions
US Investment Grade CDS Spreads & 10 Year Treasury Notes
New Corporate* Issuers
+24%CAGR
2018
$386B
$500B
2017
$305B
$477B
2016
$202B
$522B
2015
$136B
$458B
2014
$122B
$376B
Speculative Grade
Investment Grade
Maturing USCorporate Debt
+33%CAGR
+7%CAGR
88
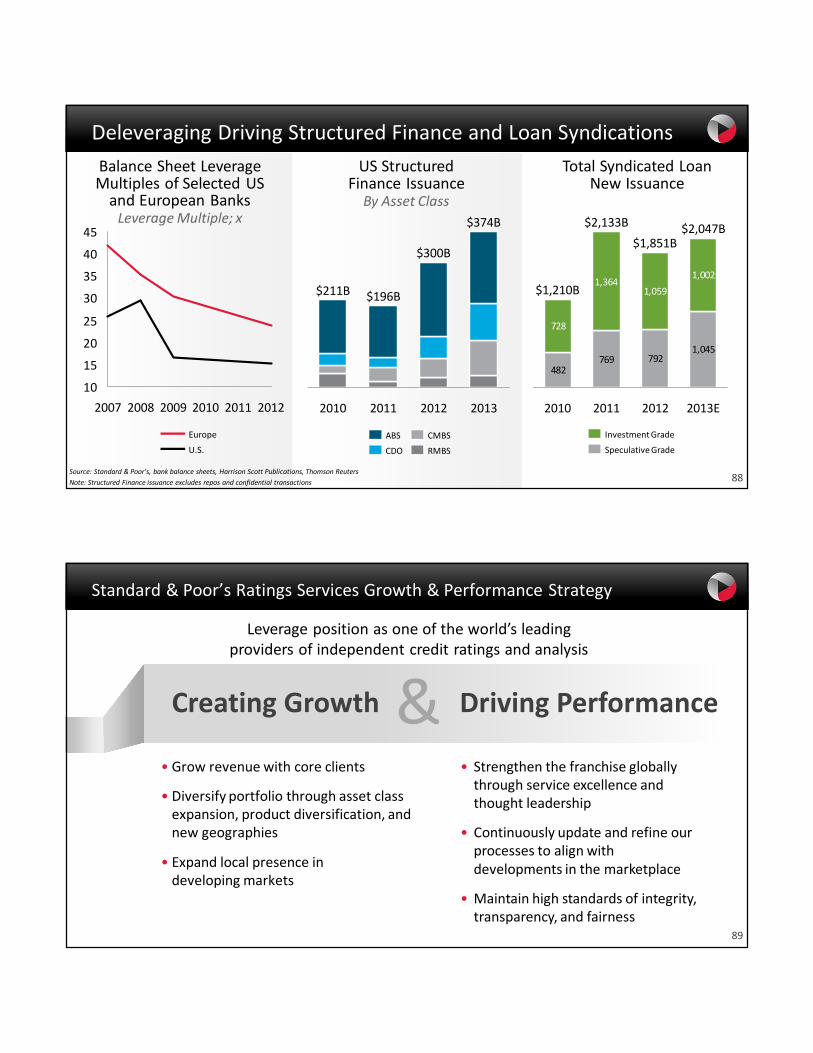
Deleveraging Driving Structured Finance and Loan Syndications
10
15
20
25
30
35
40
45
201220112010200920082007
U.S.
Europe
2013
$374B
2012
$300B
2011
$196B
2010
$211B
RMBS
CMBS
CDO
ABS
Source: Standard & Poor’s, bank balance sheets, Harrison Scott Publications, Thomson Reuters
Note: Structured Finance issuance excludes repos and confidential transactions
482769 792
1,045
728
1,3641,059
1,002
2012
$1,851B
2011
$2,133B
2010
$1,210B
2013E
$2,047B
Speculative Grade
Investment Grade
Balance Sheet Leverage Multiples of Selected US and European BanksLeverage Multiple; x
US Structured Finance IssuanceBy Asset Class
Total Syndicated Loan New Issuance
89
Standard & Poor’s Ratings Services Growth & Performance Strategy
Leverage position as one of the world’s leading providers of independent credit ratings and analysis
Creating Growth & Driving Performance
• Strengthen the franchise globally through service excellence and thought leadership
• Continuously update and refine our processes to align with developments in the marketplace
• Maintain high standards of integrity, transparency, and fairness
• Grow revenue with core clients
• Diversify portfolio through asset class expansion, product diversification, and new geographies
• Expand local presence indeveloping markets
CRISIL
Roopa KudvaManaging Director & Chief Executive Officer, CRISIL
91
CRISIL: Who We Are
•India’s largest credit rating agency with deep market penetration:from small enterprises to India’s largest corporations
•India’s largest independent research house: providing analyses and benchmarks on economy, capital markets, industries and companies
•The largest provider of high‐end research and analytical offshore supportto global banks
•A high growth, high margin company
–Revenue growth of 32% CAGR since MHFI acquired a majority stake in 2005
–Operating margins approaching 30%
92
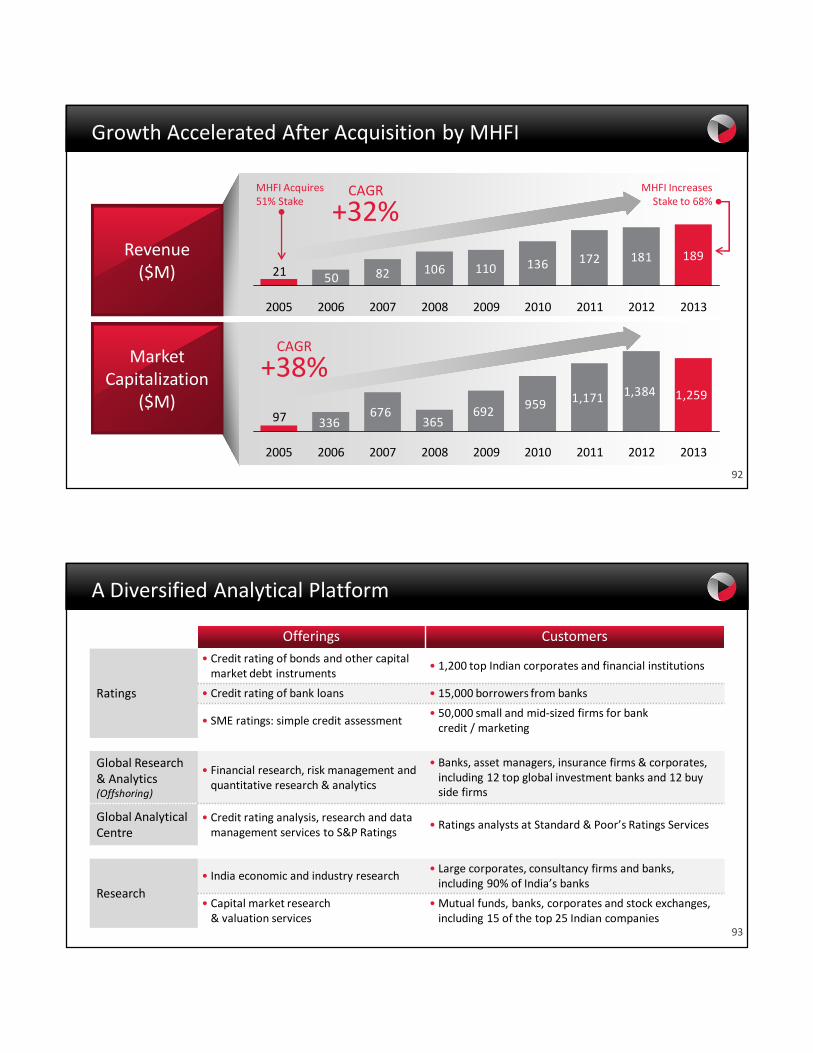
Growth Accelerated After Acquisition by MHFI
Revenue ($M)
Market Capitalization
($M)
MHFI Acquires 51% Stake
MHFI Increases Stake to 68%
CAGR
+32%
CAGR
+38%
82 106 110 136 172 181 189
5021
201320122011201020092008200720062005
959 1,171 1,384 1,259692
365676
33697
201320122011201020092008200720062005
93
A Diversified Analytical Platform
Offerings Customers
Ratings
• Credit rating of bonds and other capital market debt instruments
• 1,200 top Indian corporates and financial institutions
• Credit rating of bank loans • 15,000 borrowers from banks
• SME ratings: simple credit assessment • 50,000 small and mid‐sized firms for bankcredit / marketing
Global Research& Analytics (Offshoring)
• Financial research, risk management and quantitative research & analytics
• Banks, asset managers, insurance firms & corporates, including 12 top global investment banks and 12 buy side firms
Global Analytical Centre
• Credit rating analysis, research and data management services to S&P Ratings
• Ratings analysts at Standard & Poor’s Ratings Services
Research
• India economic and industry research• Large corporates, consultancy firms and banks, including 90% of India’s banks
• Capital market research& valuation services
• Mutual funds, banks, corporates and stock exchanges, including 15 of the top 25 Indian companies

94
Growing International Presence and Revenue
CRISIL Research Centers
CRISIL Office
CRISIL International Revenue: 2003 – 1% | 2011 – 56% | 2013 – 63%
CRISIL Global Presence & Revenue Mix
USA
UK
Poland
India
Argentina
Singapore
China
95
Strong Revenue Growth
$189M
$181M
$172M
2011 2012 2013
As Reported, Indian Rupee USD Equivalent
+16%CAGR
₹10,000M
₹11,500M
2011
₹8,500M
2012 2013
+5%CAGR
Historical Revenue Performance
96
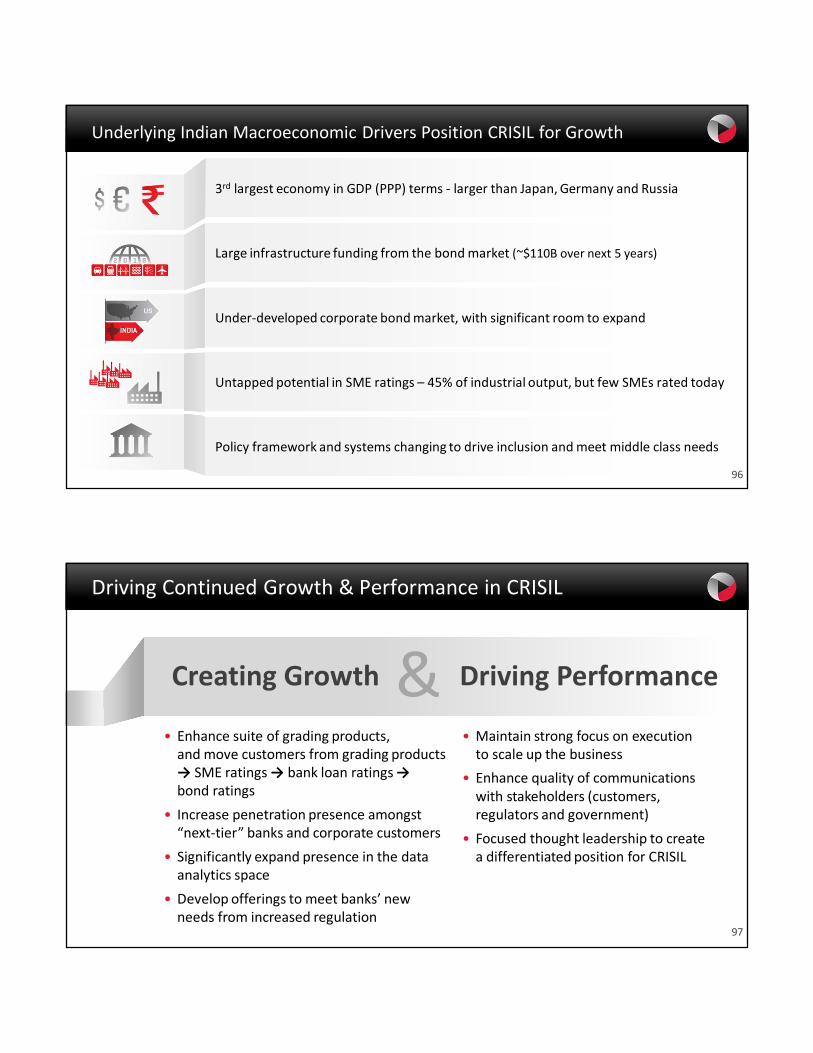
Underlying Indian Macroeconomic Drivers Position CRISIL for Growth
3rd largest economy in GDP (PPP) terms ‐ larger than Japan, Germany and Russia
Large infrastructure funding from the bond market (~$110B over next 5 years)
Under‐developed corporate bond market, with significant room to expand
Untapped potential in SME ratings – 45% of industrial output, but few SMEs rated today
Policy framework and systems changing to drive inclusion and meet middle class needs
97
Driving Continued Growth & Performance in CRISIL
Creating Growth & Driving Performance
• Enhance suite of grading products,and move customers from grading products → SME ratings → bank loan ratings →bond ratings
• Increase penetration presence amongst “next‐tier” banks and corporate customers
• Significantly expand presence in the data analytics space
• Develop offerings to meet banks’ new needs from increased regulation
• Maintain strong focus on execution to scale up the business
• Enhance quality of communications with stakeholders (customers, regulators and government)
• Focused thought leadership to create a differentiated position for CRISIL
98
Legal Update
Ken VittorExecutive Vice President and General Counsel

100
Significant Progress; We Believe Legal Risks are Manageable
The Majority of Lawsuits Generally Fall into Five Categories
1. Lawsuits by purchasers asserting “underwriter” claims under federal securities laws
• Nine dismissed on motions to dismiss: Courts ruled rating agencies are not “underwriters” or “sellers” of securities
• Seven voluntarily dropped
• None currently pending
2. “Stock Drop” lawsuits by purchasers of McGraw Hill stock
• All four dismissed on motions to dismiss
3. Lawsuits by purchasers of rated securities asserting state law claims
4. Lawsuits brought outside the US
5. Lawsuits by the DOJ and State Attorneys General
101
Latest Developments: Department of Justice
Overview
• On February 4, 2013, the DOJ filed a civil lawsuit against S&P alleging violations of federal law in connection with certain ratings issued by S&P in 2004‐07 and S&P’s representations about its independence and objectivity during that time
• S&P’s response: No factual or legal basis for lawsuit
• S&P’s ratings were issued in good faith and believed appropriate by rating committees
• S&P’s ratings were virtually identical to the ratings issued by other ratings agencies
• S&P’s forward‐looking opinions on housing market and economy were consistent with views of officials in US Government and Federal Reserve and based on the same data
• The alleged “victims” in this case are the very entities responsible for creating and selling the securities that S&P rated
Status
• S&P filed a motion to dismiss the Complaint on April 22, 2013; denied on July 16, 2013
• S&P asserts 19 defenses in its Answer to the Complaint
• Pre‐trial discovery in the case is ongoing
• On January 20, 2014, S&P filed a motion to compel. A hearing on the motion and other discovery‐related issues was held on March 11, 2014
102
Latest Developments: State Attorneys General
Overview
• 19 States and the District of Columbia have filed lawsuits against McGraw Hill and S&P; of these, 17 cases have been consolidated in a federal multi‐district litigation before Judge Furman in New York
• These cases are being brought under each State’s consumer protection law and focus on S&P’s statements regarding the independence and objectivity of its ratings practices
Multi‐District Litigation
• The States’ consolidated motion to remand was filed on August 2, 2013. The motion is fully briefed and was argued on October 4, 2013. A decision remains pending
• If S&P prevails on the remand motion, the cases will remain before Judge Furman for pre‐trial purposes
• If Judge Furman grants the States’ motion to remand the cases to state court, the cases would be sent back to the individual state courts
• S&P will move to dismiss after the remand motion is decided; we have strong legal arguments, including lack of jurisdiction
103
Consistent Record of Dismissals
Noteworthy Litigation Record
• 36 cases have been dismissed in their entirety on motions to dismiss
• All dismissals appealed to higher courts—13 in total—have been affirmed
• 11 cases have been withdrawn
Court Rulings Confirm it is Difficult to Challenge Ratings Made in Good Faith
• Ratings are forward‐looking opinions, not statements of fact
• Ratings are not actionable unless the rating agency did not believe its ratings were appropriate when issued
These figures do not reflect US actions brought by federal or state authorities.
201320122011201020092008
Total Cases Closed
Total Cases Filed
Civil Actions Filed and Closed Against McGraw Hill / S&P by Private Plaintiffs
Financial Performance& Outlook
Jack CallahanExecutive Vice President and Chief Financial Officer
105
Recap: Growth & Performance Goals for 2014‐2016
Creating Growth & Driving Performance
• Setting annual growth goals:– Mid to high single‐digit revenue growth– Sustained margin expansion– Mid teens EPS growth– ~$1B per year free cash flow
• Maintaining disciplined capital allocation:– Continue to pursue attractive acquisitions – Sustain dividend growth and share repurchases
• Shifting from a holding company to an active management model
• Completing portfolio rationalization with evaluation of strategic alternatives for McGraw Hill Construction
• Targeting at least $100 million in productivity savings

106
• Provides essential data, news, insights, and intelligence to better inform North American construction professionals’ decisions
– ~$170M in annual revenue
– stand‐alone operating margins of ~20%
• Shifting mix from print to data & analytics
• Completes MHFI portfolio rationalization
Evaluating Strategic Alternatives for McGraw Hill Construction
74%58%
26%42%
Data/Analytics
Media/Print
20132008
107
Continue Strong Revenue Growth
MHFI Revenue
2013
$4,875M
2012
$4,450M
2011
$3,954M
2011‐2013 CAGR by Business
2014 Guidance: Mid Single‐Digit 2014‐2016 Goal: Mid to High Single‐Digit
‐5%
5%
7%
13%
15%
24%
McGraw HillConstruction
JD Power
S&P DowJones Indices
S&P Capital IQ
Standard & Poor’sRatings Services
Platts
107
(9% Organic)+11%CAGR
8%Organic
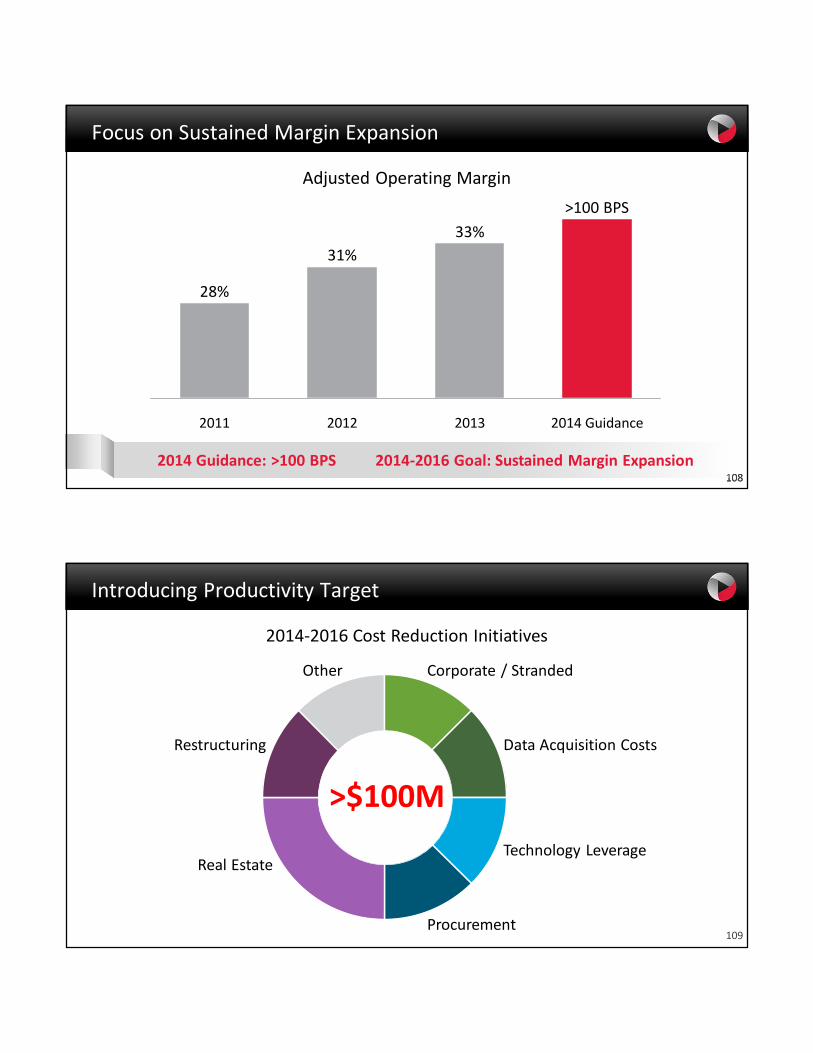
108
2013
33%
2012
31%
2011
28%
2014 Guidance
>100 BPS
Focus on Sustained Margin Expansion
Adjusted Operating Margin
2014 Guidance: >100 BPS 2014‐2016 Goal: Sustained Margin Expansion108
109
Real Estate
Procurement
Restructuring
Other
Technology Leverage
Data Acquisition Costs
Corporate / Stranded
Introducing Productivity Target
2014‐2016 Cost Reduction Initiatives
>$100M

110
Initiatives
~5%
CorporateCenter
~45%
Shared Costs
~35%
Excess Real Estate
~15%
~$173M
2013
$203M
~$30M
2011
$173M*
Adjusted Unallocated Expense Adjusted Unallocated Breakdown
Example: Reducing Unallocated Expense
* As originally reported
Stranded Costs
2013
111
Maintain Double‐Digit EPS Growth
2014 Guidance
$3.75‐$3.85
2013
$3.33
2012
$2.75
2011
$2.09
Annual Adjusted Diluted EPS
+26%CAGR
2014 Guidance: +13% to 16% 2014‐2016 Goal: Mid Teens Growth111
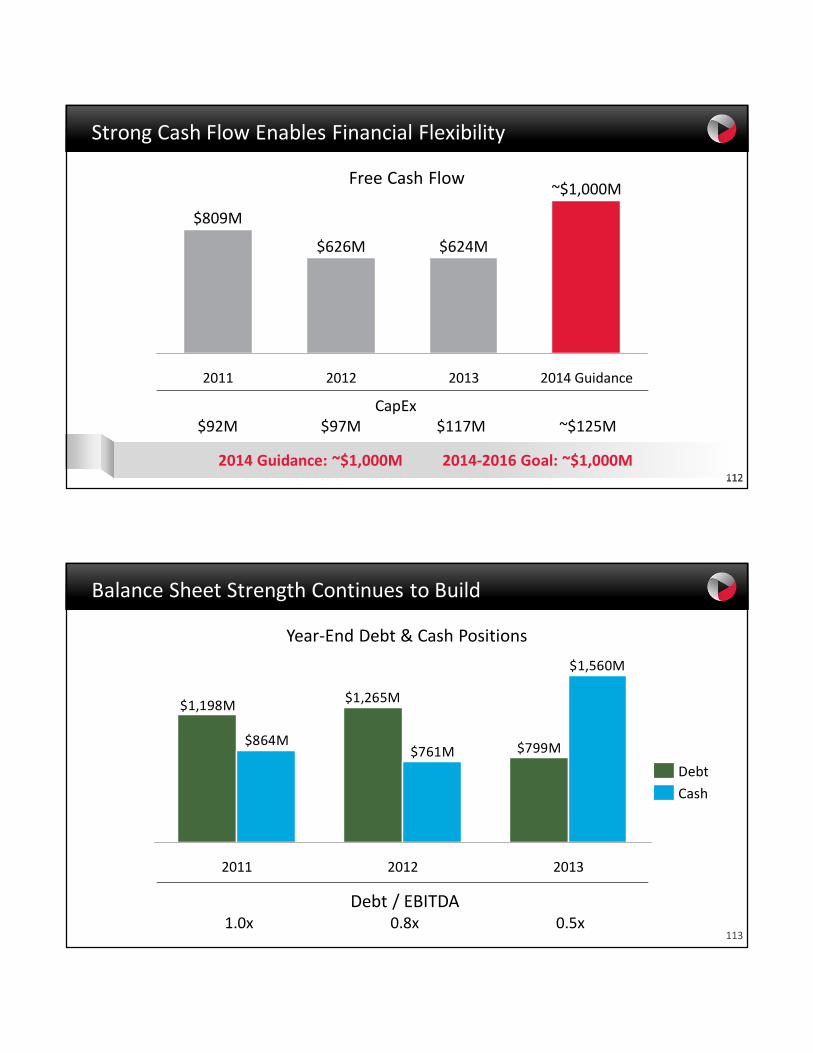
112
2014 Guidance
~$1,000M
2013
$624M
2012
$626M
2011
$809M
CapEx$92M $97M $117M ~$125M
Strong Cash Flow Enables Financial Flexibility
Free Cash Flow
2014 Guidance: ~$1,000M 2014‐2016 Goal: ~$1,000M112
113
Cash
Debt
$799M
$1,265M$1,198M
$1,560M
$761M$864M
20122011 2013
Debt / EBITDA1.0x 0.8x 0.5x
Year‐End Debt & Cash Positions
Balance Sheet Strength Continues to Build
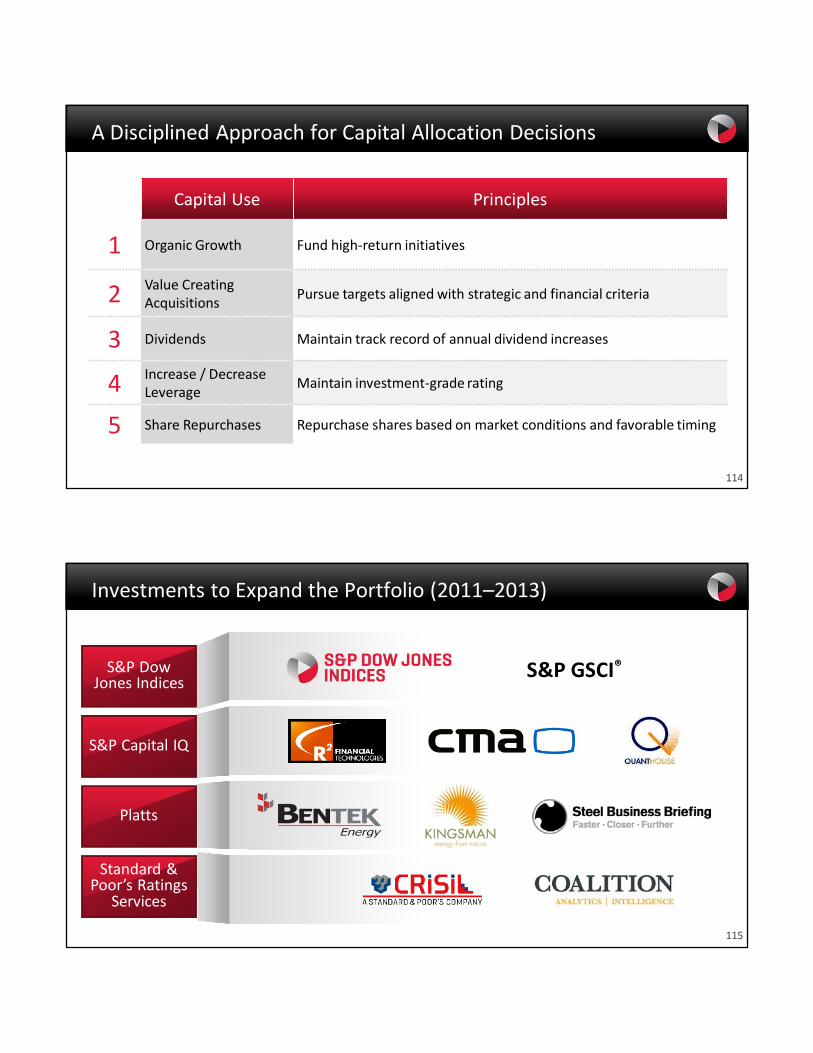
114
A Disciplined Approach for Capital Allocation Decisions
Capital Use Principles
1 Organic Growth Fund high‐return initiatives
2 Value CreatingAcquisitions
Pursue targets aligned with strategic and financial criteria
3 Dividends Maintain track record of annual dividend increases
4 Increase / Decrease Leverage
Maintain investment‐grade rating
5 Share Repurchases Repurchase shares based on market conditions and favorable timing
115
Investments to Expand the Portfolio (2011–2013)
S&P Dow Jones Indices
S&P Capital IQ
Platts
Standard & Poor’s Ratings
Services
S&P GSCI®
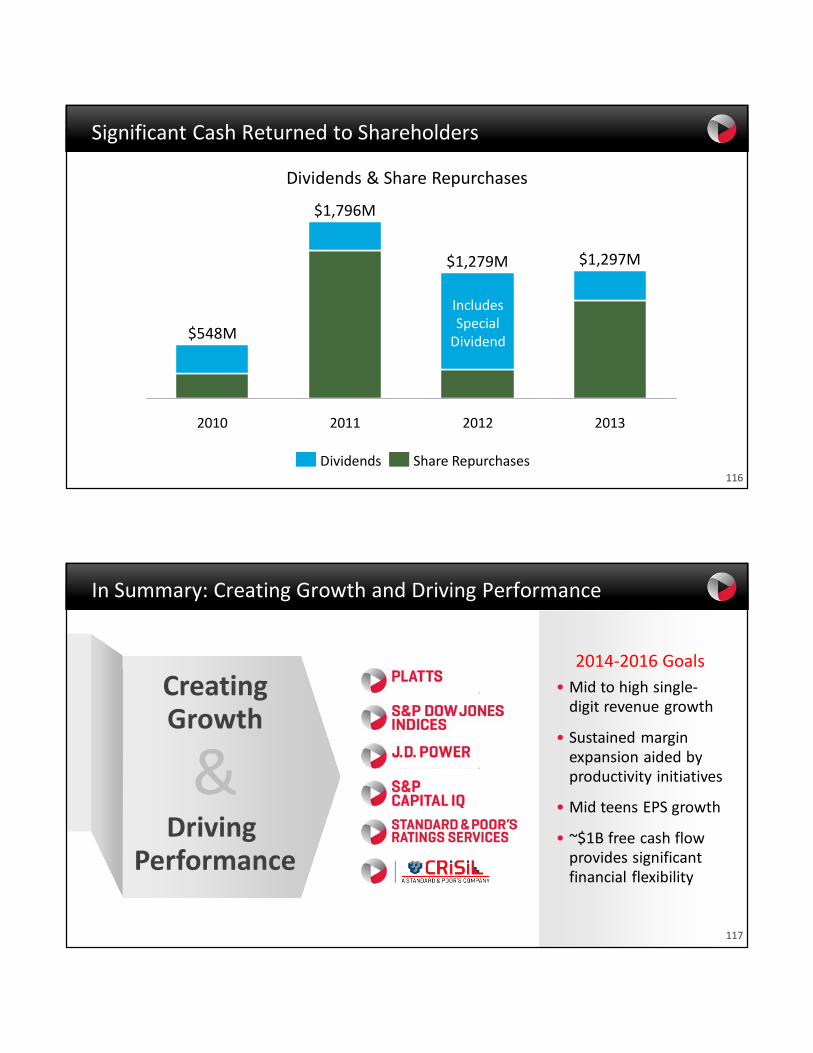
116
2013
$1,297M
2012
$1,279M
2011
$1,796M
2010
$548M
Share RepurchasesDividends
Dividends & Share Repurchases
Includes Special Dividend
Significant Cash Returned to Shareholders
117
In Summary: Creating Growth and Driving Performance
2014‐2016 Goals
• Mid to high single‐digit revenue growth
• Sustained margin expansion aided by productivity initiatives
• Mid teens EPS growth
• ~$1B free cash flow provides significant financial flexibility
&
CreatingGrowth
Driving Performance
118
Replay Options
Video Webcast: Replay available for one yearGo to http://investor.mhfi.com
Telephone: Replay available through April 18, 2014Domestic: (800) 945‐2458International: (203) 369‐3946No password required