michael hill international limited half year report to 31
TRANSCRIPT
HALF YEAR REPORT TO 31 DECEMBER 2015

Company Profile p2
Highlights of the Half Year p3
Key Facts p4
Financial Calendar p4
Directors’ Report p5
Auditors’ Report p8
Statement of Comprehensive Income p9
Statement of Financial Position p10
Statement of Changes in Equity p11
Statement of Cash Flows p12
Notes to the Financial Statements p13
Corporate Directory p20
CONTENTS

THE MICHAEL HILL DESIGNER BRIDAL COLLECTION: ‘YOUR SYMPHONY OF LIGHT’
I grew up with jewellery, but my first love was always music. In an orchestra all the instruments fit together perfectly, the melody, the underlying strength, the softest grace notes - and your heart soars, and it’s the most beautiful thing you’ve ever experienced.
That’s what I wanted to do with diamonds, to make your heart soar every time you see your ring.
This is my personal collection. Your symphony of light.
1
2
Our overall strategic goal is to grow shareholder wealth over time through our philosophy of controlled profitable growth.
Michael Hill International Limited owns the brands “Michael Hill” and “Emma & Roe” and operates a retail jewellery chain of 293 Michael Hill stores and 11 Emma & Roe stores in Australia, New Zealand, Canada and the United States as at 31 December 2015.
The Company story began in 1979 when Sir Michael and his wife Christine opened their first store in the New Zealand
Company Profiletown of Whangarei, some 160 kilometres north of Auckland. Since then, our growth has been guided by our unique retail jewellery formula. Through dramatically different store designs, a product range devoted exclusively to jewellery and development of high impact advertising, the Company rose to national prominence. In 1987 the Company was listed on the New Zealand Stock Exchange, the same year the Group expanded into Australia.
In 2002, the Group expanded into North America, opening its first stores in Vancouver, Canada. The Canadian presence now includes stores in British Columbia, Alberta, Manitoba, Saskatchewan and Ontario.
In September 2008, the Group entered the United States market and now has 10 stores in Illinois, Ohio, Minnesota and New York.
2014 saw the opening of the first Emma & Roe boutique, following a successful trial during the preceding 18 months in five South East Queensland outlets under the trading name “Captured Moments”. Emma & Roe carries unique jewellery collections catering to the way women like to customise and
accessorise their look. The two brands are viewed as being complementary within the jewellery sector with the Michael Hill brand continuing to focus on diamonds, bridal and fine jewellery. The name Emma & Roe takes its inspiration from the Hill family; “Emma”, Sir Michael’s daughter, and “Roe”, Christine Lady Hill’s maiden name.
As at 31 December 2015, the Group has 52 Michael Hill stores in New Zealand, 166 in Australia, 65 in Canada, and 10 stores in the USA. In addition there are 10 Emma & Roe stores in Australia and one in New Zealand. Around the world, the Group employs around 2,450 permanent employees across retail sales, manufacturing and administration roles.

3
- Operating revenue of $310.8m, up 9.7% on same period last year
- EBIT of $35.2m, up 0.8% on same period last year. Excluding FX gains and losses, the improvement in EBIT was 10.6%
- Same store sales across the Group of $291.8m, up 5.4% on same period last year
- Canadian retail segment EBIT of CA$7.4m, an increase of 46.7%
- Net profit after tax of $24.9m, up from $23.7m last year
- Earnings per share AU 6.5 cents per share
- Interim dividend of NZ 2.5 cents per share
- Net debt of $26.3m, down from $33.8m at 31 December 2014
- Equity ratio improved to 52.6% from 53.5% at 30 June 2015
- Six new Michael Hill stores opened and one closed during the period giving a total of 293 stores at the half year
- Three new E&R stores opened during the period giving 11 stores at the half year and same store sales increased by 49.4%
Highlights of the Half Year
4
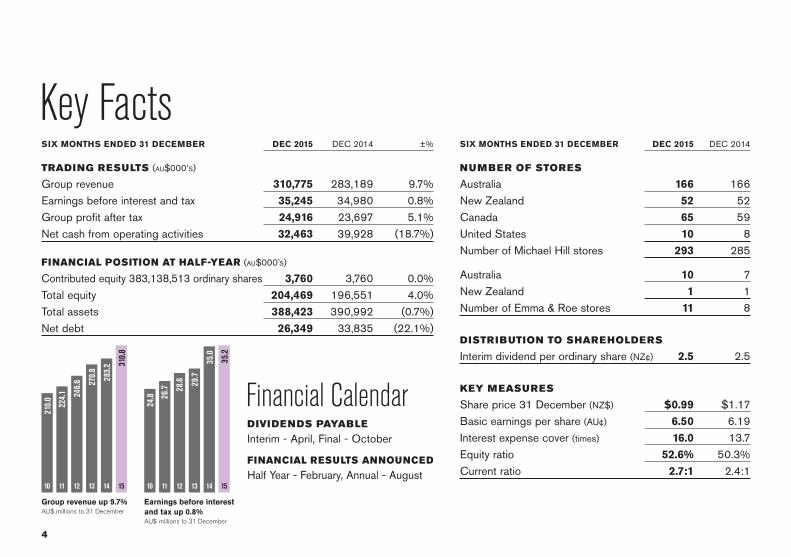
Earnings before interestand tax up 0.8%AU$ millions to 31 December
1510 11 12 13 14
28.6
35.2
24.8 26.7
35.0
29.7
210.0
224.1 246.6 28
3.2
270.8
Group revenue up 9.7%AU$ millions to 31 December
1510 11 12 13 14
310.8
SIX MONTHS ENDED 31 DECEMBER DEC 2015 DEC 2014 ±%
TRADING RESULTS (AU$000’s)
Group revenue 310,775 283,189 9.7%
Earnings before interest and tax 35,245 34,980 0.8%
Group profit after tax 24,916 23,697 5.1%
Net cash from operating activities 32,463 39,928 (18.7%)
FINANCIAL POSITION AT HALF-YEAR (AU$000’s)
Contributed equity 383,138,513 ordinary shares 3,760 3,760 0.0%
Total equity 204,469 196,551 4.0%
Total assets 388,423 390,992 (0.7%)
Net debt 26,349 33,835 (22.1%)
SIX MONTHS ENDED 31 DECEMBER DEC 2015 DEC 2014
NUMBER OF STORES
Australia 166 166
New Zealand 52 52
Canada 65 59
United States 10 8
Number of Michael Hill stores 293 285
Australia 10 7
New Zealand 1 1
Number of Emma & Roe stores 11 8
DISTRIBUTION TO SHAREHOLDERS
Interim dividend per ordinary share (NZ¢) 2.5 2.5
KEY MEASURES
Share price 31 December (NZ$) $0.99 $1.17
Basic earnings per share (AU¢) 6.50 6.19
Interest expense cover (times) 16.0 13.7
Equity ratio 52.6% 50.3%
Current ratio 2.7:1 2.4:1
Key Facts
Financial CalendarDIVIDENDS PAYABLE
Interim - April, Final - October
FINANCIAL RESULTS ANNOUNCED
Half Year - February, Annual - August
5
Australian retail segmentSIX MONTHS ENDED 31 DEC (AU $000) DEC 2015 DEC 2014 ±%
Revenue $175.6m $168.5m 4.2%
Operating profit $32.4m $31.5m 2.9%
Operating profit % of revenue 18.5% 18.7%
Same store sales 3.4% (1.9%)
Number of stores 166 166
The Australian segment produced a pleasing result for the half year on the back of solid same store sales growth.
New Zealand retail segmentSIX MONTHS ENDED 31 DEC (NZ $000) DEC 2015 DEC 2014 ±%
Revenue $67.5m $63.2m 6.7%
Operating profit $15.3m $13.9m 10.3%
Operating profit % of revenue 22.7% 22.0%
Same store sales 6.7% 4.2%
Number of stores 52 52
Sales and EBIT lifts in this important segment are a credit to the stable and experienced leadership team. The continued strength of the vibrant Auckland economy has helped fuel growth in and around this important market.
Canadian retail segmentSIX MONTHS ENDED 31 DEC (CA $000) DEC 2015 DEC 2014 ±%
Revenue $53.3m $44.9m 18.8%
Operating profit $7.4m $5.1m 46.7%
Operating profit % of revenue 13.9% 11.3%
Same store sales 5.6% 4.3%
Number of stores 65 59
The Canadian segment continues to grow and improve as it reaches critical mass in the larger provinces in Canada. The strong growth in operating profit is especially pleasing, lifting percentage of revenue to 13.9% (11.3% last year).
United States retail segmentSIX MONTHS ENDED 31 DEC (US $000) DEC 2015 DEC 2014 ±%
Revenue $7.4m $5.9m 24.7%
Operating profit / (loss) ($1.5m) ($0.6m) (146.1%)
Same store sales 0.6% 9.1%
Number of stores 10 8
Revenue and the bottom line were affected by an increased marketing spend, the temporary closure of Woodfield Mall in Chicago for three months, and by the costs associated with opening a new store at Roosevelt Fields in New York. We remain confident of further improving our US model over the coming half year and are committed to continuing testing of our model in this lucrative market.
Directors’ ReportMichael Hill International Limited (NZX:MHI) today announced an after tax profit of $24.9m for the six months ended 31 December 2015, an increase of 5.1% on last year.

6
Directors’ Report cont.Emma & Roe The Emma & Roe brand was launched in April 2014 and currently has ten stores in Australia and one store in New Zealand. As this brand is still in test mode, the Company is not disclosing their financial results as a separate segment, and therefore their results and associated assets and liabilities are treated as “unallocated” in the half year segment note. The Company can however confirm that same store sales for the half increased by 49.4%.
Three stores were opened in Australia during the period giving a total of eleven stores operating at 31 December 2015.
It is anticipated the trial of the Emma & Roe brand will continue for the balance of the financial year and then a decision made whether to proceed with a full expansion program.
Professional Care PlansRevenue collected from Professional Care Plans was $21.7m, up 8.9% on same period last year. Deferred revenues held on balance sheet at the half were $70.3m versus $61.3m at the same time last year. This service continues to offer the business a strategic point of difference to our major competitors, and traction in selling the plans continues to grow albeit at a slower rate than previous years.
Cash Flows & Balance SheetThe Group has reported a net operating cash inflow of $32.5m for the six months, compared to a net operating cash inflow of $39.9m for the previous period.
The Group’s balance sheet continues to be sound with an equity ratio of 52.6% as at 31 December 2015 (50.3% at 2014).
Dividend The Directors have announced an interim dividend of NZ 2.5¢ per share (2014 - NZ 2.5¢), with no imputation credits attached for New Zealand shareholders and no franking credits for Australian shareholders. The dividend will be paid on Friday, 1 April 2016 with the record date being Wednesday, 23 March 2016.
7
Outstanding Tax MatterDiscussions continue with the Inland Revenue Department within their dispute process framework. With the passage of time, the Board considers it is increasingly likely that the
matter will require formal resolution through the courts, but it remains unclear when this might occur. The Board remains of the opinion that this tax matter does not require a provision in the Group’s financial statements under existing accounting standards, nevertheless a tax pooling arrangement has been entered into which would mitigate some of the risks of an adverse outcome.
OutlookThe Australian, New Zealand and Canadian segments performed well during the period and are expected to continue to show strength through the second half. Further progress is expected to be achieved in the US and the Group will continue to test the Emma & Roe brand.
The Board thanks Mike Parsell, his executive team and everyone within the Michael Hill Group for their efforts over the first half of the year and the delivery of a pleasing result.
Emma Hill, Chair11/02/2016

We have reviewed the interim financial statements on pages 9 to 19, which comprise the statement of financial position as at 31 December 2015, and the statement of comprehensive income, statement of changes in equity and statement of cash flows for the six month period ended on that date, and a summary of significant accounting policies and other explanatory information.
This report is made solely to the company’s shareholders, as a body. Our review has been undertaken so that we might state to the company’s shareholders those matters we are required to state to them in a review report and for no other purpose. To the fullest extent permitted by law, we do not accept or assume responsibil-ity to anyone other than the company and the company’s shareholders as a body, for our review work, for this report, or for our findings.
Directors’ ResponsibilitiesThe Directors are responsible for the preparation and fair presentation of interim financial statements which comply with New Zealand Equivalent to International Accounting Standard 34: Interim Financial Reporting and for such internal control as the Directors determine is necessary to enable the preparation and fair presentation of the interim financial statements
Review Report to the Shareholders of Michael Hill International Limited (the Company) and its subsidiaries together (the Group)
that are free from material misstatement, whether due to fraud or error.
Reviewer’s ResponsibilitiesOur responsibility is to express a conclusion on the interim financial statements based on our review. We conducted our review in accordance with NZ SRE 2410 Review of Financial Statements Performed by the Independent Auditor of the Entity. NZ SRE 2410 requires us to conclude whether anything has come to our attention that causes us to believe that the financial statements, taken as a whole, are not prepared in all material respects, in accordance with New Zealand Equivalent to International Accounting Standard 34: Interim Financial Reporting. As the auditor of the Group, NZ SRE 2410 requires that we comply with the ethical requirements relevant to the audit of the annual financial statements.
Basis of StatementA review of interim financial statements in accordance with NZ SRE 2410 is a limited assurance engagement. The auditor performs procedures, primarily consisting of making enquiries, primarily of persons responsible for financial and accounting matters, and applying analytical and other review procedures.
The procedures performed in a review are substantially less than those performed in an audit conducted in accordance with International Standards on Auditing (New Zealand). Accordingly we do not express an audit opinion on those financial statements.
Other than in our capacity as auditor we have no relationship with, or interests in, the Group.
ConclusionBased on our review nothing has come to our attention that causes us to believe that the accompanying interim financial statements, set out on pages 9 to 19, do not present fairly, in all material respects, the financial position of the Group as at 31 December 2015 and its financial performance and cash flows for the six month period ended on that date in accordance with New Zealand Equivalent to International Accounting Standard 34: Interim Financial Reporting.
Our review was completed on 11 February 2016 and our findings are expressed as at that date.
Ernst & YoungBrisbane
111 Eagle StreetBrisbane QLD 4000 AustraliaGPO Box 7878 Brisbane QLD 4001
Tel +61 7 3011 3333Fax +61 7 3011 3100ey.com/au
8
9
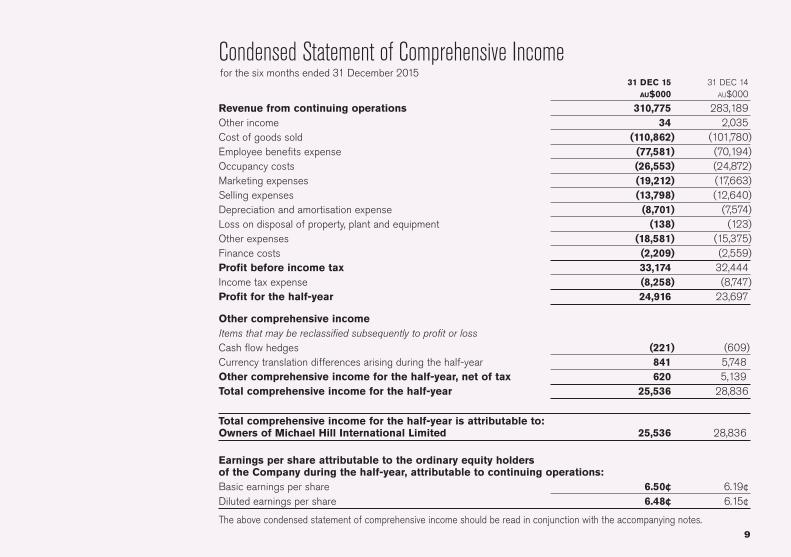
Condensed Statement of Comprehensive Incomefor the six months ended 31 December 2015 31 DEC 15 31 DEC 14 AU$000 AU$000
Revenue from continuing operations 310,775 283,189Other income 34 2,035Cost of goods sold (110,862) (101,780)Employee benefits expense (77,581) (70,194)Occupancy costs (26,553) (24,872)Marketing expenses (19,212) (17,663)Selling expenses (13,798) (12,640)Depreciation and amortisation expense (8,701) (7,574)Loss on disposal of property, plant and equipment (138) (123)Other expenses (18,581) (15,375)Finance costs (2,209) (2,559)Profit before income tax 33,174 32,444Income tax expense (8,258) (8,747)Profit for the half-year 24,916 23,697
Other comprehensive incomeItems that may be reclassified subsequently to profit or lossCash flow hedges (221) (609)Currency translation differences arising during the half-year 841 5,748Other comprehensive income for the half-year, net of tax 620 5,139Total comprehensive income for the half-year 25,536 28,836
Total comprehensive income for the half-year is attributable to:Owners of Michael Hill International Limited 25,536 28,836
Earnings per share attributable to the ordinary equity holdersof the Company during the half-year, attributable to continuing operations:Basic earnings per share 6.50¢ 6.19¢Diluted earnings per share 6.48¢ 6.15¢
The above condensed statement of comprehensive income should be read in conjunction with the accompanying notes.

10
NOTES 31 DEC 15 31 DEC 14 30 JUNE 15 AU$000 AU$000 AU$000ASSETS Current assets Cash and cash equivalents 7,567 11,737 6,797 Trade and other receivables 30,914 30,527 24,859 Inventories 215,653 207,774 182,232 Current tax receivables 1,680 - 11,376 Other current assets 4,714 1,437 3,143 Total current assets 260,528 251,475 228,407 Non-current assets Trade and other receivables 647 584 636 Property, plant and equipment 3 67,939 64,727 64,845 Intangible assets 4 6,535 6,643 6,491 Deferred tax assets 50,631 65,042 48,381 Other non-current assets 2,143 2,521 2,253 Total non-current assets 127,895 139,517 122,606 Total assets 388,423 390,992 351,013
LIABILITIES Current liabilities Trade and other payables 66,681 68,489 43,739 Current tax liabilities - 6,025 - Provisions 4,870 4,737 4,624 Deferred revenue 24,280 25,510 21,516 Total current liabilities 95,831 104,761 69,879 Non-current liabilities Borrowings 33,916 45,572 45,116 Provisions 4,821 5,262 4,254 Deferred revenue 49,386 38,846 44,143 Total non-current liabilities 88,123 89,680 93,513Total liabilities 183,954 194,441 163,392 Net assets 204,469 196,551 187,621
EQUITY Contributed equity 5 3,760 3,760 3,760 Reserves 8,247 11,021 7,445 Retained profits 192,462 181,770 176,416Total equity 204,469 196,551 187,621
Condensed Statement of Financial Positionas at 31 December 2015
This condensed statement of financial position should be read in conjunction with the accompanying notes.

11
Condensed Statement of Changes in Equityfor the six months ended 31 December 2015 Attributable to owners of Michael Hill International Limited
NOTES Contributed Options Foreign Cash flow Retained Total equity reserve currency hedge profits equity translation reserve reserve
AU$000 AU$000 AU$000 AU$000 AU$000 AU$000
Balance at 1 July 2015 3,760 1,943 6,270 (768) 176,416 187,621Profit for the period - - - - 24,916 24,916Currency translation differences - - 841 - - 841Currency forward contracts - - - (72) - (72)Interest rate swaps - - - (149) - (149) 3,760 1,943 7,111 (989) 201,332 213,157
Transactions with owners in their capacity as owners:Dividends paid 6 - - - - (8,870) (8,870)Option expense through share based payments reserve - 70 - - - 70Reverse options previously forfeited - 112 - - - 112Balance at 31 December 2015 3,760 2,125 7,111 (989) 192,462 204,469
Balance at 1 July 2014 3,651 1,918 4,155 (277) 171,838 181,285Profit for the period - - - - 23,697 23,697Currency translation differences - - 5,748 - - 5,748Currency forward contracts - - - (11) - (11)Interest rate swaps - - - (598) - (598) 3,651 1,918 9,903 (886) 195,535 210,121
Transactions with owners in their capacity as owners:Dividends paid 6 - - - - (13,765) (13,765)Employee shares issued 5 109 - - - - 109Option expense through share based payments reserve - 86 - - - 86Balance at 31 December 2014 3,760 2,004 9,903 (886) 181,770 196,551
The above condensed statement of changes in equity should be read in conjunction with the accompanying notes.
12
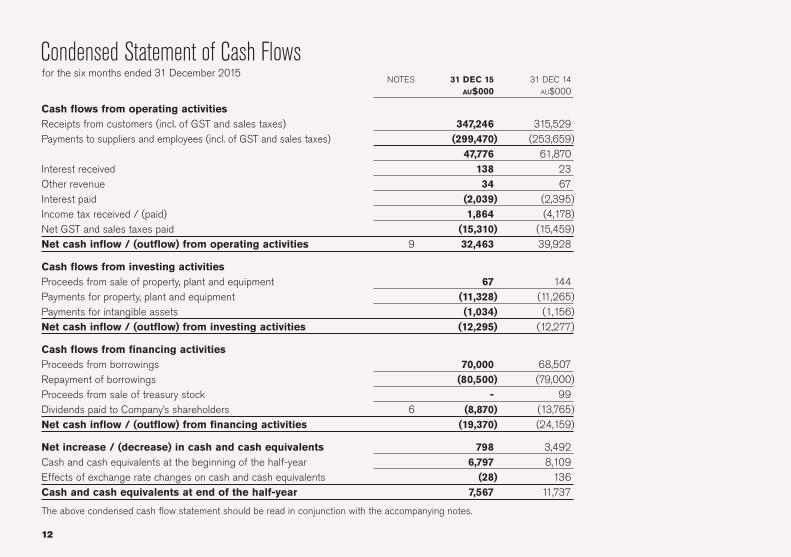
NOTES 31 DEC 15 31 DEC 14 AU$000 AU$000
Cash flows from operating activitiesReceipts from customers (incl. of GST and sales taxes) 347,246 315,529Payments to suppliers and employees (incl. of GST and sales taxes) (299,470) (253,659) 47,776 61,870Interest received 138 23Other revenue 34 67Interest paid (2,039) (2,395)Income tax received / (paid) 1,864 (4,178)Net GST and sales taxes paid (15,310) (15,459)Net cash inflow / (outflow) from operating activities 9 32,463 39,928
Cash flows from investing activitiesProceeds from sale of property, plant and equipment 67 144Payments for property, plant and equipment (11,328) (11,265)Payments for intangible assets (1,034) (1,156)Net cash inflow / (outflow) from investing activities (12,295) (12,277)
Cash flows from financing activitiesProceeds from borrowings 70,000 68,507Repayment of borrowings (80,500) (79,000)Proceeds from sale of treasury stock - 99Dividends paid to Company’s shareholders 6 (8,870) (13,765)Net cash inflow / (outflow) from financing activities (19,370) (24,159)
Net increase / (decrease) in cash and cash equivalents 798 3,492Cash and cash equivalents at the beginning of the half-year 6,797 8,109Effects of exchange rate changes on cash and cash equivalents (28) 136Cash and cash equivalents at end of the half-year 7,567 11,737
The above condensed cash flow statement should be read in conjunction with the accompanying notes.
Condensed Statement of Cash Flowsfor the six months ended 31 December 2015

13
Notes to the Financial Statements
NOTE 1 Summary of significant accounting policiesThe interim financial statements for the half-year ended 31 December 2015 have been prepared in accordance with NZ IAS 34 interim financial reporting and IAS 34 interim financial reporting.
These interim financial statements do not include all the notes of the type normally included in an annual financial report. Accordingly, this report is to be read in conjunction with the annual report for the year ended 30 June 2015. The accounting policies adopted are consistent with those of the previous financial year and corresponding interim reporting period, unless otherwise stated.
Statutory baseMichael Hill International Limited is a public company registered under the Companies Act 1993 and is domiciled in New Zealand. The Company has its primary listing on the New Zealand Stock Exchange. The Company is a FMC reporting entity under Part 7 of the Financial Markets Conduct Act 2013.
The interim financial statements have been prepared in accordance with the requirements of the Financial Reporting Act 2013, the Financial Markets Conducts Act 2013 and the Companies Act 1993. The interim financial statements of the Group are for the economic entity comprising Michael Hill International Limited and its subsidiaries.
These consolidated financial statements have been approved for issue by the Board of Directors on 11 February 2016.The reporting currency used in the preparation of these consolidated interim financial statements is Australian dollars,
rounded to the nearest thousand.

14
MHJ AUSTRALIA MHJ NEW ZEALAND MHJ CANADA MHJ USA GROUP
2015 2014 2015 2014 2015 2014 2015 2014 2015 2014 AU$000 AU$000 ± % AU$000 AU$000 ± % AU$000 AU$000 ± % AU$000 AU$000 ± % AU$000 AU$000 ± %Operating revenueSales to customers 175,563 168,540 4.2% 61,866 58,045 6.6% 55,433 45,835 20.9% 10,256 6,768 51.5% 303,118 279,188 8.6%Unallocated revenue 7,657 4,001 (91.4%)Total operating revenue 310,775 283,189 9.7%
Segment resultsOperating profit / (loss) 32,431 31,504 2.9% 14,113 12,814 10.1% 7,619 5,251 45.1% (2,023) (644) (214.2%) 52,140 48,925 6.6%Unallocated revenue less unallocated expenses (18,966) (16,481) (15.1%)Profit before income tax 33,174 32,444 2.3%Income tax expense (8,258) (8,747) 5.6%Profit for the half-year 24,916 23,697 5.1%
Segment assets 124,391 121,993 2.0% 50,336 47,794 5.3% 66,680 67,432 (1.1%) 23,407 18,200 28.6% 264,814 255,419 3.7%Unallocated 123,609 135,573 (8.8%)Total 388,423 390,992 (0.7%)
Segment liabilities 77,111 72,434 6.5% 24,957 23,634 5.6% 18,944 17,777 6.6% 4,925 3,209 53.5% 125,937 117,054 7.6%Unallocated 58,017 77,387 (25.0%)Total 183,954 194,441 (5.4%)
Segment acquisitions of property,plant & equipment and intangibles 3,143 1,749 79.7% 1,935 2,117 (8.6%) 3,372 3,708 (9.1%) 1,973 541 264.7% 10,423 8,115 28.4%Unallocated 1,939 4,306 (55.0%)Total 12,362 12,421 (0.5%)
Segment depreciation & amortisation expense 3,479 3,202 8.6% 1,265 1,168 8.3% 1,796 1,447 24.1% 541 322 68.0% 7,081 6,139 15.3%Unallocated 1,620 1,435 12.9%Total 8,701 7,574 14.9%
NOTE 2 Segment informationIdentification and description of segmentsThe operating segments are identified by the Board and Executive Team based on the country in which the item is sold.
The Executive Director and Executive Team consider, organise and manage the business from a geographic perspective, being the country of origin where the sale and service was performed. Discrete financial information about each of these operating businesses is reported to the Board and Executive Team monthly, via the preparation of the Group financial report.
The Group operates in four geographic segments: Australia, New Zealand, Canada and the United States of America.
Types of products and servicesMichael Hill International Limited and its controlled entities operate predominately in the sale of jewellery and related services. As indicated above, the Group is organised and managed globally into geographic areas.
Major customersMichael Hill International Limited and its controlled entities sells goods and provides services to a number of customers from which revenue is derived. There is no single customer from which the Group derives more than 10% of the total consolidated revenue.
Accounting policies and inter-segment transactionsThe accounting policies used by the Group in reporting segments internally are the same as those contained in note 1 to the accounts and in the prior period.
It is the Group’s policy that if items of revenue and expense are not allocated to operating segments, then any associated assets and liabilities are also not allocated to segments. This is to avoid asymmetrical allocations within segments, which management believes will be inconsistent.
Unallocated expenses include all expenses that do not relate directly to the relevant retail segment and include: the Emma & Roe brand operations, trading activity through our online presence, manufacturing activities, warehouse and distribution, general corporate expenses, interest and company tax. Inter-segment pricing is at arm’s length or market value.
Notes to the Financial Statements cont.

15
MHJ AUSTRALIA MHJ NEW ZEALAND MHJ CANADA MHJ USA GROUP
2015 2014 2015 2014 2015 2014 2015 2014 2015 2014 AU$000 AU$000 ± % AU$000 AU$000 ± % AU$000 AU$000 ± % AU$000 AU$000 ± % AU$000 AU$000 ± %Operating revenueSales to customers 175,563 168,540 4.2% 61,866 58,045 6.6% 55,433 45,835 20.9% 10,256 6,768 51.5% 303,118 279,188 8.6%Unallocated revenue 7,657 4,001 (91.4%)Total operating revenue 310,775 283,189 9.7%
Segment resultsOperating profit / (loss) 32,431 31,504 2.9% 14,113 12,814 10.1% 7,619 5,251 45.1% (2,023) (644) (214.2%) 52,140 48,925 6.6%Unallocated revenue less unallocated expenses (18,966) (16,481) (15.1%)Profit before income tax 33,174 32,444 2.3%Income tax expense (8,258) (8,747) 5.6%Profit for the half-year 24,916 23,697 5.1%
Segment assets 124,391 121,993 2.0% 50,336 47,794 5.3% 66,680 67,432 (1.1%) 23,407 18,200 28.6% 264,814 255,419 3.7%Unallocated 123,609 135,573 (8.8%)Total 388,423 390,992 (0.7%)
Segment liabilities 77,111 72,434 6.5% 24,957 23,634 5.6% 18,944 17,777 6.6% 4,925 3,209 53.5% 125,937 117,054 7.6%Unallocated 58,017 77,387 (25.0%)Total 183,954 194,441 (5.4%)
Segment acquisitions of property,plant & equipment and intangibles 3,143 1,749 79.7% 1,935 2,117 (8.6%) 3,372 3,708 (9.1%) 1,973 541 264.7% 10,423 8,115 28.4%Unallocated 1,939 4,306 (55.0%)Total 12,362 12,421 (0.5%)
Segment depreciation & amortisation expense 3,479 3,202 8.6% 1,265 1,168 8.3% 1,796 1,447 24.1% 541 322 68.0% 7,081 6,139 15.3%Unallocated 1,620 1,435 12.9%Total 8,701 7,574 14.9%

16
NOTE 3 Property, plant and equipmentAcquisitions and disposalsDuring the six months ended 31 December 2015, the Group acquired assets with a total cost of $11,328,000 (31 December 2014 - $11,265,000). Assets with a net book value of $204,000 were disposed of during the six months ended 31 December 2015 (31 December 2014 - $267,000), resulting in a net loss on disposal of $137,000 (31 December 2014 - $123,000 loss).
NOTE 4 Intangible assetsAcquisitions and disposalsDuring the six months ended 31 December 2015, the Group acquired assets with a total cost of $1,034,000 (31 December 2014 - $1,156,000). Assets with a net book value of $1,000 were disposed of during the six months ended 31 December 2015 (31 December 2014 - nil), resulting in a net loss on disposal of $1,000 (31 December 2014 - nil).
Notes to the Financial Statements cont.
17
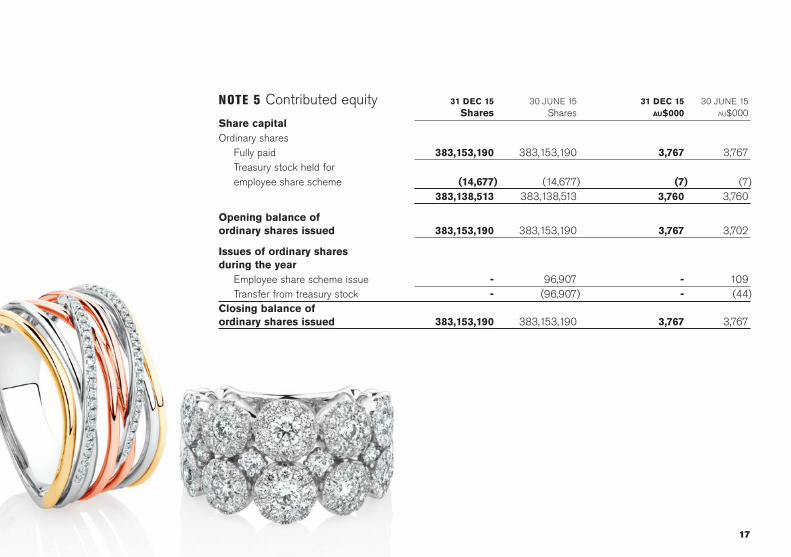
NOTE 5 Contributed equity 31 DEC 15 30 JUNE 15 31 DEC 15 30 JUNE 15 Shares Shares AU$000 AU$000Share capitalOrdinary shares Fully paid 383,153,190 383,153,190 3,767 3,767 Treasury stock held for employee share scheme (14,677) (14,677) (7) (7) 383,138,513 383,138,513 3,760 3,760
Opening balance ofordinary shares issued 383,153,190 383,153,190 3,767 3,702
Issues of ordinary sharesduring the year Employee share scheme issue - 96,907 - 109 Transfer from treasury stock - (96,907) - (44)Closing balance ofordinary shares issued 383,153,190 383,153,190 3,767 3,767
18
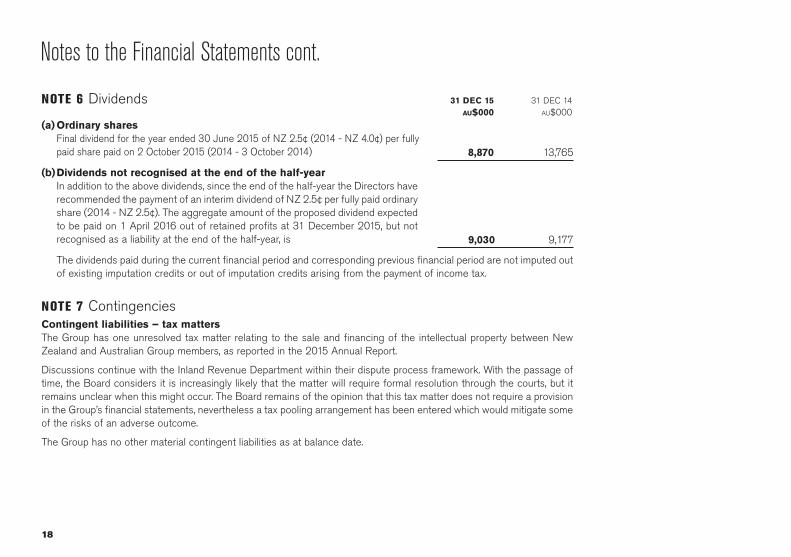
NOTE 6 Dividends 31 DEC 15 31 DEC 14 AU$000 AU$000(a) Ordinary shares
Final dividend for the year ended 30 June 2015 of NZ 2.5¢ (2014 - NZ 4.0¢) per fully paid share paid on 2 October 2015 (2014 - 3 October 2014)
(b) Dividends not recognised at the end of the half-yearIn addition to the above dividends, since the end of the half-year the Directors have recommended the payment of an interim dividend of NZ 2.5¢ per fully paid ordinary share (2014 - NZ 2.5¢). The aggregate amount of the proposed dividend expected to be paid on 1 April 2016 out of retained profits at 31 December 2015, but not recognised as a liability at the end of the half-year, is
The dividends paid during the current financial period and corresponding previous financial period are not imputed out of existing imputation credits or out of imputation credits arising from the payment of income tax.
8,870 13,765
9,030 9,177
NOTE 7 ContingenciesContingent liabilities – tax mattersThe Group has one unresolved tax matter relating to the sale and financing of the intellectual property between New Zealand and Australian Group members, as reported in the 2015 Annual Report.
Discussions continue with the Inland Revenue Department within their dispute process framework. With the passage of time, the Board considers it is increasingly likely that the matter will require formal resolution through the courts, but it remains unclear when this might occur. The Board remains of the opinion that this tax matter does not require a provision in the Group’s financial statements, nevertheless a tax pooling arrangement has been entered which would mitigate some of the risks of an adverse outcome.
The Group has no other material contingent liabilities as at balance date.
Notes to the Financial Statements cont.
19
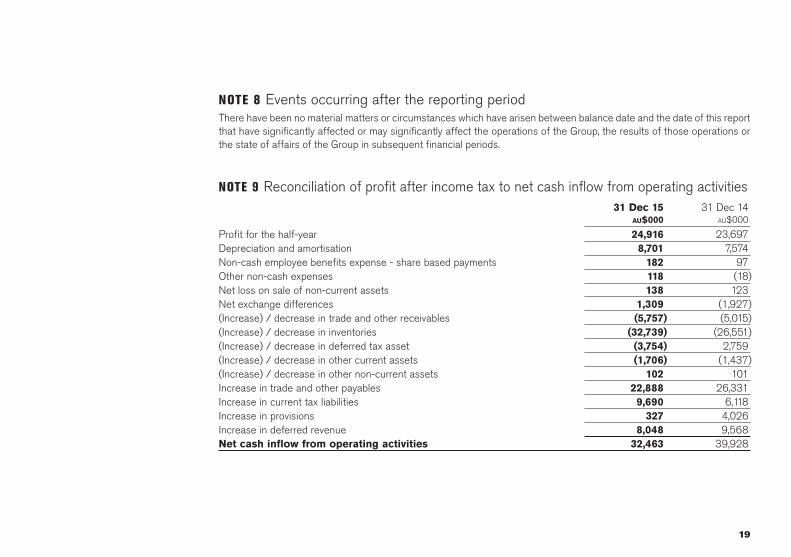
NOTE 8 Events occurring after the reporting periodThere have been no material matters or circumstances which have arisen between balance date and the date of this report that have significantly affected or may significantly affect the operations of the Group, the results of those operations or the state of affairs of the Group in subsequent financial periods.
NOTE 9 Reconciliation of profit after income tax to net cash inflow from operating activities 31 Dec 15 31 Dec 14 AU$000 AU$000
Profit for the half-year 24,916 23,697Depreciation and amortisation 8,701 7,574Non-cash employee benefits expense - share based payments 182 97Other non-cash expenses 118 (18)Net loss on sale of non-current assets 138 123Net exchange differences 1,309 (1,927)(Increase) / decrease in trade and other receivables (5,757) (5,015)(Increase) / decrease in inventories (32,739) (26,551)(Increase) / decrease in deferred tax asset (3,754) 2,759(Increase) / decrease in other current assets (1,706) (1,437)(Increase) / decrease in other non-current assets 102 101Increase in trade and other payables 22,888 26,331Increase in current tax liabilities 9,690 6,118Increase in provisions 327 4,026Increase in deferred revenue 8,048 9,568Net cash inflow from operating activities 32,463 39,928
20
Corporate directoryDIRECTORS
Sir Richard Michael Hill K.N.Z.M. (Founder President)E.J. Hill B.Com., M.B.A. (Chair)G.J. GwynneG.W. Smith B.Comm., F.C.A., F.A.I.C.D.
Ann Christine Lady Hill Dip F.A.
R.I. Fyfe
Chief Executive OfficerM.R. Parsell
Chief Financial OfficerP.R. Taylor
Company SecretaryW.K. Butler B.Com., F.C.I.S.
REGISTERED OFFICE
The Offices of Kensington SwanGround FloorKPMG Building18 Viaduct Harbour AvenueAuckland(All communications toGPO Box 2922Brisbane, QLD 4001, Australia)
CORPORATE HEAD OFFICE
Metroplex on Gateway7 Smallwood PlaceMurarrie, QLD 4172GPO Box 2922Brisbane, QLD 4001, AustraliaTelephone 617 3114 3500Fax 617 3399 0222
SHARE REGISTRAR
Computershare Investor Services LtdLevel 2, 159 Hurstmere RdTakapunaNorth Shore CityInvestor Enquiries (09) 488 8777
SOLICITORS
Kensington SwanPO Box 10246WellingtonNew Zealand
AUDITORS
Ernst & YoungLevel 51One One One111 Eagle StreetBrisbane, QLD 4000Australia
PRIMARY BANKERS
ANZ Banking Group (New Zealand) LimitedAustralia and New Zealand Banking Group LimitedBank of America N.A.Bank of Montreal
WEBSITE
www.michaelhill.co.nzwww.emmaandroe.com.auhttp://investor.michaelhill.com