michael vlassopoulos - econstor.eu
TRANSCRIPT
econstorMake Your Publications Visible.
A Service of
zbwLeibniz-InformationszentrumWirtschaftLeibniz Information Centrefor Economics
Tonin, Mirco; Vlassopoulos, Michael
Working Paper
Social incentives matter: Evidence from an onlinereal effort experiment
IZA Discussion Papers, No. 6716
Provided in Cooperation with:IZA – Institute of Labor Economics
Suggested Citation: Tonin, Mirco; Vlassopoulos, Michael (2012) : Social incentives matter:Evidence from an online real effort experiment, IZA Discussion Papers, No. 6716, Institute forthe Study of Labor (IZA), Bonn
This Version is available at:http://hdl.handle.net/10419/62483
Standard-Nutzungsbedingungen:
Die Dokumente auf EconStor dürfen zu eigenen wissenschaftlichenZwecken und zum Privatgebrauch gespeichert und kopiert werden.
Sie dürfen die Dokumente nicht für öffentliche oder kommerzielleZwecke vervielfältigen, öffentlich ausstellen, öffentlich zugänglichmachen, vertreiben oder anderweitig nutzen.
Sofern die Verfasser die Dokumente unter Open-Content-Lizenzen(insbesondere CC-Lizenzen) zur Verfügung gestellt haben sollten,gelten abweichend von diesen Nutzungsbedingungen die in der dortgenannten Lizenz gewährten Nutzungsrechte.
Terms of use:
Documents in EconStor may be saved and copied for yourpersonal and scholarly purposes.
You are not to copy documents for public or commercialpurposes, to exhibit the documents publicly, to make thempublicly available on the internet, or to distribute or otherwiseuse the documents in public.
If the documents have been made available under an OpenContent Licence (especially Creative Commons Licences), youmay exercise further usage rights as specified in the indicatedlicence.
www.econstor.eu

DI
SC
US
SI
ON
P
AP
ER
S
ER
IE
S
Forschungsinstitut zur Zukunft der ArbeitInstitute for the Study of Labor
Social Incentives Matter:Evidence from an Online Real Effort Experiment
IZA DP No. 6716
July 2012
Mirco ToninMichael Vlassopoulos
Social Incentives Matter: Evidence from an
Online Real Effort Experiment
Mirco Tonin University of Southampton,
CEU and IZA
Michael Vlassopoulos University of Southampton
Discussion Paper No. 6716 July 2012
IZA
P.O. Box 7240 53072 Bonn
Germany
Phone: +49-228-3894-0 Fax: +49-228-3894-180
E-mail: [email protected]
Any opinions expressed here are those of the author(s) and not those of IZA. Research published in this series may include views on policy, but the institute itself takes no institutional policy positions. The Institute for the Study of Labor (IZA) in Bonn is a local and virtual international research center and a place of communication between science, politics and business. IZA is an independent nonprofit organization supported by Deutsche Post Foundation. The center is associated with the University of Bonn and offers a stimulating research environment through its international network, workshops and conferences, data service, project support, research visits and doctoral program. IZA engages in (i) original and internationally competitive research in all fields of labor economics, (ii) development of policy concepts, and (iii) dissemination of research results and concepts to the interested public. IZA Discussion Papers often represent preliminary work and are circulated to encourage discussion. Citation of such a paper should account for its provisional character. A revised version may be available directly from the author.
IZA Discussion Paper No. 6716 July 2012
ABSTRACT
Social Incentives Matter: Evidence from an Online Real Effort Experiment*
Contributing to a social cause can be an important driver for workers in the public and non-profit sector as well as in firms that engage in Corporate Social Responsibility activities. This paper compares the effectiveness of social incentives to financial incentives using an online real effort experiment. We find that social incentives lead to a 20% rise in productivity, regardless of their form (lump sum or related to performance) or strength. When subjects can choose the mix of incentives half sacrifice some of their private compensation to increase social compensation, with women more likely than men. Furthermore, social incentives do not attract less productive subjects, nor subjects that respond more to exogenously imposed social incentives. Our calculations suggest that a dollar spent on social incentives is equivalent to increasing private compensation by at least half a dollar. JEL Classification: D64, J24, J32, L3, M14, M52 Keywords: private incentives, social incentives, sorting, prosocial behavior,
real effort experiment, corporate social responsibility, gender Corresponding author: Mirco Tonin Economics Division School of Social Sciences University of Southampton Southampton SO17 1BJ United Kingdom E-mail: [email protected]
* We thank Jiadi Yao and Juan Correa for excellent research assistance. This work was supported by the Economic and Social Research Council [grant number RES-061-25-0461].
1 Introduction
How to motivate workers is a question of great interest for academics and practitioners alike.
In economics, for the most part, attention has been devoted to the role of financial incentives
(piece-rates, bonuses, stock options, etc.) and their effectiveness in raising productivity has found
empirical support in sectors such as manufacturing and agriculture (e.g. Lazear, 2000; Shearer,
2004; Bandiera et al., 2005). In recent years, a large and growing body of evidence has emerged
in the economics literature (see, for instance, Fehr and Schmidt, 2006) suggesting that people are
motivated not just by material self-interest, but also have social concerns (fairness, reciprocity,
altruism etc.) that affect the way they make economic decisions. In a workplace context, these
social concerns may be directed toward the employer, see, for instance, the large literature on gift-
exchange exploring this channel (Akerlof, 1982; Fehr et al., 1993), or co-workers, see, for instance,
the empirical studies documenting the impact of peer effects and social ties on productivity (Falk
and Ichino, 2006; Mas and Moretti, 2009; Bandiera et al., 2010). Recently, economists have started
analyzing theoretically optimal incentives when workers are motivated by a third type of social
concerns, namely, their contribution to a social cause (e.g. Besley and Ghatak, 2005; Delfgaauw
and Dur, 2007, 2008; Francois, 2000, 2007). The link between a worker’s job and a social cause
can arise naturally in the public sector and certain care-related sectors (e.g. health, education,
social services etc.) or can be induced in any job through the implementation of Corporate Social
Responsibility (CSR) policies.1 Despite the theoretical interest in this type of social concern, there
is not much empirical evidence on the effectiveness and relative importance of incentives that appeal
to such concern compared to traditional financial incentives.2,3
This paper reports results from a real effort experiment in which subjects perform remotely
an online data entry task, facing different combinations of private and social incentives. Private
incentives are represented by a standard piece rate, while social incentives take the form of a
donation received by a charity of the subject’s choice – either lump sum or related to the subject’s
performance. What we find is that social incentives matter as they are effective in motivating
subjects, inducing a 20% rise in productivity. Interestingly, subjects respond equally regardless of
1See Benabou and Tirole (2010) and Kitzmueller and Shimshack (2012) for an overview of the economic perspec-tive on CSR.
2There is a substantial business literature using surveys to examine the impact of CSR on potential or existingemployees. The usual finding is that companies with a high level of CSR are more attractive for job seekers andthat CSR is positively associated with employees’ commitment to the firm. For recent contributions, with referencesto previous studies, see Evans and Davis (2011), and Stites and Michael (2011). For a recent contribution to theempirical literature on public sector motivation, see Gregg et al. (2011).
3Some studies have examined the impact of non-monetary awards and have found them to raise productivity dueto their symbolic value (e.g. Kosfeld and Neckermann, 2011; Ashraf et al., 2012).
1
whether the donation to the charity is lump-sum or related to performance,4 and, in the latter case,
tripling the donation piece-rate does not increase productivity any further. This suggests that what
motivates workers is the presence of social incentives rather than their specific form. Consistently
with this finding, in reality, firms employ a variety of CSR practices: some firms link their charitable
activities to performance, for instance, by pledging to contribute a given percentage of their profits
or revenues,5 while other firms opt not to link their CSR budget to profits - at least not in an explicit
way. When we compare the effectiveness of private and social incentives in boosting productivity,
we find that social incentives are at least half as effective in motivating subjects as compared
to private incentives. This means that $1 spent on social incentives generates at least the same
increase in productivity as $0.5 spent on private incentives. We conclude that such an effect on
productivity may be one of the reasons behind the increasing importance of CSR policies, along
with the positive impact on customers and investors documented in other studies (e.g. Elfenbein
and McManus, 2010; Casadesus-Masanell et al., 2009; Hong and Kacperczyk, 2009). In addition,
the fact that social incentives are effective in boosting productivity indicates that in occupations
and sectors with characteristics that engender prosocial behavior, such as, health, education and
social care, a given level of productivity can be achieved with less financial incentives.
Our experiment involves four one-hour sessions that each subject had to complete within a
one-week period. In the first session, all subjects work under a baseline piece rate. From session 2
onwards, we randomly assign subjects into 4 groups. Subjects in group 1 work under the same piece
rate for the remaining three sessions. This allows us to measure any trend in productivity, due to,
for instance, learning or boredom. Subjects in group 2 face different piece rates in sessions 2-4. This
allows us to measure the effect of private incentives on performance. Subjects in the remaining
two groups work in sessions 2 and 3 under the same baseline piece rate, plus they face a social
incentive, in the form of a donation received by a charity of the subject’s choice. In particular, for
group 3 this donation can be either lump-sum or related to performance, while subjects in group 4
face two performance-related social incentives of different strength. Through these two treatments,
we identify the impact of social incentives on productivity. In the final session, subjects in groups
3 and 4 can choose how to divide a piece rate between themselves and a charity of their choice,
thus being able to choose their preferred mix of private and social incentives. There are several
4This finding is consistent with our earlier results (Tonin and Vlassopoulos, 2010). Other experimental studiesthat look at the impact of charitable donations on (induced) effort are Fehrler and Kosfeld (2012) and Koppel andRegner (2012). Gneezy and Rey-Biel (2011) compare the effectiveness of contingent and non-contingent incentives ingenerating responses to a marketing survey and find that contingent incentives are more cost-effective.
5One such example from the UK is the so-called Percent Club for companies that pledge to donate at least1% of their pre-tax profits to charitable causes, with members like GlaxoSmithKline, Deloitte, and the John LewisPartnership.
2
instances where firms promote similar schemes, such as, workplace giving in the US and payroll
giving in the UK and other countries.
This last treatment allows us to investigate selection effects that social incentives may induce,
by examining the characteristics of subjects who, when given the opportunity, self-select into a
compensation scheme embedding social incentives, sacrificing personal monetary rewards. We find
that around 50% of our subjects choose a compensation with a social element, with women being
more likely than men. Notably, we find no differences in terms of baseline productivity between
this group and the group not choosing a social element in the compensation package, suggesting
that social incentives do not induce sorting along the productivity dimension, unlike compensation
structures that include variable financial incentives (Lazear, 2000; Dohmen and Falk, 2011). We
also do not find differences between these two groups in terms of their responsiveness to social
incentives when social incentives are exogenously introduced. This is consistent with a recent wave
of studies (Andreoni, Rao, and Trachtman, 2011; Della Vigna, List and Malmendier, 2012; Lazear,
Malmendier and Weber, 2012) showing that in the context of charitable giving people sorting out
of giving environments are not necessarily less generous when placed in such environments. The
lack of selection effects has the implication that there is no “first mover advantage” in terms of
personnel for firms introducing social incentives. For instance, a firm that applies voluntarily strict
environmental standards, might attract environmentally conscious personnel, but the impact of the
policy on productivity will not be different from that experienced in other firms that adopt the
standards later on when they become mandatory by government regulation.
We also explore whether the response to social incentives is persistent throughout the experi-
mental session. What we see is that in fact the effect of incentives, both private and social, persists
in the second half of the session, suggesting that the results are not simply driven by a knee-jerk
reaction to a change in compensation. Finally, as we have precise measures of both quantity and
quality of output produced by subjects in our experiment, we can draw on the insight of the multi-
tasking literature (Holmstrom and Milgrom, 1991), to test whether social incentives have a different
impact on quantity vs. quality, and we find that both are equally affected.6
Methodologically, an experimental approach to assessing the effects of alternative types of in-
centives on productivity has several advantages. First of all, being able to exogenously change the
compensation structure allows us to identify the causal effect of different compensation schemes
on productivity, something that is much more difficult to achieve using observational data where
6A trade-off between quantity and quality has been found in the context of financial incentives (Freeman andKleiner, 2005) and, more recently, when firms offer gift-exchange wages (Kim and Slonim, 2012).
3
the incentive structure in place is an equilibrium outcome. Second, by keeping all other working
conditions constant we are able to make direct and fair comparisons of the impact of private and
social incentives on productivity. Additionally, the short term and one-off nature of the job reduces
the confounding effect of incentives driven by concerns for reputation-building by the employees.
Namely, employees may respond to social incentives not because they care about the incentives in
themselves but because they want to signal their prosocial type to the employer, if they think that
this will foster their career perspectives and therefore their future earnings, for instance, because
prosocial types are expected to be less likely to shirk. In a setting with long-term employment
relationships, even if it was possible to engineer an exogenous change in compensation, it would be
very difficult to isolate this career concern from the direct motivational impact of social incentives.
Furthermore, the fact that the experiment is conducted online and not in a lab makes the role
of subjects’ motivation a more important determinant of performance. This is because in a lab
subjects usually have limited opportunities to pursue alternative activities and, also, the amount
of (perceived) scrutiny may be higher. Finally, studying the performance of individuals who work
remotely is interesting in its own right given the recent trend of homeworking and teleworking in
which an increasing number of jobs, primarily in sales, entail the employee working from home.7
The rest of the paper is organized as follows. The next section describes the experimental
design, while section 3 provides some descriptive analysis of the sample and experimental data, and
presents the main and auxiliary regression results. Section 4 compares private and social incentives,
and the last section offers some concluding remarks.
2 The Online Experiment
2.1 Description
We set up a computer-based real effort task that subjects could perform remotely on their own
computer as long as it had internet access, and required little training and prior experience other
than basic computer skills. The task involved entering bibliographic records in an online repository
platform. In particular, subjects entered various elements (title, author(s) names, year of publica-
tion, name of journal, volume, issue and pages) of academic publications, the first page of which
were uploaded on their screen. More specifically, subjects would see a screen with three parts.8
7For instance, according to the American Time Use Survey, 19% of wage and salary workers in the US did someor all of their work at home in 2010 (BLS, 2011).
8A screenshot of the task page can be found in Appendix C.
4
The top of the screen contained some information regarding the time remaining before the end of
the session, the cumulative number of records they had entered in real time, and information about
the compensation that the participant would receive in the current session. The middle part of the
screen contained the various fields in which subjects would enter the data, and the bottom of the
screen contained the source data. When subjects had finished entering the relevant items regarding
a particular record they were instructed to click on the “next record” button and another record
would be uploaded at the bottom of the page, so they would proceed in the same manner. Note
that to ensure an equal level of difficulty of the task across subjects, all subjects were presented
with the same records and in the same order.
The experiment took place between November 2010 and December 2011. We recruited subjects
from the student body of the University of Southampton through email announcements for an
online experiment, targeting an equal number of males and females. In total 320 student subjects
completed the experiment.9 Subjects who expressed interest in participating received log-in details
from us, and upon logging in the experimental webpage they received further instructions as to
how to perform the task and the form of their compensation.10 Subsequently, they were given
an opportunity to practice the task to ensure that they had understood what it entails, and then
started work.
The experiment was organized in four sessions, each session involving a work period of one hour.
Participants could freely choose when to work, subject to the restrictions that the four sessions were
to be completed within one week and that participants could perform only one session per day,
by logging in between 8am and 10pm. In each session, subjects would receive instructions at the
beginning as to what the compensation structure would be, and then proceeded to perform the
task for one hour.11 At the end of the last session we asked them to fill out a questionnaire and
to provide their banking details, so that their compensation could be arranged.12 Finally, we also
9An additional 93 subjects logged in at some point but never completed the experiment. We discuss attrition inthe next section.
10Experimental instructions are provided in an Appendix.11In each session, after instructions were given and just before the working time started we asked subjects a series
of 4 questions aimed at controlling for whether subjects were tired or stressed on that particular day prior to takingthe experiment. In particular, we asked the following questions: “Have you been able to concentrate on whateveryou are doing? Have you lost much sleep over worry? Have you felt constantly under strain? Have you been feelingunhappy or depressed?” The answers to these questions were given on a 4 point scale ranging from 1 (Not at all),to 4 (Much more than usual). There is no systematic difference in the answers to these questions among the fourgroups that will be defined below.
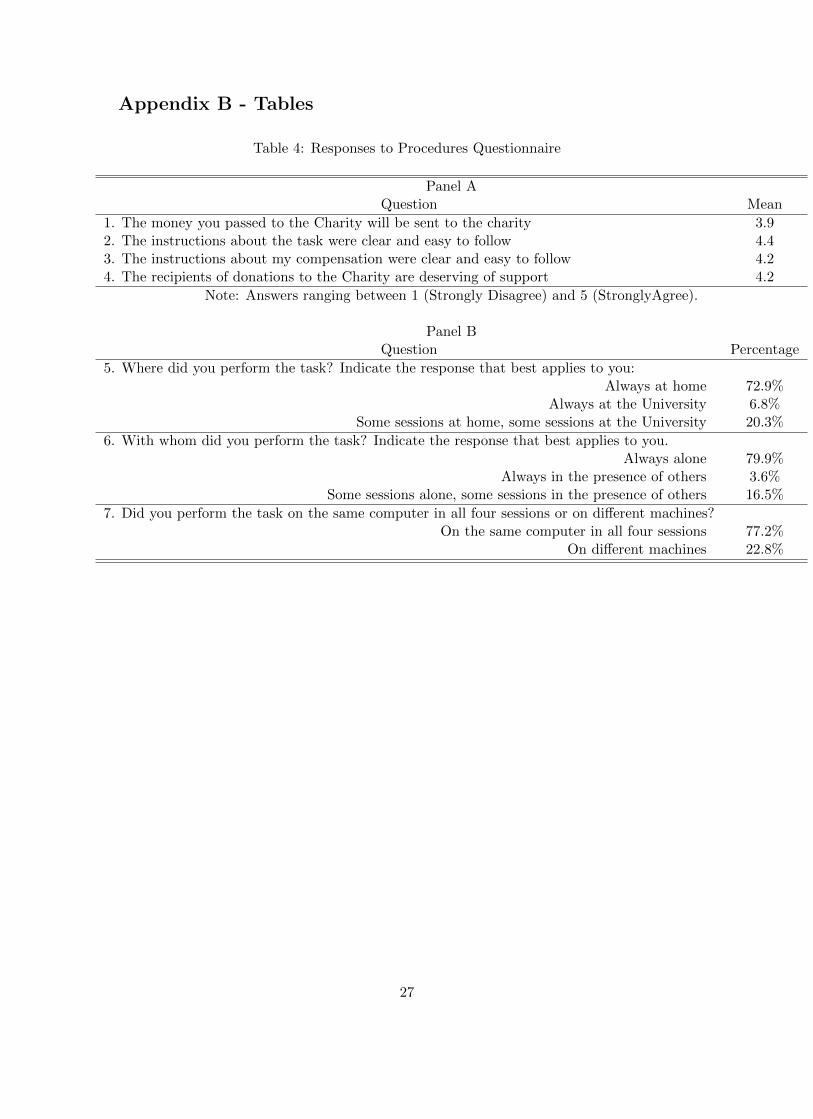
12The questionnaire contained questions on procedural aspects of the experiment (whether the instructions wereclear, where they performed the task etc.), some questions on socioeconomic characteristics (age, gender, subject ofstudy, work experience, engagement with charities etc.), and some open ended questions on the motivation regardingthe decision of how much effort to put in the task. Table 4 contains summary statistics of answers to questions relatedto procedures.
5
asked all subjects whether they want to donate a percentage of their total earnings to a charity of
their choice.
Subjects received £20 for completing the project. Moreover, they received additional compen-
sation depending on the amount of bibliographic records they entered. The specific amount they
would receive for each entry was announced at the beginning of each session and is described in the
next subsection. To avoid inducing performance that would be motivated by future expected re-
wards, we told subjects that neither the piece rate nor any other aspect of a given session depended
on their performance in previous sessions. Finally, subjects were instructed that they would only
be paid for correct entries and only if they completed all four sessions within the allotted one-week
period.
2.2 Experimental Design
Our experimental design involves 4 stages and 4 groups defined below and summarized in Table 1:
Group 1 (52 subjects): subjects in this group received the baseline piece rate (2.5p per correct
entry) throughout the 4 sessions. This group will allow us to account for any trend in productivity
across sessions due to, for instance, learning or boredom.
Group 2 (52 subjects): subjects in this group received the baseline piece rate (2.5p) in session 1;
in subsequent sessions, they worked under three different piece rates (5p/7.5p/10p), presented in
random order. This group will allow us to estimate the effect of private incentives on productivity.
Group 3 (100 subjects): subjects in this group underwent the following treatments:
• Session 1: Subjects received the baseline piece rate (2.5p).
• Session 2 and Session 3: The following two treatments in random order:
– Treatment A (TA): Subjects received the baseline piece rate (2.5p). In addition, they
were told that if they wish we would make a lump-sum donation (£10) to a charity of
the subject’s choice among a list of charities with diverse missions.13
– Treatment B (10p) (TB10): Subjects received the baseline piece rate (2.5p). In addition,
13The list of charities from which subjects could choose is provided in the Appendix. Note that subjects couldchoose not to make any donation by selecting the option “I do not wish any donation to be made”. Nobody selectedthis option.
6
they were told that if they wish we would make a donation to their preferred charity
based on their performance, with a charity piece rate of 10p per entry.
• Session 4: Treatment Choice (TC): Subjects were told that they could decide how much of a
10p per entry piece rate to keep for themselves and how much to pass on to a charity of their
choice. The charity would receive double the per entry bonus they decided to pass.
Group 4 (116 subjects): subjects in this group underwent the following treatments:
• Session 1: Subjects received the baseline piece rate (2.5p).
• Session 2 and Session 3: Two versions of Treatment B in random order: in one the charity
piece rate was 5p (TB5), in the other the charity piece rate was 15p (TB15).
• Session 4: Treatment Choice (TC).
Groups 3 and 4 will allow us to estimate the effect of social incentives on productivity when
they are exogenously imposed, as well as to examine the patterns of subjects’ optimal choice of the
mix of private and social incentives. Notice that in the first session all subjects worked under the
baseline private piece rate (2.5p), so performance in the first session provides a measure of initial
productivity, which will be used in the subsequent analysis to sort participants.
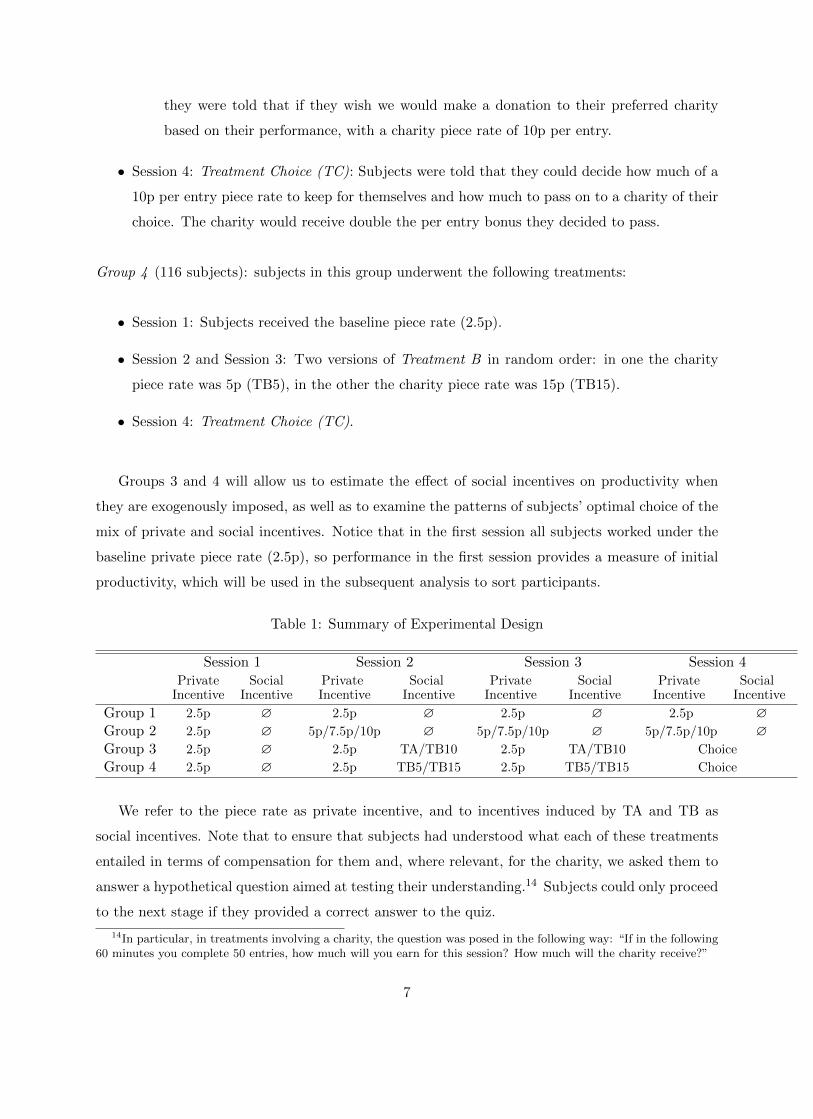
Table 1: Summary of Experimental Design
Session 1 Session 2 Session 3 Session 4Private Social Private Social Private Social Private Social
Incentive Incentive Incentive Incentive Incentive Incentive Incentive Incentive
Group 1 2.5p ∅ 2.5p ∅ 2.5p ∅ 2.5p ∅Group 2 2.5p ∅ 5p/7.5p/10p ∅ 5p/7.5p/10p ∅ 5p/7.5p/10p ∅Group 3 2.5p ∅ 2.5p TA/TB10 2.5p TA/TB10 Choice
Group 4 2.5p ∅ 2.5p TB5/TB15 2.5p TB5/TB15 Choice
We refer to the piece rate as private incentive, and to incentives induced by TA and TB as
social incentives. Note that to ensure that subjects had understood what each of these treatments
entailed in terms of compensation for them and, where relevant, for the charity, we asked them to
answer a hypothetical question aimed at testing their understanding.14 Subjects could only proceed
to the next stage if they provided a correct answer to the quiz.
14In particular, in treatments involving a charity, the question was posed in the following way: “If in the following60 minutes you complete 50 entries, how much will you earn for this session? How much will the charity receive?”
7
3 Results
3.1 Descriptive Analysis
Our analysis is based on a sample of 320 subjects who completed all four sessions of the experiment.
In addition, 93 subjects logged in but did not complete the four sessions. Of the 93 subjects who
dropped out, about two thirds, 58, did not go beyond the first session, 23 stopped after the second
session, while 12 dropped out after the third session. Participants who did not go beyond the
first session were not exposed to the treatments and therefore their decision to drop out is clearly
unrelated to the treatments. The fact that 35 participants withdrew after the second or third session
is instead potentially problematic. However, in unreported probit regressions we do not find any
correlation between belonging to a specific treatment group and the probability of dropping out
after the second session or of dropping out after the third session instead of completing the whole
sequence.15 Therefore, we consider attrition bias not to be a threat to the validity of our results.
The sample is quite balanced in terms of gender composition, with 179 female and 141 male
participants. Moreover, the gender distribution is not systematically different across the four groups
(Pearson chi2 p-value: 0.33). Half of the subjects were born in the UK and most of the subjects
(84%) were born in the period 1987-1993, with the remaining part being older. Most of the subjects
performed all four sessions at home (73%), alone (80%), and on the very same computer (77%) and
found the instructions about the task and about the compensation clear and easy to follow (see
Table 4 for details).
In the analysis we use two definitions of productivity: number of records completed and number
of records entered correctly. One interesting question that we are able to examine using these two
measures of productivity is whether the introduction of private or social incentives has differential
effect on the quantity and quality of output. Note that our definition of a correct entry is a strict
one – we treat a record entry as correct if it contains absolutely no mistake. As a robustness
check, we also experimented with using an alternative less strict definition of what constitutes a
correct entry and the results, available upon request, are very similar in terms of significance and
magnitude to what we present here.16
15Moreover, those who dropped out after the second or third sessions started the second session later than thosewho completed (average difference: 0.51 days, t-test p-value: 0.014). This implies that they had less time to completeall four sessions and were thus more likely to drop out. For instance, 40% of those not completing started the secondsession on the last possible day, compared to just 16% of those completing. Therefore, running out of time is mostlikely an important factor behind dropping out by many of these participants. Notice that at the stage of decidingwhen to start session 2 participants were not yet exposed to treatments.
16In particular, in our alternative definition we classify as correct entries that do not contain a mistake in morethan one field, and if a mistake occurs it does not involve a discrepancy of more than 8 characters.
8
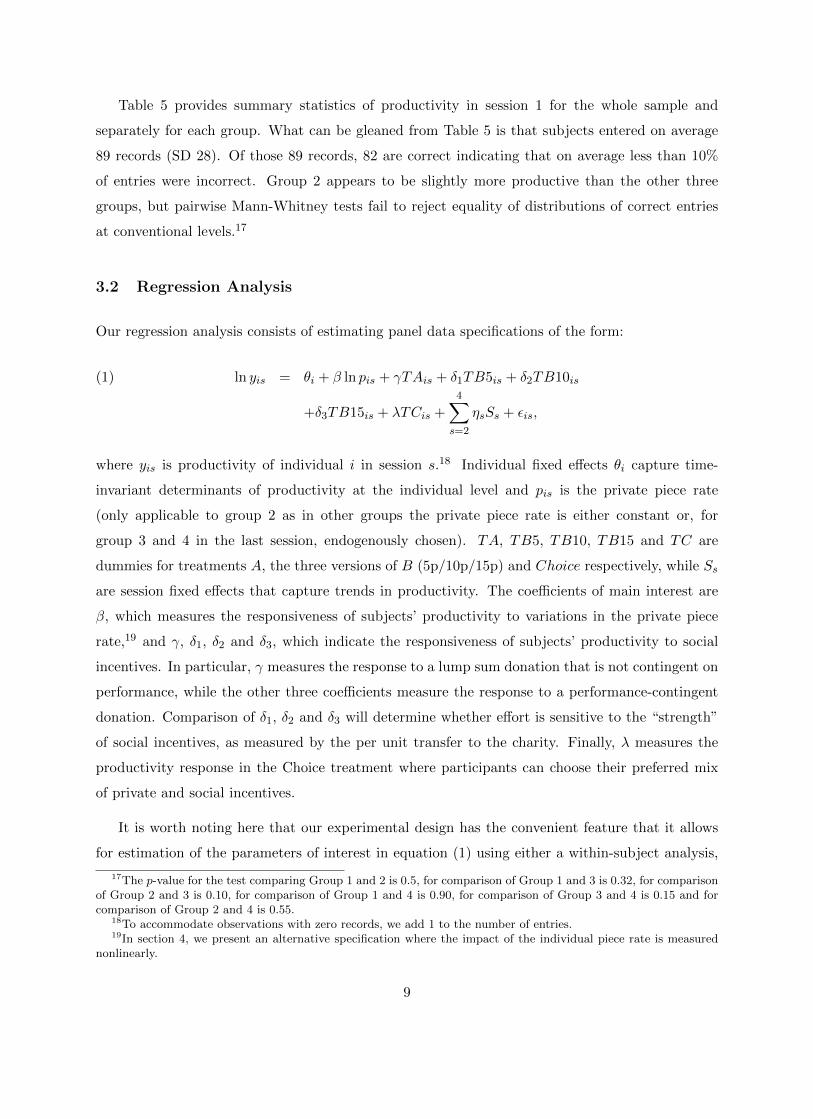
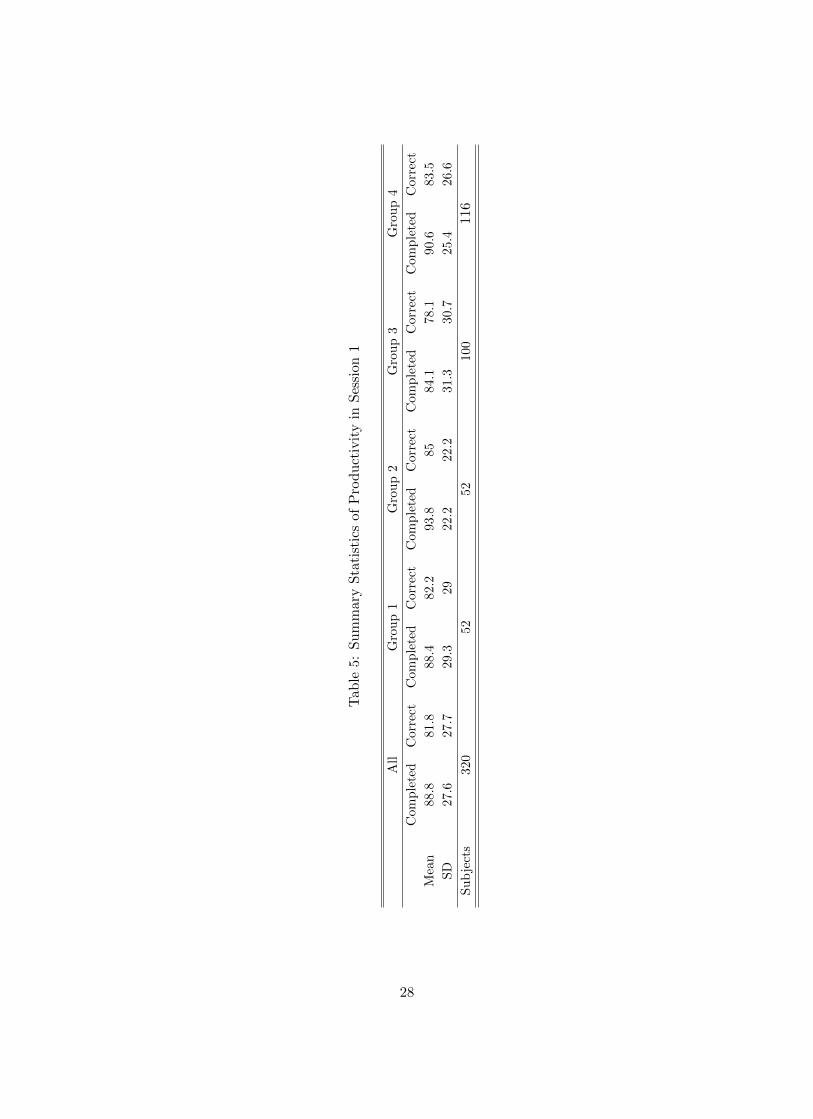
Table 5 provides summary statistics of productivity in session 1 for the whole sample and
separately for each group. What can be gleaned from Table 5 is that subjects entered on average
89 records (SD 28). Of those 89 records, 82 are correct indicating that on average less than 10%
of entries were incorrect. Group 2 appears to be slightly more productive than the other three
groups, but pairwise Mann-Whitney tests fail to reject equality of distributions of correct entries
at conventional levels.17
3.2 Regression Analysis
Our regression analysis consists of estimating panel data specifications of the form:
ln yis = θi + β ln pis + γTAis + δ1TB5is + δ2TB10is(1)
+δ3TB15is + λTCis +4∑s=2
ηsSs + εis,
where yis is productivity of individual i in session s.18 Individual fixed effects θi capture time-
invariant determinants of productivity at the individual level and pis is the private piece rate
(only applicable to group 2 as in other groups the private piece rate is either constant or, for
group 3 and 4 in the last session, endogenously chosen). TA, TB5, TB10, TB15 and TC are
dummies for treatments A, the three versions of B (5p/10p/15p) and Choice respectively, while Ss
are session fixed effects that capture trends in productivity. The coefficients of main interest are
β, which measures the responsiveness of subjects’ productivity to variations in the private piece
rate,19 and γ, δ1, δ2 and δ3, which indicate the responsiveness of subjects’ productivity to social
incentives. In particular, γ measures the response to a lump sum donation that is not contingent on
performance, while the other three coefficients measure the response to a performance-contingent
donation. Comparison of δ1, δ2 and δ3 will determine whether effort is sensitive to the “strength”
of social incentives, as measured by the per unit transfer to the charity. Finally, λ measures the
productivity response in the Choice treatment where participants can choose their preferred mix
of private and social incentives.
It is worth noting here that our experimental design has the convenient feature that it allows
for estimation of the parameters of interest in equation (1) using either a within-subject analysis,
17The p-value for the test comparing Group 1 and 2 is 0.5, for comparison of Group 1 and 3 is 0.32, for comparisonof Group 2 and 3 is 0.10, for comparison of Group 1 and 4 is 0.90, for comparison of Group 3 and 4 is 0.15 and forcomparison of Group 2 and 4 is 0.55.
18To accommodate observations with zero records, we add 1 to the number of entries.19In section 4, we present an alternative specification where the impact of the individual piece rate is measured
nonlinearly.
9
by making use of all 4 sessions, or a between-subject analysis, by restricting attention to sessions
1 and 2. In what follows we first present results making use of all the data that we have available
and then proceed to present the between-subject analysis to reassure that results are robust and
are not driven by interdependencies across treatments that may be present in the within-subject
design.
3.2.1 Baseline Results
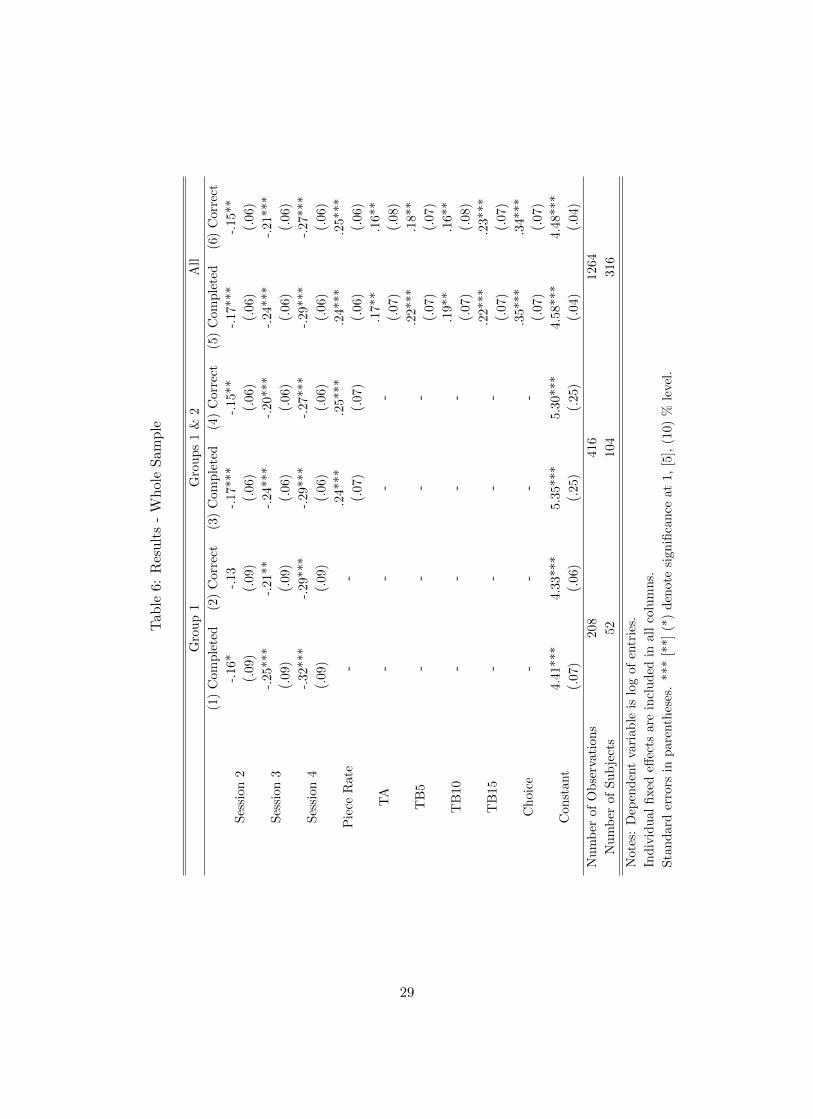
Table 6 presents our baseline results for both measures of productivity – correct and completed
number of entries. A first point of interest is to examine what is the productivity trend across
the four sessions. Restricting the analysis to observations from group 1, columns (1) and (2) of
Table 6, what we see is a substantial decline in productivity over time. In particular, comparing
productivity in session 4 to session 1 we see a reduction of around 30% in the number of tables
entered. This suggests that, absent any additional incentives, subjects’ enthusiasm on performing
the task waned over time. This pattern is not that surprising given that the task was tedious and
repetitive.
Using observations from groups 1 & 2, columns (3) and (4) of Table 6, allows us to provide an
estimate of the elasticity of output with respect to the private piece rate, net of any productivity
trend. The estimated elasticity is around 0.25 and statistically significant. This result is comparable
to estimates from previous studies using data from the field (e.g. Paarsch and Shearer, 2009).
Finally, columns (5) and (6) of Table 6 present results when we pool observations from all
groups.20 This allows us to estimate the effect of social incentives. What we see is that the coeffi-
cients on TA and the three different TBs are statistically significant and of the same magnitude.21
In particular, sessions where subjects are exposed to social incentives are associated with a roughly
20% rise in productivity. What emerges, then, is that social incentives are effective in motivating
subjects to supply higher effort, but that the specific form (lump sum or related to performance) or
strength (5p, 10p, 15p donation piece rate) of these incentives do not appear to matter. This result
is consistent with our earlier findings (Tonin and Vlassopoulos, 2010) and indicates, to borrow the
language used in the charitable donations literature (Andreoni, 1990), that warm glow rather than
pure altruism is the motivational driver behind the increase in productivity. Moreover, warm glow
20Notice that while the total number of subjects in our sample is 320, we use 316 instead whenever we analyzedata from all four sessions, because 4 participants indicated that they had made the wrong choice in the Choicetreatment, when deciding how to split the bonus between themselves and the charity. For instance, one kept 2p, butintended to keep 8p instead. However, the results are qualitatively the same when we include those 4 subjects.
21Performing a series of pairwise Wald tests, we fail to reject the null hypothesis that the coefficients are indeedidentical.
10
appears to depend on the presence of social incentives but not on their strength. Another possible
explanation for these results is that the employer’s act of making charitable contributions activates
a form of indirect positive reciprocity on the part of the worker. However, because higher effort is
more costly to the employer, it is a very imperfect instrument to reciprocate. More importantly,
the presence of any such type of indirect reciprocity is conditional on the worker being concerned
about the charity in the first instance and, thus, if it is present, it is at best a second order effect.
We also see a higher increase in productivity associated with the Choice Treatment (roughly
35%) as compared to TA and the three forms of TB, with the difference being statistically signif-
icant.22 We will discuss the implications of these results in the following sections. First, however,
we explore them further.
3.2.2 Between-subjects Analysis
As a robustness check for these baseline results, Table 7 reports the results when we limit the
analysis to observations obtained from sessions 1 and 2. This specification uses only the between-
subject variation - it is essentially a difference-in-differences estimation - to identify the parameters
in equation (1).23 That is, the between-subject analysis provides estimates of the parameters of
interest using information up to the point where subjects have been exposed to at most one change
in the compensation they face, compared to the baseline condition of being paid a 2.5p piece rate.
Reassuringly, the estimated parameters are very similar in terms of both significance and magnitude
to the ones above.24
In order to try to understand better who is driving the results reported above, in what follows
we perform some subgroup analysis.
3.2.3 Productivity Split
Table 8, presents results when we split our sample into high productivity (above median) and low
productivity (below median) subjects based on their performance (number of correct entries) in
session 1, that is, before the introduction of social incentives or variations in the private piece rate.
A very interesting pattern emerges from this split: low productivity subjects (columns 1 and 2 in
22The p-values of pairwise Wald tests for complete (correct) tables are: TA-Choice: 0.01 (0.01), TB5-Choice: 0.03(0.02), TB10-Choice: 0.01 (0.01), TB15-Choice: 0.04 (0.08).
23We cannot estimate λ, the parameter associated with the Choice treatment, as this treatment was introducedin the last session.
24Also in this case, by performing a series of pairwise Wald tests, we fail to reject the null hypothesis that theeffects of the various types of social incentives are identical.
11
Table 8) are very responsive to both private and social incentives, while high productivity subjects
(columns 3 and 4 in Table 8) are not.25,26 Again, for the low productivity subgroup, we cannot
reject the null that the coefficients measuring the impact of social incentives are identical. Notice
also that there is no trend in productivity for high productivity subjects, while low productivity ones
display a dramatic drop, with productivity in the last session being 60% lower than the first session.
Thus, it seems that high productivity subjects start at a high level and keep that level even without
additional incentives, while low productivity subjects start at a low level and drop even further if
no additional incentives are provided. This suggests that the difference in productivity between
the two groups is not due mostly to their skills (e.g. their ability to type), or their equipment
(e.g. the speed of their internet connection). If this were the case, then we would expect a similar
productivity trend across the two groups. Instead, subjects with productivity above and below the
median in the first session most likely differ in terms of their intrinsic motivation to perform the
job, with high productivity people being highly motivated individuals. For these individuals, there
is probably little room to further improve productivity, and, therefore, they appear not to respond
to incentives. Instead, both private and social incentives work very well in motivating those who
need to be motivated, that is, the low productivity (i.e. low motivation) subjects.
3.2.4 Temporal Profile of Effort
In this subsection we address the issue of whether the impact of incentives is lasting by looking at
the temporal profile of effort provided by subjects in our experiment. To this end, we split sessions
into two 30-minute blocks and perform the analysis separately for each block. What emerges from
this analysis is that the impact of incentives, both private and social, is present also in the second
block. If anything, what we see by comparing columns (1) to (3) and (2) to (4) of Table 9 is evidence
of incentives, both private and social, having a more pronounced effect on productivity in the second
block. The same is true for the choice treatment. This finding indicates that the estimated effects
of incentives reported above are not driven by a knee-jerk reaction to the insertion of a change in
compensation but have a lasting effect. Note also that the negative trend in productivity across
sessions appears to be stronger in the second block. This indicates that motivation to work is more
difficult to maintain in the second half of the session, either because of tiredness or boredom. Thus,
once again, what we see is that incentives work best when there is a need to boost motivation.
25The same overall picture emerges if we use completed tables instead of correct tables to define the two groups.The two definitions are very overlapping, with only 22 subjects switching between the high and low productivitygroups when changing the measure of productivity.
26Falk and Ichino (2006) also find evidence that the positive impact of peer pressure on productivity is larger atlow productivity levels.
12
3.2.5 Accuracy
In our experiment subjects can direct their effort towards two types of activity: one is to enter as
many records as possible (quantity), the other is to ensure that these entries are correct (quality).
As we tell subjects from the very beginning that their compensation will be based on correct entries,
there is no inherent trade-off between quantity and quality, still, subjects need to decide how to
allocate their effort between the two. Notice that during the session subjects receive continuous
feedback on the number of completed entries which is displayed on the screen, but not on the
number of correct entries which is revealed only at the payment stage, after all four sessions have
been completed. This means that subjects could check the quantity they produce very easily, while
they cannot observe the quality of what they produce.
Here we check whether different types of incentives have an impact on this decision. In particu-
lar, we examine whether incentives have an impact on the “accuracy” of subject’s work, defined as
the number of correct entries divided by the number of complete entries. In production processes
where the cost of mistakes is very high, this ratio is most likely of primary interest. In table 10 we
report results for all the specifications introduced so far when the dependent variable is “accuracy”,
as defined above. What we see is that there is no trend across sessions and that introducing social
incentives does not have any effect on accuracy. With regards to private incentives, there is an
effect on accuracy at the second half of each session, while there is no statistically significant overall
effect. Thus, while incentives are successful in boosting productivity, they do not appear to have
an impact on the degree of precision with which the task is executed.27
3.3 Selection
Aside from the pure incentive effects of monetary incentives the literature has highlighted the
importance of selection effects as being at least as important in terms of their impact on productivity
(Lazear, 2000; Dohmen and Falk, 2011). A typical finding is that more productive workers tend to
sort into incentive structures where pay is linked to performance. In this section we ask whether
any particular sorting pattern exists with regards to social incentives.
Recall that in session 4 we asked subjects in groups 3 and 4 to select how to split a piece rate of
10p between themselves and a charity of their choice. As it turned out, 52% of the subjects shared
some of the piece rate with a charity, and conditional on sharing subjects gave 3.7p to the charity.
27Linardi and McConnell (2011) also find that the social environment increases the quantity without affecting thequality of voluntary labor contributions.
13
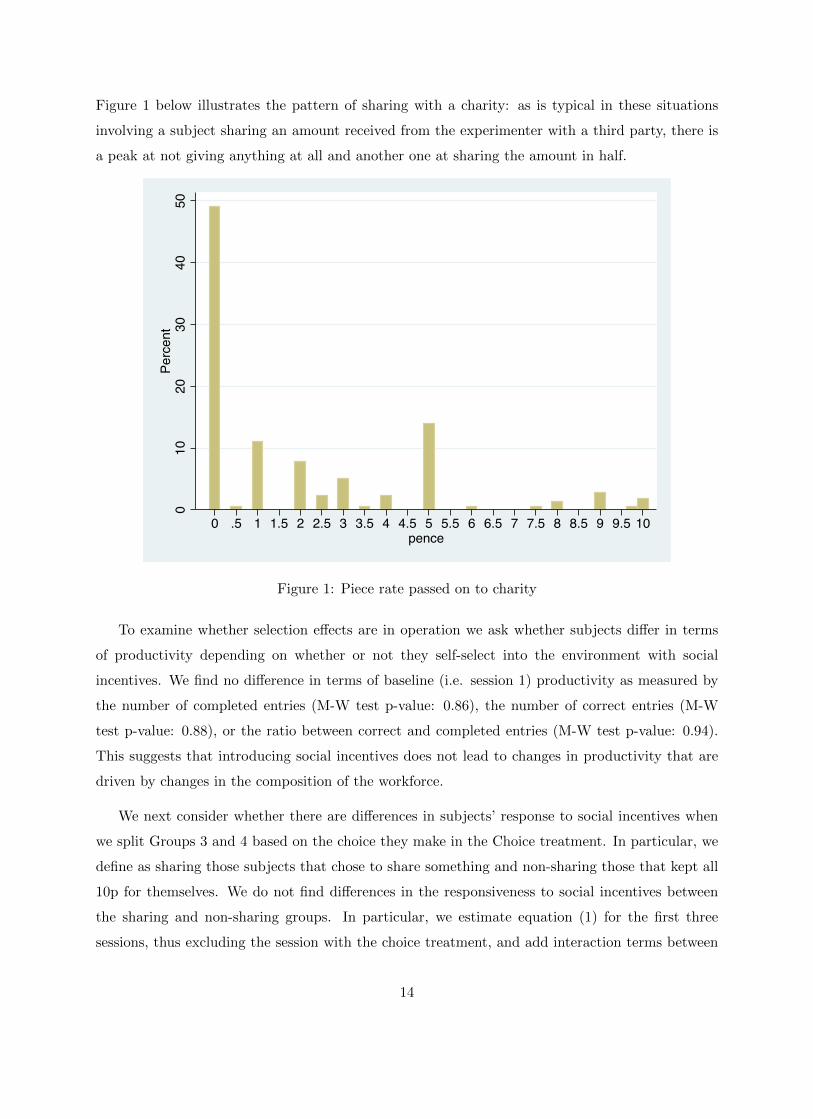
Figure 1 below illustrates the pattern of sharing with a charity: as is typical in these situations
involving a subject sharing an amount received from the experimenter with a third party, there is
a peak at not giving anything at all and another one at sharing the amount in half.
010
2030
4050
Percent
0 .5 1 1.5 2 2.5 3 3.5 4 4.5 5 5.5 6 6.5 7 7.5 8 8.5 9 9.5 10pence
Figure 1: Piece rate passed on to charity
To examine whether selection effects are in operation we ask whether subjects differ in terms
of productivity depending on whether or not they self-select into the environment with social
incentives. We find no difference in terms of baseline (i.e. session 1) productivity as measured by
the number of completed entries (M-W test p-value: 0.86), the number of correct entries (M-W
test p-value: 0.88), or the ratio between correct and completed entries (M-W test p-value: 0.94).
This suggests that introducing social incentives does not lead to changes in productivity that are
driven by changes in the composition of the workforce.
We next consider whether there are differences in subjects’ response to social incentives when
we split Groups 3 and 4 based on the choice they make in the Choice treatment. In particular, we
define as sharing those subjects that chose to share something and non-sharing those that kept all
10p for themselves. We do not find differences in the responsiveness to social incentives between
the sharing and non-sharing groups. In particular, we estimate equation (1) for the first three
sessions, thus excluding the session with the choice treatment, and add interaction terms between
14
the dummies associated with social incentives and a dummy equal to 1 if the subject decides to
share something in the choice treatment. None of these interaction terms is statistically significant
and we cannot reject the null that they are all equal to zero (p-value: 0.68 for complete entries,
p-value: 0.76 for correct entries).
One could have expected participants who, when given the opportunity (as in our session 4),
self-select into a compensation scheme embedding social incentives to be more responsive when
social incentives are exogenously introduced (as in our sessions 2 and 3) than participants who do
not. This turns out not to be the case and is consistent with a recent wave of studies (Andreoni,
Rao, and Trachtman, 2011; Della Vigna, List, and Malmendier, 2012; Lazear, Malmendier, and
Weber, 2012) in the context of charitable donations showing that people donate generously if they
are in a “giving” situation, even if, when given the opportunity, they prefer not to be in such
a situation. What our results indicate is that when the charitable contribution is made through
effort, there exists a group of individuals who raise their productivity when social incentives are
present, although they would prefer to avoid being in an environment with social incentives.
Finally, we look at difference in responsiveness to private incentives, depending on whether a
compensation based only on private incentives is chosen by subjects or exogenously imposed. To do
this, note that subjects who decide not to share anything in the Choice Treatment face a piece rate
of 10p in session 4. Some of the subjects in group 2 also face a 10p piece rate in the last session,
but in this case it has been exogenously imposed. What we find is that the impact on productivity
of the 10p piece rate is identical across the two groups,28 thus indicating the lack of selection in
term of responsiveness to private incentives.
3.4 Gender Differences
This subsection examines gender difference in responses to incentives and sorting patterns, in light
of the recent interest and experimental evidence of gender differences in social preferences (Croson
and Gneezy, 2009) and sorting into variable pay compensation schemes (Dohmen and Falk, 2011).
What we find is that women appear to be more likely to sort into an environment with social
incentives: 58% of women give and give on average 3.9p, while only 43% of men give and give on
average 3.4p. In fact, a Mann-Whitney test indicates that the there is a statistically significant
28In particular, we use observations for group 1, the subset of group 2 facing a 10p piece rate in session 4, and thesubset of groups 3 and 4 not sharing the piece rate in the Choice Treatment. We then estimate for sessions 1 and4 a specification including, besides an individual fixed effect and a dummy for session 4, a dummy for the ChoiceTreatment and a dummy for group 2. These two dummies indicate the impact on productivity of a 10p piece ratethat is chosen and that is exogenously imposed, respectively. A Wald test fails to reject the null that the impact isidentical (p-value for completed tables: 0.93, for correct tables: 0.97).
15
difference in the sharing distribution across genders (p-value=0.016).
When we look at gender specific differences in responses to private and social incentives by
adding to equation (1) interactions of the various treatments with a gender dummy, we find that
men exhibit a steeper reduction in productivity across sessions,29 are more responsive to the private
incentive, but there are no differences in the response to social incentives. Therefore, what we see is
that on one hand women are more likely to sort into an environment associated with a social benefit
at a personal financial cost, but on the other hand, when exogenously placed in such a position,
they are not more responsive than men. This is in line with the previous analysis on sorting.
4 Comparison Between Private and Social Incentives
In this section we compare the effect on productivity of private and social incentives. We start by
re-estimating a version of equation (1) in which instead of the log of the piece rate, we use, for
group 2, three dummies corresponding to the three different piece rates in sessions 2-4. This permits
estimation of the impact of increasing the piece rate from the baseline of 2.5p to 5p, 7.5p, and 10p
nonlinearly. In Table 2 we report the coefficients for these dummies (private 5p, 7.5p and 10p)
and the coefficients on the dummies for social incentives and the choice treatment, using correct
tables as the measure of productivity, for the whole sample and the high and low productivity
subsamples. The first thing to note is that the nonlinear estimates of the effect of private incentives
across subsamples are consistent with those from the baseline specification (1) previously reported.
In particular, subjects with high initial productivity do not respond to increases in the piece rate,
while the response is strong for low productivity subjects. Moreover, the estimated effects of private
incentives are indicative of a steep cost of effort function. To see this note that while there is a
considerable increase in productivity when raising the piece rate from 2.5p to 5p and from 5p to
7.5p, there is no further increase when raising the piece rate from 7.5p to 10p.30
Using these estimates, it is possible to compare quantitatively private and social incentives. In
particular, we want to understand by how much we would need to increase the private piece rate
to achieve the same increase in productivity that we observe when introducing social incentives.
29Notice that average productivity in the first session is similar among men and women. Men complete on average91 tables, of which 84 are correct. Women complete on average 87, of which 80 are correct. We cannot reject the nullthat average productivity or the distribution of productivity in the first session is the same among men and women(for completed tables: t-test p-value=0.12, MW test p-value=0.22; for correct tables: t-test p-value=0.30, MW testp-value=0.53).
30The p-values for pairwise Wald tests of equality are, for the whole sample, 0.048 for Private 5p - Private 7.5p,0.028 for Private 5p - Private 10p, and 0.83 for Private 7.5p - Private 10p. For the low productivity subsample, thecorresponding values are 0.08, 0.09, and 0.96.
16
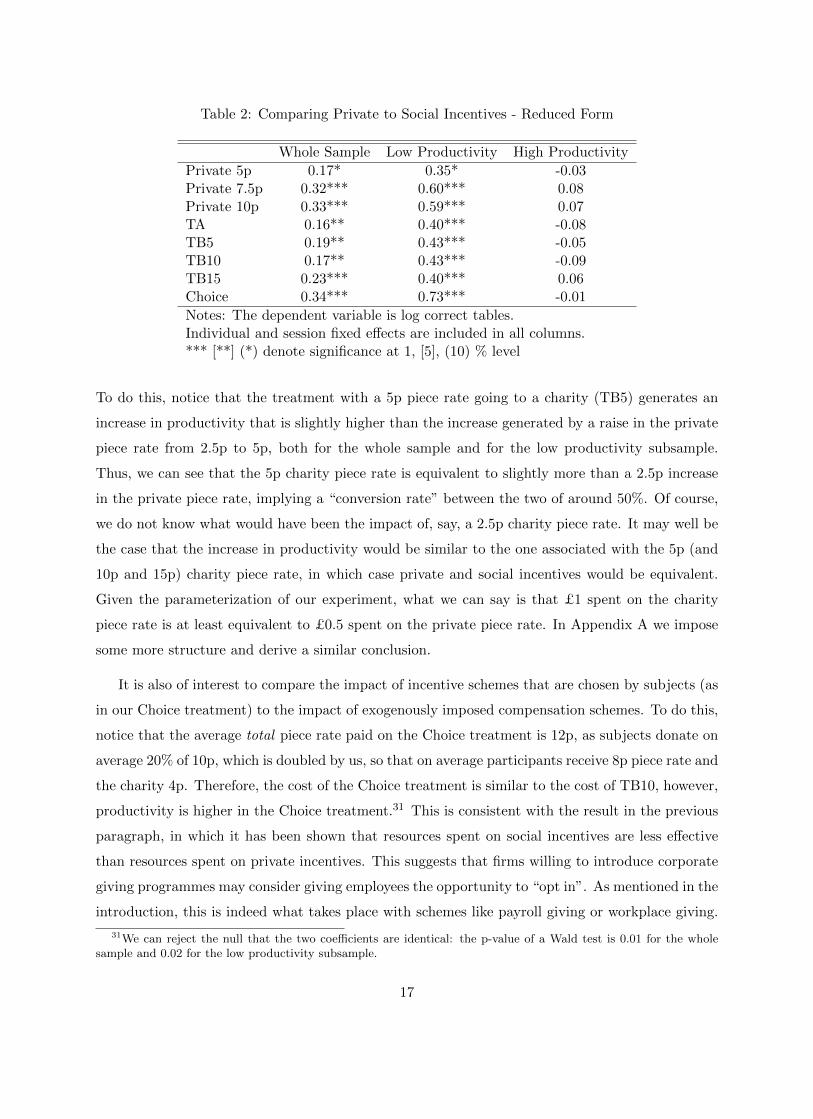
Table 2: Comparing Private to Social Incentives - Reduced Form
Whole Sample Low Productivity High Productivity
Private 5p 0.17* 0.35* -0.03Private 7.5p 0.32*** 0.60*** 0.08Private 10p 0.33*** 0.59*** 0.07TA 0.16** 0.40*** -0.08TB5 0.19** 0.43*** -0.05TB10 0.17** 0.43*** -0.09TB15 0.23*** 0.40*** 0.06Choice 0.34*** 0.73*** -0.01
Notes: The dependent variable is log correct tables.Individual and session fixed effects are included in all columns.*** [**] (*) denote significance at 1, [5], (10) % level
To do this, notice that the treatment with a 5p piece rate going to a charity (TB5) generates an
increase in productivity that is slightly higher than the increase generated by a raise in the private
piece rate from 2.5p to 5p, both for the whole sample and for the low productivity subsample.
Thus, we can see that the 5p charity piece rate is equivalent to slightly more than a 2.5p increase
in the private piece rate, implying a “conversion rate” between the two of around 50%. Of course,
we do not know what would have been the impact of, say, a 2.5p charity piece rate. It may well be
the case that the increase in productivity would be similar to the one associated with the 5p (and
10p and 15p) charity piece rate, in which case private and social incentives would be equivalent.
Given the parameterization of our experiment, what we can say is that £1 spent on the charity
piece rate is at least equivalent to £0.5 spent on the private piece rate. In Appendix A we impose
some more structure and derive a similar conclusion.
It is also of interest to compare the impact of incentive schemes that are chosen by subjects (as
in our Choice treatment) to the impact of exogenously imposed compensation schemes. To do this,
notice that the average total piece rate paid on the Choice treatment is 12p, as subjects donate on
average 20% of 10p, which is doubled by us, so that on average participants receive 8p piece rate and
the charity 4p. Therefore, the cost of the Choice treatment is similar to the cost of TB10, however,
productivity is higher in the Choice treatment.31 This is consistent with the result in the previous
paragraph, in which it has been shown that resources spent on social incentives are less effective
than resources spent on private incentives. This suggests that firms willing to introduce corporate
giving programmes may consider giving employees the opportunity to “opt in”. As mentioned in the
introduction, this is indeed what takes place with schemes like payroll giving or workplace giving.
31We can reject the null that the two coefficients are identical: the p-value of a Wald test is 0.01 for the wholesample and 0.02 for the low productivity subsample.
17
In the UK, for instance, many firms give the opportunity to employees to make tax-free donations
to their chosen charities, often with matched employee contributions. According to figures by the
Payroll Giving Centre, in 2010/11 more than 720,000 employees participated in the scheme,32 while
in the US a survey by the Center on Philanthropy at Indiana University (undated) finds that in
2008-2009 36% of full-time employees worked at a company offering some type of worplace giving
campaign, with 54% of those asked to give actually donating.
5 Discussion and Concluding Remarks
Social incentives are pervasive in organizations in the public and nonprofit sector and are becoming
increasingly a feature in the private sector through firms engagement in CSR policies. This paper
estimates a significant impact of social incentives on subjects’ performance on an online data entry
task. Our results provide empirical support for the growing recognition that workers have an
interest in advancing social causes through their effort.
As in any experimental setting, or more generally in any empirical research (Falk and Heckman,
2009), there is of course a concern about the generalizability of the results. One important concern
is the fact that participants are university students and therefore not representative of the general
population. In the context of our experiment, two things need to be pointed out. The first one is
that several studies have documented how non-students are generally more prosocially inclined than
students (see for instance Falk, et al., 2011; Cappelen et al., 2011; Belot et al., 2010) and, therefore,
our results may represent a lower bound estimate of the effect of social incentives for the population
in general. The second thing is that the student population may actually be of particular interest as
companies compete to attract the brightest graduates, for instance, by participating in recruitment
fairs at universities, and the fact that a CSR policy may represent an advantage in this contest is
an issue that the business literature mentioned in the introduction has highlighted. Regarding this
last point the fact that students participating in experiments have been found to be similar to the
rest of the student population in terms of their prosocial preferences (Falk et al., 2011; Cleave et
al., 2010) makes us confident that our results are not biased by selection into participating in an
experiment.
Our results indicate that social incentives may be less effective than private incentives in moti-
vating workers, but the difference is not as large as one might have expected. A sufficient degree of
tax incentives, or sufficient additional advantages coming from customers, regulators, or investors,
32www.payrollgivingcentre.com/facts figures.htm [consulted on 22 June 2012].
18
would make social incentives comparable to private incentives. Also, one could expect social incen-
tives to become increasingly more effective in motivating employees relative to private incentives
as earnings increase and the marginal utility of money decreases. This may be one of the reasons
behind the increasing importance of CSR policies. For instance, in a survey (Economist Intelligence
Unit, 2007), 34% of corporate executives indicated that CSR was a high or very high priority for
their firms three years earlier, compared to 55% saying so with regard to the present and almost
70% expressing their expectations on how high a priority it will be three years hence. Social incen-
tives may be particularly useful also in environments where private incentives are more difficult to
implement or may have detrimental effects, for instance in teams (Fuster and Meier, 2010). This
aspect deserves to be explored in future research.
Finally, our finding that women have a higher likelihood to self-select into environments with
social incentives may go some way in explaining the observed occupational segregation by gender,
that accounts for a substantial portion of the overall gender earnings gap (Gunderson, 1989). If
women have a preference to enter occupations and sectors that engender social incentives like health,
education and social care, then precisely because of the presence of these social incentives, these
occupations and sectors may require less monetary compensation.
References
[1] Akerlof, G. (1982): Labor Contracts as Partial Gift Exchange, Quarterly Journal of Economics,
97(4), 543-69.
[2] Andreoni, J. (1990): Impure Altruism and Donations to Public Goods: a Theory of Warm
Glow Giving, Economic Journal, 100(401), 464–477.
[3] Andreoni, J., Rao, J.M., and Trachtman, H. (2011): Avoiding The Ask: A Field Experiment
on Altruism, Empathy, and Charitable Giving, memo.
[4] Ashraf, N., Bandiera, O., and Jack, K. (2012): No Margin, no Mission? A Field Experiment
on Incentives for Pro-Social Tasks, CEPR Discussion Papers 8834.
[5] Bandiera, O., Barankay, I., and Rasul, I. (2005): Social Preferences and the Response to
Incentives: Evidence from Personnel Data, Quarterly Journal of Economics, 120(3), 917-962.
[6] Bandiera, O., Barankay, I., and Rasul, I. (2010): Social Incentives in the Workplace, Review
of Economic Studies, 77(2), 417-59.
19
[7] Belot, M., Duch, R., and Miller, L. (2010): Who should be called to the lab? A comprehensive
comparison of students and non-students in classic experimental games, Discussion Papers
2010-001, University of Oxford.
[8] Benabou, R., and Tirole, J. (2010): Individual and Corporate Social Responsibility, Econom-
ica, 77(305), 1-19.
[9] Besley, T., and Ghatak, M. (2005): Competition and Incentives with Motivated Agents, Amer-
ican Economic Review, 95(3), 616–636.
[10] Bureau of Labor Statistics (2011): American Time Use Survey – 2010 Results, News Release,
June 22, 2011.
[11] Cappelen, A., K. Nygaard, E., Srensen and Tungodden, B. (2011):‘ Social Preferences in the
Lab: A Comparison of Students and a Representative Population, CESifo Working Paper
Series 3511.
[12] Casadesus-Masanell, R., M. Crooke, F. Reinhardt, and Vasishth, V. (2009): Households’ Will-
ingness to Pay for Green Goods: Evidence from Patagonia’s Introduction of Organic Cotton
Sportswear, Journal of Economics and Management Strategy, 18(1), 203-233.
[13] Center on Philanthropy (undated): Next Generation Workplace Campaigns - Executive Sum-
mary, www.philanthropy.iupui.edu/workplacegiving.
[14] Cleave, B. L., N. Nikiforakis, and Slonim, R. (2010): Is There Selection Bias in Laboratory
Experiments? Department of Economics - Working Papers Series 1106, The University of
Melbourne.
[15] Croson, R., and Gneesy, U. (2009): Gender Differences in Preferences, Journal of Economics
Literature, 47(2), 1-27.
[16] Delfgaauw, J., and Dur, R. (2007): Signaling and Screening of Workers’ Motivation, Journal
of Economic Behavior and Organization, 62(4), 605-624.
[17] Delfgaauw, J., and Dur, R. (2008): Incentives and Workers’ Motivation in the Public Sector,
Economic Journal, 118(525), 171-191.
[18] DellaVigna, S., J. A. List, and Malmendier U. (2012): Testing for Altruism and Social Pressure
in Charitable Giving, Quarterly Journal of Economics, 127(1), 1-56.
20
[19] Dohmen, T., and Falk, A. (2011): Performance Pay and Multi-Dimensional Sorting: Produc-
tivity, Preferences and Gender, American Economic Review, 101(2), 556-590.
[20] Economist Intelligence Unit (2007): Global Business Barometer.
[21] Elfenbein, D. W., and McManus, B. (2010): A Greater Price for a Greater Good? Evidence
That Consumers Pay More for Charity-Linked Products, American Economic Journal: Eco-
nomic Policy, 2(2), 28-60.
[22] Evans, W.R, and Davis, W. D. (2011): An Examination of Perceived Corporate Citizenship,
Job Applicant Attraction, and CSR Work Role Definition, Business & Society, 50(3), 456-480.
[23] Falk, A., and Heckman, J. (2009): Lab Experiments Are a Major Source of Knowledge in the
Social Sciences, Science, 326(5952), 535-538.
[24] Falk, A., and Ichino, A. (2006): Clean Evidence on Peer Effects, Journal of Labor Economics,
24(1), 39–57.
[25] Falk A., S. Meier, and Zehnder, C., (2011): Do Lab Experiments Misrepresent Social Prefer-
ences? The case of self-selected student samples, Journal of the European Economic Associa-
tion, forthcoming.
[26] Fehr, E., G. Kirchsteiger, and Riedl, A. (1993): Does Fairness Prevent Market Clearing? An
Experimental Investigation. Quarterly Journal of Economics, 108(2), 437-459
[27] Fehr, E., and Schmidt, K. M. (2006): “The Economics of Fairness, Reciprocity and Altruism:
Experimental Evidence,” in Handbook of the Economics of Giving, Altruism and Reciprocity,
Vol. 1, ed. by S. Kolm and J. M. Ythier. North Holland, New York.
[28] Fehrler, S., and Kosfeld, M. (2012): Pro-Social Missions and Worker Motivation: An Experi-
mental Study, IZA Discussion Paper No. 6460.
[29] Francois, P. (2000): ‘Public Service Motivation’ as an Argument for Government Provision,
Journal of Public Economics, 78(3), 275–299.
[30] Francois, P. (2007): Making a Difference, RAND Journal of Economics, 38(3), 714-732.
[31] Freeman, R. and Kleiner, M. (2005): The Last American Shoe Manufacturers: Decreasing Pro-
ductivity and Increasing Profits in the Shift from Piece Rates to Continuous Flow Production,
Industrial Relations, 44(2), 307-330.
21
[32] Fuster, A. and Meier, S. (2010): Another Hidden Cost of Incentives: The Detrimental Effect
on Norm Enforcement, Management Science, 56(1), 57-70.
[33] Gneezy, U., and Rey-Biel, P. (2011): On the Relative Efficiency of Performance Pay and Social
Incentives, mimeo.
[34] Gregg, P., Grout, P. A., Ratcliffe, A., Smith, S., and Windmeijer, F. (2011): How important is
pro-social behaviour in the delivery of public services?, Journal of Public Economics, 95(7–8),
758-766.
[35] Gunderson, M., (1989): Male-female wage differentials and policy responses, Journal of Eco-
nomic Literature, 27, 46-72.
[36] Holmstrom, B. and Milgrom, P. (1991): Multitask Principal-Agent Analyses: Incentive Con-
tracts, Asset Ownership, and Job Design, Journal of Law, Economics and Organization, 7(0),
24-52.
[37] Hong, H. and Kacperczyk, M. (2009): The price of sin: The effects of social norms on markets,
Journal of Financial Economics, 93(1), 15-36.
[38] Kim, M. and Slonim, R. (2012) The Multi-Dimensional Effects of Reciprocity on Worker Effort:
Evidence from a Hybrid Field-Laboratory Labor Market Experiment, IZA Discussion Papers
6410.
[39] Kitzmueller, M. and Shimshack, J. (2012): Economic Perspectives on Corporate Social Re-
sponsibility, Journal of Economic Literature, 50(1), 51-84.
[40] Koppel, H. and Regner, T. (2012): Corporate Social Responsibility in the work place - Exper-
imental evidence on CSR from a gift-exchange game, Jena Economic Research Papers 2011 -
030.
[41] Kosfeld, M. and Neckermann, S. (2011): Getting More Work for Nothing? Symbolic Awards
and Worker Performance, American Economic Journal: Microeconomics, 3(3), 86-99.
[42] Lazear, E. P. (2000): Performance Pay and Productivity, American Economic Review, 90(5),
1346-61.
[43] Lazear, E. P., U. Malmendier, and Weber R. A. (2012): Sorting in Experiments with Appli-
cation to Social Preferences, American Economic Journal: Applied Economics, 4(1), 136-63.
22
[44] Linardi, S. and McConnell, M. A. (2011): No Excuses for Good Behavior: Volunteering and
the Social Environment, Journal of Public Economics, 95(5-6), 445-454.
[45] Mas, A., and Moretti, E. (2009): Peers at Work, American Economic Review, 99(1), 112-145.
[46] Paarsch, H. J. and Shearer, B. S. (2009): The Response to Incentives and Contractual Effi-
ciency: Evidence from a Field Experiment, European Economic Review, 53(5), 481-494.
[47] Shearer, B. S. (2004): Piece Rates, Fixed Wages and Incentives: Evidence From a Field
Experiment, Review of Economic Studies, 71(2), 513-34.
[48] Stites, J. P., and Michael, J. H. (2011): Organizational Commitment in Manufacturing Em-
ployees: Relationships With Corporate Social Performance, Business & Society, 50(1), 50-70.
[49] Tonin, M., and Vlassopoulos, M. (2010): Disentangling the Sources of Prosocially Motivated
Effort: A Field Experiment, Journal of Public Economics, 94(11-12), 1086-1092.
23
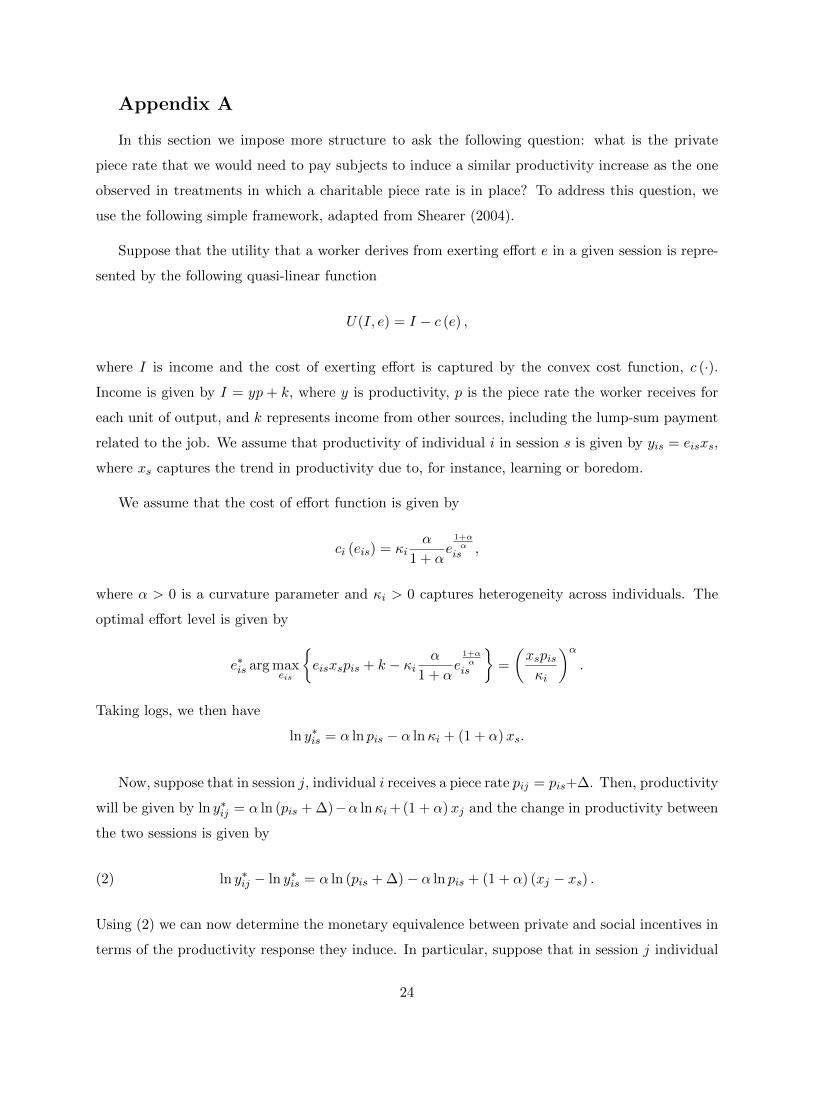
Appendix A
In this section we impose more structure to ask the following question: what is the private
piece rate that we would need to pay subjects to induce a similar productivity increase as the one
observed in treatments in which a charitable piece rate is in place? To address this question, we
use the following simple framework, adapted from Shearer (2004).
Suppose that the utility that a worker derives from exerting effort e in a given session is repre-
sented by the following quasi-linear function
U(I, e) = I − c (e) ,
where I is income and the cost of exerting effort is captured by the convex cost function, c (·).
Income is given by I = yp + k, where y is productivity, p is the piece rate the worker receives for
each unit of output, and k represents income from other sources, including the lump-sum payment
related to the job. We assume that productivity of individual i in session s is given by yis = eisxs,
where xs captures the trend in productivity due to, for instance, learning or boredom.
We assume that the cost of effort function is given by
ci (eis) = κiα
1 + αe
1+αα
is ,
where α > 0 is a curvature parameter and κi > 0 captures heterogeneity across individuals. The
optimal effort level is given by
e∗is arg maxeis
{eisxspis + k − κi
α
1 + αe
1+αα
is
}=
(xspisκi
)α.
Taking logs, we then have
ln y∗is = α ln pis − α lnκi + (1 + α)xs.
Now, suppose that in session j, individual i receives a piece rate pij = pis+∆. Then, productivity
will be given by ln y∗ij = α ln (pis + ∆)−α lnκi+(1 + α)xj and the change in productivity between
the two sessions is given by
(2) ln y∗ij − ln y∗is = α ln (pis + ∆) − α ln pis + (1 + α) (xj − xs) .
Using (2) we can now determine the monetary equivalence between private and social incentives in
terms of the productivity response they induce. In particular, suppose that in session j individual
24
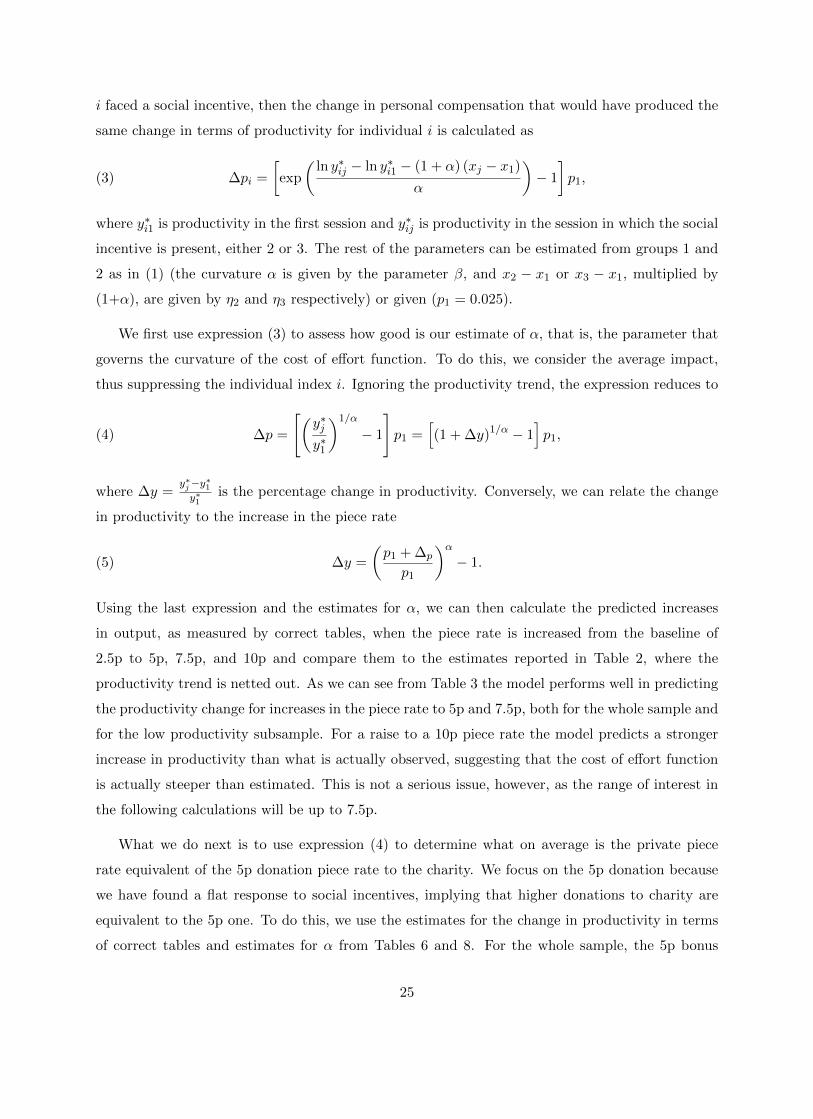
i faced a social incentive, then the change in personal compensation that would have produced the
same change in terms of productivity for individual i is calculated as
(3) ∆pi =
[exp
(ln y∗ij − ln y∗i1 − (1 + α) (xj − x1)
α
)− 1
]p1,
where y∗i1 is productivity in the first session and y∗ij is productivity in the session in which the social
incentive is present, either 2 or 3. The rest of the parameters can be estimated from groups 1 and
2 as in (1) (the curvature α is given by the parameter β, and x2 − x1 or x3 − x1, multiplied by
(1+α), are given by η2 and η3 respectively) or given (p1 = 0.025).
We first use expression (3) to assess how good is our estimate of α, that is, the parameter that
governs the curvature of the cost of effort function. To do this, we consider the average impact,
thus suppressing the individual index i. Ignoring the productivity trend, the expression reduces to
(4) ∆p =
[(y∗jy∗1
)1/α
− 1
]p1 =
[(1 + ∆y)1/α − 1
]p1,
where ∆y =y∗j−y∗1y∗1
is the percentage change in productivity. Conversely, we can relate the change
in productivity to the increase in the piece rate
(5) ∆y =
(p1 + ∆p
p1
)α− 1.
Using the last expression and the estimates for α, we can then calculate the predicted increases
in output, as measured by correct tables, when the piece rate is increased from the baseline of
2.5p to 5p, 7.5p, and 10p and compare them to the estimates reported in Table 2, where the
productivity trend is netted out. As we can see from Table 3 the model performs well in predicting
the productivity change for increases in the piece rate to 5p and 7.5p, both for the whole sample and
for the low productivity subsample. For a raise to a 10p piece rate the model predicts a stronger
increase in productivity than what is actually observed, suggesting that the cost of effort function
is actually steeper than estimated. This is not a serious issue, however, as the range of interest in
the following calculations will be up to 7.5p.
What we do next is to use expression (4) to determine what on average is the private piece
rate equivalent of the 5p donation piece rate to the charity. We focus on the 5p donation because
we have found a flat response to social incentives, implying that higher donations to charity are
equivalent to the 5p one. To do this, we use the estimates for the change in productivity in terms
of correct tables and estimates for α from Tables 6 and 8. For the whole sample, the 5p bonus
25
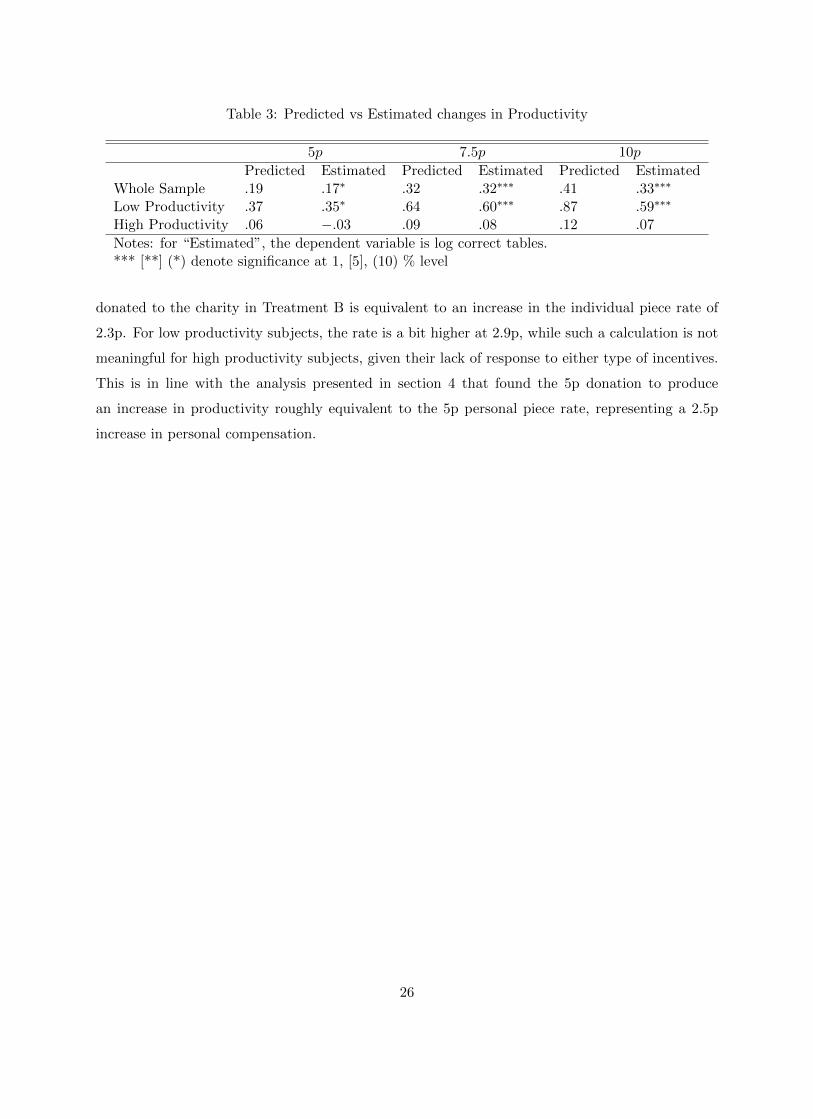
Table 3: Predicted vs Estimated changes in Productivity
5p 7.5p 10p
Predicted Estimated Predicted Estimated Predicted EstimatedWhole Sample .19 .17∗ .32 .32∗∗∗ .41 .33∗∗∗
Low Productivity .37 .35∗ .64 .60∗∗∗ .87 .59∗∗∗
High Productivity .06 −.03 .09 .08 .12 .07
Notes: for “Estimated”, the dependent variable is log correct tables.*** [**] (*) denote significance at 1, [5], (10) % level
donated to the charity in Treatment B is equivalent to an increase in the individual piece rate of
2.3p. For low productivity subjects, the rate is a bit higher at 2.9p, while such a calculation is not
meaningful for high productivity subjects, given their lack of response to either type of incentives.
This is in line with the analysis presented in section 4 that found the 5p donation to produce
an increase in productivity roughly equivalent to the 5p personal piece rate, representing a 2.5p
increase in personal compensation.
26
Appendix B - Tables
Table 4: Responses to Procedures Questionnaire
Panel AQuestion Mean
1. The money you passed to the Charity will be sent to the charity 3.92. The instructions about the task were clear and easy to follow 4.43. The instructions about my compensation were clear and easy to follow 4.24. The recipients of donations to the Charity are deserving of support 4.2
Note: Answers ranging between 1 (Strongly Disagree) and 5 (StronglyAgree).
Panel BQuestion Percentage
5. Where did you perform the task? Indicate the response that best applies to you:Always at home
Always at the UniversitySome sessions at home, some sessions at the University
72.9%6.8%20.3%
6. With whom did you perform the task? Indicate the response that best applies to you.Always alone
Always in the presence of othersSome sessions alone, some sessions in the presence of others
79.9%3.6%16.5%
7. Did you perform the task on the same computer in all four sessions or on different machines?On the same computer in all four sessions
On different machines77.2%22.8%
27
Tab
le5:
Su
mm
ary
Sta
tist
ics
ofP
rod
uct
ivit
yin
Ses
sion
1
All
Gro
up
1G
rou
p2
Gro
up
3G
rou
p4
Com
ple
ted
Cor
rect
Com
ple
ted
Corr
ect
Com
ple
ted
Corr
ect
Com
ple
ted
Corr
ect
Com
ple
ted
Corr
ect
Mea
n88
.881
.888.4
82.2
93.8
85
84.1
78.
190.6
83.5
SD
27.6
27.7
29.3
29
22.2
22.2
31.3
30.
725.4
26.6
Su
bje
cts
320
52
52
100
116
28
Tab
le6:
Res
ult
s-
Wh
ole
Sam
ple
Gro
up
1G
rou
ps
1&
2A
ll
(1)
Com
ple
ted
(2)
Corr
ect
(3)
Com
ple
ted
(4)
Corr
ect
(5)
Com
ple
ted
(6)
Corr
ect
Ses
sion
2-.
16*
(.09)
-.13
(.09)
-.17***
(.06)
-.15**
(.06)
-.17
***
(.06)
-.15**
(.06)
Ses
sion
3-.
25***
(.09)
-.21**
(.09)
-.24***
(.06)
-.20***
(.06)
-.24***
(.06)
-.21***
(.06)
Ses
sion
4-.
32***
(.09)
-.29***
(.09)
-.29***
(.06)
-.27***
(.06)
-.29
***
(.06)
-.27***
(.06)
Pie
ceR
ate
--
.24***
(.07)
.25***
(.07)
.24***
(.06)
.25***
(.06)
TA
--
--
.17**
(.07)
.16**
(.08)
TB
5-
--
-.2
2***
(.07)
.18**
(.07)
TB
10-
--
-.1
9**
(.07)
.16**
(.08)
TB
15-
--
-.2
2***
(.07)
.23***
(.07)
Ch
oice
--
--
.35*
**
(.07)
.34***
(.07)
Con
stan
t4.
41***
(.07)
4.3
3***
(.06)
5.3
5***
(.25)
5.3
0***
(.25)
4.5
8***
(.04)
4.4
8***
(.04)
Nu
mb
erof
Ob
serv
atio
ns
208
416
1264
Nu
mb
erof
Su
bje
cts
52
104
316
Not
es:
Dep
end
ent
vari
able
islo
gof
entr
ies.
Ind
ivid
ual
fixed
effec
tsar
ein
clu
ded
inall
colu
mn
s.
Sta
nd
ard
erro
rsin
par
enth
eses
.***
[**]
(*)
den
ote
sign
ifica
nce
at
1,
[5],
(10)
%le
vel.
29
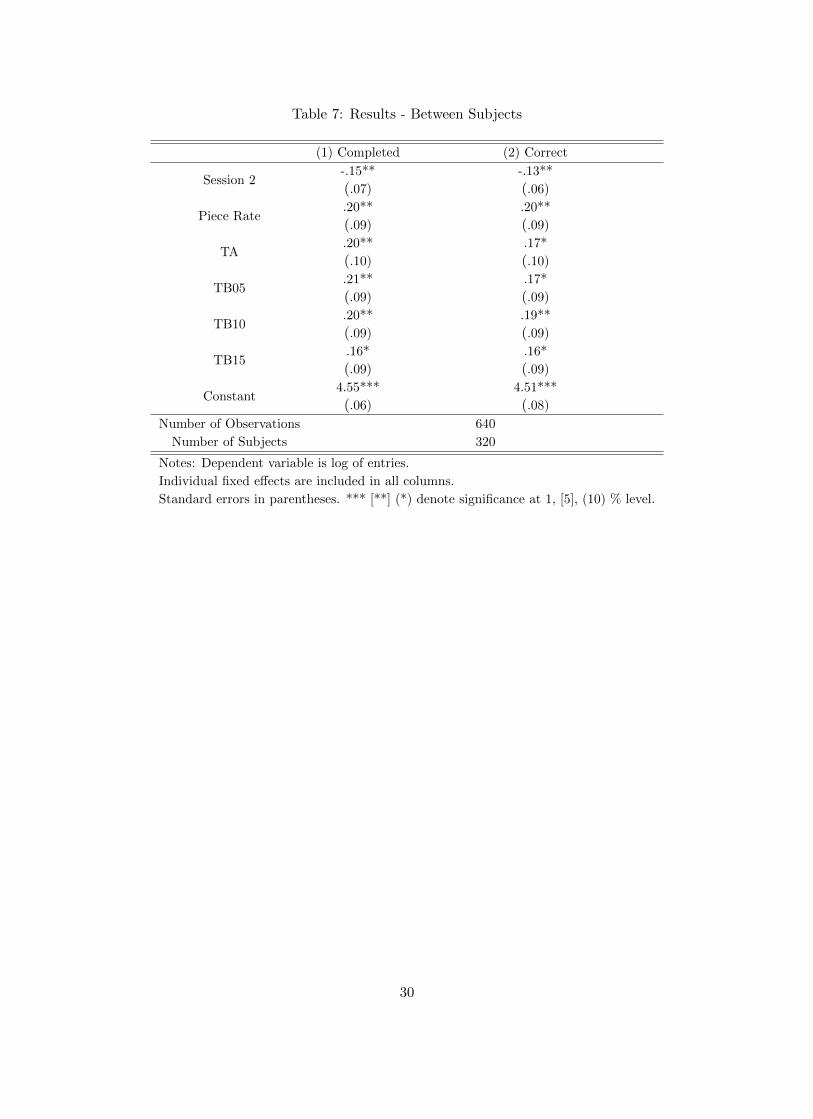
Table 7: Results - Between Subjects
(1) Completed (2) Correct
Session 2-.15**
(.07)
-.13**
(.06)
Piece Rate.20**
(.09)
.20**
(.09)
TA.20**
(.10)
.17*
(.10)
TB05.21**
(.09)
.17*
(.09)
TB10.20**
(.09)
.19**
(.09)
TB15.16*
(.09)
.16*
(.09)
Constant4.55***
(.06)
4.51***
(.08)
Number of Observations 640
Number of Subjects 320
Notes: Dependent variable is log of entries.
Individual fixed effects are included in all columns.
Standard errors in parentheses. *** [**] (*) denote significance at 1, [5], (10) % level.
30
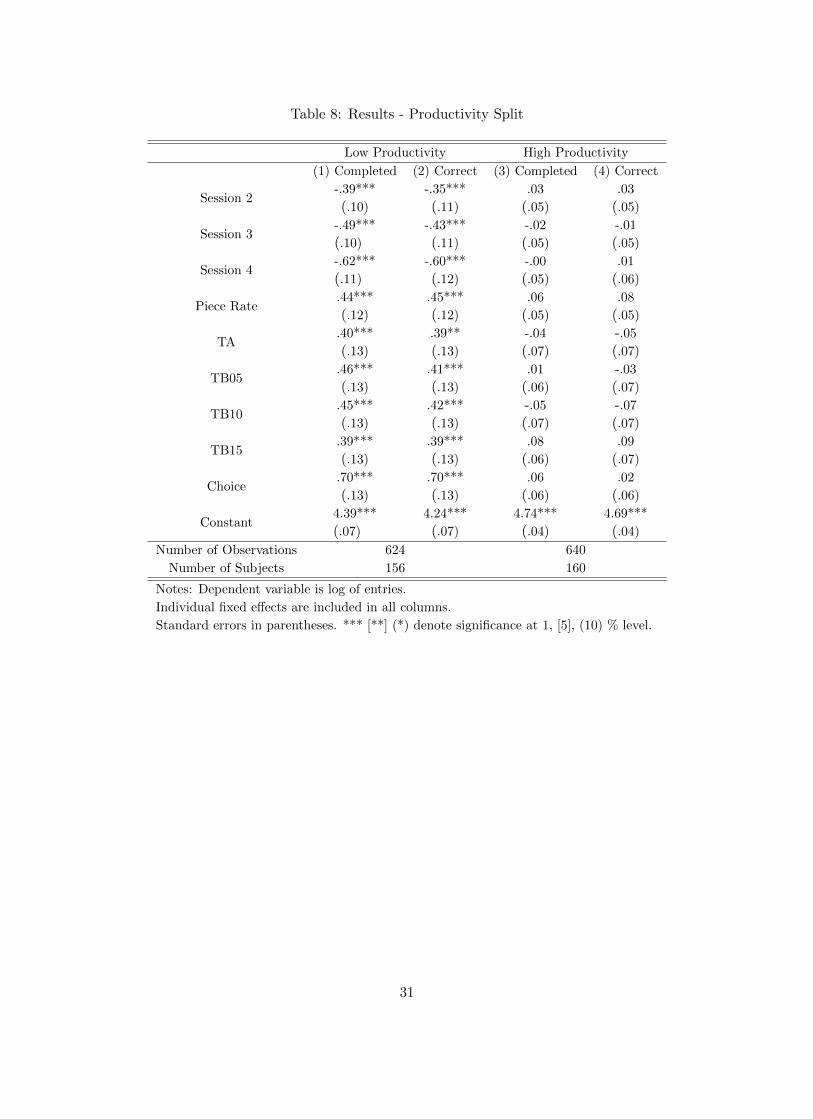
Table 8: Results - Productivity Split
Low Productivity High Productivity
(1) Completed (2) Correct (3) Completed (4) Correct
Session 2-.39***
(.10)
-.35***
(.11)
.03
(.05)
.03
(.05)
Session 3-.49***
(.10)
-.43***
(.11)
-.02
(.05)
-.01
(.05)
Session 4-.62***
(.11)
-.60***
(.12)
-.00
(.05)
.01
(.06)
Piece Rate.44***
(.12)
.45***
(.12)
.06
(.05)
.08
(.05)
TA.40***
(.13)
.39**
(.13)
-.04
(.07)
-.05
(.07)
TB05.46***
(.13)
.41***
(.13)
.01
(.06)
-.03
(.07)
TB10.45***
(.13)
.42***
(.13)
-.05
(.07)
-.07
(.07)
TB15.39***
(.13)
.39***
(.13)
.08
(.06)
.09
(.07)
Choice.70***
(.13)
.70***
(.13)
.06
(.06)
.02
(.06)
Constant4.39***
(.07)
4.24***
(.07)
4.74***
(.04)
4.69***
(.04)
Number of Observations 624 640
Number of Subjects 156 160
Notes: Dependent variable is log of entries.
Individual fixed effects are included in all columns.
Standard errors in parentheses. *** [**] (*) denote significance at 1, [5], (10) % level.
31
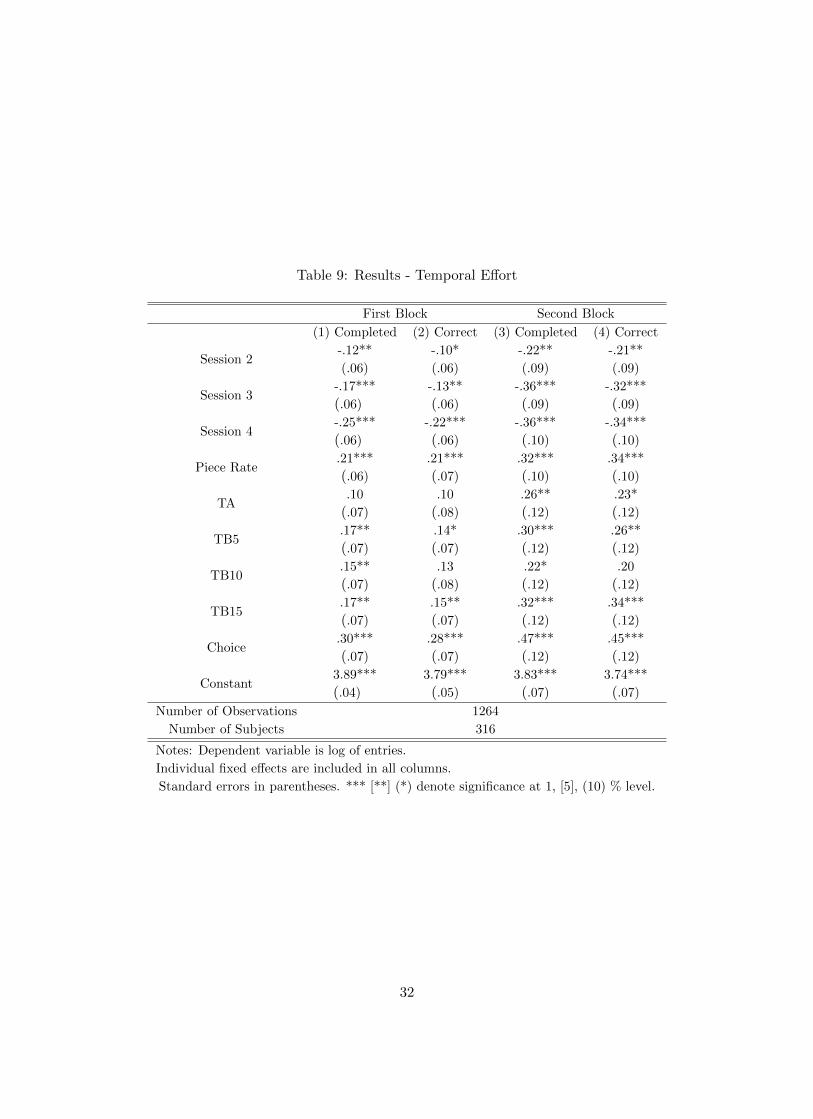
Table 9: Results - Temporal Effort
First Block Second Block
(1) Completed (2) Correct (3) Completed (4) Correct
Session 2-.12**
(.06)
-.10*
(.06)
-.22**
(.09)
-.21**
(.09)
Session 3-.17***
(.06)
-.13**
(.06)
-.36***
(.09)
-.32***
(.09)
Session 4-.25***
(.06)
-.22***
(.06)
-.36***
(.10)
-.34***
(.10)
Piece Rate.21***
(.06)
.21***
(.07)
.32***
(.10)
.34***
(.10)
TA.10
(.07)
.10
(.08)
.26**
(.12)
.23*
(.12)
TB5.17**
(.07)
.14*
(.07)
.30***
(.12)
.26**
(.12)
TB10.15**
(.07)
.13
(.08)
.22*
(.12)
.20
(.12)
TB15.17**
(.07)
.15**
(.07)
.32***
(.12)
.34***
(.12)
Choice.30***
(.07)
.28***
(.07)
.47***
(.12)
.45***
(.12)
Constant3.89***
(.04)
3.79***
(.05)
3.83***
(.07)
3.74***
(.07)
Number of Observations 1264
Number of Subjects 316
Notes: Dependent variable is log of entries.
Individual fixed effects are included in all columns.
Standard errors in parentheses. *** [**] (*) denote significance at 1, [5], (10) % level.
32
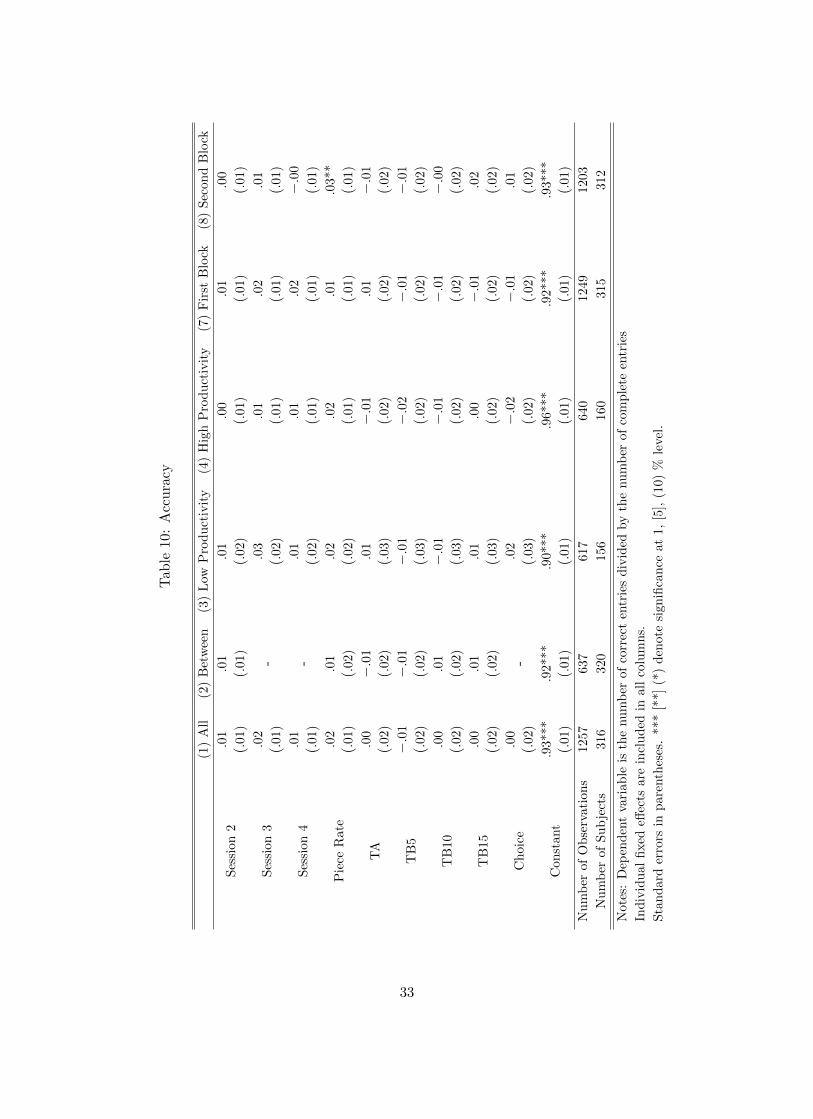
Tab
le10
:A
ccu
racy
(1)
All
(2)
Bet
wee
n(3
)L
owP
rod
uct
ivit
y(4
)H
igh
Pro
du
ctiv
ity
(7)
Fir
stB
lock
(8)
Sec
on
dB
lock
Ses
sion
2.0
1
(.01
)
.01
(.01)
.01
(.02)
.00
(.01)
.01
(.01)
.00
(.01)
Ses
sion
3.0
2
(.01
)-
.03
(.02)
.01
(.01)
.02
(.01)
.01
(.01)
Ses
sion
4.0
1
(.01
)-
.01
(.02)
.01
(.01)
.02
(.01)
−.0
0
(.01)
Pie
ceR
ate
.02
(.01
)
.01
(.02)
.02
(.02)
.02
(.01)
.01
(.01)
.03**
(.01)
TA
.00
(.02
)
−.0
1
(.02)
.01
(.03)
−.0
1
(.02)
.01
(.02)
−.0
1
(.02)
TB
5−
.01
(.02
)
−.0
1
(.02)
−.0
1
(.03)
−.0
2
(.02)
−.0
1
(.02)
−.0
1
(.02)
TB
10.0
0
(.02
)
.01
(.02)
−.0
1
(.03)
−.0
1
(.02)
−.0
1
(.02)
−.0
0
(.02)
TB
15.0
0
(.02
)
.01
(.02)
.01
(.03)
.00
(.02)
−.0
1
(.02)
.02
(.02)
Ch
oice
.00
(.02
)-
.02
(.03)
−.0
2
(.02)
−.0
1
(.02)
.01
(.02)
Con
stan
t.9
3***
(.01
)
.92***
(.01)
.90***
(.01)
.96***
(.01)
.92***
(.01)
.93***
(.01)
Nu
mb
erof
Ob
serv
atio
ns
1257
637
617
640
1249
1203
Nu
mb
erof
Su
bje
cts
316
320
156
160
315
312
Not
es:
Dep
end
ent
vari
able
isth
enu
mb
erof
corr
ect
entr
ies
div
ided
by
the
nu
mb
erof
com
ple
teen
trie
s
Ind
ivid
ual
fixed
effec
tsar
ein
clu
ded
inal
lco
lum
ns.
Sta
nd
ard
erro
rsin
par
enth
eses
.**
*[*
*](*
)d
enote
sign
ifica
nce
at
1,
[5],
(10)
%le
vel.
33
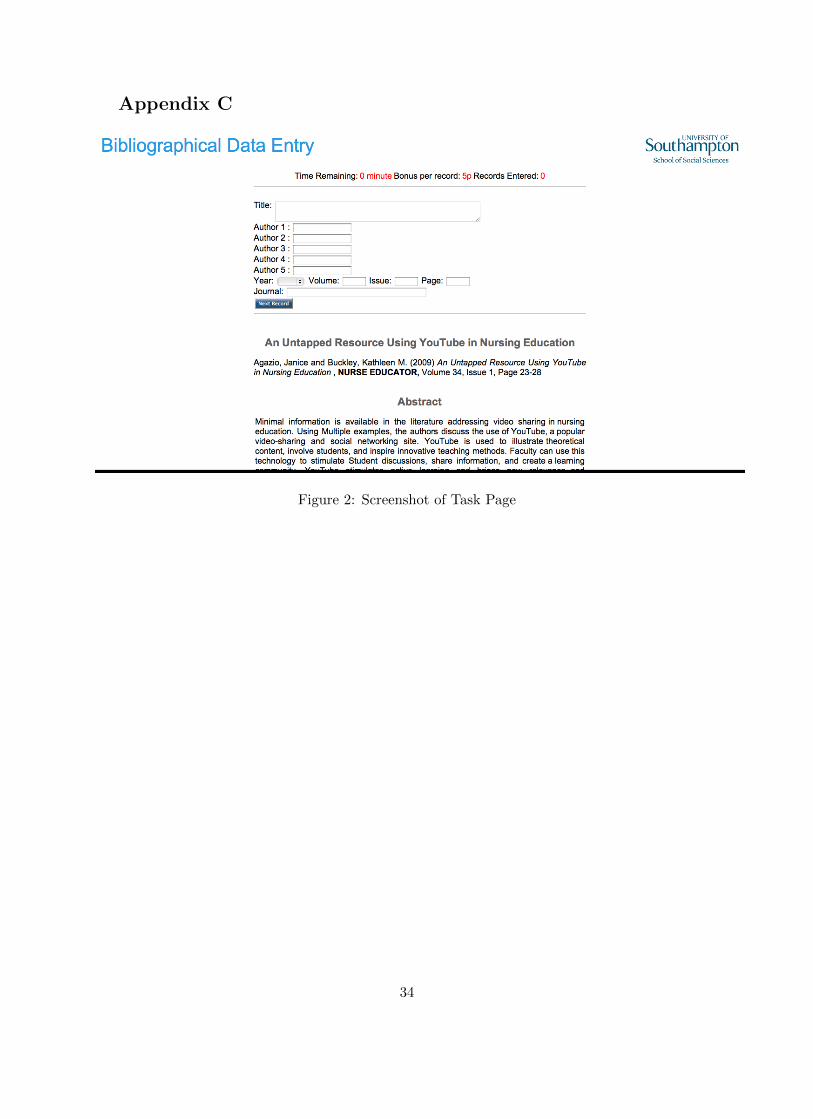
Appendix C
Figure 2: Screenshot of Task Page
34

Charity List
Please select one of the following options:
Amnesty International Campaigns to uphold human rights across the world.
British Red Cross Offers emergency response, health and social care, first aid and refugee services.
Cancer Research UK Works toward improving our understanding of cancer and develop better ways to prevent, diagnose and treat the disease.
Greenpeace UK
Defends the natural world and promotes peace by investigating, exposing and confronting environmental abuse, and championing environmentally responsible solutions.
Help the Aged
Committed to addressing the issues that matter to older people; Provides healthcare, gives older people a voice and responds to emergencies in the developing world.
MSF(Medecins Sans Frontiers/Doctors Without Borders)
Committed to providing medical aid wherever it is needed, regardless of race, religion, politics or gender
NSPCC(National Society for the Prevention of Cruelty to Children)
Specialises in child protection and the prevention of cruelty to children
Oxfam GB
A development, relief, and campaigning organisation that works with others to find lasting solutions to poverty and suffering around the world
RSPCA(Royal Society for the Prevention of Cruelty to Animals)
Works to reduce the harmful impact of human activities on animals through education, campaigning and the application of ethics, science and law
I do not wish any donation to be made