feasibility - econstor.eu
TRANSCRIPT
econstorMake Your Publications Visible.
A Service of
zbwLeibniz-InformationszentrumWirtschaftLeibniz Information Centrefor Economics
Renold, Ursula et al.
Research Report
Feasibility Study for a Curriculum Comparison inVocational Education and Training. IntermediaryReport II: Education-Employment Linkage Index
KOF Studien, No. 80
Provided in Cooperation with:KOF Swiss Economic Institute, ETH Zurich
Suggested Citation: Renold, Ursula et al. (2016) : Feasibility Study for a Curriculum Comparisonin Vocational Education and Training. Intermediary Report II: Education-Employment LinkageIndex, KOF Studien, No. 80, ETH Zurich, KOF Swiss Economic Institute, Zurich,http://dx.doi.org/10.3929/ethz-a-010696087
This Version is available at:http://hdl.handle.net/10419/148999
Standard-Nutzungsbedingungen:
Die Dokumente auf EconStor dürfen zu eigenen wissenschaftlichenZwecken und zum Privatgebrauch gespeichert und kopiert werden.
Sie dürfen die Dokumente nicht für öffentliche oder kommerzielleZwecke vervielfältigen, öffentlich ausstellen, öffentlich zugänglichmachen, vertreiben oder anderweitig nutzen.
Sofern die Verfasser die Dokumente unter Open-Content-Lizenzen(insbesondere CC-Lizenzen) zur Verfügung gestellt haben sollten,gelten abweichend von diesen Nutzungsbedingungen die in der dortgenannten Lizenz gewährten Nutzungsrechte.
Terms of use:
Documents in EconStor may be saved and copied for yourpersonal and scholarly purposes.
You are not to copy documents for public or commercialpurposes, to exhibit the documents publicly, to make thempublicly available on the internet, or to distribute or otherwiseuse the documents in public.
If the documents have been made available under an OpenContent Licence (especially Creative Commons Licences), youmay exercise further usage rights as specified in the indicatedlicence.
www.econstor.eu

KOF Studies, No. 80, July 2016
Feasibility Study for a Curriculum Comparison in Vocational Education and Training Intermediary Report II: Education-Employment Linkage Index
Dr. Ursula Renold, Dr. Thomas Bolli, Dr. Katherine Caves, Jutta Bürgi, Maria Esther Egg, Johanna Kemper and Ladina Rageth

ii
National Center on Education and the Economy (NCEE) Center on International Education Benchmarking (CIEB)
Feasibility Study for a Curriculum Comparison in Vocational Education and Training Intermediary Report II Education-Employment Linkage Index Draft Version, 19 July 2016 KOF Swiss Economic Institute Division Education Systems ETH Zurich Leonhardstrasse 21 CH-8092 Zürich Authors: Dr. Ursula Renold Dr. Thomas Bolli Dr. Katherine Caves Jutta Bürgi Maria Esther Egg Johanna Kemper Ladina Rageth

iii
This work is made possible through a grant by the Center on International Education Benchmarking® of the National Center on Education and the Economy® and is part of a series of reports on vocational and technical education systems around the world. For a complete listing of the material produced by this research program, please visit www.ncee.org/cieb.
The Center on International Education Benchmarking®, a program of NCEE, funds and conducts research around the world on the most successful education systems to identify the strategies those countries have used to produce their superior performance. Through its books, reports, website, monthly newsletter, and a weekly update of education news around the world, CIEB provides up-to-date information and analysis on those countries whose students regularly top the PISA league tables. Visit www.ncee.org/cieb to learn more.
The National Center on Education and the Economy was created in 1988 to analyze the implications of changes in the international economy for American education, formulate an agenda for American education based on that analysis and seek wherever possible to accomplish that agenda through policy change and development of the resources educators would need to carry it out. For more information visit www.ncee.org.

ii
Executive Summary The Center on International Education Benchmarking (CIEB) analyzes the world’s most successful education systems and what makes them successful. The CIEB supports this study on the feasibility of VET curriculum comparison and identifying the main features of vocational education and training (VET) in top-performing countries.
VET curricula are not only the content and instructions written down by teachers, administrators, and policymakers. Instead, VET curricula are constructs of the VET concept in a particular context: they are the sum of the intended, enacted, and experienced curricula. Because the concept of curriculum encompasses the many processes that make up what we will call the VET curriculum, it needs to be assessed throughout the Curriculum Value Chain (CVC).
Our general hypothesis, shown in Figure E1, is that education-employment linkage (EEL) directly affects young people’s labor market outcomes by affecting the quality, content, and delivery of VET. We define EEL in VET as an equilibrium of power between the actors from the education and employment systems. If education actors have all the power, VET is designed, taught, and updated without employer input. If employment actors have all the power, VET is on-the-job training. We develop the KOF Education-Employment Linkage Index (KOF EELI) to measure the intensity of interaction and cooperation between education and employment actors. We argue that optimal linkage—a power equilibrium between the education and employment systems—makes VET graduates most successful on the labor market as measured by the KOF Youth Labor Market Index (KOF YLMI) and youth unemployment rates. The KOF YLMI measures the situation of youth on the labor market with multiple indicators, and youth unemployment rates capture outcomes in countries where full data for the KOF YLMI is not available.
Method The methodology of the KOF EELI needs to balance comparability, completeness, neutrality, and feasibility. We identify features of VET throughout the CVC where actors from both systems can interact. The three CVC phases are the curriculum design phase, which leads to intended or enacted curricula; the curriculum application phase, which leads to experienced curricula; and the curriculum feedback phase, which updates curricula by re-starting the cycle. These are the three dimensions of the KOF EELI. Subdimensions, shown in Figure E2, represent detailed processes. We measure features within each subdimension using a survey of country experts, and aggregate those into the final index.
We measure KOF EELI in the 20 countries with top-performing VET systems that we selected in Phase I1. We focus on the largest VET program at the upper secondary level—when students are 15 to 19 years old—in each country. We sample many experts in the top six focus countries, and one or two in the remaining 14 secondary countries.
1 http://kofportal.kof.ethz.ch/publications/download/3821/No_70_CIEB_2015_11.pdf
Labor Market Outcomes
Hypothesis
Education System
Employment System
Linkage
Figure E1: EEL and labor market outcomes

iii
Feasibility Curriculum comparisons in general education entail finding, matching, and relating the content of written curricula in the same subject. However, this is neither very useful nor very feasible in VET. Comparing written curricula is not useful because VET outcomes depend on the enacted and experienced curricula more than the intended curriculum. Furthermore, some countries base VET curricula on the work-structuring principle that organizes their labor markets. For example, countries where workers are classified by occupation will write curricula for occupations, while others where individual career choices are the priority will focus on stackable courses or modules that allow individuals to set their own routes outside of defined occupations. Therefore, it is more relevant to compare how VET processes happen through the CVC.
Comparing written curricula is very difficult in VET because it is almost impossible to find comparable occupations in terms of scope, level, and objectives. Each country has a unique labor market, so no two curricula will need to prepare students for the same goal even when the occupation names match and are taught to the same type of student. What matters for comparing VET is how well students are prepared for the labor market, which is determined by EEL.
Measuring EEL through the CVC may be more useful and more feasible, but it still comes with challenges. There is a great deal of heterogeneity in EEL even within VET programs and the KOF EELI currently measures one program within each country’s VET pathway. There are many programs within the VET pathway and many curricula within each program. Curricula might also be organized in any number of different ways, from stackable modules to occupation-level frameworks. That challenge is compounded by further within-program or within-curriculum differences among schools, teachers, regions, workplaces, and sectors. For KOF EELI, we balance the scope of our measurement with feasibility by focusing on one program and instead of a whole pathway, and asking experts about the average situation in that program.
Dimensions Su
bdim
ensi
ons
Curriculum Design Phase
Curriculum Application Phase
Curriculum Feedback Phase
Qualification standards determination
Examination form determination
Involvement quality
Learning place
Workplace regulation
Cost sharing
Equipment provision
Teacher provision
Examination
Information gathering
Update timing
Figure E2: CVC phase dimensions and subdimensions
VET Pathway: All education programs that prepare students specifically for the labor market instead of only higher education.
Programs: Different ways VET is organized within the pathway, such as apprenticeships, school-based VET, or career preparation. These contain multiple curricula.
Curricula: Individual courses of study within each program that prepare students for jobs or occupations. These can range from modules to entire qualifications.
iv
The sheer variety of systems makes it difficult to be sure we have included every possible feature of EEL in our index. We built open-ended items into the questionnaire so experts could identify missing features. We analyze these and conclude that the KOF EELI is not missing any important features of EEL. We can clarify and rephrase small parts of the questionnaire using vignette techniques, and possibly create a role for unions in future iterations of the index, but those are not threats to current validity.
Collecting data is difficult in multiple countries, cultures, and languages. Our questionnaire methodology for the KOF EELI requires us to collect data from a large number of experts. Feasibility concerns force us to offer the questionnaire in English only, which further compounds the difficulty of consulting so many international experts. The
challenges around data collection are identifying, contacting, and getting responses from experts around the world. These are reduced when we are familiar with a country’s education system, personally connected to the experts we need to survey, or when we can get help from key informants and local organizations with standing willing to sponsor the questionnaire.
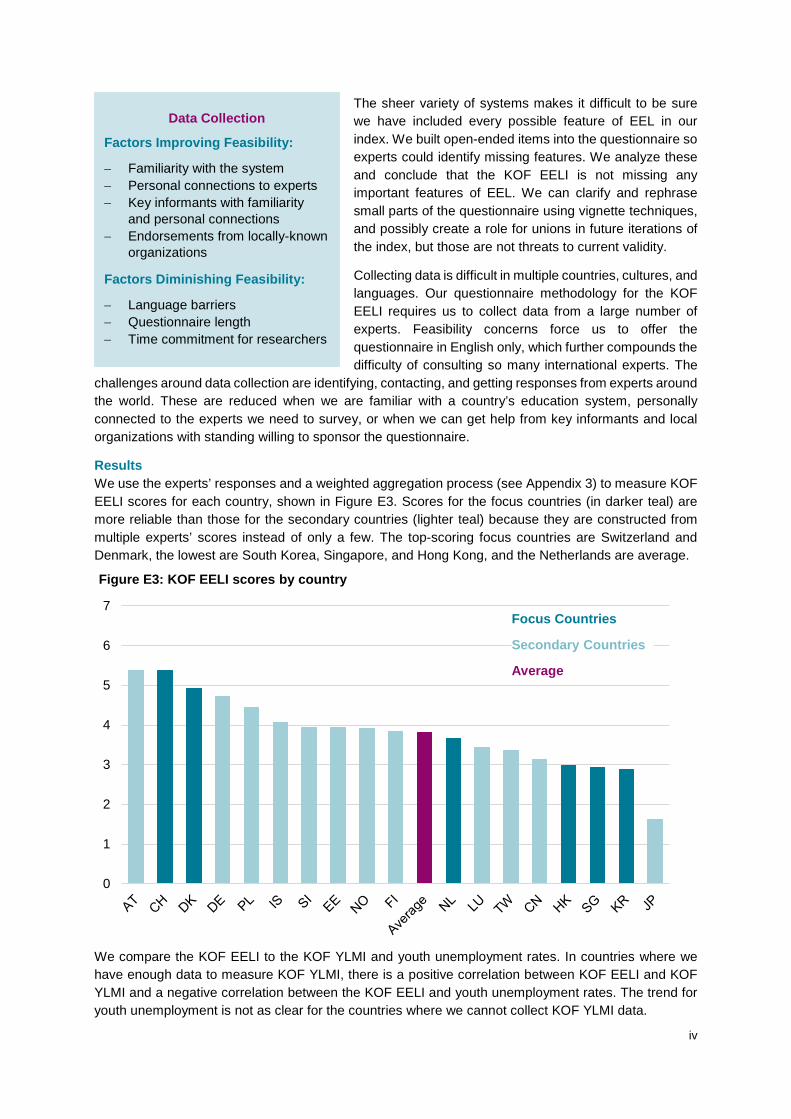
Results We use the experts’ responses and a weighted aggregation process (see Appendix 3) to measure KOF EELI scores for each country, shown in Figure E3. Scores for the focus countries (in darker teal) are more reliable than those for the secondary countries (lighter teal) because they are constructed from multiple experts’ scores instead of only a few. The top-scoring focus countries are Switzerland and Denmark, the lowest are South Korea, Singapore, and Hong Kong, and the Netherlands are average.
We compare the KOF EELI to the KOF YLMI and youth unemployment rates. In countries where we have enough data to measure KOF YLMI, there is a positive correlation between KOF EELI and KOF YLMI and a negative correlation between the KOF EELI and youth unemployment rates. The trend for youth unemployment is not as clear for the countries where we cannot collect KOF YLMI data.
0
1
2
3
4
5
6
7
Figure E3: KOF EELI scores by country
Focus Countries
Secondary Countries
Average
Data Collection
Factors Improving Feasibility:
− Familiarity with the system − Personal connections to experts − Key informants with familiarity
and personal connections − Endorsements from locally-known
organizations
Factors Diminishing Feasibility:
− Language barriers − Questionnaire length − Time commitment for researchers

v
To compare VET programs scores and identify potential policy strategies, we use the KOF EELI dimension, subdimension, and feature scores. One-page information sheets, shown in Figure E4, summarize each country’s KOF EELI score by subdimension along with key data about the VET pathway and focus program. We also compile detailed case studies of the six focus countries. We use these to demonstrate how the KOF EELI can be a useful policy tool.
Conclusions Despite the challenges, logistics, and resource needs of measuring VET programs, the KOF EELI is a feasible strategy with room for expansion. We can use its results to compare VET programs and derive policy opportunities.
We also conclude that it is an effective means of identifying the main features of VET curricula in top-performing countries. Because the KOF EELI identifies the relative weight of each feature, we can identify which characteristics are most important. The feature level is perhaps the most policy-relevant. The main features of VET in top-performing countries are that employers are involved in setting
qualification standards, deciding when an update needs to happen, and setting the examination form; and that students spend most of their time in the workplace instead of the classroom. This information, combined with their countries’ scores, gives policymakers a priority list improving VET and a means of assessing their current standings.
Country and program names
Brief description of the program
Key data about the program
Policy implications of KOF EELI subdimension
and feature scores
Spiderweb graph showing KOF EELI
subdimension scores
Total KOF EELI score, dimension scores, and
rankings
Main features of top-performing VET: Employers involved in: − Setting qualification standards, − Deciding when to update, − Setting the examination form. Students spend most of their time in the workplace instead of the classroom.
Figure E4: Country summary example

vi
Acknowledgements We are extremely grateful to the experts and leaders who helped us carry out the KOF EELI questionnaire in 20 countries with dozens of experts. Without the help of these supporting organizations, key informants, and lead experts we would have been unable to identify, contact, and hear back from the experts whose responses are the foundation of this study.
The key informants and supporting organizations that supported us in the focus countries of this report enabled us to collect data from the right people and with enough responses. Specifically, we would like to thank Betsy Brown Ruzzi from the CIEB for her help contacting key experts in multiple countries. Thanks to Jan Reitz Jørgensen from the Danish Ministry for Children, Education and Gender Equality in Denmark. In Hong Kong, we are very grateful to Gladys Yam and Patrick Chu from the Vocational Training Council. Inge Vossenaar and Bernard Verlaan from the Netherlands’ Ministry of Education, Culture and Science were very helpful and we appreciate that immensely. We thank Kenneth Sim and Sharon Chia from the Singapore Workforce Development Agency. In South Korea, we are personally grateful to the ever-helpful Hyunbin Im, a teacher at Seoul Technical High School. Also in South Korea, we thank Christian Schneider and Ji Hyun Lim from the Embassy of Switzerland in the Republic of Korea, Seoul. Last but not least we thank Toni Messner from the State Secretariat of Education, Research and Innovation in Switzerland. Thank you all for your support.
In the secondary countries, we relied on certain individuals for a great deal of information and orientation even though they were not the respondent to the questionnaire. In Canada, we are grateful to Amanda Hodgkinson and Noel Baldwin from the Canadian Council of Ministers of Education, who both put forth great effort trying to find the right person even if that person was not ultimately found. In Germany, we are grateful to Kristina Hensen Reifgens from the Federal Institute for Vocational Education and Training. Many thanks to Dóra Stefánsdóttir from the Icelandic Center for Research. Wataru Nakazawa from the Osaka University’s School of Human Sciences was immensely helpful in translating key information. In Lithuania, we are grateful to Kestutis Pukelis from the Vytautas Magnus University’s Faculty of Social Sciences for his efforts to help us find someone who could respond to the survey. Thanks to Justin Powell from the University of Luxembourg’s Faculty for Language and Literature, Humanities, Arts and Education, and Lukas Graf from the University of St. Gallen’s Department of Political Science. In Norway, Jon Lauglo from the University of Oslo’s Faculty of Educational Sciences was very helpful. To Anna Kaczmarek from the Polish Ministry of National Education, thank you very much. Finally, we are grateful to Weiping Shi from the East China Normal University’s Institute of Vocational & Adult Education.
The KOF EELI survey was conducted anonymously, so we cannot thank respondents by name. However, we would like to take this opportunity to express our extreme gratitude to the experts who spent time and energy thoughtfully filling out the questionnaire. We are measuring a big concept, and the questionnaire was no easy feat. Thank you to all respondents, and we hope to further express our appreciation by using your responses and improving the questionnaire for the next phase of the KOF EELI. This report would not exist without your help.
vii
Table of Contents
Executive Summary ______________________________________________________________ ii
Acknowledgements _______________________________________________________________ vi
List of Tables ____________________________________________________________________ ix
List of Figures ___________________________________________________________________ x
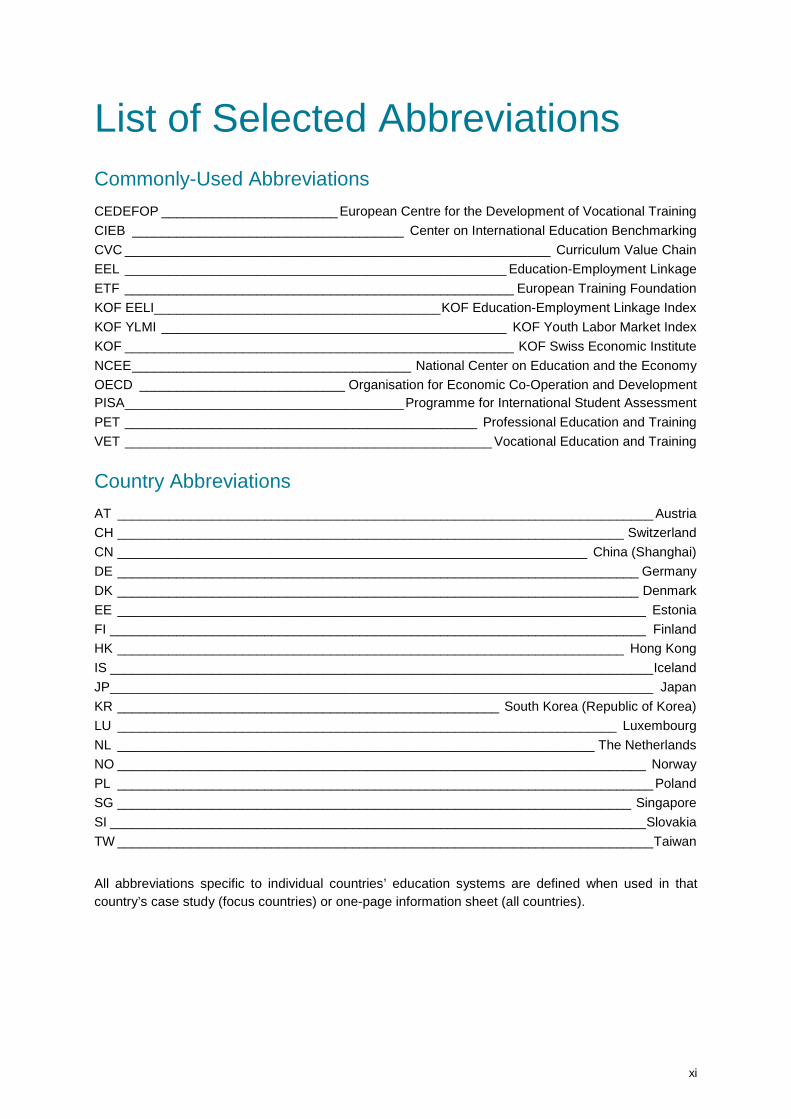
List of Selected Abbreviations ______________________________________________________ xi
1 Background and Objectives of the Feasibility Study ______________________________ 1
2 Developing an Education-Employment Linkage Index _____________________________ 3 2.1 Research Question ___________________________________________________________ 3 2.1.1 Defining education and employment systems ______________________________________ 3 2.1.2 Theory: Defining linkage _______________________________________________________ 4 2.1.3 Measuring linkage ____________________________________________________________ 6
3 Methods ___________________________________________________________________ 7 3.1 Index construction process _____________________________________________________ 7 3.1.1 Conceptual Framework ________________________________________________________ 7 3.1.2 Measurement _______________________________________________________________ 9 3.1.3 Identifying subdimensions and features in each dimension ___________________________ 12 3.1.4 Assessment level ___________________________________________________________ 14 3.2 Country experts _____________________________________________________________ 18 3.2.1 Sample ___________________________________________________________________ 19 3.3 Aggregation and weighting ____________________________________________________ 20
4 Results of the KOF EELI _____________________________________________________ 22 4.1 Weighting: The most important characteristics _____________________________________ 24 4.2 Results by CVC phase _______________________________________________________ 25 4.3 Results for selected features ___________________________________________________ 26 4.4 Focus country case studies ____________________________________________________ 28 Denmark – EUD Program _____________________________________________________ 29 4.4.1 Denmark Case Study ________________________________________________________ 30 Hong Kong – DVE Program ___________________________________________________ 37 4.4.2 Hong Kong Case Study _______________________________________________________ 38 The Netherlands – MBO BOL Program __________________________________________ 44
viii
4.4.3 The Netherlands Case Study __________________________________________________ 45 Singapore – Institutes of Technical Education _____________________________________ 52 4.4.4 Singapore Case Study _______________________________________________________ 53 South Korea – VET High Schools _______________________________________________ 59 4.4.5 South Korea Case Study ______________________________________________________ 60 Switzerland – Apprenticeship (Dual VET) _________________________________________ 66 4.4.6 Switzerland Case Study ______________________________________________________ 67 4.5 Non-focus country results _____________________________________________________ 73 Austria – Apprenticeship (Dual System) __________________________________________ 73 Canada – VET at Secondary Schools ____________________________________________ 74 China (Shanghai) – Vocational Schools __________________________________________ 75 Estonia – School-based VET __________________________________________________ 76 Finland – School-based VET __________________________________________________ 77 Germany – Apprenticeship (Dual System) ________________________________________ 78 Iceland – Apprenticeship Program ______________________________________________ 79 Japan – Specialized (Vocational) High Schools ____________________________________ 80 Lithuania – School-based VET _________________________________________________ 81 Luxembourg – Technical Secondary School Leaving Diploma ________________________ 82 Norway – Apprenticeship (2+2 System) __________________________________________ 83 Poland – School-based VET ___________________________________________________ 84 Slovenia – Technical Upper Secondary __________________________________________ 85 Taiwan – Senior Vocational High Schools ________________________________________ 86
5 Outlook and conclusions ____________________________________________________ 87 5.1 Limitations and feasibility issues ________________________________________________ 87 5.1.1 Feasibility of comparing intended curricula ________________________________________ 87 5.1.2 Feasibility of measuring EEL ___________________________________________________ 88 5.2 Conclusions ________________________________________________________________ 91
References _____________________________________________________________________ 93
Appendix _____________________________________________________________________ 102 A.1 Full list of features __________________________________________________________ 102 A.2 Weighting ________________________________________________________________ 109 A.2.1 Within-country variation in weighting ____________________________________________ 119 A.3 Expert Characteristics _______________________________________________________ 120 A.4 EELI results by feature ______________________________________________________ 122 A.4.1 Curriculum design phase ____________________________________________________ 124 A.4.2 Curriculum application phase _________________________________________________ 125 A.4.3 Curriculum feedback phase __________________________________________________ 127 A.5 Robustness check against the SABER index _____________________________________ 128 A.6 Biographies of Authors ______________________________________________________ 129
ix
List of Tables Table 3.1: Upper secondary VET programs and enrollment by country _____________________ 15 Table 3.2: Expert types and criteria _________________________________________________ 18 Table 3.3: Expert sample _________________________________________________________ 19 Table 3.4: Final weighting scheme _________________________________________________ 21 Table 4.1: Upper secondary enrollment, 2015 ________________________________________ 31 Table 4.2: Feature scores for Denmark ______________________________________________ 36 Table 4.3: Upper secondary enrollment, 2014 ________________________________________ 39 Table 4.4: Feature scores for Hong Kong ____________________________________________ 43 Table 4.5: Secondary enrollment, 2013 ______________________________________________ 46 Table 4.6: Feature scores for the Netherlands ________________________________________ 51 Table 4.7: Post-secondary enrollment _______________________________________________ 54 Table 4.8: Feature scores for Singapore _____________________________________________ 58 Table 4.9: Upper-secondary enrollment _____________________________________________ 61 Table 4.10: Feature scores for South Korea ___________________________________________ 65 Table 4.11: Upper secondary enrollment _____________________________________________ 68 Table 4.12: Feature scores for Switzerland ____________________________________________ 72 Table A1: Description of KOF EELI Features ________________________________________ 101 Table A2.1: Overview of weighting schemes __________________________________________ 109 Table A2.2: Weighting scheme of curriculum design phase ______________________________ 112 Table A2.3: Weighting scheme of curriculum application phase ___________________________ 113 Table A2.4: Weighting scheme of curriculum feedback phase ____________________________ 115 Table A2.5: Spearman correlations by calculation method and weighting scheme ____________ 116 Table A2.6: Final weighting scheme ________________________________________________ 117 Table A3: Estimation of the relationship between expert assessment and characteristics _____ 120 Table A4: KOF EELI feature scores by feature _______________________________________ 121
x
List of Figures Figure E1: EEL and labor market outcomes ____________________________________________ ii Figure E2: CVC phase dimensions and subdimensions __________________________________ iii Figure E3: KOF EELI scores by country ______________________________________________ iiv Figure E4: Country summary example ________________________________________________ v Figure 1.1: Research questions of the main study and this feasibility study ___________________ 1 Figure 2.1: EEL and labor market outcomes ___________________________________________ 3 Figure 2.2: Linkage as power equilibrium ______________________________________________ 4 Figure 2.3: Linkage as a function of equilibrium power sharing and regulation _________________ 5 Figure 2.4: Hypotheses ____________________________________________________________ 6 Figure 3.1: Curriculum Value Chain (CVC) _____________________________________________ 8 Figure 3.2: Operational Framework __________________________________________________ 9 Figure 3.3: CVC phase dimensions and subdimensions _________________________________ 13 Figure 3.4: Role of actors in curriculum design by country ________________________________ 15 Figure 4.1: KOF EELI scores by country _____________________________________________ 22 Figure 4.2: Correlation between KOF EELI and KOF YLMI _______________________________ 23 Figure 4.3: Correlation between KOF EELI and youth unemployment rates __________________ 24 Figure 4.4: Dimension scores by country _____________________________________________ 25 Figure 4.5: Career vs. occupation and represented firm share ____________________________ 26 Figure 4.6: Firms vs. employer associations and legal definition of involvement _______________ 27 Figure 4.7: Overview of the Danish education system ___________________________________ 30 Figure 4.8: Schematic structure of the EUD ___________________________________________ 32 Figure 4.9: Curriculum design process _______________________________________________ 34 Figure 4.10: Overview of the Hong Kong education system _______________________________ 38 Figure 4.11: Overview of the Dutch education system ____________________________________ 45 Figure 4.22: Overview of the Singaporean education system ______________________________ 53 Figure 4.13: Overview of the Korean education system ___________________________________ 60 Figure 4.34: Overview of the Swiss education system ____________________________________ 67 Figure A2.1: Distribution of dimension weights across countries ___________________________ 109 Figure A2.2: Relationship between subjective and semi-objective method ___________________ 116 Figure A2.3: Within-country relationship, subjective and semi-objective method for CH, HK, KR __ 118 Figure A2.4: Within-country relationship, subjective and semi-objective method for DK, NL, SG __ 119 Figure A5.1: SABER Index Results for Overlapping Countries ____________________________ 127
xi
List of Selected Abbreviations Commonly-Used Abbreviations CEDEFOP ________________________ European Centre for the Development of Vocational Training CIEB _____________________________________ Center on International Education Benchmarking CVC __________________________________________________________ Curriculum Value Chain EEL ____________________________________________________ Education-Employment Linkage ETF _____________________________________________________ European Training Foundation KOF EELI_______________________________________ KOF Education-Employment Linkage Index KOF YLMI _______________________________________________ KOF Youth Labor Market Index KOF _____________________________________________________ KOF Swiss Economic Institute NCEE ______________________________________ National Center on Education and the Economy OECD ____________________________ Organisation for Economic Co-Operation and Development PISA ______________________________________ Programme for International Student Assessment PET ________________________________________________ Professional Education and Training VET __________________________________________________ Vocational Education and Training
Country Abbreviations AT _________________________________________________________________________ Austria CH _____________________________________________________________________ Switzerland CN ________________________________________________________________ China (Shanghai) DE _______________________________________________________________________ Germany DK _______________________________________________________________________ Denmark EE ________________________________________________________________________ Estonia FI _________________________________________________________________________ Finland HK _____________________________________________________________________ Hong Kong IS __________________________________________________________________________ Iceland JP __________________________________________________________________________ Japan KR ____________________________________________________ South Korea (Republic of Korea) LU ____________________________________________________________________ Luxembourg NL _________________________________________________________________ The Netherlands NO ________________________________________________________________________ Norway PL _________________________________________________________________________ Poland SG ______________________________________________________________________ Singapore SI _________________________________________________________________________ Slovakia TW _________________________________________________________________________ Taiwan
All abbreviations specific to individual countries’ education systems are defined when used in that country’s case study (focus countries) or one-page information sheet (all countries).
1
1 Background and Objectives of the Feasibility Study
The Center on International Education Benchmarking (CIEB) analyzes the world’s most successful education systems and what makes them successful. As part of this effort, the CIEB supports this curriculum comparison study that examines the feasibility of identifying the main features of vocational education and training (VET) in top-performing countries.
VET prepares students for the labor market, usually by combining practical training at either a workplace or school with curriculum-specific theory and some general education. There is great diversity in global VET systems. For example, school-based VET is the norm in some countries, but firms in others completely take over the teaching of vocational and technical skills through on-the-job training, and a third approach is dual VET where apprenticeships combine on-the-job training in a company with education at schools. These different institutional structures come with various means of embedding VET in the education system and different actors involved in VET processes. Such variability makes international comparisons of VET curricula very challenging.
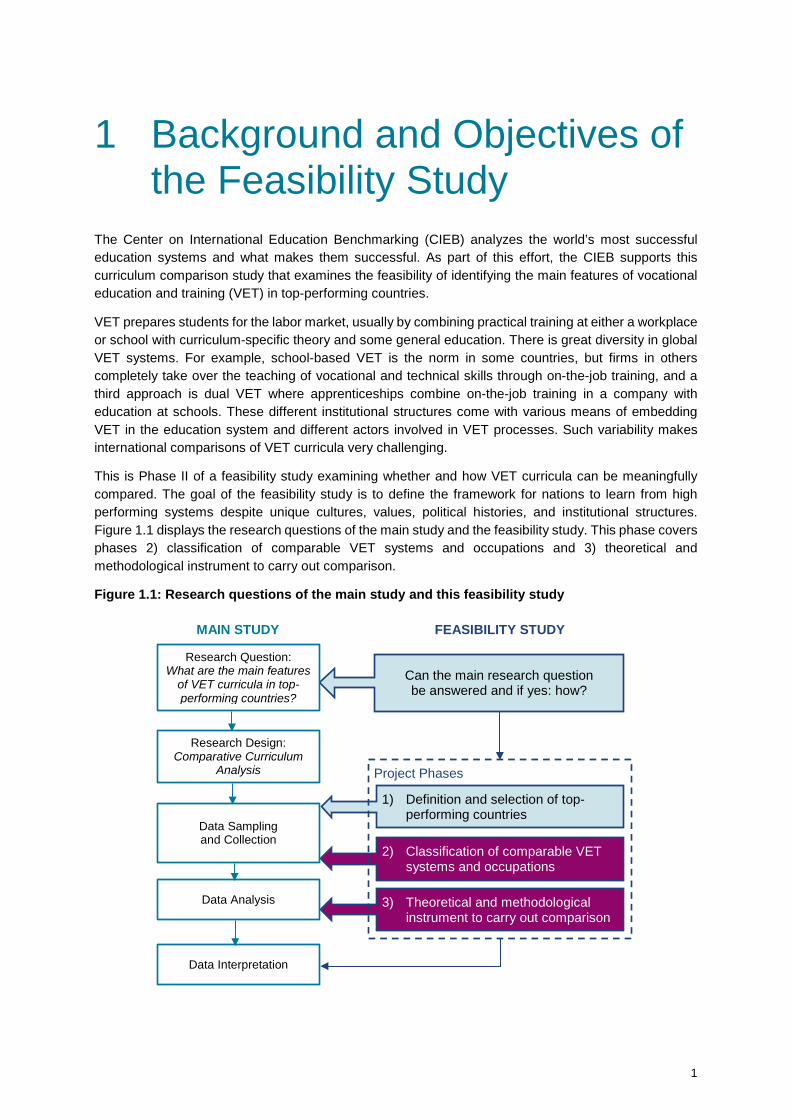
This is Phase II of a feasibility study examining whether and how VET curricula can be meaningfully compared. The goal of the feasibility study is to define the framework for nations to learn from high performing systems despite unique cultures, values, political histories, and institutional structures. Figure 1.1 displays the research questions of the main study and the feasibility study. This phase covers phases 2) classification of comparable VET systems and occupations and 3) theoretical and methodological instrument to carry out comparison.
Figure 1.1: Research questions of the main study and this feasibility study
MAIN STUDY FEASIBILITY STUDY
2) Classification of comparable VET systems and occupations
3) Theoretical and methodological instrument to carry out comparison
Can the main research question be answered and if yes: how?
1) Definition and selection of top-performing countries
Project Phases
Research Question: What are the main features
of VET curricula in top-performing countries?
Research Design: Comparative Curriculum
Analysis
Data Sampling and Collection
Data Interpretation
Data Analysis
2
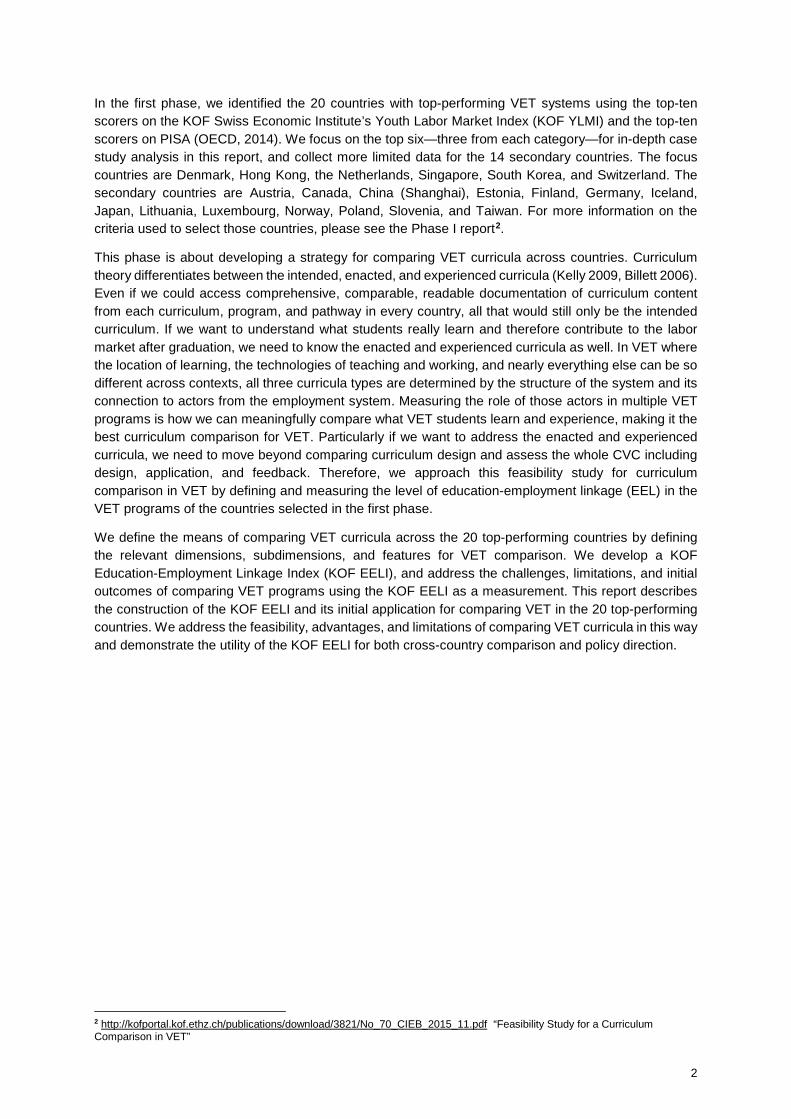
In the first phase, we identified the 20 countries with top-performing VET systems using the top-ten scorers on the KOF Swiss Economic Institute’s Youth Labor Market Index (KOF YLMI) and the top-ten scorers on PISA (OECD, 2014). We focus on the top six—three from each category—for in-depth case study analysis in this report, and collect more limited data for the 14 secondary countries. The focus countries are Denmark, Hong Kong, the Netherlands, Singapore, South Korea, and Switzerland. The secondary countries are Austria, Canada, China (Shanghai), Estonia, Finland, Germany, Iceland, Japan, Lithuania, Luxembourg, Norway, Poland, Slovenia, and Taiwan. For more information on the criteria used to select those countries, please see the Phase I report2.
This phase is about developing a strategy for comparing VET curricula across countries. Curriculum theory differentiates between the intended, enacted, and experienced curricula (Kelly 2009, Billett 2006). Even if we could access comprehensive, comparable, readable documentation of curriculum content from each curriculum, program, and pathway in every country, all that would still only be the intended curriculum. If we want to understand what students really learn and therefore contribute to the labor market after graduation, we need to know the enacted and experienced curricula as well. In VET where the location of learning, the technologies of teaching and working, and nearly everything else can be so different across contexts, all three curricula types are determined by the structure of the system and its connection to actors from the employment system. Measuring the role of those actors in multiple VET programs is how we can meaningfully compare what VET students learn and experience, making it the best curriculum comparison for VET. Particularly if we want to address the enacted and experienced curricula, we need to move beyond comparing curriculum design and assess the whole CVC including design, application, and feedback. Therefore, we approach this feasibility study for curriculum comparison in VET by defining and measuring the level of education-employment linkage (EEL) in the VET programs of the countries selected in the first phase.
We define the means of comparing VET curricula across the 20 top-performing countries by defining the relevant dimensions, subdimensions, and features for VET comparison. We develop a KOF Education-Employment Linkage Index (KOF EELI), and address the challenges, limitations, and initial outcomes of comparing VET programs using the KOF EELI as a measurement. This report describes the construction of the KOF EELI and its initial application for comparing VET in the 20 top-performing countries. We address the feasibility, advantages, and limitations of comparing VET curricula in this way and demonstrate the utility of the KOF EELI for both cross-country comparison and policy direction.
2 http://kofportal.kof.ethz.ch/publications/download/3821/No_70_CIEB_2015_11.pdf “Feasibility Study for a Curriculum Comparison in VET”
3
2 Developing an Education-Employment Linkage Index
2.1 Research Question Increased linkage between the education and employment systems should improve labor market outcomes for young people in VET (see for example Backes-Gellner, 1996; Hannan, Raffe, & Smyth, 1996; Palmer 2007; Carrero 2006; CEDEFOP 2008; Eichmann, 1989). However, there is currently no way of measuring the degree of EEL in a given VET program or system. Therefore, we develop the KOF EELI to investigate how strong EEL is in the 20 top-performing countries for VET that we identified in the first report. Increasing the linkage between the education and employment systems should improve labor market outcomes, so we compare the results of the KOF EELI to labor market outcomes like the KOF YLMI scores and unemployment rates.
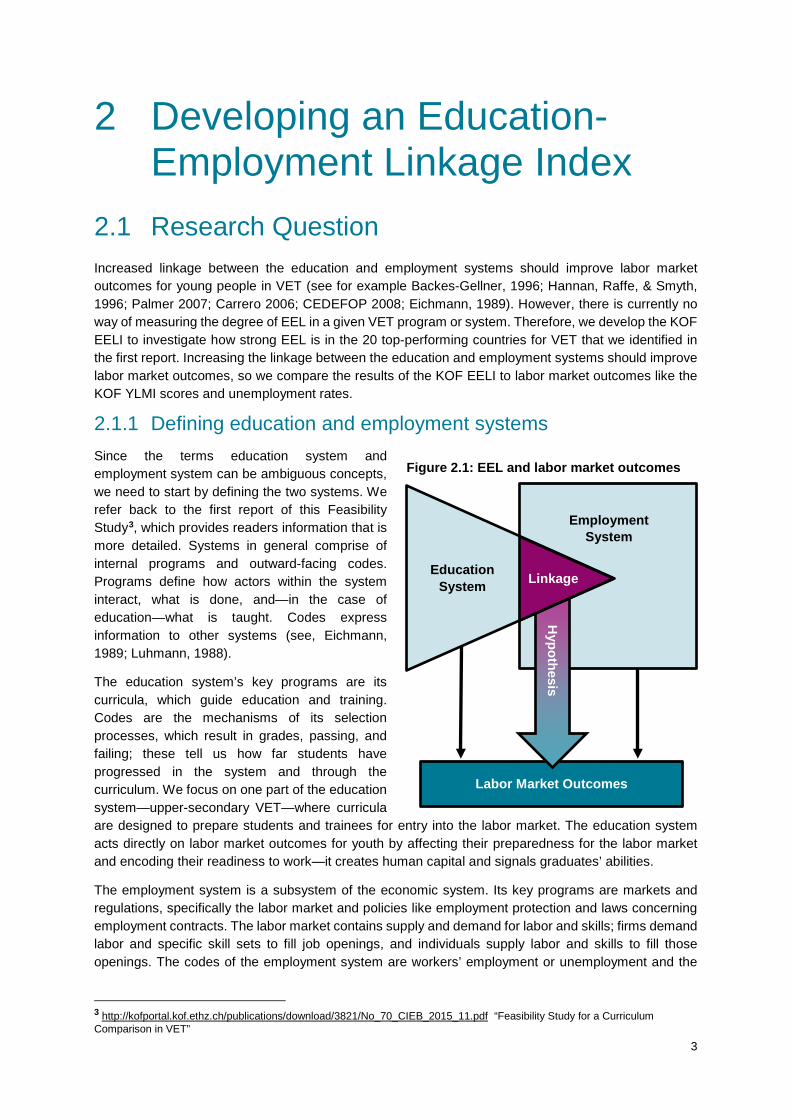
2.1.1 Defining education and employment systems Since the terms education system and employment system can be ambiguous concepts, we need to start by defining the two systems. We refer back to the first report of this Feasibility Study3, which provides readers information that is more detailed. Systems in general comprise of internal programs and outward-facing codes. Programs define how actors within the system interact, what is done, and—in the case of education—what is taught. Codes express information to other systems (see, Eichmann, 1989; Luhmann, 1988).
The education system’s key programs are its curricula, which guide education and training. Codes are the mechanisms of its selection processes, which result in grades, passing, and failing; these tell us how far students have progressed in the system and through the curriculum. We focus on one part of the education system—upper-secondary VET—where curricula are designed to prepare students and trainees for entry into the labor market. The education system acts directly on labor market outcomes for youth by affecting their preparedness for the labor market and encoding their readiness to work—it creates human capital and signals graduates’ abilities.
The employment system is a subsystem of the economic system. Its key programs are markets and regulations, specifically the labor market and policies like employment protection and laws concerning employment contracts. The labor market contains supply and demand for labor and skills; firms demand labor and specific skill sets to fill job openings, and individuals supply labor and skills to fill those openings. The codes of the employment system are workers’ employment or unemployment and the
3 http://kofportal.kof.ethz.ch/publications/download/3821/No_70_CIEB_2015_11.pdf “Feasibility Study for a Curriculum Comparison in VET”
Labor Market Outcomes
Hypothesis
Education System
Employment System
Linkage
Figure 2.1: EEL and labor market outcomes
4
price for labor, or wages earned by workers. The employment system directly affects outcomes on the youth labor market because it contains the labor market itself.
This study looks at the linkage between the education system and the employment system—how actors cooperate to share power and resources while regulating one another’s incentives to cut costs where it would hurt graduates’ outcomes. Our general hypothesis is that linkage also directly affects young people’s labor market outcomes by affecting the quality, content, and delivery of VET. Thus, it affects graduates’ preparedness for entering the labor market and reception by employers who understand the meaning of their degrees.
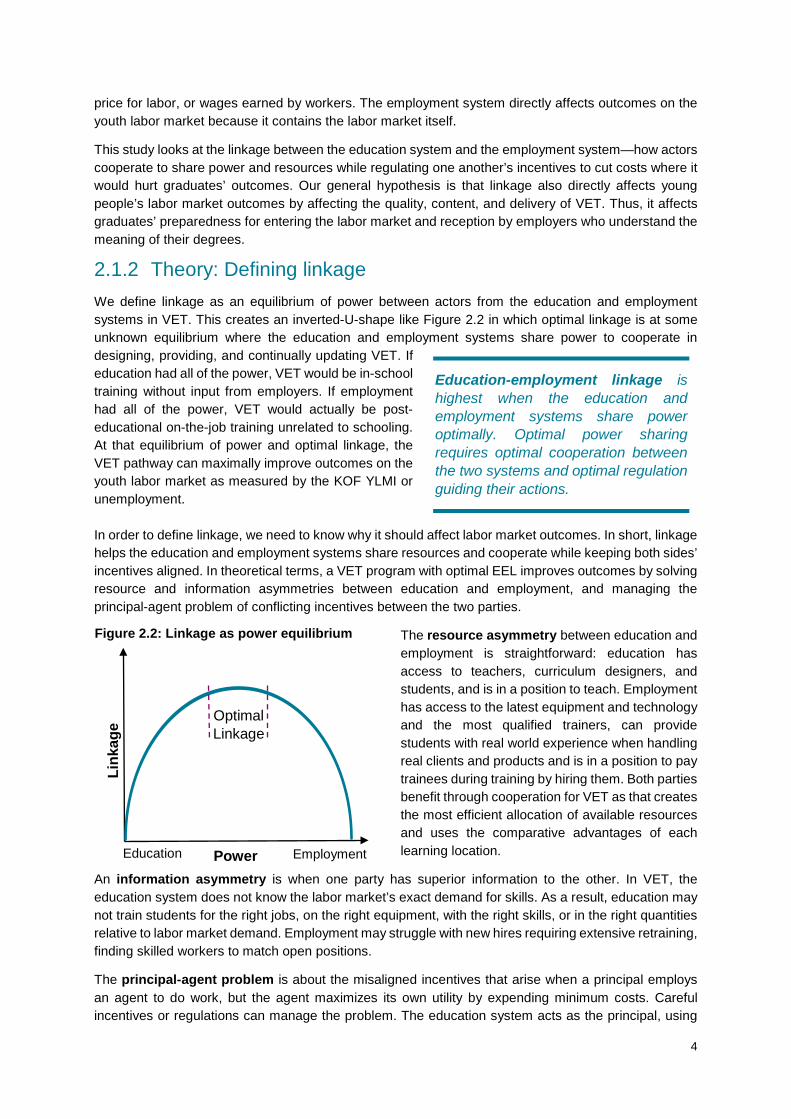
2.1.2 Theory: Defining linkage We define linkage as an equilibrium of power between actors from the education and employment systems in VET. This creates an inverted-U-shape like Figure 2.2 in which optimal linkage is at some unknown equilibrium where the education and employment systems share power to cooperate in designing, providing, and continually updating VET. If education had all of the power, VET would be in-school training without input from employers. If employment had all of the power, VET would actually be post-educational on-the-job training unrelated to schooling. At that equilibrium of power and optimal linkage, the VET pathway can maximally improve outcomes on the youth labor market as measured by the KOF YLMI or unemployment. In order to define linkage, we need to know why it should affect labor market outcomes. In short, linkage helps the education and employment systems share resources and cooperate while keeping both sides’ incentives aligned. In theoretical terms, a VET program with optimal EEL improves outcomes by solving resource and information asymmetries between education and employment, and managing the principal-agent problem of conflicting incentives between the two parties.
The resource asymmetry between education and employment is straightforward: education has access to teachers, curriculum designers, and students, and is in a position to teach. Employment has access to the latest equipment and technology and the most qualified trainers, can provide students with real world experience when handling real clients and products and is in a position to pay trainees during training by hiring them. Both parties benefit through cooperation for VET as that creates the most efficient allocation of available resources and uses the comparative advantages of each learning location.
An information asymmetry is when one party has superior information to the other. In VET, the education system does not know the labor market’s exact demand for skills. As a result, education may not train students for the right jobs, on the right equipment, with the right skills, or in the right quantities relative to labor market demand. Employment may struggle with new hires requiring extensive retraining, finding skilled workers to match open positions.
The principal-agent problem is about the misaligned incentives that arise when a principal employs an agent to do work, but the agent maximizes its own utility by expending minimum costs. Careful incentives or regulations can manage the problem. The education system acts as the principal, using
Education Employment
Link
age
Power
Optimal Linkage
Figure 2.2: Linkage as power equilibrium
Education-employment linkage is highest when the education and employment systems share power optimally. Optimal power sharing requires optimal cooperation between the two systems and optimal regulation guiding their actions.

5
employers for things like workplace training. Ideally, trainees need to learn a broad set of skills to ensure labor mobility. However, in the absence of regulation, employers minimize costs by using trainees as unskilled labor and training only firm-specific skills. This is trainee exploitation and students graduate without the skills they will need on the labor market.
We define linkage is the equilibrium of power between actors from education and employment, and power itself has two dimensions. The first dimension of power is cooperation; the extent to which the employment system participates in VET. An extreme case of this is if employers have no say in curriculum design, rendering VET irrelevant on the labor market. This dimension relates to the information asymmetry problem. The second dimension of power is regulation; the extent to which education actors can manage the actions of the employment system actors. An extreme case is if employers have students without any obligation to train them and therefore exploit them as cheap labor. This dimension relates to the principal agent problem. Therefore, linkage is highest if power sharing is optimal in both dimensions.
We refer to power sharing as “optimal” because each of those dimensions has its own ideal point between too little and too much. For cooperation, firms’ role should be large enough to solve resource and information asymmetries without depriving trainees of the general knowledge and skills they need to be mobile on the labor market. For regulation, the goal is to manage the principal-agent problem without creating an undue administrative burden for firms. As both cooperation and regulation approach their optimal points, linkage increases (see Figure 2.3).
The points of equilibrium are all unknown and it is likely that the
power sharing-regulation equilibrium skews such that power sharing is more important. Even so, this theoretical model provides clear indications of how high- and low-EEL systems will look. Because the points of equilibrium are unknown, we cannot measure each VET pathway’s status relative to its ideal state. Instead, we limit our focus to a specific VET program so that our starting point is within the education system. Therefore, any increase in cooperation and regulations will only increase linkage. In the KOF EELI, we assume that increasing employer participation and increasing regulations both increase linkage.
Hypothesis
Since EEL is an increasing function within and between equilibrium cooperation and equilibrium regulations, it will be lowest if no cooperation takes place between the actors of the education and employment system and regulations are either far too much or none at all. EEL will be highest when education and employment cooperate for VET and there are just enough regulations to align incentives. According to the theory just described, we hypothesize that higher EEL should improve labor market
Link
age
Optimal Cooperation
Figure 2.3: Linkage as a function of equilibrium power sharing and regulation
Optimal Linkage
We hypothesize that KOF EELI scores should correlate positively with the KOF YLMI and negatively with unemployment rates.
6
outcomes for VET graduates by resolving asymmetries in resources and information between education and employment and by solving the principal-agent problems that arise with cooperative VET.
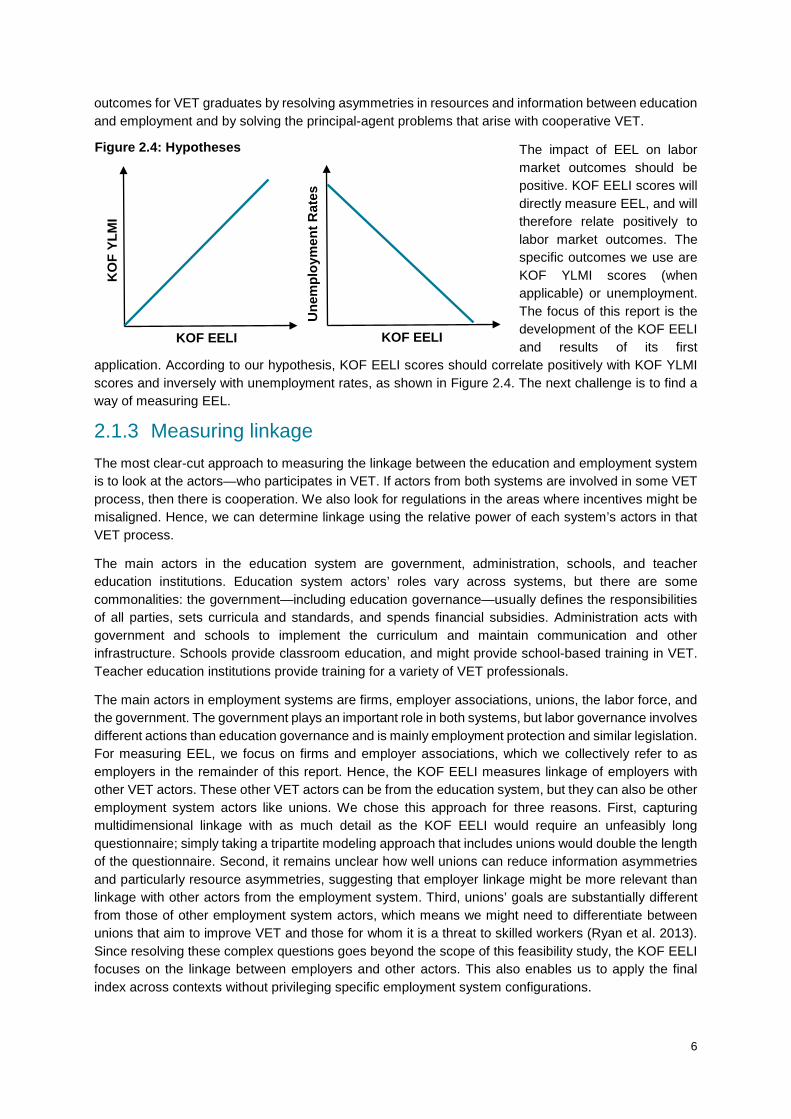
The impact of EEL on labor market outcomes should be positive. KOF EELI scores will directly measure EEL, and will therefore relate positively to labor market outcomes. The specific outcomes we use are KOF YLMI scores (when applicable) or unemployment. The focus of this report is the development of the KOF EELI and results of its first
application. According to our hypothesis, KOF EELI scores should correlate positively with KOF YLMI scores and inversely with unemployment rates, as shown in Figure 2.4. The next challenge is to find a way of measuring EEL.
2.1.3 Measuring linkage The most clear-cut approach to measuring the linkage between the education and employment system is to look at the actors—who participates in VET. If actors from both systems are involved in some VET process, then there is cooperation. We also look for regulations in the areas where incentives might be misaligned. Hence, we can determine linkage using the relative power of each system’s actors in that VET process.
The main actors in the education system are government, administration, schools, and teacher education institutions. Education system actors’ roles vary across systems, but there are some commonalities: the government—including education governance—usually defines the responsibilities of all parties, sets curricula and standards, and spends financial subsidies. Administration acts with government and schools to implement the curriculum and maintain communication and other infrastructure. Schools provide classroom education, and might provide school-based training in VET. Teacher education institutions provide training for a variety of VET professionals.
The main actors in employment systems are firms, employer associations, unions, the labor force, and the government. The government plays an important role in both systems, but labor governance involves different actions than education governance and is mainly employment protection and similar legislation. For measuring EEL, we focus on firms and employer associations, which we collectively refer to as employers in the remainder of this report. Hence, the KOF EELI measures linkage of employers with other VET actors. These other VET actors can be from the education system, but they can also be other employment system actors like unions. We chose this approach for three reasons. First, capturing multidimensional linkage with as much detail as the KOF EELI would require an unfeasibly long questionnaire; simply taking a tripartite modeling approach that includes unions would double the length of the questionnaire. Second, it remains unclear how well unions can reduce information asymmetries and particularly resource asymmetries, suggesting that employer linkage might be more relevant than linkage with other actors from the employment system. Third, unions’ goals are substantially different from those of other employment system actors, which means we might need to differentiate between unions that aim to improve VET and those for whom it is a threat to skilled workers (Ryan et al. 2013). Since resolving these complex questions goes beyond the scope of this feasibility study, the KOF EELI focuses on the linkage between employers and other actors. This also enables us to apply the final index across contexts without privileging specific employment system configurations.
KO
F YL
MI
KOF EELI
Une
mpl
oym
ent R
ates
KOF EELI
Figure 2.4: Hypotheses
7
Some confusion about our definition of each system’s actors might arise in the context of workplace training. Employers’ involvement as training providers is unique to VET, and their role in this case is to host students and train them under the guidance of the pre-determined curriculum. This is different from new employee training because of the inclusion in the education system and the curriculum: trainees learn skills to prepare them for a specific career or an occupation rather than for working in the training firm. Although employers might provide training, they do so as employment-system actors.
The KOF EELI focuses strictly on measuring the degree of linkage between actors from the education and employment systems. Our hypothesis is that increased education-employment linkage will drive better labor market outcomes through increased resource- and information-sharing and better regulation. Therefore, we examine linkage exclusively and not the separate institutional frameworks of education and employment. For example, we are uninterested in the multilevel governance and subsidiarity of the education system. Similarly, we do not measure the level of employment protection legislation in the employment system. These things are important for the construction of both systems and for their quality and stability, but they do not relate to linkage between education and employment. In contrast, dual VET—in which trainees learn in both schools and the workplace—is a part of both systems and is of great interest to us. This index measures how actors really interact, communicate, and coordinate to connect education and employment; and in doing so provide a better experienced curriculum for students.
3 Methods In this section, we describe how we design and construct the KOF EELI to measure linkage according to the theoretical framework described above. Throughout the process, our goal is to measure EEL in a manner that translates across different types of systems in both education and employment, as well as different types of VET systems.
3.1 Index construction process We construct the index in four steps. The first step is to describe our conceptual framework for identifying dimensions, which represent the overarching processes in a VET program where actors from education and employment can cooperate or need regulations. The second step is to define our empirical methodology for measuring education-employment linkage. The third step is to define the more fine-grained process, which we call subdimensions: while the SABER index (World Bank, 2013a) chooses dimensions according to policy goals, our conceptual framework identifies dimensions based on processes. Also in step three, we identify the features or characteristics of each subdimension that would affect linkage. Finally, in the fourth step we aggregate all the features, subdimensions, and dimensions into the KOF EELI, which requires us to define a weighting scheme.
3.1.1 Conceptual Framework In order to address the research question, we combine the Curriculum Value Chain (CVC) framework elaborated in the first report with our economic theoretical framework that described how increased linkage leads to improved labor market outcomes for young people. In order to identify all of the VET processes where actors from education and employment might interact, we use the CVC to identify the specific processes potentially carried out by actors from both systems. This prevents us from describing the entire education and employment systems of each country as a whole, and enables us to focus on linkage outside the general cultural and social context of education and employment.
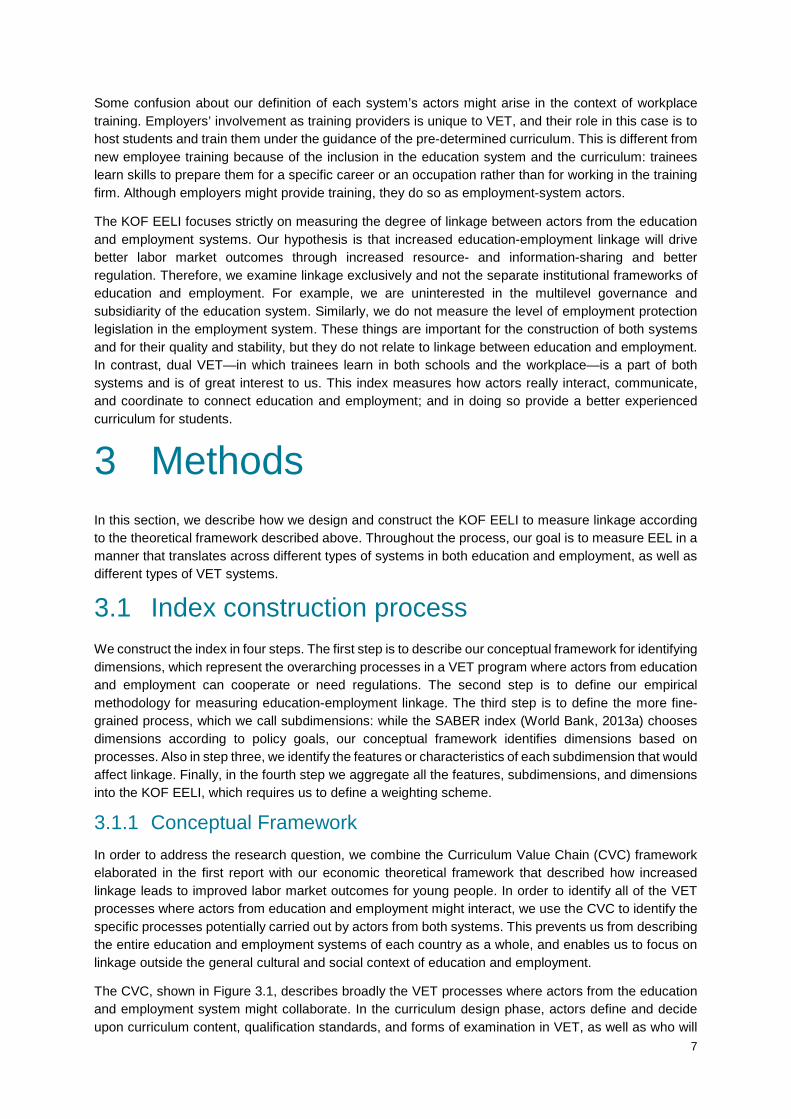
The CVC, shown in Figure 3.1, describes broadly the VET processes where actors from the education and employment system might collaborate. In the curriculum design phase, actors define and decide upon curriculum content, qualification standards, and forms of examination in VET, as well as who will
8
allocate certifications. These are called the intended (or planned) and enacted curricula. In the curriculum application phase is everything involving the actual provision of education—who is taught, by whom, where, with what equipment, and financed by whom. This combines to generate the experienced curriculum. The outcomes of the current curriculum start to appear after this phase, and they generate feedback that must be gathered, analyzed, and used to determine when the cycle should begin again and what changes should be made. That process of using feedback to re-evaluate and update the curriculum is the curriculum feedback phase, which is especially important in VET due to constant innovation and technological change affecting the requirements of the labor market.
The CVC includes all of the processes through which education and employment can share power, and its outcomes include successful entry into the labor market and productive work on the part of recent graduates. That makes the CVC an ideal conceptual framework to structure our measurement of linkage, because it helps us organize the processes in VET where linkage can occur. This builds upon the theoretical framework of the World Bank’s SABER index (World Bank, 2013a), in that the skill supply from the education system and the skill demand arising from the
employment system codetermine the match of skills to jobs and consequently labor market outcomes. Using the CVC to identify and measure VET processes allows us to focus on the relationship between actors from the education and employment systems. The CVC entails all three curriculum types—intended, enacted, and experienced—as well as the processes, enabling conditions, and contexts in which students learn. The CVC is therefore the main driver of successful transitions from school to the labor market.
Our conceptual framework deviates from the World Bank’s (2013a) in three key ways. First, as discussed above, we do not focus exclusively on how EEL overcomes the problem of information asymmetry to create a good match of skill supply and skill demand. Rather, we consider linkage to tackle the issue of resource asymmetry and the potential problems arising due to misaligned incentives of principals and agents. Second, we focus on measuring linkage between the actors from the education and employment systems, while the World Bank measures workforce development as a whole. Third, this focus allows us to define the processes governing linkage between the actors of the education and employment system in more detail than the World Bank.
The conceptual framework, illustrated in Figure 3.2, can be summarized as follows. Klieme et al (2006) suggest that education systems have three main goals: providing human capital for the production processes, enabling individuals to govern the course of their lives, and contributing to civic society. In this project, we focus on the first goal; providing human capital so that individuals can improve their labor market outcomes. If the overall goal is to have excellent labor market outcomes for young people, that implies perfect employment as at least one goal. In order to have that, a country would need to have perfect skills. To have that, VET curricula would need to have perfect content, perfectly transmitted, and perfectly up to date. That maps onto the CVC’s design, application, and updating phases.
Each of these three CVC phases represents a dimension of the KOF EELI. Figure 3.2 shows that each dimension has multiple subdimensions, which represent the processes performed in this dimension. For example, the curriculum design phase entails defining qualification standards and defining the exam form. Each of those subdimensions has multiple features, which make up the characteristics of the subdimension. In the questionnaire, each feature corresponds to a questionnaire item.
Curriculum Design Phase
Curriculum Application Phase
Curriculum Feedback Phase
Outcomes
Figure 3.1: Curriculum Value Chain (CVC)

9
3.1.2 Measurement From a theoretical point of view, the simplest methodology to measure education-employment linkage in some group of countries is by asking an expert to rate the education-employment linkage of all of the countries directly. This methodology can be made more precise by asking the hypothetical expert to rate the education-employment linkage in each dimension and/or subdimension. Unfortunately, an expert
Subdimensions Subdimensions Subdimensions
Features Features Features
Intentions
Policy Actions
Labor Market Outcomes
Perfect Employment
Perfect Skills
Perfect Content
Perfect Transmission
Perfect Updating
Dimension 1: Curriculum Design
Phase
Dimension 2: Curriculum
Application Phase
Dimension 3: Curriculum
Feedback Phase
Curriculum Value Chain
The goal is to have strong…
An ideal outcome is…
Perfect employment of youth requires…
And perfect skills require…
Figure 3.2: Operational Framework
10
who knows the details of both education and employment systems in numerous countries is very hypothetical and finding one is highly unlikely.
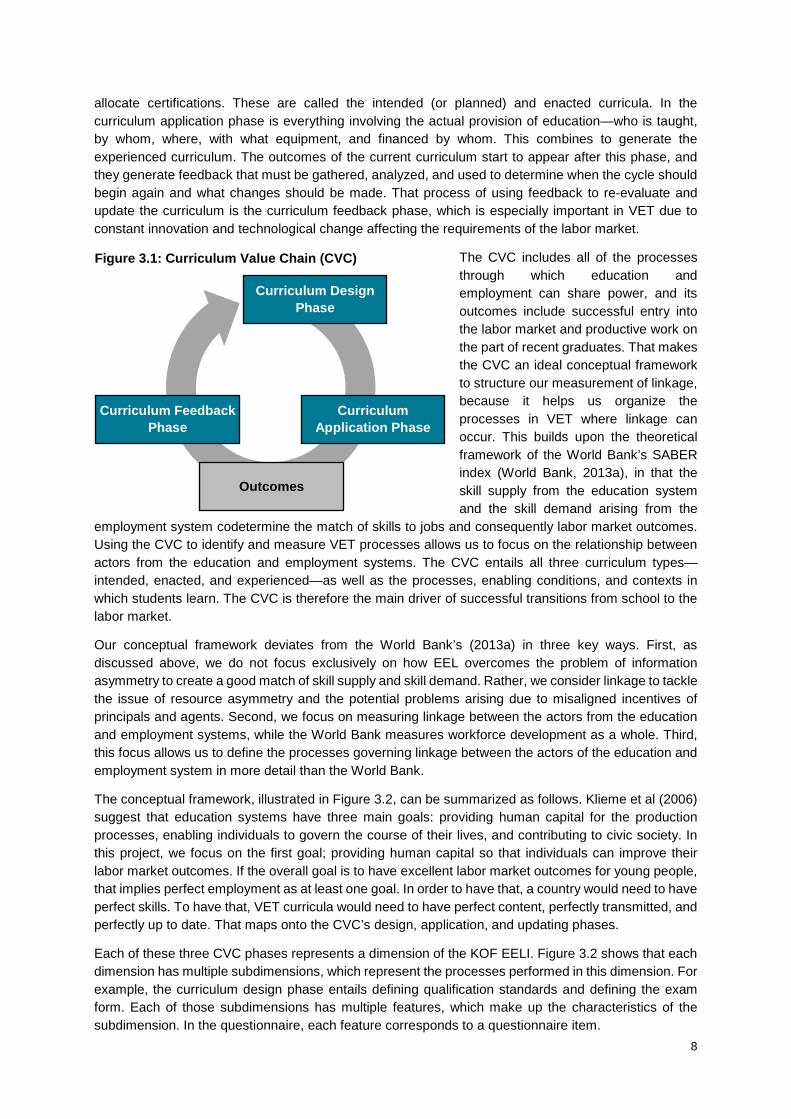
The solution to the dearth of global experts on education and employment systems is to use many experts who know the education and employment system of their own countries very well. Replace the hypothetical expert with one or more specialists for each country, then ask each to rate his or her country on each dimension of the KOF EELI. This would result in a Likert score-type rating of the extent to which the actors of the education and employment system are linked in the CVC’s design, application, and feedback phases. The following survey excerpt illustrates this method for the curriculum design phase:
Methodology 1: Dimension Assessment
Overall, how much power do employers have during the process of VET curriculum development?
− They have no power − They have little power − They have moderate power − They share power equally − They have substantial power − They have most power − They have all power
This methodology is exemplified in the ETF report (ETF 2013) that asks country experts to rate their countries’ education system in all dimensions. However, this raises the issue of comparability: how can we know each expert’s ratings are consistent with those of the others?
To ensure comparability, we could ask each country expert for objective information by pre-identifying all features relevant for linkage and asking specifically about those features. With this level of focus, we would be able to ask for objective information rather than subjective ratings, ensuring that experts’ responses are comparable. For example, instead of asking whether actors of the education and employment systems are linked in the curriculum design phase, we would ask how much employers participate in a specific part of the curriculum design process. The ILEGI uses this methodology (Al-Samarrai, 2013). The following excerpt from our questionnaire illustrates this approach:
Methodology 2: Feature Assessment
Are employers involved in defining qualification standards?
− Employers are not involved. − Employers are involved to some extent. − Employers are involved as equal partners. − Employers are the main actor. − Employers are the only actor.
Are employers involved in final decisions on qualification standards?
− Employers are not involved. − Employers are involved to some extent. − Employers are involved as equal partners. − Employers are the main actor. − Employers are the only actor.
Is the participation of employers in the process of VET curriculum development defined by law?
− No, the law doesn’t specify participation rights − Yes, the law requires participation but doesn’t specify how
11
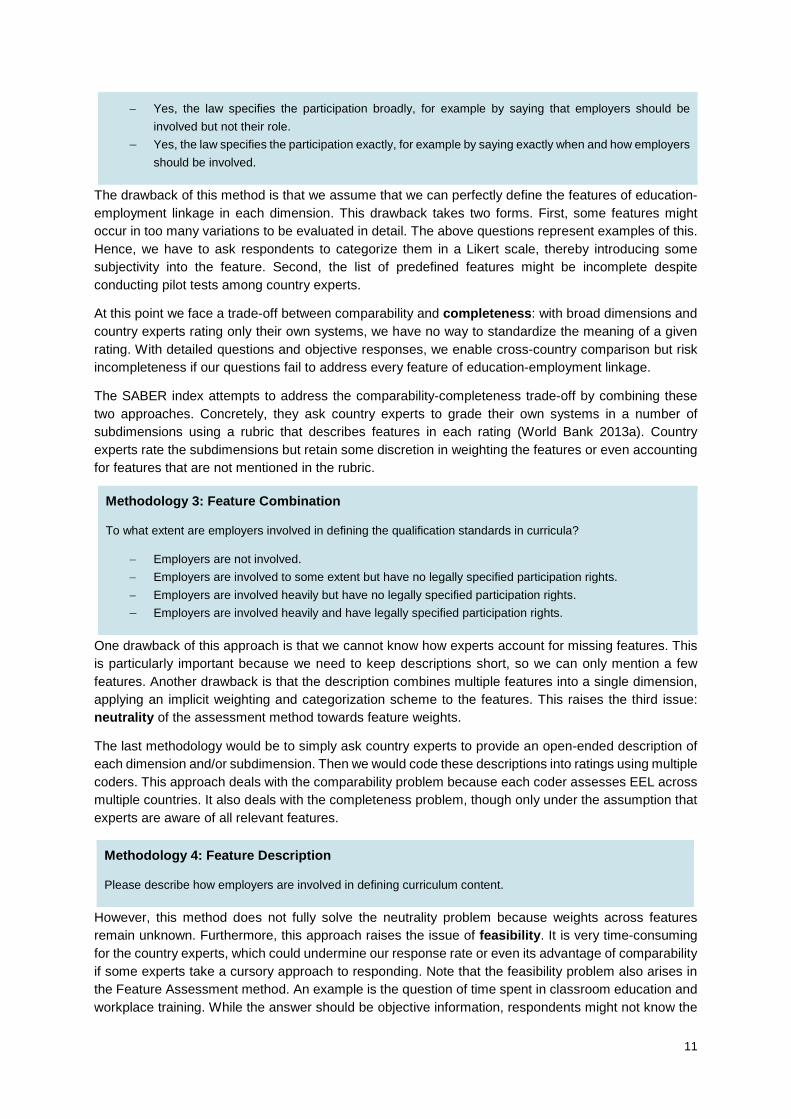
− Yes, the law specifies the participation broadly, for example by saying that employers should be involved but not their role.
− Yes, the law specifies the participation exactly, for example by saying exactly when and how employers should be involved.
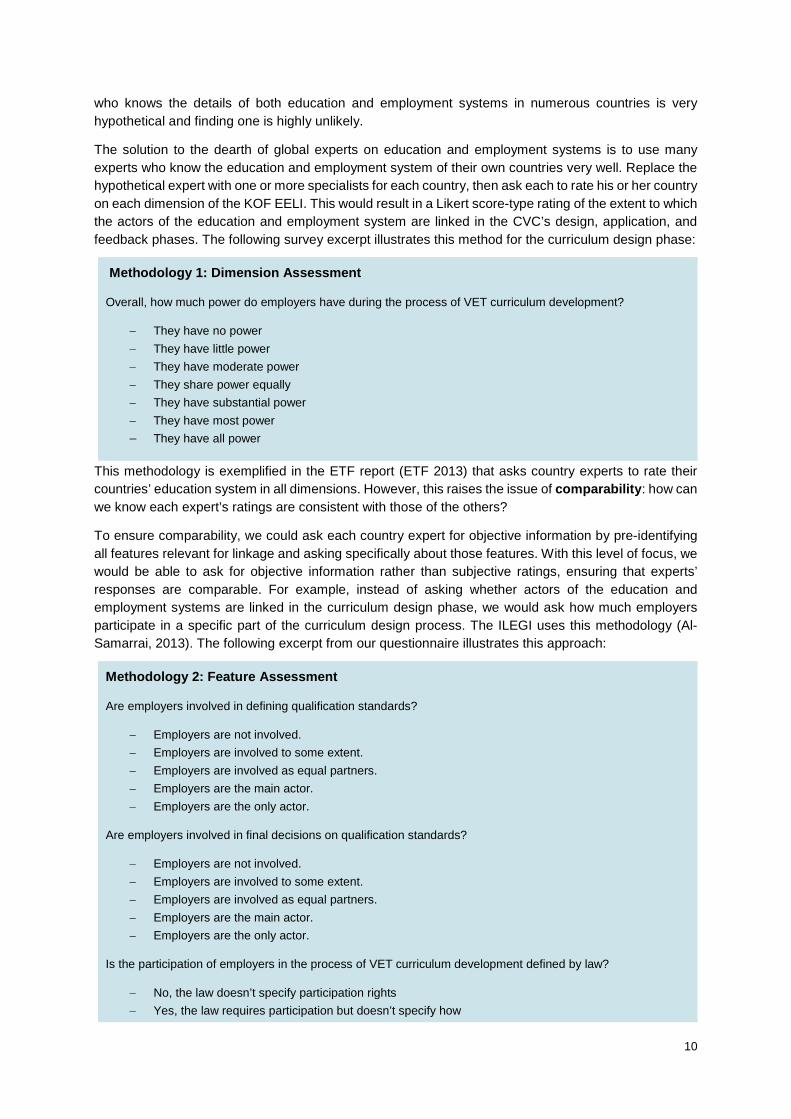
The drawback of this method is that we assume that we can perfectly define the features of education-employment linkage in each dimension. This drawback takes two forms. First, some features might occur in too many variations to be evaluated in detail. The above questions represent examples of this. Hence, we have to ask respondents to categorize them in a Likert scale, thereby introducing some subjectivity into the feature. Second, the list of predefined features might be incomplete despite conducting pilot tests among country experts.
At this point we face a trade-off between comparability and completeness: with broad dimensions and country experts rating only their own systems, we have no way to standardize the meaning of a given rating. With detailed questions and objective responses, we enable cross-country comparison but risk incompleteness if our questions fail to address every feature of education-employment linkage.
The SABER index attempts to address the comparability-completeness trade-off by combining these two approaches. Concretely, they ask country experts to grade their own systems in a number of subdimensions using a rubric that describes features in each rating (World Bank 2013a). Country experts rate the subdimensions but retain some discretion in weighting the features or even accounting for features that are not mentioned in the rubric.
Methodology 3: Feature Combination
To what extent are employers involved in defining the qualification standards in curricula?
− Employers are not involved. − Employers are involved to some extent but have no legally specified participation rights. − Employers are involved heavily but have no legally specified participation rights. − Employers are involved heavily and have legally specified participation rights.
One drawback of this approach is that we cannot know how experts account for missing features. This is particularly important because we need to keep descriptions short, so we can only mention a few features. Another drawback is that the description combines multiple features into a single dimension, applying an implicit weighting and categorization scheme to the features. This raises the third issue: neutrality of the assessment method towards feature weights.
The last methodology would be to simply ask country experts to provide an open-ended description of each dimension and/or subdimension. Then we would code these descriptions into ratings using multiple coders. This approach deals with the comparability problem because each coder assesses EEL across multiple countries. It also deals with the completeness problem, though only under the assumption that experts are aware of all relevant features.
However, this method does not fully solve the neutrality problem because weights across features remain unknown. Furthermore, this approach raises the issue of feasibility. It is very time-consuming for the country experts, which could undermine our response rate or even its advantage of comparability if some experts take a cursory approach to responding. Note that the feasibility problem also arises in the Feature Assessment method. An example is the question of time spent in classroom education and workplace training. While the answer should be objective information, respondents might not know the
Methodology 4: Feature Description
Please describe how employers are involved in defining curriculum content.
12
exact answer might be unwilling to respond. One solution to this issue is to ask this question with a Likert scale set of answers for none, some, half, most and all of the students’ time spent at the workplace. This approach addresses the feasibility problem but also introduces some subjectivity and brings back the issue of comparability.
An ideal approach needs to balance comparability, completeness, neutrality, and feasibility. Since none of the possible methods fulfills all conditions, we combine three of the methods. Concretely, we start by applying the first approach of asking respondents to rate EEL in each of the three dimensions. This Dimension Assessment method fulfills the completeness, neutrality and feasibility conditions. In order to assess comparability of responses, we complement these broad questions with the Feature Assessment approach, which asks for objective information on each feature. In our policy analysis, we mainly focus on the index built from experts’ assessment of features, while the index based on overall assessments allows us to check the feature lists’ completeness. Furthermore, we combine the data from both approaches to create data-driven weights of features, thereby addressing the neutrality problem.
Appendix 2 provides a detailed analysis of this process of combining the Dimension Assessment and Feature Assessment methods. The analysis suggests that the indices based on the assessment of features and dimensions yield comparable values. Therefore, an index based on feature assessments fulfills the completeness condition. To reduce the completeness problem even further, we draw on Feature Description and include an open-ended question on missing features in each dimension.
One other approach we could use would be to use the vignette technique, which is gaining popularity in survey research. However, that method will not be necessary for every item on the questionnaire and it is not feasible to create vignettes for every single item before we know which ones require such effort. We choose to perform the first wave of the KOF EELI without vignettes in order to identify the items that cause confusion, then apply the vignette method in the second release of the index to those that need detailed explanation.
3.1.3 Identifying subdimensions and features in each dimension We measure the degree of linkage as the intensity of interaction on specific VET processes. This is accomplished by identifying all VET processes where actors from the education and employment
systems can share power, then developing an index that asks our country experts to rate the intensity of interaction in each specific process for their own system. By breaking linkage down into the characteristics of these processes, we generate a measure of linkage that is not bound to a specific culture, society, or set of VET institutions.
In correspondence with the overarching processes, we use the three phases of the CVC as dimensions: curriculum design, curriculum application, and curriculum feedback. Within each of those, we identify subdimensions, or the detailed processes within each CVC phase. We break those subdimensions further down into features, capturing the characteristics of processes defining linkage and representing individual items in the questionnaire. We focus on linkage by including only those that meet the actor-based definition of linkage: involvement from both actors of the education and employment system. Since we are asking only about education programs, we start from the assumption that education partners are involved in each country. Therefore, the questionnaire asks about the specific intensity of actor involvement from the employment system, which cuts down on the length of the questionnaire without compromising completeness. In the end, each questionnaire item represents a single feature. We add an open-ended question to each dimension to cover potential missing features.
Our strategy should generate a measure of linkage that is not bound to a specific culture, society, or set of VET institutions.
An ideal approach balances comparability, completeness, neutrality, and feasibility. Therefore, we combine dimension assessment with feature assessment and add feature descriptions as a check.

13
Figure 3.3 shows that the CVC phases correspond to policy goals, which provides a link to the dimension-based framework employed by the SABER index. However, unlike SABER, our dimension framework takes a process-oriented approach rather than defining policy goals. This makes sense in the context of identifying linkage rather than SABER’s goal of supporting workforce development policy. Our process orientation becomes particularly clear in the choice of subdimensions, which capture the processes within the three CVC phases.
The curriculum design phase is the subdimensions involved in creating the curriculum that guides the education process. The first subdimensions are about defining qualification standards. The second set of subdimensions are about defining the exam form. Note we capture the content of exams in the curriculum application phase. More generally, the curriculum design phase captures the processes of determining the curriculum, while the curriculum application phase captures the resulting processes of education and training. Simply speaking, once students are involved in the process we include it in the curriculum application phase. The remaining subdimension in the curriculum design phase captures the quality of cooperation. This subdimension is an exception from the above definition, as it affects the subdimensions for qualification standards and exam form definition instead of being a process on its own. Because it is so important and because asking respondents to rate each feature in all quality dimensions is not feasible, we chose to include it as a separate subdimension.
The curriculum application phase entails six subdimensions. The learning place subdimension captures the extent to which learning takes place in a classroom or in a workplace environment. The workplace regulation subdimension describes how quality is ensured for learning in the workplace environment. The cost sharing subdimension captures how much employers contributes to the costs of education and training. The curriculum application phase also contains two subdimensions that refer to the processes through which information flows from the firms to the students in school through the provision of equipment and classroom teachers. The last subdimension of the curriculum application phase captures how much of the examination is practical, and how the program ensures examination quality.
The curriculum feedback phase has two subdimensions. The first is about information gathering, both of labor market outcomes for individuals and on the skills demanded by firms. The second subdimension is about the role of employers in determining when a curriculum should be revised.
Finally, we break the subdimensions further down into features that affect the education-employment linkage level of each subdimension. An overview of the outcome of this process is shown in Table 1. Table A1 (Appendix 1) shows the full list of features in the KOF EELI and the survey questions measuring each one.
Dimensions
Subd
imen
sion
s
Curriculum Design Phase
Curriculum Application Phase
Curriculum Feedback Phase
Qualification standards determination
Examination form determination
Involvement quality
Learning place
Workplace regulation
Cost sharing
Equipment provision
Teacher provision
Examination
Information gathering
Update timing
Figure 3.3: KOF EELI dimensions and subdimensions

14
3.1.4 Assessment level Even if we focus strictly on EEL, our 20 VET pathways have a multitude of curricula for occupations or qualifications within a given program, and multiple programs within the VET pathway. The VET pathway is all programs that intend to prepare students for labor market entry instead of only higher general or academic education. VET includes multiple programs, which are the different structures to earn qualifications. For example, students in a single VET pathway might choose among a four-year school-based program, a three-year apprenticeship program that takes place largely in the workplace, or a career-preparation program oriented to a field of work or study with mostly general content. Each of these includes multiple curricula for specific fields, jobs, careers, or occupations. In this report we use the term curriculum to refer to a particular curriculum within a VET program.
VET programs in a single country can be very different in many ways including linkage, and this heterogeneity takes three forms. First, VET exists on two education levels; upper secondary and tertiary. We focus on upper secondary VET, in which students are typically around 15 to 19 years old.
Second, a single country might offer multiple VET programs at the upper secondary level. Feasibility considerations force us to focus on the most prevalent VET program in each country; the one that serves the most students. Table 3.1 provides a list of VET programs at the upper secondary level along with how many students are enrolled in each out of all upper secondary VET students. Among these programs, we select the program in each country with the highest enrollment. Therefore, the KOF EELI presented in this study describes a particular program rather than the EEL of the whole upper secondary education level. In the future, we would ideally have the resources to describe the upper secondary VET pathway of each country as a whole. When we do that, we can calculate the KOF EELI on the country level as a weighted average of EEL across programs p, in country c according to the share of enrollments in the program, ω:
𝐾𝐾𝐾𝐾𝐾𝐾 𝐸𝐸𝐸𝐸𝐸𝐸𝐸𝐸𝑐𝑐 = �𝜔𝜔𝑝𝑝𝑐𝑐 ∗ 𝐾𝐾𝐾𝐾𝐾𝐾 𝐸𝐸𝐸𝐸𝐸𝐸𝐸𝐸𝑝𝑝𝑐𝑐
𝑃𝑃
𝑝𝑝=1
Finally, education and training might be heterogeneous within a VET program. This might arise because regions or schools have substantial leeway in determining the content and form of the VET program. Alternatively, it might arise because the VET program differs across fields of education and curricula. We address this issue by asking country experts to consider the average situation within the program.
In order to illustrate the potential of heterogeneity of EEL within a VET program, Figure 3.4 shows the role of schools, regional governments and national governments in the curriculum design phase using data from our questionnaire. A value of one indicates that the actor plays no role. Values of two and three suggest that it provides information and makes proposals, respectively. The maximum value of four indicates that the actor makes the final decision. Even though respondents were free to indicate any role for any actor, the results suggest that countries with more intense roles for the national government have correspondingly less intense roles for regional governments.
Figure 3.4 shows that regional governments play no role in most countries. However, in Poland, only the regional government matters and the national government plays no role. National and regional governments share responsibilities in Austria, Switzerland, and Estonia, while the regional government acts as a junior partner in Japan, South Korea, and Taiwan. In Hong Kong, the national and regional
VET Pathway: All education programs that prepare students specifically for the labor market instead of only general higher education.
Programs: Different ways VET is organized within the pathway, such as apprenticeships, school-based VET, or career preparation. These contain multiple curricula.
Curricula: We use this term to refer to all courses within a VET program. These might lead to modules, sub-qualifications, or full qualifications for jobs, careers, fields, and occupations.

15
governments delegate curriculum design to schools. Schools also play a decisive role in Shanghai, Estonia, Poland, and the Netherlands. With the exception of Austria and Finland, schools generally play some role in the curriculum design phase.
This shows that substantial heterogeneity exists across schools and/or regions within a VET program. It would be ideal to calculate the KOF EELI using data from every single actor at the lowest possible level and aggregate up from there, but that is not feasible. Therefore, we bear in mind that the KOF EELI presented here is about the average situation as perceived by experts and might mask substantial heterogeneity in some cases.
Table 3.1 shows which programs we select in each country along with all other VET programs at the upper secondary level. We chose the program with the highest enrollments out of all VET programs in upper secondary education, except in the case of Singapore (see Singapore case study for more information). Our selected programs range from about half of all VET enrollments to fully all VET enrollments when the program is the only one available. Table 3.1 also shows enrollment in VET overall as a percentage of all upper-secondary education, and VET ranges from very few (Japan, 17%) or about a quarter of all upper secondary students (Japan, Lithuania) to the vast majority (Austria, 80%).
Table 3.1: Upper secondary VET programs and enrollment by country
Country Main Program(s)
VET (% of all upper
secondary)
Program (% of VET)
Number of curricula/ qualifications
Focus Countries
Denmark4 45% 111 w/ 301 steps & concentrations
EUD Program 99.4% EUX Program 0.6%
Hong Kong5 7% 46 Occupations Diploma in Vocational Education (DVE) 71.4% Other VET programs 28.6%
4CEDEFOP (2014a); Statistics Denmark (2016) 5VTC (2016).
0
1
2
3
4
AT CH DK
DE PL IS SI EE NO FI
Aver
age
LU NL
TW CN HK
SG KR JP AT CH DK
DE PL IS SI EE NO FI
Aver
age
LU NL
TW CN HK
SG KR JP AT CH DK
DE PL IS SI EE NO FI
Aver
age
LU NL
TW CN HK
SG KR JP
Figure 3.4: Role of actors in curriculum design by country
Schools Regional Gov.s National Gov.s
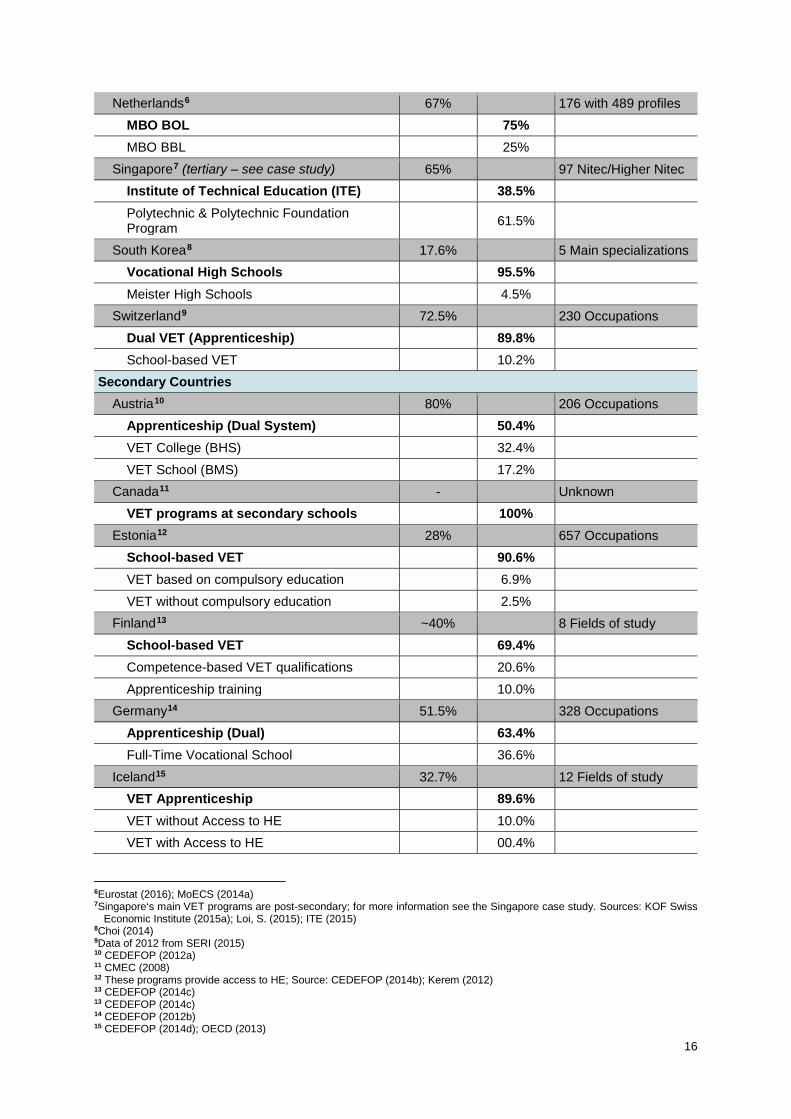
16
Netherlands6 67% 176 with 489 profiles MBO BOL 75% MBO BBL 25%
Singapore7 (tertiary – see case study) 65% 97 Nitec/Higher Nitec Institute of Technical Education (ITE) 38.5% Polytechnic & Polytechnic Foundation Program 61.5%
South Korea8 17.6% 5 Main specializations Vocational High Schools 95.5% Meister High Schools 4.5%
Switzerland9 72.5% 230 Occupations Dual VET (Apprenticeship) 89.8% School-based VET 10.2%
Secondary Countries Austria10 80% 206 Occupations
Apprenticeship (Dual System) 50.4% VET College (BHS) 32.4% VET School (BMS) 17.2%
Canada11 - Unknown VET programs at secondary schools 100%
Estonia12 28% 657 Occupations School-based VET 90.6% VET based on compulsory education 6.9% VET without compulsory education 2.5%
Finland13 ~40% 8 Fields of study School-based VET 69.4% Competence-based VET qualifications 20.6% Apprenticeship training 10.0%
Germany14 51.5% 328 Occupations Apprenticeship (Dual) 63.4% Full-Time Vocational School 36.6%
Iceland15 32.7% 12 Fields of study VET Apprenticeship 89.6% VET without Access to HE 10.0% VET with Access to HE 00.4%
6Eurostat (2016); MoECS (2014a) 7Singapore‘s main VET programs are post-secondary; for more information see the Singapore case study. Sources: KOF Swiss
Economic Institute (2015a); Loi, S. (2015); ITE (2015) 8Choi (2014) 9Data of 2012 from SERI (2015) 10 CEDEFOP (2012a) 11 CMEC (2008) 12 These programs provide access to HE; Source: CEDEFOP (2014b); Kerem (2012) 13 CEDEFOP (2014c) 13 CEDEFOP (2014c) 14 CEDEFOP (2012b) 15 CEDEFOP (2014d); OECD (2013)

17
Japan16 24.2% 8 School types Specialized High Schools (vocational) 78.2% Comprehensive High Schools 21.8% Specialized High Schools (Dual VET Experiments) Negligible
Lithuania17 26.8% 10 Sectoral standards School-based VET Main Apprenticeship Negligible
Luxembourg18 68% 7 Occupations Technical Secondary School-Leaving Diploma 45.6%
Technician’s Diploma (Dual) 25.5% Vocational programs (Dual) 28.9%
Norway19 52% ~ 180 occupations Apprenticeship (2+2 System) 72.8% School-based VET 27.2%
Poland20 56.5% 200 Occupations School-based VET 72.4% Basic vocational (partly dual) 25.9% Special job training 01.5% Supplementary technical secondary 00.1%
Shanghai21 43% 270 Occupations Vocational Schools 100%
Slovenia22 59.7% 48 Occupations Technical Upper Secondary (School-Based) 65.4%
Vocational Upper Secondary (Dual) 24.6% Vocational-Technical Upper Secondary 07.7% Short VET (Dual) 01.6% Vocational Matura Course 00.7%
Taiwan23 47.9% Unknown Senior Vocational High Schools Main VET at Comprehensive Senior High Schools Less Professional Programs Less
16 Ichimi, M. (2012); MEXT (2016); Comprehensive High Schools combine general and vocational curricula. 17 CEDEFOP (2014e) 18 CEDEFOP (2015); CEDEFOP (2012d) 19 CEDEFOP (2014f) 20 CEDEFOP (2014g). Supplemental Technical Secondary program exists only until 2015. 21 OECD (2010): ) 22 CEDEFOP (2014j) 23 MOE Taiwan (2012); MOE Taiwan (2013)
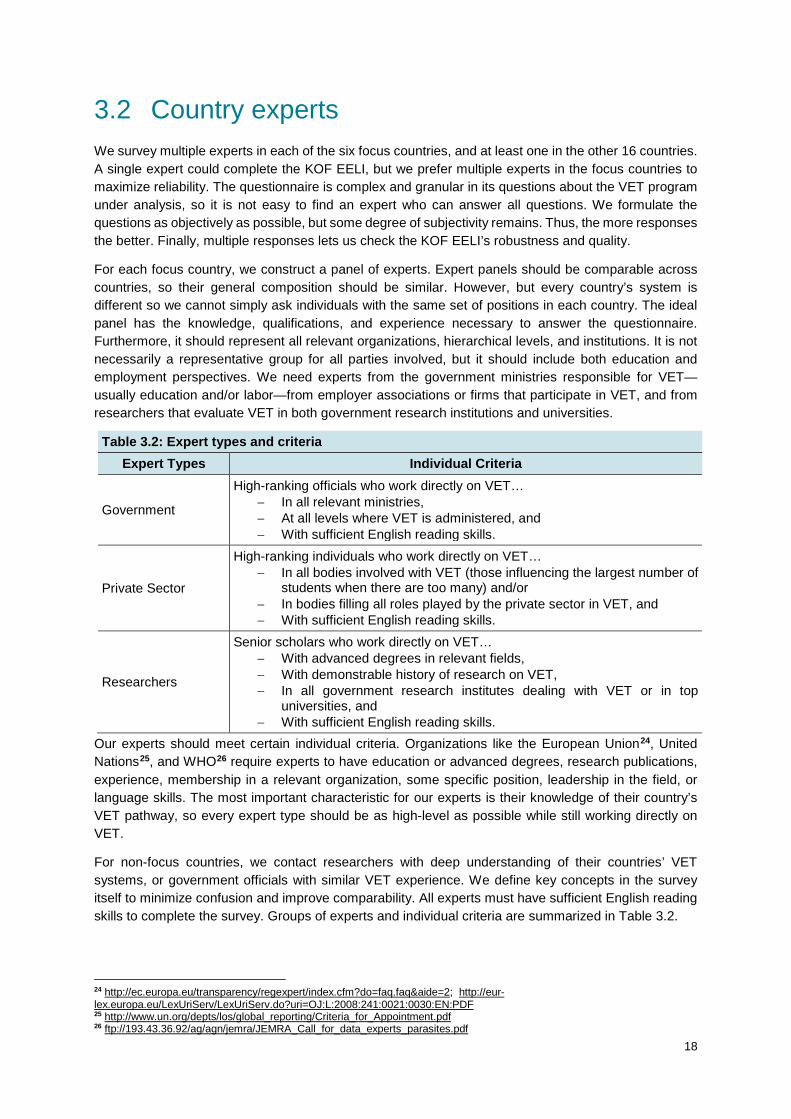
18
3.2 Country experts We survey multiple experts in each of the six focus countries, and at least one in the other 16 countries. A single expert could complete the KOF EELI, but we prefer multiple experts in the focus countries to maximize reliability. The questionnaire is complex and granular in its questions about the VET program under analysis, so it is not easy to find an expert who can answer all questions. We formulate the questions as objectively as possible, but some degree of subjectivity remains. Thus, the more responses the better. Finally, multiple responses lets us check the KOF EELI’s robustness and quality.
For each focus country, we construct a panel of experts. Expert panels should be comparable across countries, so their general composition should be similar. However, but every country’s system is different so we cannot simply ask individuals with the same set of positions in each country. The ideal panel has the knowledge, qualifications, and experience necessary to answer the questionnaire. Furthermore, it should represent all relevant organizations, hierarchical levels, and institutions. It is not necessarily a representative group for all parties involved, but it should include both education and employment perspectives. We need experts from the government ministries responsible for VET—usually education and/or labor—from employer associations or firms that participate in VET, and from researchers that evaluate VET in both government research institutions and universities.
Table 3.2: Expert types and criteria Expert Types Individual Criteria
Government
High-ranking officials who work directly on VET… − In all relevant ministries, − At all levels where VET is administered, and − With sufficient English reading skills.
Private Sector
High-ranking individuals who work directly on VET… − In all bodies involved with VET (those influencing the largest number of
students when there are too many) and/or − In bodies filling all roles played by the private sector in VET, and − With sufficient English reading skills.
Researchers
Senior scholars who work directly on VET… − With advanced degrees in relevant fields, − With demonstrable history of research on VET, − In all government research institutes dealing with VET or in top
universities, and − With sufficient English reading skills.
Our experts should meet certain individual criteria. Organizations like the European Union24, United Nations25, and WHO26 require experts to have education or advanced degrees, research publications, experience, membership in a relevant organization, some specific position, leadership in the field, or language skills. The most important characteristic for our experts is their knowledge of their country’s VET pathway, so every expert type should be as high-level as possible while still working directly on VET.
For non-focus countries, we contact researchers with deep understanding of their countries’ VET systems, or government officials with similar VET experience. We define key concepts in the survey itself to minimize confusion and improve comparability. All experts must have sufficient English reading skills to complete the survey. Groups of experts and individual criteria are summarized in Table 3.2.
24 http://ec.europa.eu/transparency/regexpert/index.cfm?do=faq.faq&aide=2; http://eur-lex.europa.eu/LexUriServ/LexUriServ.do?uri=OJ:L:2008:241:0021:0030:EN:PDF 25 http://www.un.org/depts/los/global_reporting/Criteria_for_Appointment.pdf 26 ftp://193.43.36.92/ag/agn/jemra/JEMRA_Call_for_data_experts_parasites.pdf
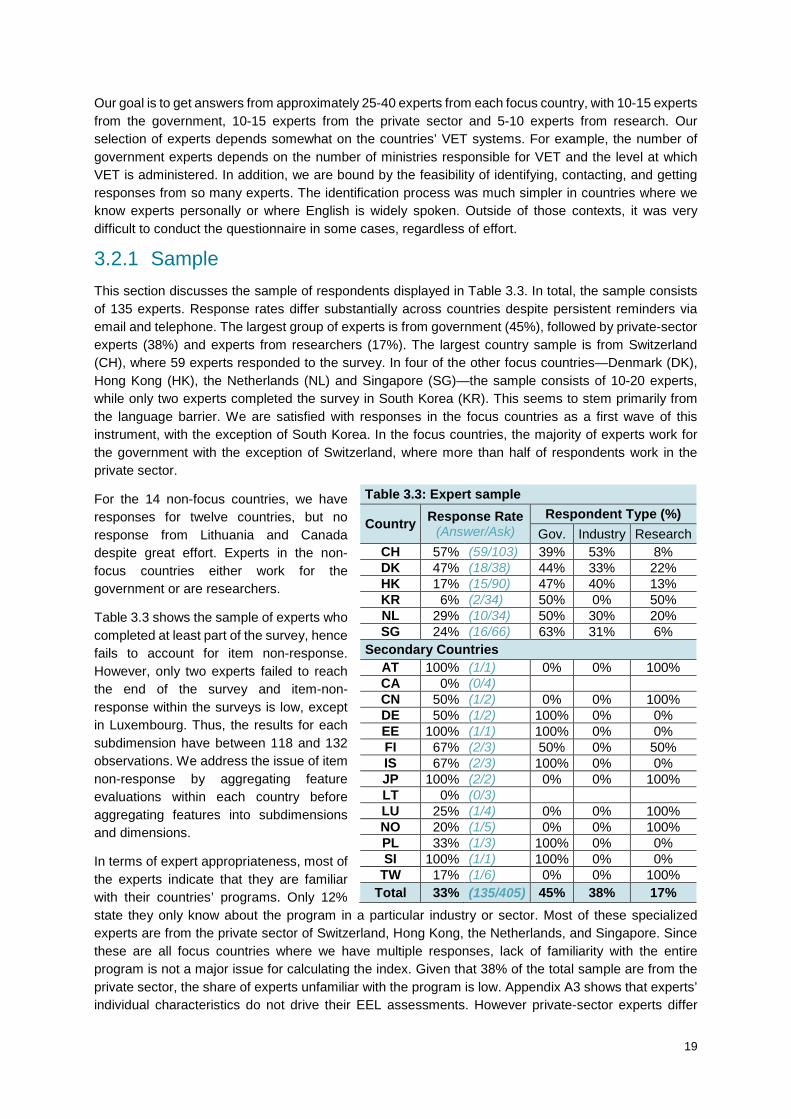
19
Our goal is to get answers from approximately 25-40 experts from each focus country, with 10-15 experts from the government, 10-15 experts from the private sector and 5-10 experts from research. Our selection of experts depends somewhat on the countries’ VET systems. For example, the number of government experts depends on the number of ministries responsible for VET and the level at which VET is administered. In addition, we are bound by the feasibility of identifying, contacting, and getting responses from so many experts. The identification process was much simpler in countries where we know experts personally or where English is widely spoken. Outside of those contexts, it was very difficult to conduct the questionnaire in some cases, regardless of effort.
3.2.1 Sample This section discusses the sample of respondents displayed in Table 3.3. In total, the sample consists of 135 experts. Response rates differ substantially across countries despite persistent reminders via email and telephone. The largest group of experts is from government (45%), followed by private-sector experts (38%) and experts from researchers (17%). The largest country sample is from Switzerland (CH), where 59 experts responded to the survey. In four of the other focus countries—Denmark (DK), Hong Kong (HK), the Netherlands (NL) and Singapore (SG)—the sample consists of 10-20 experts, while only two experts completed the survey in South Korea (KR). This seems to stem primarily from the language barrier. We are satisfied with responses in the focus countries as a first wave of this instrument, with the exception of South Korea. In the focus countries, the majority of experts work for the government with the exception of Switzerland, where more than half of respondents work in the private sector.
For the 14 non-focus countries, we have responses for twelve countries, but no response from Lithuania and Canada despite great effort. Experts in the non-focus countries either work for the government or are researchers.
Table 3.3 shows the sample of experts who completed at least part of the survey, hence fails to account for item non-response. However, only two experts failed to reach the end of the survey and item-non-response within the surveys is low, except in Luxembourg. Thus, the results for each subdimension have between 118 and 132 observations. We address the issue of item non-response by aggregating feature evaluations within each country before aggregating features into subdimensions and dimensions.
In terms of expert appropriateness, most of the experts indicate that they are familiar with their countries’ programs. Only 12% state they only know about the program in a particular industry or sector. Most of these specialized experts are from the private sector of Switzerland, Hong Kong, the Netherlands, and Singapore. Since these are all focus countries where we have multiple responses, lack of familiarity with the entire program is not a major issue for calculating the index. Given that 38% of the total sample are from the private sector, the share of experts unfamiliar with the program is low. Appendix A3 shows that experts’ individual characteristics do not drive their EEL assessments. However private-sector experts differ
Table 3.3: Expert sample
Country Response Rate (Answer/Ask)
Respondent Type (%) Gov. Industry Research
CH 57% (59/103) 39% 53% 8% DK 47% (18/38) 44% 33% 22% HK 17% (15/90) 47% 40% 13% KR 6% (2/34) 50% 0% 50% NL 29% (10/34) 50% 30% 20% SG 24% (16/66) 63% 31% 6%
Secondary Countries AT 100% (1/1) 0% 0% 100% CA 0% (0/4) CN 50% (1/2) 0% 0% 100% DE 50% (1/2) 100% 0% 0% EE 100% (1/1) 100% 0% 0% FI 67% (2/3) 50% 0% 50% IS 67% (2/3) 100% 0% 0% JP 100% (2/2) 0% 0% 100% LT 0% (0/3) LU 25% (1/4) 0% 0% 100% NO 20% (1/5) 0% 0% 100% PL 33% (1/3) 100% 0% 0% SI 100% (1/1) 100% 0% 0%
TW 17% (1/6) 0% 0% 100% Total 33% (135/405) 45% 38% 17%
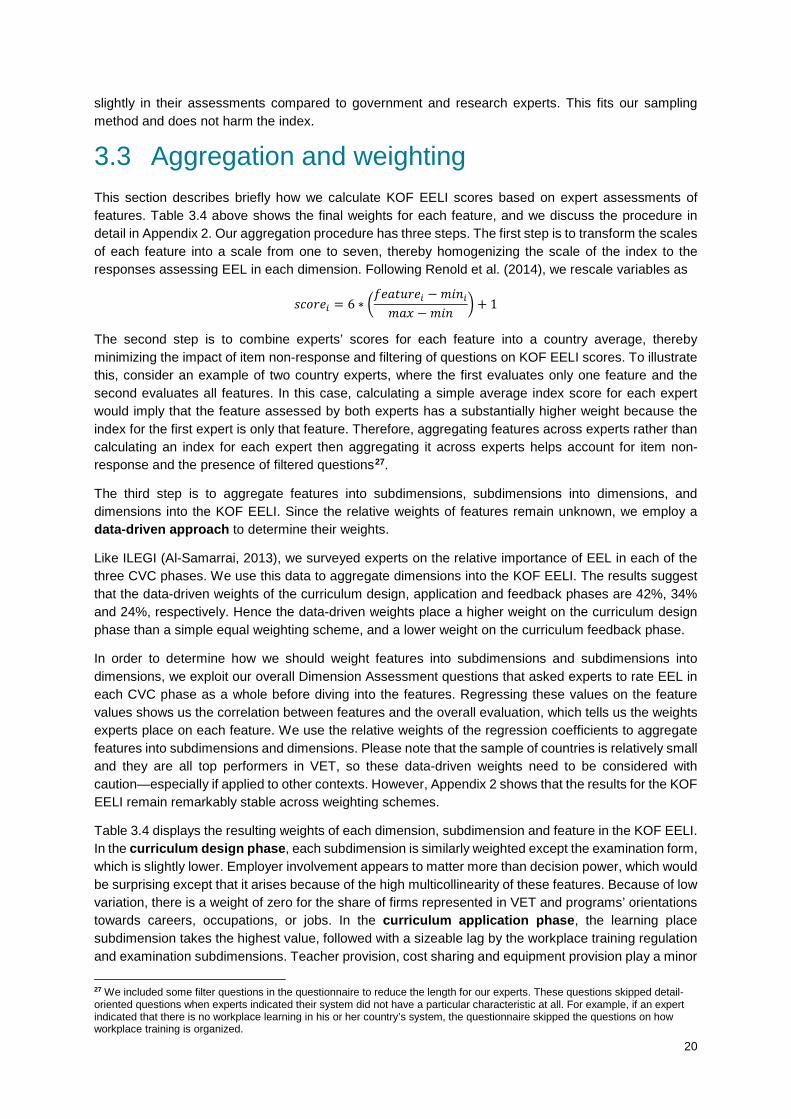
20
slightly in their assessments compared to government and research experts. This fits our sampling method and does not harm the index.
3.3 Aggregation and weighting This section describes briefly how we calculate KOF EELI scores based on expert assessments of features. Table 3.4 above shows the final weights for each feature, and we discuss the procedure in detail in Appendix 2. Our aggregation procedure has three steps. The first step is to transform the scales of each feature into a scale from one to seven, thereby homogenizing the scale of the index to the responses assessing EEL in each dimension. Following Renold et al. (2014), we rescale variables as
𝑠𝑠𝑠𝑠𝑠𝑠𝑠𝑠𝑠𝑠𝑖𝑖 = 6 ∗ �𝑓𝑓𝑠𝑠𝑓𝑓𝑓𝑓𝑓𝑓𝑠𝑠𝑠𝑠𝑖𝑖 − 𝑚𝑚𝑚𝑚𝑚𝑚𝑖𝑖𝑚𝑚𝑓𝑓𝑚𝑚 − 𝑚𝑚𝑚𝑚𝑚𝑚
� + 1
The second step is to combine experts’ scores for each feature into a country average, thereby minimizing the impact of item non-response and filtering of questions on KOF EELI scores. To illustrate this, consider an example of two country experts, where the first evaluates only one feature and the second evaluates all features. In this case, calculating a simple average index score for each expert would imply that the feature assessed by both experts has a substantially higher weight because the index for the first expert is only that feature. Therefore, aggregating features across experts rather than calculating an index for each expert then aggregating it across experts helps account for item non-response and the presence of filtered questions27.
The third step is to aggregate features into subdimensions, subdimensions into dimensions, and dimensions into the KOF EELI. Since the relative weights of features remain unknown, we employ a data-driven approach to determine their weights.
Like ILEGI (Al-Samarrai, 2013), we surveyed experts on the relative importance of EEL in each of the three CVC phases. We use this data to aggregate dimensions into the KOF EELI. The results suggest that the data-driven weights of the curriculum design, application and feedback phases are 42%, 34% and 24%, respectively. Hence the data-driven weights place a higher weight on the curriculum design phase than a simple equal weighting scheme, and a lower weight on the curriculum feedback phase.
In order to determine how we should weight features into subdimensions and subdimensions into dimensions, we exploit our overall Dimension Assessment questions that asked experts to rate EEL in each CVC phase as a whole before diving into the features. Regressing these values on the feature values shows us the correlation between features and the overall evaluation, which tells us the weights experts place on each feature. We use the relative weights of the regression coefficients to aggregate features into subdimensions and dimensions. Please note that the sample of countries is relatively small and they are all top performers in VET, so these data-driven weights need to be considered with caution—especially if applied to other contexts. However, Appendix 2 shows that the results for the KOF EELI remain remarkably stable across weighting schemes.
Table 3.4 displays the resulting weights of each dimension, subdimension and feature in the KOF EELI. In the curriculum design phase, each subdimension is similarly weighted except the examination form, which is slightly lower. Employer involvement appears to matter more than decision power, which would be surprising except that it arises because of the high multicollinearity of these features. Because of low variation, there is a weight of zero for the share of firms represented in VET and programs’ orientations towards careers, occupations, or jobs. In the curriculum application phase, the learning place subdimension takes the highest value, followed with a sizeable lag by the workplace training regulation and examination subdimensions. Teacher provision, cost sharing and equipment provision play a minor 27 We included some filter questions in the questionnaire to reduce the length for our experts. These questions skipped detail-oriented questions when experts indicated their system did not have a particular characteristic at all. For example, if an expert indicated that there is no workplace learning in his or her country’s system, the questionnaire skipped the questions on how workplace training is organized.

21
role in determining EEL. In the curriculum feedback phase, employer involvement defines EEL almost exclusively, while information gathering receives a very small weight.
Table 3.4: Final weighting scheme Dimension
Subdimension Feature
Weight (% of total index)
Curriculum Design Phase 41.9 Qualification Standards 15.8
Qualification Standards: Involvement 15.8 Qualification Standards: Decision Power 0.0**
Examination Form 11.8 Examination Form: Involvement 11.8 Examination Form: Decision Power 0.0**
Involvement Quality 14.3 Career vs Occupation vs Job 0.0** Firms vs Employer Associations 4.0 Represented Firm Share 0.1 Legal Def. of Involvement 10.2
Curriculum Application Phase 34.4 Learning Place 13.2
Classroom vs Workplace Share* 13.2 Legal Def. of Share 0.0**
Workplace Training Regulation 8.6 Work Contract 1.7 Workplace Training Curriculum: Existence 0.0** Workplace Training Curriculum: Implementation 6.9 Legal Def. of Workplace Trainer* 0.0**
Cost Sharing 1.5 Cost Sharing Classroom Education 1.5 Cost Sharing Workplace Training 0.0**
Equipment Provision 0.0 Employer Share Equipment Provision* 0.0**
Teacher Provision 3.2 Classroom Education Provision by Employers* 3.2
Examination 8.0 Practical Share of Examination 0.0** Practical Examination* 0.3 Practical Examination Experts* 7.7
Curriculum Feedback Phase 23.7 Information Gathering 1.2
Employer Surveys 0.7 Labor Force Surveys 0.5
Update Timing 22.5 Employer Involvement 15.7 Legal Def. Employer Involvement 6.7
Total 100% Dimensions
100% Sub-dimensions
100% Features
*These features are combinations of smaller, related features. For the full components, see Appendix A3
**These features have 0% weight in the total index because of low variation, collinearity with another feature, or irrelevance.
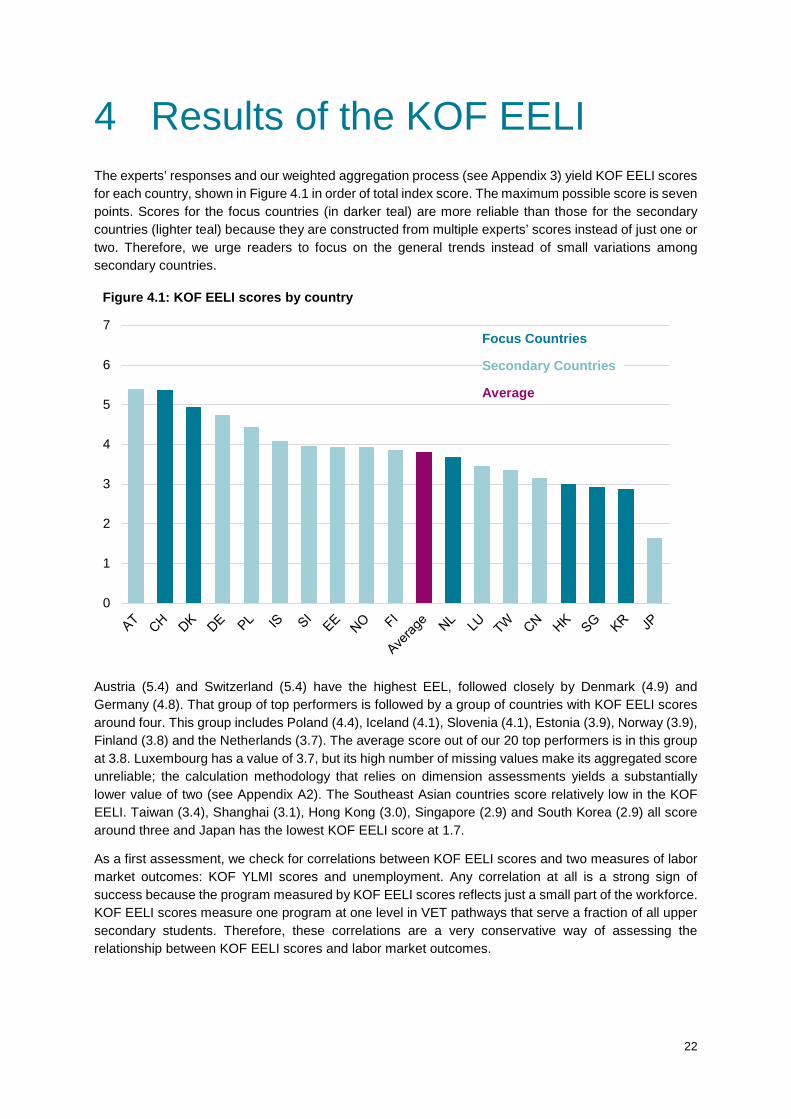
22
4 Results of the KOF EELI The experts’ responses and our weighted aggregation process (see Appendix 3) yield KOF EELI scores for each country, shown in Figure 4.1 in order of total index score. The maximum possible score is seven points. Scores for the focus countries (in darker teal) are more reliable than those for the secondary countries (lighter teal) because they are constructed from multiple experts’ scores instead of just one or two. Therefore, we urge readers to focus on the general trends instead of small variations among secondary countries.
Austria (5.4) and Switzerland (5.4) have the highest EEL, followed closely by Denmark (4.9) and Germany (4.8). That group of top performers is followed by a group of countries with KOF EELI scores around four. This group includes Poland (4.4), Iceland (4.1), Slovenia (4.1), Estonia (3.9), Norway (3.9), Finland (3.8) and the Netherlands (3.7). The average score out of our 20 top performers is in this group at 3.8. Luxembourg has a value of 3.7, but its high number of missing values make its aggregated score unreliable; the calculation methodology that relies on dimension assessments yields a substantially lower value of two (see Appendix A2). The Southeast Asian countries score relatively low in the KOF EELI. Taiwan (3.4), Shanghai (3.1), Hong Kong (3.0), Singapore (2.9) and South Korea (2.9) all score around three and Japan has the lowest KOF EELI score at 1.7.
As a first assessment, we check for correlations between KOF EELI scores and two measures of labor market outcomes: KOF YLMI scores and unemployment. Any correlation at all is a strong sign of success because the program measured by KOF EELI scores reflects just a small part of the workforce. KOF EELI scores measure one program at one level in VET pathways that serve a fraction of all upper secondary students. Therefore, these correlations are a very conservative way of assessing the relationship between KOF EELI scores and labor market outcomes.
0
1
2
3
4
5
6
7
Figure 4.1: KOF EELI scores by country
Focus Countries
Secondary Countries
Average
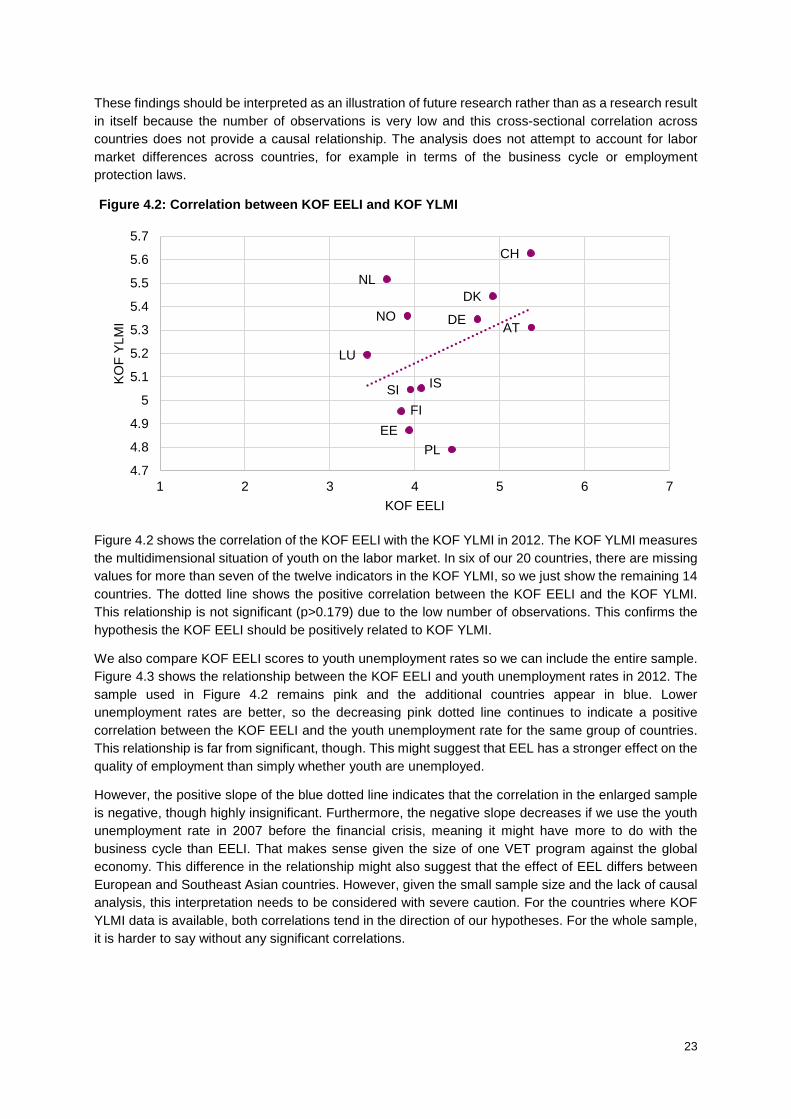
23
These findings should be interpreted as an illustration of future research rather than as a research result in itself because the number of observations is very low and this cross-sectional correlation across countries does not provide a causal relationship. The analysis does not attempt to account for labor market differences across countries, for example in terms of the business cycle or employment protection laws.
Figure 4.2 shows the correlation of the KOF EELI with the KOF YLMI in 2012. The KOF YLMI measures the multidimensional situation of youth on the labor market. In six of our 20 countries, there are missing values for more than seven of the twelve indicators in the KOF YLMI, so we just show the remaining 14 countries. The dotted line shows the positive correlation between the KOF EELI and the KOF YLMI. This relationship is not significant (p>0.179) due to the low number of observations. This confirms the hypothesis the KOF EELI should be positively related to KOF YLMI.
We also compare KOF EELI scores to youth unemployment rates so we can include the entire sample. Figure 4.3 shows the relationship between the KOF EELI and youth unemployment rates in 2012. The sample used in Figure 4.2 remains pink and the additional countries appear in blue. Lower unemployment rates are better, so the decreasing pink dotted line continues to indicate a positive correlation between the KOF EELI and the youth unemployment rate for the same group of countries. This relationship is far from significant, though. This might suggest that EEL has a stronger effect on the quality of employment than simply whether youth are unemployed.
However, the positive slope of the blue dotted line indicates that the correlation in the enlarged sample is negative, though highly insignificant. Furthermore, the negative slope decreases if we use the youth unemployment rate in 2007 before the financial crisis, meaning it might have more to do with the business cycle than EELI. That makes sense given the size of one VET program against the global economy. This difference in the relationship might also suggest that the effect of EEL differs between European and Southeast Asian countries. However, given the small sample size and the lack of causal analysis, this interpretation needs to be considered with severe caution. For the countries where KOF YLMI data is available, both correlations tend in the direction of our hypotheses. For the whole sample, it is harder to say without any significant correlations.
AT
CH
DE
DK
EEFI
IS
LU
NL
NO
PL
SI
4.7
4.8
4.9
5
5.1
5.2
5.3
5.4
5.5
5.6
5.7
1 2 3 4 5 6 7
KOF
YLM
I
KOF EELI
Figure 4.2: Correlation between KOF EELI and KOF YLMI
24
Of course, total KOF EELI scores are only a very small part of the story. In order to understand the meaning of the index and derive useful policy implications, we need to explore countries’ scores for dimensions, subdimensions, and features. We do this in the following subsections. For the focus countries, we delve even deeper and describe the VET pathway and focus program in detail along with key actors and their roles in VET. This deeper analysis makes the KOF EELI a useful tool for VET program comparison and policy advising instead of merely another scoreboard.
4.1 Weighting: The most important characteristics One of the most important elements of the KOF EELI for policymakers is that features, subdimensions, and dimensions are weighted according to importance. We describe the development of the weighting scheme in detail in Appendix 2, and Table 3.4 shows the final weights for each dimension, subdimension, and feature. All of the weights there and in this discussion are expressed as percentages of the total KOF EELI score. The weights are important because they show which aspects of linkage are the most important.
The two most important—or heavily weighted—features are employers’ involvement in setting qualification standards during the design phase (15.8%) and their involvement in deciding when an update should happen in the feedback phase (15.7%). The design phase overall is the most important phase with 41.9% of total KOF EELI scores, and all three of its subdimensions are also important. The most important subdimension of the design phase is employers’ role in qualification standards (15.8%). Interestingly, it is the involvement of employers (15.8%) in that action and not their legal standing (0.0%) that matters. Similarly, the curriculum application phase accounts for 23.7% of the total KOF EELI score and its most important subdimension is that employers play a role in update timing (22.5%, the most important subdimension overall). Within that, it is very important that employers play a role in deciding when to update (15.7%) and also have legal standing to do so (6.7%). Two other notably important features are the legal definition of employers’ involvement in the design phase (10.2%) and a high share of learning in the workplace instead of the classroom in the application phase (13.2%).
Many features have no weight at all because they are unimportant for linkage, collinear with another feature, or because there is not enough variation in this sample for them to matter for comparative scores. When we can collect more data on more countries, we will be able to refine the weighting system to make it even more useful for policymakers. Throughout this discussion of KOF EELI results, we encourage readers to refer back to the weighting scheme and note how important a low or high score
ATCH
CN DE
DK
EE
FI
HK
IS
JPKR
LU
NL
NO
PL
SG
SI
TW
0%
5%
10%
15%
20%
25%
30%
1 2 3 4 5 6 7
Yout
h U
nem
ploy
men
t Rat
e
KOF EELI
Figure 4.3: Correlation between KOF EELI and youth unemployment rates
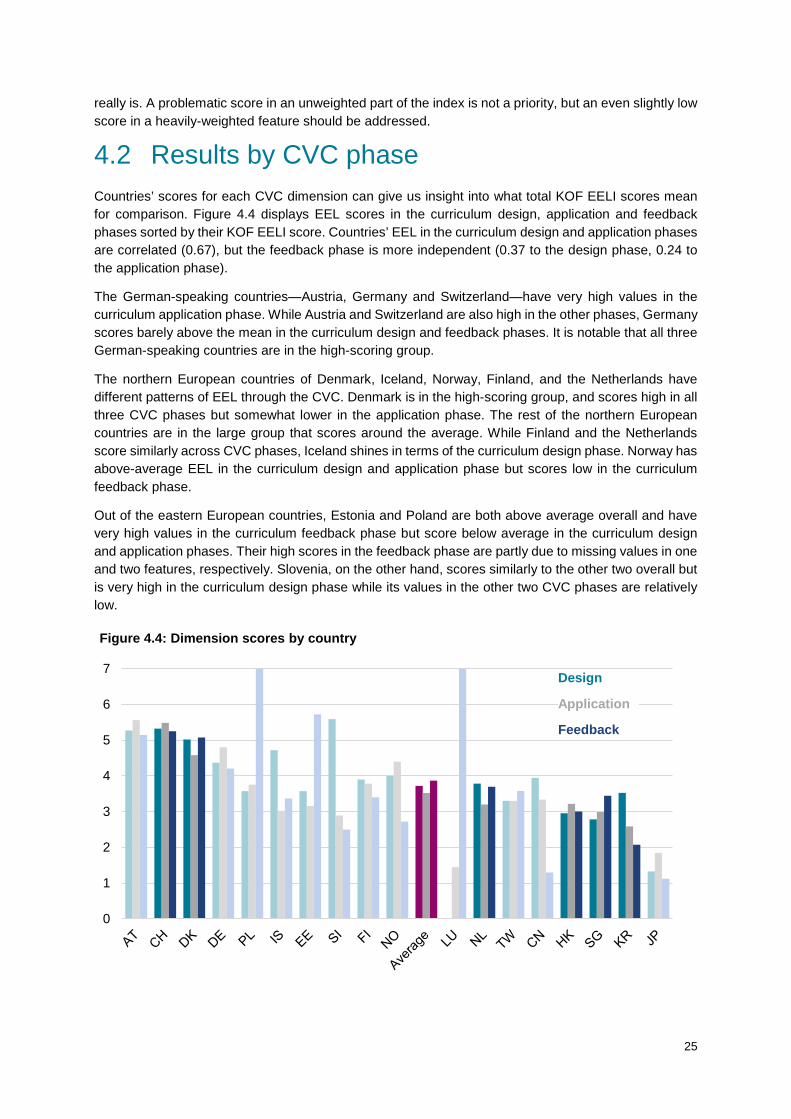
25
really is. A problematic score in an unweighted part of the index is not a priority, but an even slightly low score in a heavily-weighted feature should be addressed.
4.2 Results by CVC phase Countries’ scores for each CVC dimension can give us insight into what total KOF EELI scores mean for comparison. Figure 4.4 displays EEL scores in the curriculum design, application and feedback phases sorted by their KOF EELI score. Countries’ EEL in the curriculum design and application phases are correlated (0.67), but the feedback phase is more independent (0.37 to the design phase, 0.24 to the application phase).
The German-speaking countries—Austria, Germany and Switzerland—have very high values in the curriculum application phase. While Austria and Switzerland are also high in the other phases, Germany scores barely above the mean in the curriculum design and feedback phases. It is notable that all three German-speaking countries are in the high-scoring group.
The northern European countries of Denmark, Iceland, Norway, Finland, and the Netherlands have different patterns of EEL through the CVC. Denmark is in the high-scoring group, and scores high in all three CVC phases but somewhat lower in the application phase. The rest of the northern European countries are in the large group that scores around the average. While Finland and the Netherlands score similarly across CVC phases, Iceland shines in terms of the curriculum design phase. Norway has above-average EEL in the curriculum design and application phase but scores low in the curriculum feedback phase.
Out of the eastern European countries, Estonia and Poland are both above average overall and have very high values in the curriculum feedback phase but score below average in the curriculum design and application phases. Their high scores in the feedback phase are partly due to missing values in one and two features, respectively. Slovenia, on the other hand, scores similarly to the other two overall but is very high in the curriculum design phase while its values in the other two CVC phases are relatively low.
0
1
2
3
4
5
6
7
Figure 4.4: Dimension scores by country
Design
Application
Feedback
26
Luxembourg has missing values in most features, so its results should be considered problematic. Its values from the subjective calculation methodology (see Appendix 3) suggest that Luxembourg has a value of two in both the curriculum application and feedback phase, while no information for the curriculum design phase exists.
As a group, the Asian countries tend to score rather low for EEL overall and in each phase. Hong Kong, Singapore and Taiwan display similar values across the CVC phases. Both South Korea and Shanghai (China) score highest in the curriculum design phase, followed by the curriculum application phase and a low value in the curriculum feedback phase. Japan scores low in all dimensions, but has a relative strength in the curriculum application phase.
By breaking down total KOF EELI scores into dimensions, we can already see some patterns emerging. These patterns might come from cultural, historical, institutional, or policy origins. In order to make more concrete recommendations for each country, we need to look at the subdimensions within each dimension. Then we can understand why one country scores low or high on the KOF EELI overall or one dimension in particular, which gives a great deal of nuance to our comparison. More importantly, we can begin to make policy recommendations based on the data in the KOF EELI.
4.3 Results for selected features The specific scores for each feature in every country are displayed and discussed in Appendix 3. In the interest of brevity, we will highlight the features of employers’ involvement quality here. Involvement quality is a subdimension of the curriculum design phase, and it comprises four features: whether the curriculum prepares graduates for a career, occupation, or job; whether firms are represented individually or through employer associations; what share of firms are represented in the curriculum design process; and how the involvement of employers is defined legally.
The design phase as a whole is the heaviest-weighted dimension at 41.9% of KOF EELI scores. The involvement quality subdimension represents 14.3% of total scores by itself. Within that, the heaviest-weighted feature is the legal definition of involvement, making up 10.2% of total KOF EELI scores by itself. The feature capturing whether the curriculum prepares students for careers, occupations, or jobs as well as the feature capturing the share of firms represented in the curriculum development process have no weight, either because experts consider it irrelevant or because the question should be better formulated to elicit more variation. Without any differences across countries, our aggregation calculations will always assume the unvarying feature is irrelevant. In contrast, it is important whether firms participate in curriculum development individually, through employer associations, or through both employer associations and individual firms, with that feature accounting for 4% of KOF EELI scores.
For “Represented Firm Share,” higher scores indicate that more firms are involved in VET. For “Firms vs. Employer Associations,” the lowest scores are when firms can only participate in VET alone, middle scores (the very common four-point score) are that firms can enter only through employer associations, and the highest scores indicate that firms can participate either independently or through associations. Finally, “Legal Definition of Involvement” scores range from the lowest where employers are not involved, through involvement without legal definition, required involvement without specificity, broad specification of involvement, and ultimately specific legal definition of when and how employers should be involved.
Reading guide: In both Figures 4.5 and 4.6, one feature is presented in teal and the other in grey. Countries’ scores for the features range between one and seven, where seven is the higher score for linkage. For the “Career vs. Occupation” feature, low scores indicate that experts state the program prepares graduates for a job or a career, and higher scores indicate that the program prepares them for an occupation. Range between the two ends occurs when focus countries’ experts disagree and their scores are averaged.

27
Figure 4.6 presents the two features of involvement quality that have more weight in the final index. There is relatively low variation regarding whether the VET program prepares for a career, an occupation, or a job. Generally, experts stated that their country’s program prepares graduates for an occupation, with some stating that they are prepared for a career. Four experts answered that graduates are prepared for jobs. While we did differentiate among the terms in the question (see Appendix 1 for the questionnaire), this appears to come at least partly from confusion and we intend to improve the question in future questionnaires by using vignette techniques. This feature is presented in Figure 4.5 along with how many firms are represented in the design phase, which also had very little variation. Represented firm share is highest in Austria with a score of 7, followed by eleven countries with a value of about 5.5. Represented firm share is lower in Hong Kong, Taiwan, Singapore, and particularly Japan.
In all of the countries studied here, employers engage in the curriculum design process through employer associations. This might reflect the fact that the sample of countries is all top-performing countries, which have higher EEL than other countries. However, this finding also suggests the question should be phrased more specifically towards the concrete development of curricula, since it might be
0
1
2
3
4
5
6
7
AT CH DK
DE PL IS SI EE NO FI
Aver
age
LU NL
TW CN HK
SG KR JP AT CH DK
DE PL IS SI EE NO FI
Aver
age
LU NL
TW CN HK
SG KR JP
Figure 4.6: Firms vs employer assn.s and legal definition of involvement
Firm vs. Employer Assn. Legal Definition of Involvement
0
1
2
3
4
5
6
7AT CH DK
DE PL IS SI EE NO FI
Aver
age
LU NL
TW CN HK
SG KR JP AT CH DK
DE PL IS SI EE NO FI
Aver
age
LU NL
TW CN HK
SG KR JP
Figure 4.5: Career vs. occupation and represented firm share
Career vs. Occupation Represented Firm Share
28
possible that employer associations engage in the curriculum design process only through strategic direction rather than real development. The share of experts who indicate that employers engage both directly through firms and indirectly through employer associations is highest in Austria, Estonia and Slovenia, followed by Switzerland, Singapore, the Netherlands and South Korea.
There is substantial variation in whether and how the involvement of employers in the curriculum design phase is legally defined. This feature is highest in Slovenia, followed by Denmark, Iceland, Switzerland, the Netherlands, Germany, and Shanghai. Conversely, involvement is undefined in Hong Kong, Singapore, and particularly Japan.
Going to the level of individual features lets us explore why countries’ KOF EELI scores are as they are and how policy changes might address weaknesses. Because the KOF EELI identifies all potential aspects of EEL and provides a score for each one individually as well as an overall score, countries can use the data to identify the strengths and opportunities of their own systems’ EEL. We present case studies of our six focus countries in the next section that demonstrate this policy tool function of the KOF EELI.
4.4 Focus country case studies If a researcher or policymaker is presented with KOF EELI data, they should be able to compare the VET programs of countries in terms of EEL and identify potential policy strategies to strengthen EEL in a specific system. We demonstrate EEL as a policy tool in this section using one-page information sheets on all countries and in-depth case studies of our six focus countries. The information sheets28 summarize each country’s KOF EELI score by subdimension, along with key data about the VET pathway and a brief description of the focus program in that country. Full scores for each feature can be found in Appendix 4, Table A4.
In the case studies, we briefly describe the education and VET pathway of each country, then zoom in on the program we study in the KOF EELI. We describe how the processes of education occur through all three CVC phases, who is involved, and how the education and employment systems interact. We discuss the KOF EELI results for each country in the context of its VET pathway, focusing on where the scores originate at the feature level and how the system might adapt to increase EEL.
We begin with the six focus countries in alphabetical order, including both the information sheet and the full case study for that country that explores where the KOF EELI scores originate. Following the focus countries, we present information sheets for all fourteen secondary countries, again in alphabetical order. Data on the information sheets comes from the same sources cited in Table 3.2, and we indicate when data comes from KOF EELI responses.
The secondary countries have fewer experts than the focus countries—usually one and sometimes two—and we have not done in-depth case studies of VET in those countries to substantiate the KOF EELI results. As a result, their results are more of an indication than a conclusive measure of EEL so we cannot consider possible policy implications until we can expand the survey to more experts and case studies in those countries.
Data sources are cited throughout, and we double-check KOF EELI data against external sources in the focus countries. In the secondary countries, data for the rows on “time spent in workplace (vs. classroom),” “work contract,” “transferrable content (vs. specific),” “classroom/workplace sequencing,” and “frequency of workplace learning” all come from the KOF EELI questionnaire.
28 All flag images come from Wikipedia

29
Denmark – EUD Program
The Danish EUD program typically has a duration of 4-4.5 years. With an enrollment rate of 99.4% of all upper secondary VET students, it is by far the main VET pathway. VET is strong overall in the Danish education system, absorbing 45% of all upper secondary students (in 2015). During the main course, which starts after one introductory year of full-time classroom education, students alternate between the classroom and the workplace, spending 50-70% of their time in workplace training. Most students are in firms at least semiannually. Therefore, this program meets the requirements to be classified as a dual VET program. EUD students’ rights are defined by a training contract. In classroom education, over 50% of content is occupation-specific.
Key data about the program Time spent in workplace (vs. classroom) 50-70% (main course) (DMCEGE, 2015a, c) Work contract yes (“training contract”) (DMCEGE, 2016) Transferrable content (vs. specific) <50% (KOF EELI data) Classroom/workplace sequencing Classroom, then alternating (DMCEGE, 2015c) Frequency of workplace learning At least semiannually (KOF EELI data) Program duration 4-4.5 years (DMCEGE, 2015a) VET out of all upper secondary 45% (Statistics Denmark, 2016) Program out of all VET 99.4% = 44.6% of all upper secondary
Number of curricula/qualifications 111 with 301 steps and concentrations (DMCEGE, 2014a)
Policy Implications for Denmark Denmark scores above average in all curriculum design phase subdimensions. The one feature that raises concern is about how employers are involved, as Denmark focuses on employer associations but leaves relatively little room for the involvement of individual firms.
Both the learning place and cost sharing subdimensions are strengths of the Danish VET system. Denmark is average for examination and workplace regulation. Denmark’s weaknesses in the curriculum application phase are its low share of equipment and teachers in classroom education
provided by employers.
Information-gathering can be improved further in the curriculum feedback phase. The involvement of employers in the decision to update curricula is a strength of the Danish education system.
Score Rank KOF EELI 4.92 3/20 Curriculum Design Phase 5.02 4/20 Curriculum Application Phase 4.59 4/20 Curriculum Feedback Phase 5.08 6/20
01234567
QualificationStandards
Examination Form
InvolvementQuality
Learning Place
WorkplaceRegulation
Cost SharingEquipmentProvision
Teacher Provision
Examination
InformationGathering
Update Timing
Top Average DKSubdimensions
Design Phase Application Phase Feedback Phase
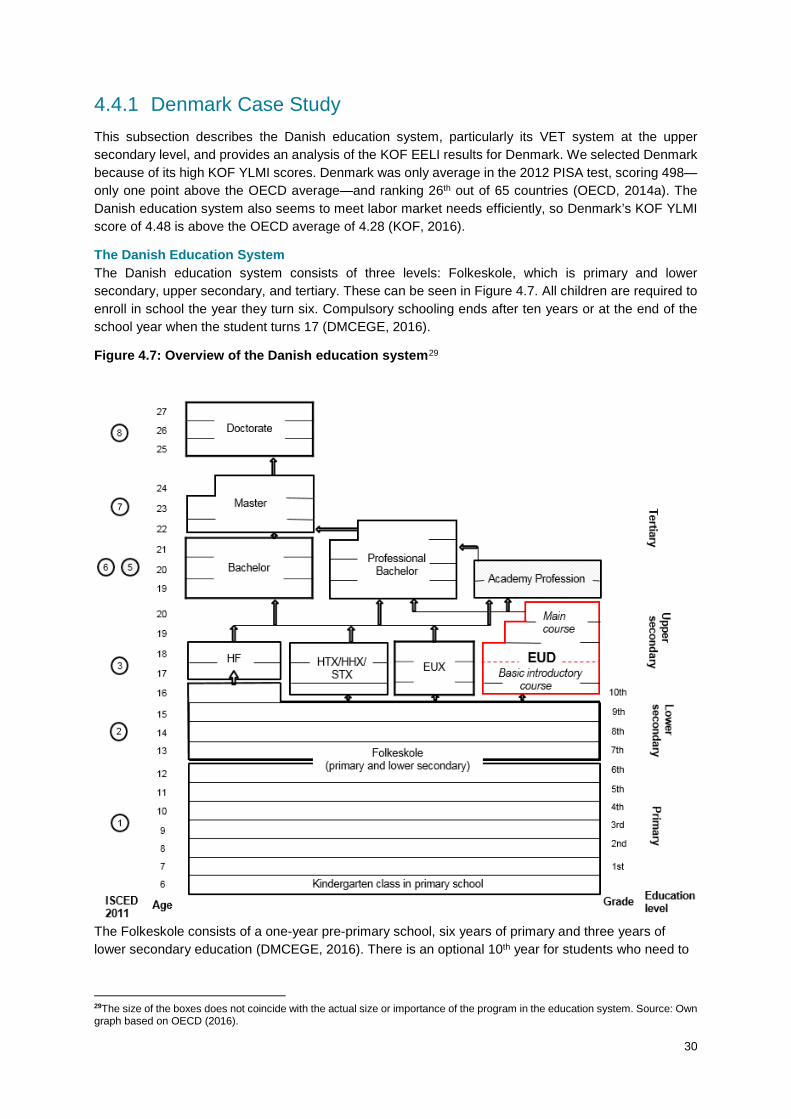
30
4.4.1 Denmark Case Study This subsection describes the Danish education system, particularly its VET system at the upper secondary level, and provides an analysis of the KOF EELI results for Denmark. We selected Denmark because of its high KOF YLMI scores. Denmark was only average in the 2012 PISA test, scoring 498—only one point above the OECD average—and ranking 26th out of 65 countries (OECD, 2014a). The Danish education system also seems to meet labor market needs efficiently, so Denmark’s KOF YLMI score of 4.48 is above the OECD average of 4.28 (KOF, 2016).
The Danish Education System The Danish education system consists of three levels: Folkeskole, which is primary and lower secondary, upper secondary, and tertiary. These can be seen in Figure 4.7. All children are required to enroll in school the year they turn six. Compulsory schooling ends after ten years or at the end of the school year when the student turns 17 (DMCEGE, 2016).
Figure 4.7: Overview of the Danish education system29
The Folkeskole consists of a one-year pre-primary school, six years of primary and three years of lower secondary education (DMCEGE, 2016). There is an optional 10th year for students who need to
29The size of the boxes does not coincide with the actual size or importance of the program in the education system. Source: Own graph based on OECD (2016).

31
improve their performance or take time to think about which educational course they want to choose. About 60% of each cohort choose this option (CEDEFOP, 2012).
Danish upper secondary education consists of a general education pathway that leads to higher education and a VET pathway that prepares students for direct entry into the labor market. While the general education pathway takes two to three years to complete, the VET pathway typically lasts four to 4.5 years and can take up to five years in some cases (DMCEGE, 2015a). Most students in a cohort (55% in 2015; see Table 4.1) choose general education instead of the VET pathway, with that group expanding in recent years (Statistics Denmark, 2016).
Upper secondary general education consists of four different institutions that can provide access to higher education. Gymnasium (STX) and the Higher Preparatory Examination (HF) cover the humanities and sciences. Gymnasium is by far the largest general program. The Higher Technical Examination Program (HTX) offers a combination of general, technological, and scientific disciplines. Finally, the Higher Commercial Examination Program (HHX) emphasizes business and socio-economic subjects with modern languages (DMCEGE, 2015b).
Danish upper secondary VET programs are either the EUX program or erhvervsuddannelserne (EUD). EUX students simultaneously earn the normal VET qualification and the general education qualification (CEDEFOP, 2014), but are a very small part of the VET pathway. In 2015, 45% of all Danish students at the upper secondary level were enrolled in a VET program. Of these, 19% were in the basic and 81% in the main course program. Overall, 99.4% of all students in the VET pathway were enrolled in the EUD program in 2015 (Statistics Denmark, 2016), so the EUD program is our focus program for Denmark.
Almost two thirds of each cohort advances to the tertiary education level. Denmark offers two higher education pathways: a general pathway that follows the Bologna System of Bachelor, Master, and PhD degree programs; and a vocationally oriented Professional Education and Training (PET) pathway. The PET pathway includes two programs with degrees at the Bachelor level: the Professional Bachelor (three to four years) or the short-cycle Academy Profession (two years). Both are labor market-oriented programs that combine theoretical knowledge with practical learning (Study Start, 2015).
Focus Program: Erhvervsuddannelse (EUD) EUD consists of a basic and a main course program, where the basic course program is entirely school-based and the main course program alternates between school and the workplace. Each student must have a training agreement with a company that is approved by the social partners, who are representatives of employers and employees. About 111 EUD curricula are currently offered, each leading to a range of specializations (DMCEGE, 2016). Figure 4.8 depicts the EUD program.
Everyone who completes the Folkeskole with a grade of at least 2 in Danish and mathematics or who has a valid training contract with an accredited training firm can be admitted to the basic program. Students must start directly after finishing the 9th or 10th grade and should not be older than 24. Students under the age of 18 need to prove they are “study-ready” (CEDEFOP, 2014a). After a 2015 reform, students who do not meet these criteria can enter a new one-year vocational program called “EUD10,” which equips students with the necessary skills for VET (DMCEGE, 2014a, b).
Table 4.1: Upper secondary enrollment, 2015 Level & Type Enrollment
STX 33% HF 6% HTX 5% HHX 10%
Total VET share 45% of which
EUD 99.4% EUX 0.6%
Source: Statistics Denmark, 2016, own calculations.
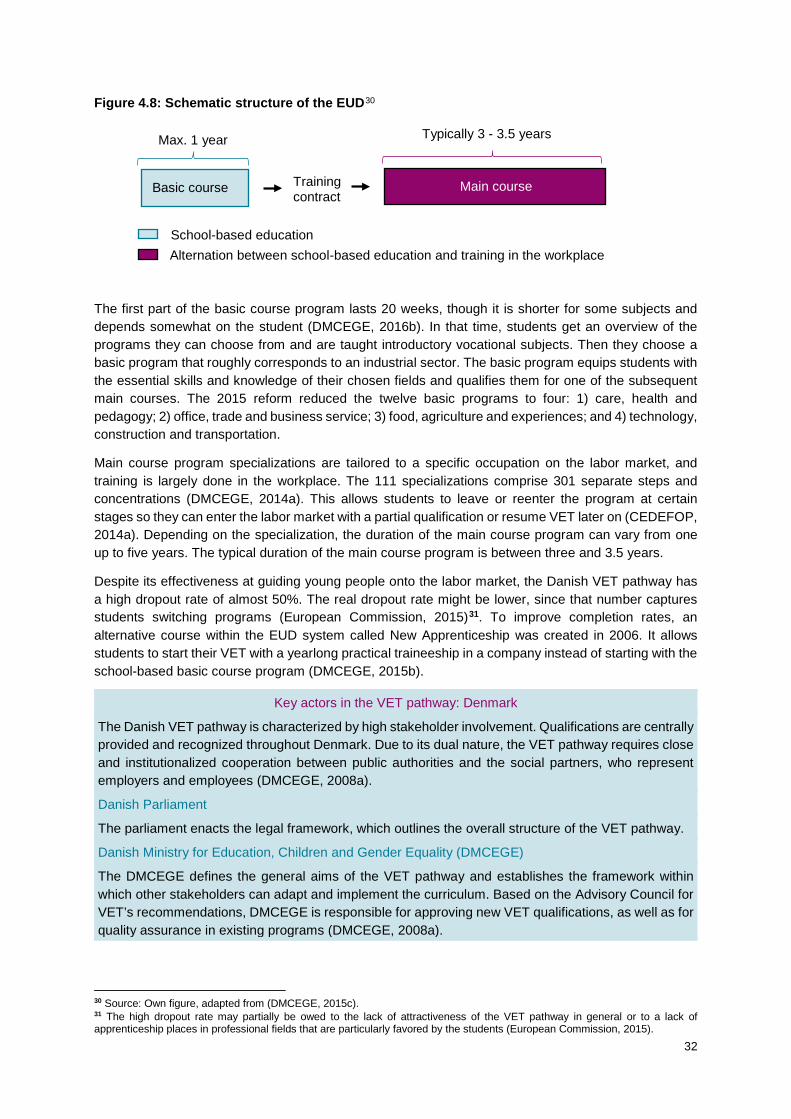
32
Figure 4.8: Schematic structure of the EUD30
The first part of the basic course program lasts 20 weeks, though it is shorter for some subjects and depends somewhat on the student (DMCEGE, 2016b). In that time, students get an overview of the programs they can choose from and are taught introductory vocational subjects. Then they choose a basic program that roughly corresponds to an industrial sector. The basic program equips students with the essential skills and knowledge of their chosen fields and qualifies them for one of the subsequent main courses. The 2015 reform reduced the twelve basic programs to four: 1) care, health and pedagogy; 2) office, trade and business service; 3) food, agriculture and experiences; and 4) technology, construction and transportation.
Main course program specializations are tailored to a specific occupation on the labor market, and training is largely done in the workplace. The 111 specializations comprise 301 separate steps and concentrations (DMCEGE, 2014a). This allows students to leave or reenter the program at certain stages so they can enter the labor market with a partial qualification or resume VET later on (CEDEFOP, 2014a). Depending on the specialization, the duration of the main course program can vary from one up to five years. The typical duration of the main course program is between three and 3.5 years.
Despite its effectiveness at guiding young people onto the labor market, the Danish VET pathway has a high dropout rate of almost 50%. The real dropout rate might be lower, since that number captures students switching programs (European Commission, 2015)31. To improve completion rates, an alternative course within the EUD system called New Apprenticeship was created in 2006. It allows students to start their VET with a yearlong practical traineeship in a company instead of starting with the school-based basic course program (DMCEGE, 2015b).
Key actors in the VET pathway: Denmark
The Danish VET pathway is characterized by high stakeholder involvement. Qualifications are centrally provided and recognized throughout Denmark. Due to its dual nature, the VET pathway requires close and institutionalized cooperation between public authorities and the social partners, who represent employers and employees (DMCEGE, 2008a).
Danish Parliament
The parliament enacts the legal framework, which outlines the overall structure of the VET pathway.
Danish Ministry for Education, Children and Gender Equality (DMCEGE)
The DMCEGE defines the general aims of the VET pathway and establishes the framework within which other stakeholders can adapt and implement the curriculum. Based on the Advisory Council for VET’s recommendations, DMCEGE is responsible for approving new VET qualifications, as well as for quality assurance in existing programs (DMCEGE, 2008a).
30 Source: Own figure, adapted from (DMCEGE, 2015c). 31 The high dropout rate may partially be owed to the lack of attractiveness of the VET pathway in general or to a lack of apprenticeship places in professional fields that are particularly favored by the students (European Commission, 2015).
Basic course Training contract
School-based education Alternation between school-based education and training in the workplace
Main course
Max. 1 year Typically 3 - 3.5 years

33
Advisory Council for VET
The Council consists of 25 representatives from employer and employee organizations, school leaders and teachers, and the DMCGE. Its main duty is to monitor labor market trends. Based on its findings, the DMCEGE creates new VET qualifications, or merges or abandons programs that are no longer in demand (DMCEGE, 2008a).
National Trade Committees (NTC)
The NTCs are the main actors in VET. The 50 NTCs are equally composed of employer- and employee organizations, and each is responsible for at least one program. The NTCs adjust the VET programs according to labor market needs and set regulatory boundaries including learning goals, examination standards, the duration of programs, and more. NTCs also issue journeyman’s certificates, approve training companies, and arbitrate conflicts between employers and apprentices (CEDEFOP, 2014).
Local Training Committees
Local training committees are associated with individual colleges. They consist of representatives from employers, employees, and colleges. Their role is to facilitate close collaboration between the local community and the vocational committees, and to decide on the specific curriculum at each college. They also help NTCs evaluate and approve local employers for training (CEDEFOP, 2014).
Colleges (School Boards and Management)
The colleges are responsible for developing the local education plan, including the methodological and didactical principles of training, technical equipment, descriptions of teacher qualifications, personal education plans, and more. Each college’s school board and management are also in charge of operating the college on a daily basis (DMCEGE, 2008a).
Educational Finance of the VET pathway The Danish VET pathway is financed through public funds for education providers and trainee wages from employers during workplace training.
Public funds come in the form of state grants and represent approximately 80% of VET pathway funding. The remaining 20% is raised by individual institutions through income-generating activities in free competition with private companies (DMCEGE, 2015d). About 92% of the state funding is provided through the taximeter system, so institutions’ full-time student enrollments and predefined taximeter rates determine their state funding. Individual institutions have some financial independence, so they can spend according to their needs within a certain framework (DMCEGE, 2015d).
The workplace part of VET is financed by the training employers. Trainees receive a salary for workplace training, which is set by collective agreement in the NTC (Rolls, 2014). Trainees spend some time attending school, so the Employer’s Reimbursement Fund reimburses employers for the wages they pay during school phases. All employers, both public and private, pay a legally specified and annually adjusted amount—approximately 400 Euro—into the fund for each full-time job offered32 (OECD, 2014).
CVC Processes This section describes Denmark’s VET processes in the EUD program.
Curriculum Design Phase In the curriculum design phase, actors decide on the curriculum content and standards. In the Danish VET pathway, social partners and the DMCEGE carry out the curriculum design process jointly as illustrated in Figure 4.9. The process begins with the NTCs, who propose new programs or changes to old programs. Proposals must be backed with quantitative data on employment opportunities, projected student numbers, and an outline of workplace training. With the advice of the Advisory Council, the DMCEGE approves the proposal and passes it back to the relevant NTC for further development. The
32 See art. 4 et seq. and in particular art. 18 of the Act on Employer’s Contribution to Education and Training.

34
NTC makes a curriculum including program duration, design of practical training, entry and transition requirements, ratio between school based and practical education, and school subjects during the basic program. Next, the DMCEGE defines the program’s financial aspects and issues a regulation with the program’s cornerstones: objectives, content, assessment, and examinations (CEDEFOP, 2014).
Figure 4.9: Curriculum design process33
Beyond this centralized policymaking process, colleges and other social partners have their say on the regional or local level. Local training committees assist colleges in adapting VET programs to local business and industry needs (CEDEFOP, 2014). On the post-secondary level, educational institutions—PET colleges or universities—determine their own curricula within the legal framework (DMHES, 2015).
Curriculum Application Phase The curriculum application phase is about when, where, how, and in what conditions students actually learn the contents of the curriculum. The EUD basic course program happens in VET schools, and the main course program is split between school and the workplace.
The main course program is split into five- or ten-week blocks that alternate between school-based education in VET colleges and practical training in firms, and students spend 50-70% of their time in the company receiving practical training (DMCEGE, 2015a, c). Every student in the main course program must have valid a training contract with an accredited firm, since most of their education is practical training in the firm. If a student is not able to obtain a training agreement with a firm, a college can provide school-based practical training (DMCEGE, 2015b). Equipment is mostly provided by employers through workplace training, with some provided by the VET schools for their own classroom instruction (DMCEGE, 2015b).
Training companies are approved by the NTCs, along with local training committees. VET schools and colleges are responsible for the classroom part of training and qualifying classroom teachers. The DMCEGE inspects VET providers on a regular basis in order to verify that employers fulfil all of their responsibilities as trainers. It also conducts legal, financial, and pedagogical analyses, and creates reports based on a number of varying inputs like site visits and meetings with stakeholders. In 2007, the DMCEGE developed an annual resource report for the education system in order to further strengthen the monitoring of vocational colleges (DMCEGE, 2008a).
Curriculum Feedback Phase This phase is about evaluating education outcomes and feeding the information back into the system. In Denmark, a number of complimentary mechanisms establish a system of constant dialogue. The primary body responsible for monitoring labor market trends is the Advisory Council. It identifies which programs should be created, revised, or dropped and passes this information on to the NTCs and the DMCEGE. NTCs also play a role by monitoring their own industries or VET specializations to ensure they are relevant and up-to-date.
Non-VET-specific research also provides feedback for the VET curriculum. The Danish Evaluation Institute (DEI) is an independent body for evaluation and quality assurance of the entire education system, not only VET. The DEI carries out research and surveys, and has examined VET multiple times
33 Source: own figure, based on CEDEFOP (2014).

35
(DMCEGE, 2008b). In addition, all companies are asked to conduct regular internal evaluations to assess their own performance as well as external evaluation through public authorities (DMCEGE, 2008b).
Student representation is part of the Danish Act on VET, so they are represented in the VET board of directors and have the opportunity to influence the VET programs at the local level. In addition, the DMCEGE conducts surveys of students to hear their opinions (DMCEGE, 2008b).
KOF EELI Discussion Denmark performs very well overall on the KOF EELI. It is above average in the design phase and all its subdimensions, which makes sense given the strong infrastructure of cooperation built into the EUD curriculum design process. When we look into the individual features that make up design phase subdimensions, Denmark is still very strong and generally above average, especially due to the strong legal framework that defines employer involvement in EUD and Denmark’s focus on preparing students for entire occupations instead of vague careers or narrow jobs. The only feature where Denmark falls below average is about how employment actors can be involved in EUD; the maximum value occurs when employers can enter the curriculum design process either through employer associations or independently, and the Danish system of dedicated committees does not provide entry points for individual firms who might want to contribute.
In the application phase, Denmark is still above average among our 20 top performers, but has a few more opportunities for growth. Everything that falls under the learning place and cost sharing subdimensions is strong for EUD, which comes from its dual nature and the financial contributions of employers through trainee wages. Denmark is near the average for the subdimensions on examination and workplace regulation. Exams always take place in schools, which decreases linkage because it takes power away from employers to determine what a passing grade should be. Although trainees have work contracts and their time in the firm is guided by a curriculum, many of the quality assurance issues like teacher qualification and trainer training are left up to individual schools and employers. This might work in Denmark, but its recent history of reform shows that the EUD program is already moving toward more formal responsibilities for quality assurance. Those would increase the balance in power and regulation between education and employment.
In the feedback phase, employers’ role in the curriculum update decision is a major strength of the EUD program and Danish VET in general. Employers initiate the process of updating and creating new curricula, which allows them to maximally resolve the information asymmetry around labor market demand. Information gathering in the feedback phase might be improved further to ensure data on VET is collected regularly and not only occasionally, but it remains strong.
Overall, the Danish VET pathway is very strong and its main weaknesses are around the regulation of workplace training. Generally, it appears that Denmark has institutionalized cooperation where it is critical to create and revise strong curricula, train students in workplaces, and share the cost burdens of VET. Regulation is growing as the program grows, and will only strengthen the system by ensuring that each student trains for his or her occupation as laid out by the framework curriculum. Denmark tends to err on the side of under-regulation, and moving toward the optimum—not maximum regulation—can improve its EEL.
Specific Feature Recommendations Table 4.2 shows Denmark’s feature scores relative to the benchmark (average) and the top scores out of all countries. Blue scores are higher than those markers and pink scores are lower.
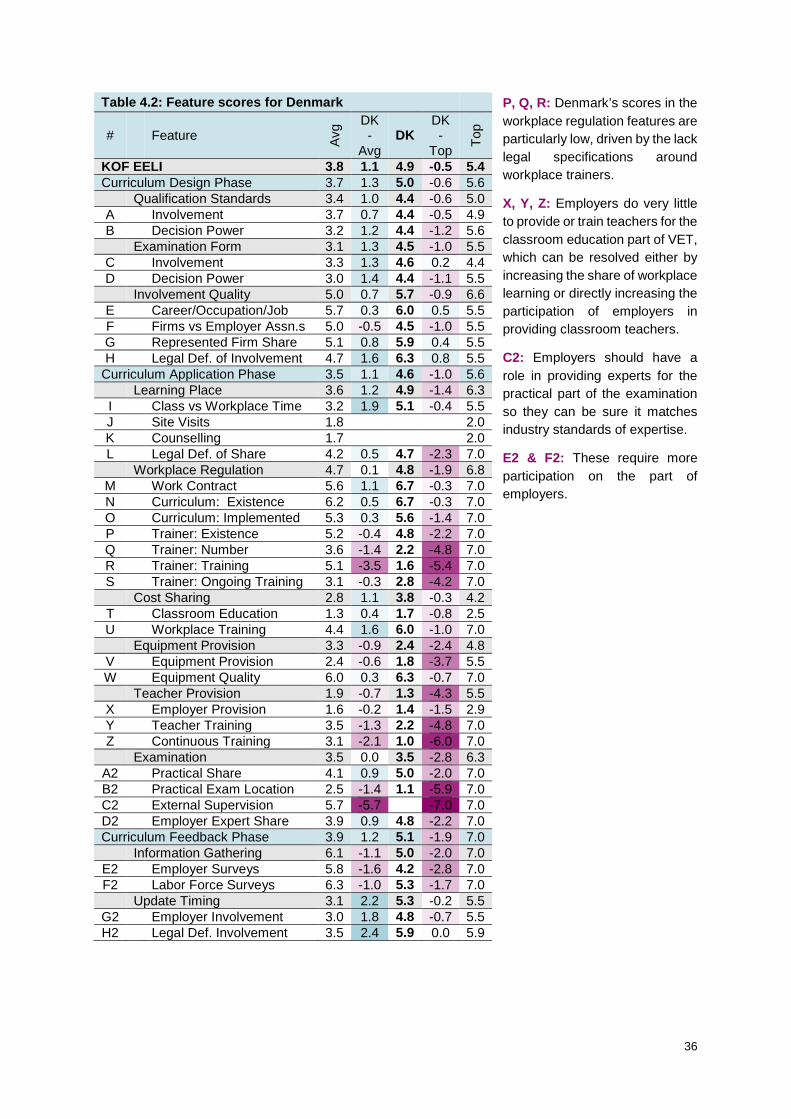
36
P, Q, R: Denmark’s scores in the workplace regulation features are particularly low, driven by the lack legal specifications around workplace trainers.
X, Y, Z: Employers do very little to provide or train teachers for the classroom education part of VET, which can be resolved either by increasing the share of workplace learning or directly increasing the participation of employers in providing classroom teachers.
C2: Employers should have a role in providing experts for the practical part of the examination so they can be sure it matches industry standards of expertise.
E2 & F2: These require more participation on the part of employers.
Table 4.2: Feature scores for Denmark
# Feature Avg DK
-Avg
DK DK -
Top Top
KOF EELI 3.8 1.1 4.9 -0.5 5.4 Curriculum Design Phase 3.7 1.3 5.0 -0.6 5.6 Qualification Standards 3.4 1.0 4.4 -0.6 5.0 A Involvement 3.7 0.7 4.4 -0.5 4.9 B Decision Power 3.2 1.2 4.4 -1.2 5.6 Examination Form 3.1 1.3 4.5 -1.0 5.5 C Involvement 3.3 1.3 4.6 0.2 4.4 D Decision Power 3.0 1.4 4.4 -1.1 5.5 Involvement Quality 5.0 0.7 5.7 -0.9 6.6 E Career/Occupation/Job 5.7 0.3 6.0 0.5 5.5 F Firms vs Employer Assn.s 5.0 -0.5 4.5 -1.0 5.5 G Represented Firm Share 5.1 0.8 5.9 0.4 5.5 H Legal Def. of Involvement 4.7 1.6 6.3 0.8 5.5
Curriculum Application Phase 3.5 1.1 4.6 -1.0 5.6 Learning Place 3.6 1.2 4.9 -1.4 6.3 I Class vs Workplace Time 3.2 1.9 5.1 -0.4 5.5 J Site Visits 1.8 2.0 K Counselling 1.7 2.0 L Legal Def. of Share 4.2 0.5 4.7 -2.3 7.0 Workplace Regulation 4.7 0.1 4.8 -1.9 6.8 M Work Contract 5.6 1.1 6.7 -0.3 7.0 N Curriculum: Existence 6.2 0.5 6.7 -0.3 7.0 O Curriculum: Implemented 5.3 0.3 5.6 -1.4 7.0 P Trainer: Existence 5.2 -0.4 4.8 -2.2 7.0 Q Trainer: Number 3.6 -1.4 2.2 -4.8 7.0 R Trainer: Training 5.1 -3.5 1.6 -5.4 7.0 S Trainer: Ongoing Training 3.1 -0.3 2.8 -4.2 7.0 Cost Sharing 2.8 1.1 3.8 -0.3 4.2 T Classroom Education 1.3 0.4 1.7 -0.8 2.5 U Workplace Training 4.4 1.6 6.0 -1.0 7.0 Equipment Provision 3.3 -0.9 2.4 -2.4 4.8 V Equipment Provision 2.4 -0.6 1.8 -3.7 5.5 W Equipment Quality 6.0 0.3 6.3 -0.7 7.0 Teacher Provision 1.9 -0.7 1.3 -4.3 5.5 X Employer Provision 1.6 -0.2 1.4 -1.5 2.9 Y Teacher Training 3.5 -1.3 2.2 -4.8 7.0 Z Continuous Training 3.1 -2.1 1.0 -6.0 7.0 Examination 3.5 0.0 3.5 -2.8 6.3
A2 Practical Share 4.1 0.9 5.0 -2.0 7.0 B2 Practical Exam Location 2.5 -1.4 1.1 -5.9 7.0 C2 External Supervision 5.7 -5.7 -7.0 7.0 D2 Employer Expert Share 3.9 0.9 4.8 -2.2 7.0 Curriculum Feedback Phase 3.9 1.2 5.1 -1.9 7.0 Information Gathering 6.1 -1.1 5.0 -2.0 7.0
E2 Employer Surveys 5.8 -1.6 4.2 -2.8 7.0 F2 Labor Force Surveys 6.3 -1.0 5.3 -1.7 7.0 Update Timing 3.1 2.2 5.3 -0.2 5.5
G2 Employer Involvement 3.0 1.8 4.8 -0.7 5.5 H2 Legal Def. Involvement 3.5 2.4 5.9 0.0 5.9
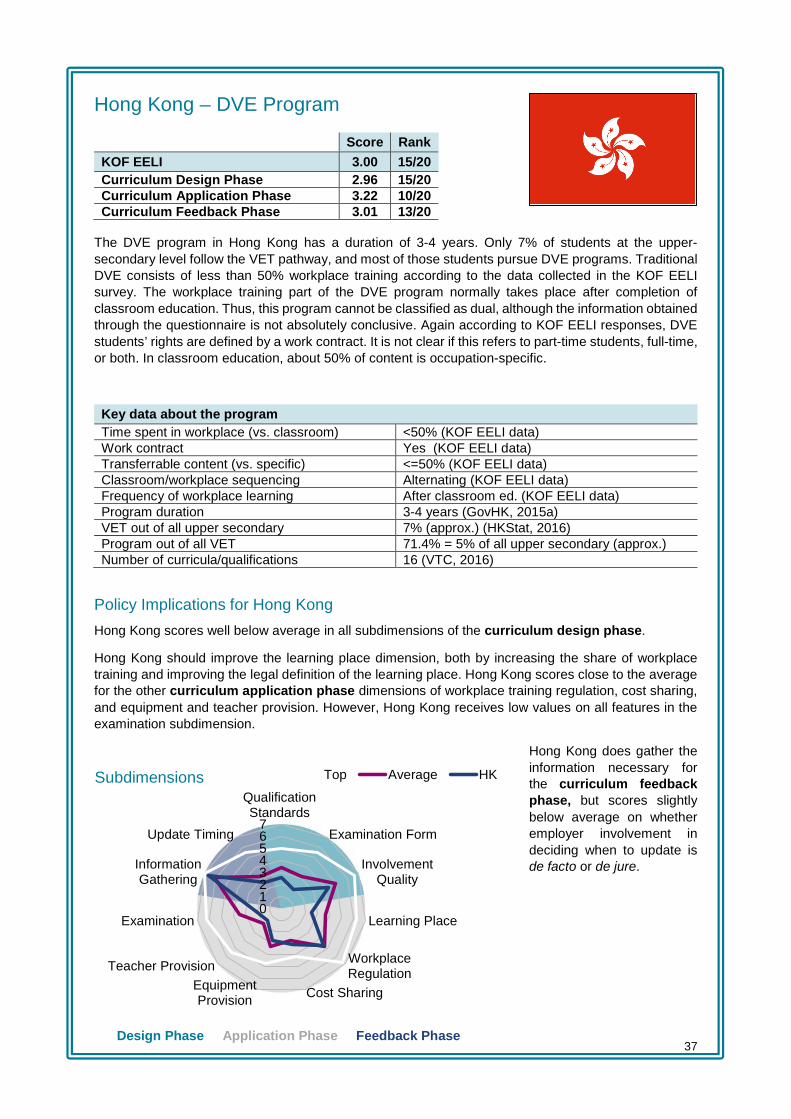
37
Hong Kong – DVE Program
The DVE program in Hong Kong has a duration of 3-4 years. Only 7% of students at the upper-secondary level follow the VET pathway, and most of those students pursue DVE programs. Traditional DVE consists of less than 50% workplace training according to the data collected in the KOF EELI survey. The workplace training part of the DVE program normally takes place after completion of classroom education. Thus, this program cannot be classified as dual, although the information obtained through the questionnaire is not absolutely conclusive. Again according to KOF EELI responses, DVE students’ rights are defined by a work contract. It is not clear if this refers to part-time students, full-time, or both. In classroom education, about 50% of content is occupation-specific.
Key data about the program Time spent in workplace (vs. classroom) <50% (KOF EELI data) Work contract Yes (KOF EELI data) Transferrable content (vs. specific) <=50% (KOF EELI data) Classroom/workplace sequencing Alternating (KOF EELI data) Frequency of workplace learning After classroom ed. (KOF EELI data) Program duration 3-4 years (GovHK, 2015a) VET out of all upper secondary 7% (approx.) (HKStat, 2016) Program out of all VET 71.4% = 5% of all upper secondary (approx.) Number of curricula/qualifications 16 (VTC, 2016)
Policy Implications for Hong Kong
Hong Kong scores well below average in all subdimensions of the curriculum design phase.
Hong Kong should improve the learning place dimension, both by increasing the share of workplace training and improving the legal definition of the learning place. Hong Kong scores close to the average for the other curriculum application phase dimensions of workplace training regulation, cost sharing, and equipment and teacher provision. However, Hong Kong receives low values on all features in the examination subdimension.
Hong Kong does gather the information necessary for the curriculum feedback phase, but scores slightly below average on whether employer involvement in deciding when to update is de facto or de jure.
Score Rank KOF EELI 3.00 15/20 Curriculum Design Phase 2.96 15/20 Curriculum Application Phase 3.22 10/20 Curriculum Feedback Phase 3.01 13/20
01234567
QualificationStandards
Examination Form
InvolvementQuality
Learning Place
WorkplaceRegulation
Cost SharingEquipmentProvision
Teacher Provision
Examination
InformationGathering
Update Timing
Top Average HKSubdimensions
Design Phase Application Phase Feedback Phase

38
4.4.2 Hong Kong Case Study This subsection describes the education system of Hong Kong, particularly VET at the upper secondary education level, and provides an in-depth analysis of the EELI results for Hong Kong. Hong Kong has one of the most successful education systems of the world according to PISA 2012, ranking third with an average score of 554 (OECD average 497; OECD, 2014). It is also very efficient at transitioning youth onto the labor market, with a KOF YLMI score of 5.62 in 2012 (OECD average 5.28; KOF, 2016). However, this value is only based on three out of twelve indicators and should be interpreted with caution.
The Hong Kong education system Compulsory education in Hong Kong starts age six and lasts for nine years until students are 15 years old (World Bank, 2016). It comprises six years of primary school or junior school, and three years of lower secondary education or junior secondary. At the upper secondary education or senior secondary level, students can either continue with three additional years of general education to the Hong Kong Diploma of Secondary Education (HKDSE) or pursue one of the VET programs (GovHK, 2014a). The enrollment rates for all programs at the upper secondary level for the year 2014 are summarized in Table 4.3.
Figure 4.10: Overview of the Hong Kong education system34
34 The size of the boxes does not coincide with the actual size or importance of the program in the education system. Source: Own graph based on GovHK (2015).
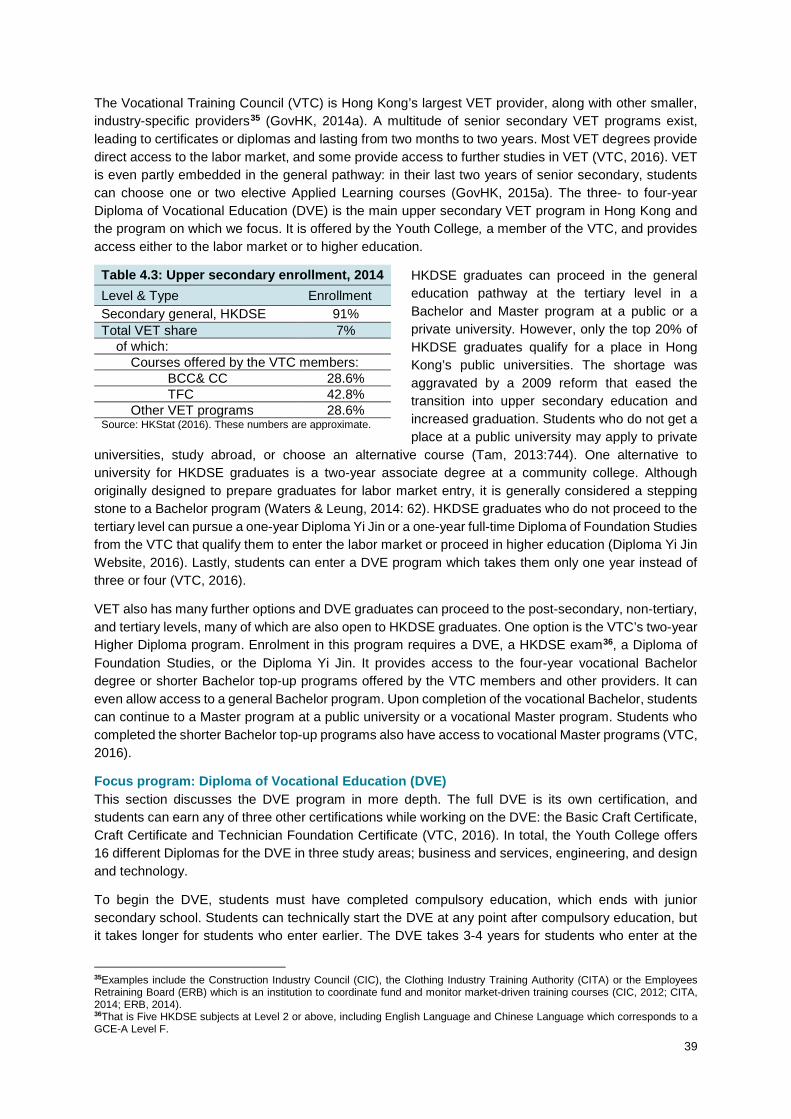
39
The Vocational Training Council (VTC) is Hong Kong’s largest VET provider, along with other smaller, industry-specific providers35 (GovHK, 2014a). A multitude of senior secondary VET programs exist, leading to certificates or diplomas and lasting from two months to two years. Most VET degrees provide direct access to the labor market, and some provide access to further studies in VET (VTC, 2016). VET is even partly embedded in the general pathway: in their last two years of senior secondary, students can choose one or two elective Applied Learning courses (GovHK, 2015a). The three- to four-year Diploma of Vocational Education (DVE) is the main upper secondary VET program in Hong Kong and the program on which we focus. It is offered by the Youth College, a member of the VTC, and provides access either to the labor market or to higher education.
HKDSE graduates can proceed in the general education pathway at the tertiary level in a Bachelor and Master program at a public or a private university. However, only the top 20% of HKDSE graduates qualify for a place in Hong Kong’s public universities. The shortage was aggravated by a 2009 reform that eased the transition into upper secondary education and increased graduation. Students who do not get a place at a public university may apply to private
universities, study abroad, or choose an alternative course (Tam, 2013:744). One alternative to university for HKDSE graduates is a two-year associate degree at a community college. Although originally designed to prepare graduates for labor market entry, it is generally considered a stepping stone to a Bachelor program (Waters & Leung, 2014: 62). HKDSE graduates who do not proceed to the tertiary level can pursue a one-year Diploma Yi Jin or a one-year full-time Diploma of Foundation Studies from the VTC that qualify them to enter the labor market or proceed in higher education (Diploma Yi Jin Website, 2016). Lastly, students can enter a DVE program which takes them only one year instead of three or four (VTC, 2016).
VET also has many further options and DVE graduates can proceed to the post-secondary, non-tertiary, and tertiary levels, many of which are also open to HKDSE graduates. One option is the VTC’s two-year Higher Diploma program. Enrolment in this program requires a DVE, a HKDSE exam36, a Diploma of Foundation Studies, or the Diploma Yi Jin. It provides access to the four-year vocational Bachelor degree or shorter Bachelor top-up programs offered by the VTC members and other providers. It can even allow access to a general Bachelor program. Upon completion of the vocational Bachelor, students can continue to a Master program at a public university or a vocational Master program. Students who completed the shorter Bachelor top-up programs also have access to vocational Master programs (VTC, 2016).
Focus program: Diploma of Vocational Education (DVE) This section discusses the DVE program in more depth. The full DVE is its own certification, and students can earn any of three other certifications while working on the DVE: the Basic Craft Certificate, Craft Certificate and Technician Foundation Certificate (VTC, 2016). In total, the Youth College offers 16 different Diplomas for the DVE in three study areas; business and services, engineering, and design and technology.
To begin the DVE, students must have completed compulsory education, which ends with junior secondary school. Students can technically start the DVE at any point after compulsory education, but it takes longer for students who enter earlier. The DVE takes 3-4 years for students who enter at the
35Examples include the Construction Industry Council (CIC), the Clothing Industry Training Authority (CITA) or the Employees Retraining Board (ERB) which is an institution to coordinate fund and monitor market-driven training courses (CIC, 2012; CITA, 2014; ERB, 2014). 36That is Five HKDSE subjects at Level 2 or above, including English Language and Chinese Language which corresponds to a GCE-A Level F.
Table 4.3: Upper secondary enrollment, 2014 Level & Type Enrollment Secondary general, HKDSE 91% Total VET share 7% of which: Courses offered by the VTC members: BCC& CC 28.6% TFC 42.8% Other VET programs 28.6% Source: HKStat (2016). These numbers are approximate.

40
beginning of senior secondary school—the 3rd or 4th year of upper secondary. For students entering in their 5th or 6th years of upper secondary school, it takes one or two years. Most of the DVE programs are full-time programs, though some are offered on a part-time basis (VTC, 2016). Further education starts with the VTC’s Higher Diploma programs, which grant access to further education.
DVE programs have to fulfill two goals: prepare students for further education and prepare them for direct labor market entry. Three key DVE characteristics help students enter the labor market (VTC, 2016). First, the Hong Kong Qualifications Framework (HKQF) allows students to earn the three levels’ certificates on their way to the full DVE certification, enabling them to get jobs and gain experience. The HKQF is a credit-based system that defines post-secondary qualifications in academic, vocational, and continuing education. This allows students to leave and re-enter the DVE program and attain final certification at any time. Second, students can earn the Basic Craft Certificate (two years), Craft Certificate (two to four years; part-time), or Technician Foundation Certificate (two to three years) during the DVE process. All VTC members offer these certificates, so VET students in other programs outside the Youth College’s DVE can also earn them (VTC, 2016). Third, the curriculum includes general education as well as industry-specific modules that allow students to develop their vocational skills.
In the 2014/15 academic year, the VTC launched “Earn & Learn” pilot schemes in four sectors37 to attract and retain qualified personnel in sectors facing shortages or with very specific skills needs (GovHK, 2015b). These five training programs38 combine into a new means of earning the DVE through both school-based and workplace learning. Upon completion, students have the same option as normal DVE gradates to earn the Higher Diploma. Students who have earned any of the certificates can also enter this program to earn their DVEs (VTC, 2016).
Key actors in the VET pathway: Hong Kong
Hong Kong is a special administrative region of the People’s Republic of China with a special legal status that stems from its history as a former British colony. Hong Kong preserved its autonomy after the shift in sovereignty from England to China, and that autonomy applies to its education system. (CIA, 2014)
Education Bureau (EDB)
The Education Bureau supervises Hong Kong’s education system. It is accountable to the government of Hong Kong and not to the Chinese Ministry of Education. The Bureau is responsible for the formulation of policy, strategy, and direction on the development of the HKQF in Hong Kong (GovHK, 2016a).
Vocational Training Council (VTC)
VTC is a statutory body with a mandate to provide and promote a cost-effective and comprehensive VET pathway that meets the needs of the economy. Together with its 13 member institutes, the VTC is the largest VET provider in Hong Kong. It provides and administers full-time and part-time VET programs with formal qualifications ranging from the upper-secondary through tertiary levels (EDB, 2014). The VTC has 18 non-government members including leading figures in the education, industry, commerce, service, and labor sectors, plus government officials. The VTC is supported by 21 training boards and five general committees.
Hong Kong Council for Accreditation of Academic and Vocational Qualifications (HKCAAVQ)
The HKCAAVQ is responsible for VET qualifications’ quality assurance, which applies to all credentials under the HKQF. In addition, it provides advisory and consultancy services on qualifications and standards to the Hong Kong government and the Asia-Pacific region (GovHK, 2016a).
37The four sectors are retail, electrical and mechanical engineering, the printing and the watch and clock sectors. For a detailed description, refer to: http://www.vtc.edu.hk/studyat/en/apprenticeship-training-schemes/. 38These comprise the Apprenticeship Training Scheme, Traineeship Scheme, Engineering Graduate Training Scheme, New Technology Training Scheme and the Recognition Scheme for Security Training Courses.

41
Qualifications Framework Secretariat (QFS)
The QFS is the executive arm of the EDB responsible for the development, implementation, and promotion of the HKQF (GovHK, 2016a).
Employer Committees &Training Boards
Employer representation comes through Training Boards for 21 different sectors plus the five VTC General Committees. Representatives are nominated by employer associations and chambers of commerce. They advise the VTC on manpower trends and the training needs of various sectors and make recommendations for meeting skills needs. They produce annual surveys of employers’ skill needs to advise VTC skill content and its number and type of courses (VTC, 2006).
Industry Training Advisory Committees (ITACs) & the Cross-Industry Training Advisory Committee (CITAC)
ITACs and their umbrella CITAC consist of representatives from employers, employees, professional bodies, and regulatory bodies in many industries. They can be seen as a form of social partnership. They act as a platform for stakeholders to discuss training and human resource needs in their industries or sectors. Their main tasks are developing a Specification of Competency Standards for each industry, helping define the standards for the HKQF’s Recognition of Prior Learning mechanism, and implementing and promoting the HKQF in their industries or sectors (GovHK, 2016a).
Educational finance of the VET pathway All students are entitled to 12 years of free schooling, so the DVE and other school-based full-time VET programs offered by the VTC in general and the Youth College in particular are publicly funded, (GovHK, 2014a). Students in “Earn & Learn” pilot schemes earn a monthly salary. For the first eleven months of the program when trainees are in school, their salaries come from funds gathered by their industry sector and are less than half of what they receive later when they alternate between school-based and workplace training. Once trainees start working, training firms and industry sectors pay most of their monthly income. Firms commit to paying a minimum salary that is about 24% higher than during the training period (GovHK, 2015b).
CVC processes This section describes Hong Kong’s VET processes in the DVE program.
Curriculum design phase In the curriculum design phase, actors decide on the curriculum content and standards. In Hong Kong’s VET pathway, there is no central authority that defines the curriculum, nor is there any central advisory body. Various stakeholders like government, professional bodies, and employee representatives are involved in the curriculum development of the VTC through the ITACs and CITAC. They influence the curriculum through their involvement in the development of Specifications of Competency Standards (Tam, 2013: 746-747). The Training Boards and General Committees, consisting of representatives from different industries and sectors, advise the VTC on human resource trends, the skills needs of the particular industries, and how to adapt curricula accordingly. Private providers who finance their own VET programs are free to design their own curricula (VTC, 2016). DVE modules are designed in collaboration with representatives from their respective industries.
One of the most important design features of the DVE program is the HKQF, designed by the HKCAAVQ. The HKQF is a credit-based system that defines seven levels of academic, vocational and continuing education qualifications at the post-secondary level (GovHK, 2008). Under the framework, qualifications at the upper secondary levels are HKQF levels 1-3, post-secondary non-tertiary qualifications are level 4, and tertiary qualifications are levels 5-7 (Tam, 2013: 749). Credits earned from training courses can be accumulated or transferred to the next level of the HKQF, which allows students to switch between sectors as well as between academic and vocational qualifications (Tam, 2013: 750). The Recognition of Prior Learning mechanism under the HKQF allows practitioners to obtain HKQF-
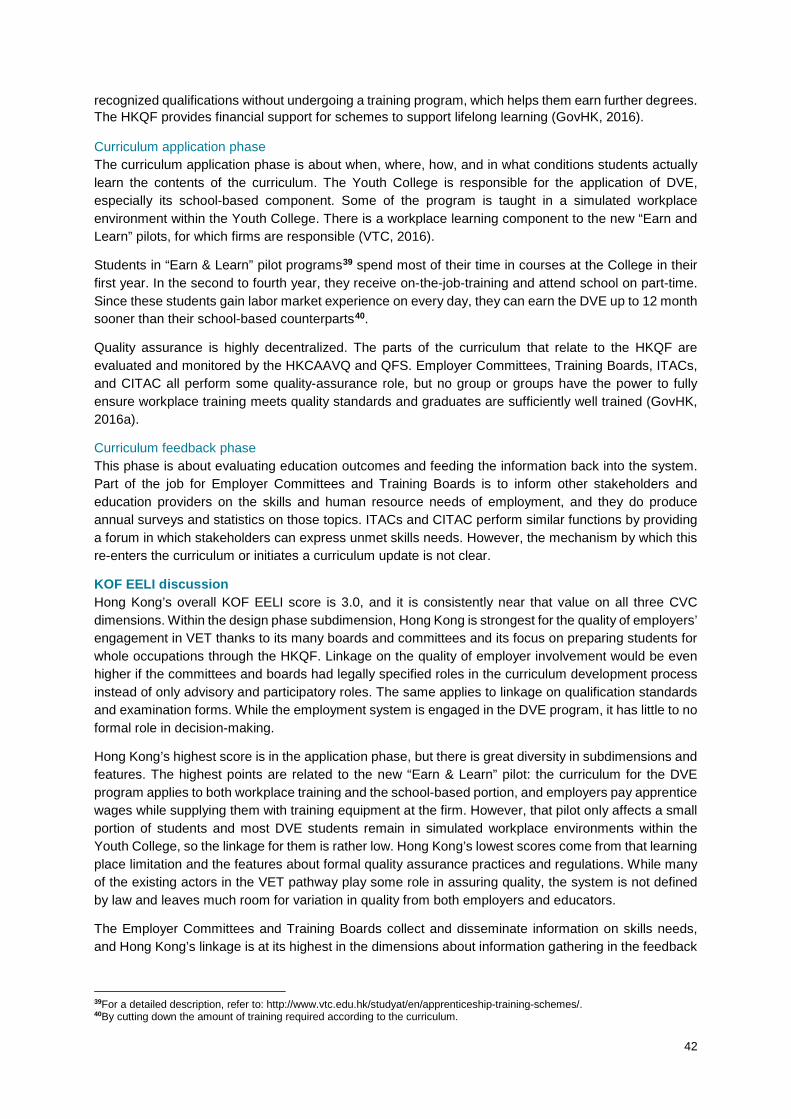
42
recognized qualifications without undergoing a training program, which helps them earn further degrees. The HKQF provides financial support for schemes to support lifelong learning (GovHK, 2016).
Curriculum application phase The curriculum application phase is about when, where, how, and in what conditions students actually learn the contents of the curriculum. The Youth College is responsible for the application of DVE, especially its school-based component. Some of the program is taught in a simulated workplace environment within the Youth College. There is a workplace learning component to the new “Earn and Learn” pilots, for which firms are responsible (VTC, 2016).
Students in “Earn & Learn” pilot programs39 spend most of their time in courses at the College in their first year. In the second to fourth year, they receive on-the-job-training and attend school on part-time. Since these students gain labor market experience on every day, they can earn the DVE up to 12 month sooner than their school-based counterparts40.
Quality assurance is highly decentralized. The parts of the curriculum that relate to the HKQF are evaluated and monitored by the HKCAAVQ and QFS. Employer Committees, Training Boards, ITACs, and CITAC all perform some quality-assurance role, but no group or groups have the power to fully ensure workplace training meets quality standards and graduates are sufficiently well trained (GovHK, 2016a).
Curriculum feedback phase This phase is about evaluating education outcomes and feeding the information back into the system. Part of the job for Employer Committees and Training Boards is to inform other stakeholders and education providers on the skills and human resource needs of employment, and they do produce annual surveys and statistics on those topics. ITACs and CITAC perform similar functions by providing a forum in which stakeholders can express unmet skills needs. However, the mechanism by which this re-enters the curriculum or initiates a curriculum update is not clear.
KOF EELI discussion Hong Kong’s overall KOF EELI score is 3.0, and it is consistently near that value on all three CVC dimensions. Within the design phase subdimension, Hong Kong is strongest for the quality of employers’ engagement in VET thanks to its many boards and committees and its focus on preparing students for whole occupations through the HKQF. Linkage on the quality of employer involvement would be even higher if the committees and boards had legally specified roles in the curriculum development process instead of only advisory and participatory roles. The same applies to linkage on qualification standards and examination forms. While the employment system is engaged in the DVE program, it has little to no formal role in decision-making.
Hong Kong’s highest score is in the application phase, but there is great diversity in subdimensions and features. The highest points are related to the new “Earn & Learn” pilot: the curriculum for the DVE program applies to both workplace training and the school-based portion, and employers pay apprentice wages while supplying them with training equipment at the firm. However, that pilot only affects a small portion of students and most DVE students remain in simulated workplace environments within the Youth College, so the linkage for them is rather low. Hong Kong’s lowest scores come from that learning place limitation and the features about formal quality assurance practices and regulations. While many of the existing actors in the VET pathway play some role in assuring quality, the system is not defined by law and leaves much room for variation in quality from both employers and educators.
The Employer Committees and Training Boards collect and disseminate information on skills needs, and Hong Kong’s linkage is at its highest in the dimensions about information gathering in the feedback
39For a detailed description, refer to: http://www.vtc.edu.hk/studyat/en/apprenticeship-training-schemes/. 40By cutting down the amount of training required according to the curriculum.
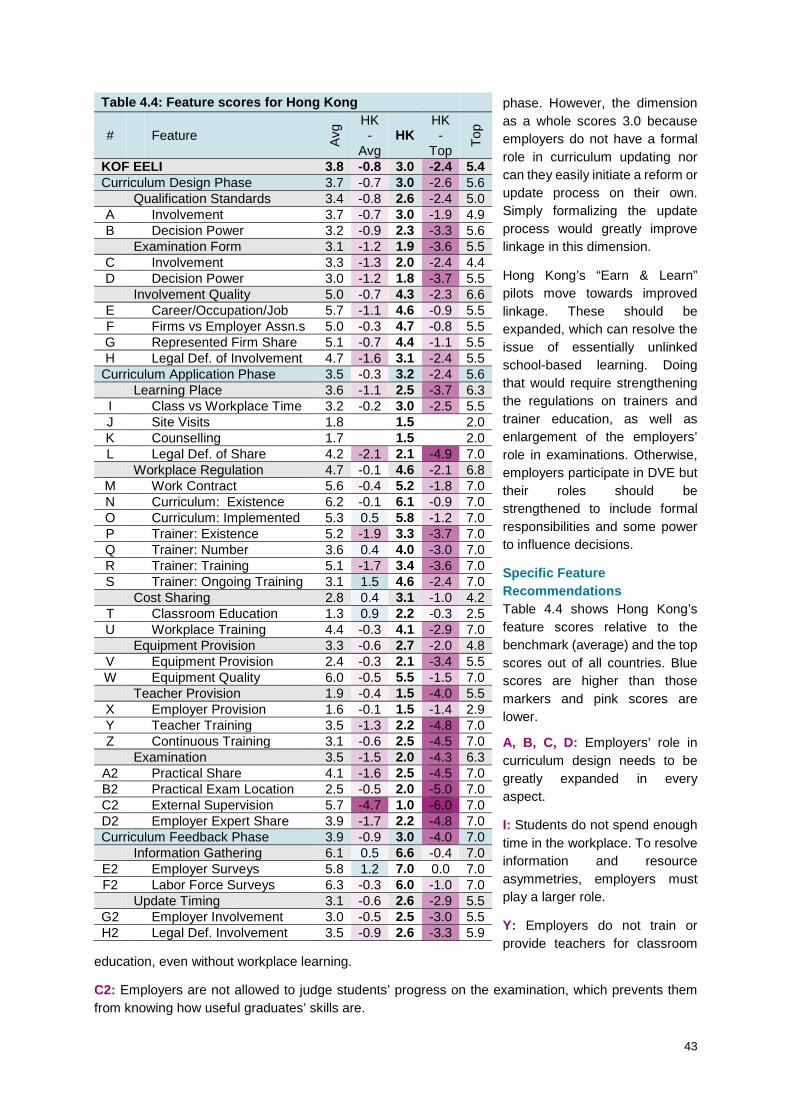
43
phase. However, the dimension as a whole scores 3.0 because employers do not have a formal role in curriculum updating nor can they easily initiate a reform or update process on their own. Simply formalizing the update process would greatly improve linkage in this dimension.
Hong Kong’s “Earn & Learn” pilots move towards improved linkage. These should be expanded, which can resolve the issue of essentially unlinked school-based learning. Doing that would require strengthening the regulations on trainers and trainer education, as well as enlargement of the employers’ role in examinations. Otherwise, employers participate in DVE but their roles should be strengthened to include formal responsibilities and some power to influence decisions.
Specific Feature Recommendations Table 4.4 shows Hong Kong’s feature scores relative to the benchmark (average) and the top scores out of all countries. Blue scores are higher than those markers and pink scores are lower.
A, B, C, D: Employers’ role in curriculum design needs to be greatly expanded in every aspect.
I: Students do not spend enough time in the workplace. To resolve information and resource asymmetries, employers must play a larger role.
Y: Employers do not train or provide teachers for classroom
education, even without workplace learning.
C2: Employers are not allowed to judge students’ progress on the examination, which prevents them from knowing how useful graduates’ skills are.
Table 4.4: Feature scores for Hong Kong
# Feature Avg HK
-Avg
HK HK -
Top Top
KOF EELI 3.8 -0.8 3.0 -2.4 5.4 Curriculum Design Phase 3.7 -0.7 3.0 -2.6 5.6 Qualification Standards 3.4 -0.8 2.6 -2.4 5.0 A Involvement 3.7 -0.7 3.0 -1.9 4.9 B Decision Power 3.2 -0.9 2.3 -3.3 5.6 Examination Form 3.1 -1.2 1.9 -3.6 5.5 C Involvement 3.3 -1.3 2.0 -2.4 4.4 D Decision Power 3.0 -1.2 1.8 -3.7 5.5 Involvement Quality 5.0 -0.7 4.3 -2.3 6.6 E Career/Occupation/Job 5.7 -1.1 4.6 -0.9 5.5 F Firms vs Employer Assn.s 5.0 -0.3 4.7 -0.8 5.5 G Represented Firm Share 5.1 -0.7 4.4 -1.1 5.5 H Legal Def. of Involvement 4.7 -1.6 3.1 -2.4 5.5
Curriculum Application Phase 3.5 -0.3 3.2 -2.4 5.6 Learning Place 3.6 -1.1 2.5 -3.7 6.3 I Class vs Workplace Time 3.2 -0.2 3.0 -2.5 5.5 J Site Visits 1.8 1.5 2.0 K Counselling 1.7 1.5 2.0 L Legal Def. of Share 4.2 -2.1 2.1 -4.9 7.0 Workplace Regulation 4.7 -0.1 4.6 -2.1 6.8 M Work Contract 5.6 -0.4 5.2 -1.8 7.0 N Curriculum: Existence 6.2 -0.1 6.1 -0.9 7.0 O Curriculum: Implemented 5.3 0.5 5.8 -1.2 7.0 P Trainer: Existence 5.2 -1.9 3.3 -3.7 7.0 Q Trainer: Number 3.6 0.4 4.0 -3.0 7.0 R Trainer: Training 5.1 -1.7 3.4 -3.6 7.0 S Trainer: Ongoing Training 3.1 1.5 4.6 -2.4 7.0 Cost Sharing 2.8 0.4 3.1 -1.0 4.2 T Classroom Education 1.3 0.9 2.2 -0.3 2.5 U Workplace Training 4.4 -0.3 4.1 -2.9 7.0 Equipment Provision 3.3 -0.6 2.7 -2.0 4.8 V Equipment Provision 2.4 -0.3 2.1 -3.4 5.5 W Equipment Quality 6.0 -0.5 5.5 -1.5 7.0 Teacher Provision 1.9 -0.4 1.5 -4.0 5.5 X Employer Provision 1.6 -0.1 1.5 -1.4 2.9 Y Teacher Training 3.5 -1.3 2.2 -4.8 7.0 Z Continuous Training 3.1 -0.6 2.5 -4.5 7.0 Examination 3.5 -1.5 2.0 -4.3 6.3
A2 Practical Share 4.1 -1.6 2.5 -4.5 7.0 B2 Practical Exam Location 2.5 -0.5 2.0 -5.0 7.0 C2 External Supervision 5.7 -4.7 1.0 -6.0 7.0 D2 Employer Expert Share 3.9 -1.7 2.2 -4.8 7.0 Curriculum Feedback Phase 3.9 -0.9 3.0 -4.0 7.0 Information Gathering 6.1 0.5 6.6 -0.4 7.0
E2 Employer Surveys 5.8 1.2 7.0 0.0 7.0 F2 Labor Force Surveys 6.3 -0.3 6.0 -1.0 7.0 Update Timing 3.1 -0.6 2.6 -2.9 5.5
G2 Employer Involvement 3.0 -0.5 2.5 -3.0 5.5 H2 Legal Def. Involvement 3.5 -0.9 2.6 -3.3 5.9

44
The Netherlands – MBO BOL Program
The Dutch MBO BOL program lasts 2-4 years, more often 4. More Dutch students choose an upper secondary VET pathway (67%) than a general pathway. Within upper secondary VET, the MBO BOL program has 79% of students with the other 21% in the MBO BBL program. A typical MBO BOL program is 20% workplace learning, although this can vary dramatically up to 60%. Students’ time is divided between classroom and workplace in an alternating manner, such that they are in firms at least annually. Although MBO BOL is mainly a school-based program, there is some workplace training. MBO BOL students do not have contracts with an employer, though MBO BBL students do. According to our experts, over 50% of content in classroom education is occupation specific.
Key data about the program Time spent in workplace (vs. classroom) 20-60% (CEDEFOP, 2014b) Work contract No (Yes in BBL) Transferrable content (vs. specific) <50% (KOF EELI data) Classroom/workplace sequencing Alternating (KOF EELI data) Frequency of workplace learning At least annually (KOF EELI data) Program duration 2-4 years (CEDEFOP, 2014a) VET out of all upper secondary 67%* (Eurostat, 2016) Program out of all VET 100% = 67% of all upper secondary Number of curricula/qualifications 176 with 489 profiles (CEDEFOP, 2016)
* This number is different from those in Table 4.5, since Table 4.5 refers to the enrolment at the total secondary level, i.e. lower and upper secondary level.
Policy Implications for the Netherlands
In the curriculum design phase, the Netherlands earns an average score in the qualification standards definition, but the examination form is a weakness of the Netherlands. Involvement quality is above average, particularly because employers participate through both employer associations and individual firms under a clear legal definition of employer involvement.
The Netherlands scores about average on all subdimensions of the curriculum application phase. The Netherlands has a small advantage on teacher provision. Conversely, the small disadvantage on
the examination arises because the share of employer-provided experts is low while external supervision of practical examinations is high. Further note that the average learning place subdimension value masks a weakness in terms of time spent in workplace training and a strength in terms of the legal definition of that time division.
Score Rank KOF EELI 3.68 12/20 Curriculum Design Phase 3.79 10/20 Curriculum Application Phase 3.20 11/20 Curriculum Feedback Phase 3.70 8/20
01234567
QualificationStandards
Examination Form
InvolvementQuality
Learning Place
WorkplaceRegulation
Cost SharingEquipmentProvision
Teacher Provision
Examination
InformationGathering
Update Timing
Top Average NLSubdimensions
Design Phase Application Phase Feedback Phase
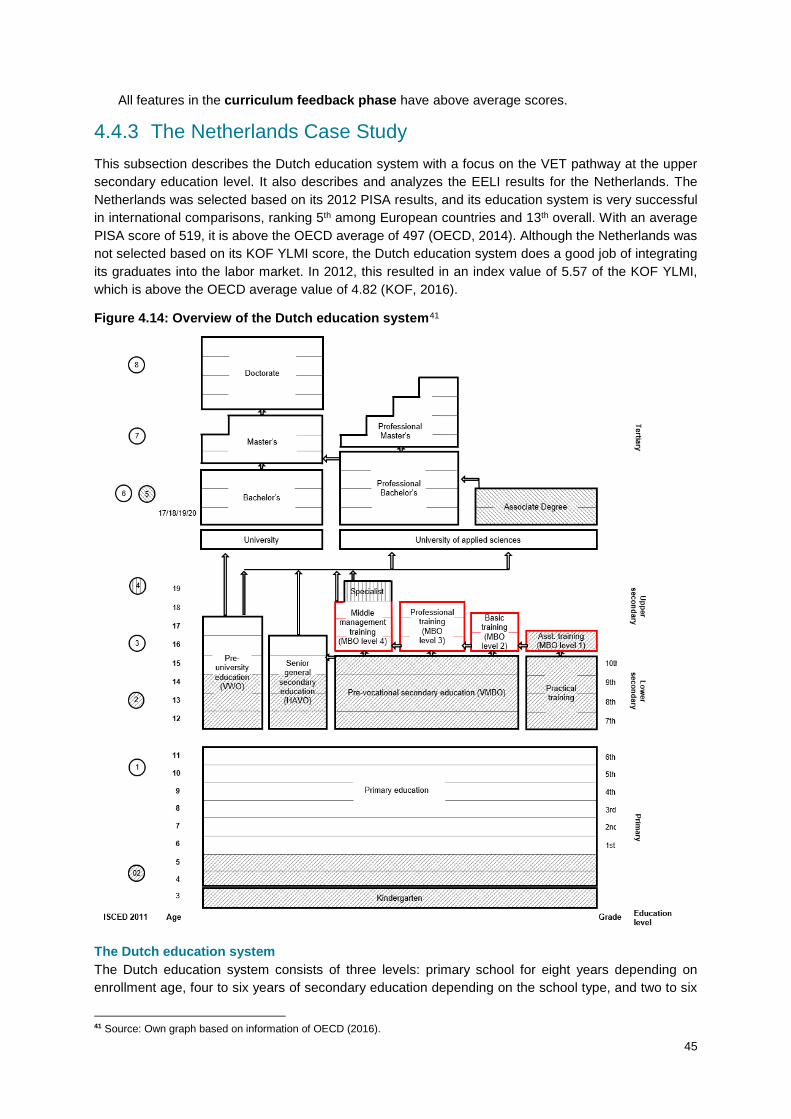
45
All features in the curriculum feedback phase have above average scores.
4.4.3 The Netherlands Case Study This subsection describes the Dutch education system with a focus on the VET pathway at the upper secondary education level. It also describes and analyzes the EELI results for the Netherlands. The Netherlands was selected based on its 2012 PISA results, and its education system is very successful in international comparisons, ranking 5th among European countries and 13th overall. With an average PISA score of 519, it is above the OECD average of 497 (OECD, 2014). Although the Netherlands was not selected based on its KOF YLMI score, the Dutch education system does a good job of integrating its graduates into the labor market. In 2012, this resulted in an index value of 5.57 of the KOF YLMI, which is above the OECD average value of 4.82 (KOF, 2016).
Figure 4.14: Overview of the Dutch education system41
The Dutch education system The Dutch education system consists of three levels: primary school for eight years depending on enrollment age, four to six years of secondary education depending on the school type, and two to six
41 Source: Own graph based on information of OECD (2016).
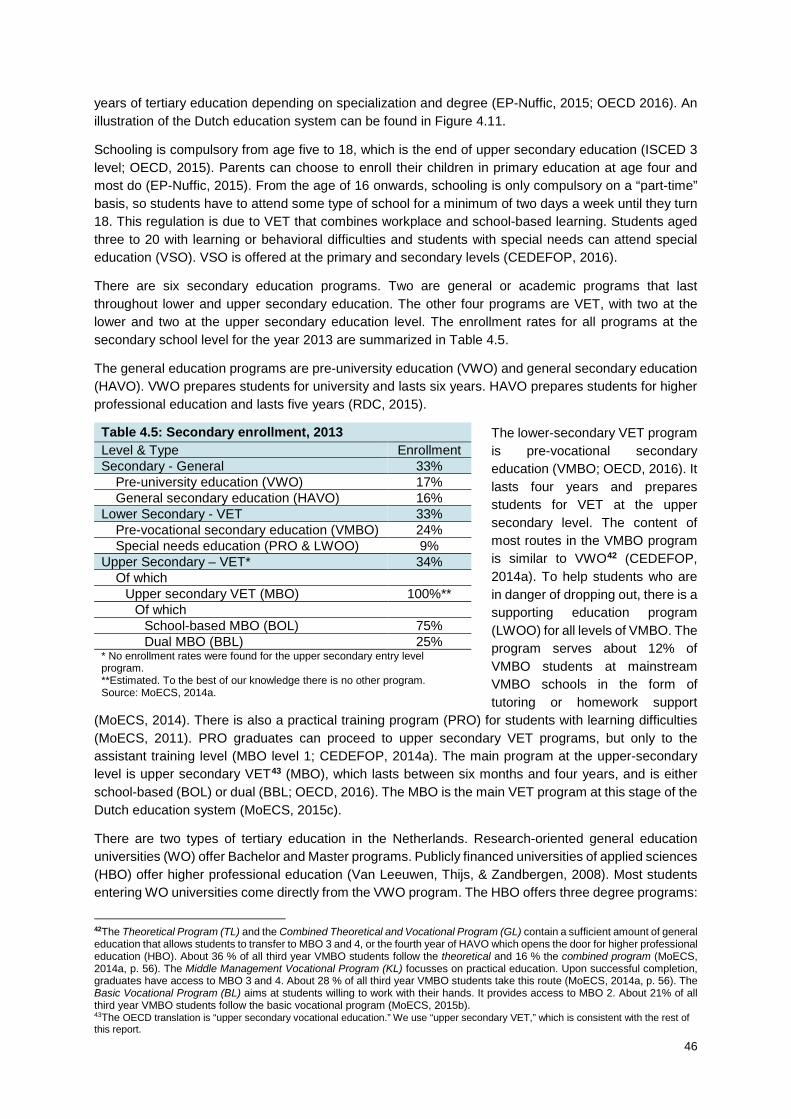
46
years of tertiary education depending on specialization and degree (EP-Nuffic, 2015; OECD 2016). An illustration of the Dutch education system can be found in Figure 4.11.
Schooling is compulsory from age five to 18, which is the end of upper secondary education (ISCED 3 level; OECD, 2015). Parents can choose to enroll their children in primary education at age four and most do (EP-Nuffic, 2015). From the age of 16 onwards, schooling is only compulsory on a “part-time” basis, so students have to attend some type of school for a minimum of two days a week until they turn 18. This regulation is due to VET that combines workplace and school-based learning. Students aged three to 20 with learning or behavioral difficulties and students with special needs can attend special education (VSO). VSO is offered at the primary and secondary levels (CEDEFOP, 2016).
There are six secondary education programs. Two are general or academic programs that last throughout lower and upper secondary education. The other four programs are VET, with two at the lower and two at the upper secondary education level. The enrollment rates for all programs at the secondary school level for the year 2013 are summarized in Table 4.5.
The general education programs are pre-university education (VWO) and general secondary education (HAVO). VWO prepares students for university and lasts six years. HAVO prepares students for higher professional education and lasts five years (RDC, 2015).
The lower-secondary VET program is pre-vocational secondary education (VMBO; OECD, 2016). It lasts four years and prepares students for VET at the upper secondary level. The content of most routes in the VMBO program is similar to VWO42 (CEDEFOP, 2014a). To help students who are in danger of dropping out, there is a supporting education program (LWOO) for all levels of VMBO. The program serves about 12% of VMBO students at mainstream VMBO schools in the form of tutoring or homework support
(MoECS, 2014). There is also a practical training program (PRO) for students with learning difficulties (MoECS, 2011). PRO graduates can proceed to upper secondary VET programs, but only to the assistant training level (MBO level 1; CEDEFOP, 2014a). The main program at the upper-secondary level is upper secondary VET43 (MBO), which lasts between six months and four years, and is either school-based (BOL) or dual (BBL; OECD, 2016). The MBO is the main VET program at this stage of the Dutch education system (MoECS, 2015c).
There are two types of tertiary education in the Netherlands. Research-oriented general education universities (WO) offer Bachelor and Master programs. Publicly financed universities of applied sciences (HBO) offer higher professional education (Van Leeuwen, Thijs, & Zandbergen, 2008). Most students entering WO universities come directly from the VWO program. The HBO offers three degree programs:
42The Theoretical Program (TL) and the Combined Theoretical and Vocational Program (GL) contain a sufficient amount of general education that allows students to transfer to MBO 3 and 4, or the fourth year of HAVO which opens the door for higher professional education (HBO). About 36 % of all third year VMBO students follow the theoretical and 16 % the combined program (MoECS, 2014a, p. 56). The Middle Management Vocational Program (KL) focusses on practical education. Upon successful completion, graduates have access to MBO 3 and 4. About 28 % of all third year VMBO students take this route (MoECS, 2014a, p. 56). The Basic Vocational Program (BL) aims at students willing to work with their hands. It provides access to MBO 2. About 21% of all third year VMBO students follow the basic vocational program (MoECS, 2015b). 43The OECD translation is “upper secondary vocational education.” We use “upper secondary VET,” which is consistent with the rest of this report.
Table 4.5: Secondary enrollment, 2013 Level & Type Enrollment Secondary - General 33%
Pre-university education (VWO) 17% General secondary education (HAVO) 16%
Lower Secondary - VET 33% Pre-vocational secondary education (VMBO) 24% Special needs education (PRO & LWOO) 9%
Upper Secondary – VET* 34% Of which
Upper secondary VET (MBO) 100%** Of which
School-based MBO (BOL) 75% Dual MBO (BBL) 25%
* No enrollment rates were found for the upper secondary entry level program. **Estimated. To the best of our knowledge there is no other program. Source: MoECS, 2014a.
47
a two-year Associate, a four-year Professional Bachelor, and a part-time Master. Of the students that enrolled in a HBO institution in 2013, about 36% came from HAVO, 24% from MBO and 4% from VWO. About 28% of entrants were not in education one year prior to enrollment, meaning most were probably in employment (EIF, 2016).
Focus program: School-based upper secondary VET (MBO BOL) This section focuses on the MBO program, which is also the focus of the KOF EELI for the Netherlands. MBO can be either school-based (BOL) or dual (BBL; OECD, 2016). We describe the entire MBO program in this section, but asked experts about only the school-based BOL program in the questionnaire because that program is larger and the two have different degrees of EEL. Of the students in the MBO program, 72% come from the VMBO, 6% from the VWO or HAVO programs, and about 6% from other programs such as PRO or LWOO. About 11% of entrants either work or are on a benefit program like unemployment before entry (EIF, 2016)44.
The MBO has four different levels: assistant training (MBO level 1), basic training (MBO level 2), professional training (MBO level 3), and middle management training (MBO level 4; OECD, 2016). Different MBO curricula can take between six months and four years to complete, and lead to different levels of employment (MoECS, 2015c). All curricula qualify graduates for direct entry into the labor market (UKCES, 2013). Curricula are offered in four different fields: health services and education, technology, economics and agriculture, and natural environment (also called green education; EIF, 2016).
The training to assistant program (MBO level 1)45 lasts between six month and one year (OECD, 2016). It was designed to help PRO students and lower-secondary school leavers without diplomas get an upper-secondary diploma. Its goal is to prepare students to proceed to MBO level 2 programs or for a direct entry into the labor market. In 2014, 3% of all students in upper secondary VET programs participated in a MBO level 1 (CEDEFOP, 2014h).
The basic vocational education program (MBO level 2) lasts two years and prepares students to perform basic tasks. The minimum access requirement is a VMBO diploma or a PRO diploma. MBO level 2 course credits are applied to completion when graduates move on to MBO level 3 (CEDEFOP, 2014a). In 2014, about 20% of all MBO students were enrolled in the MBO level 2 program (EIF, 2016).
The professional training program (MBO level 3) lasts three years. Graduates are prepared to work independently and guide others. The minimum access requirement is a VMBO or a MBO level 2 diploma. Graduates can move on to MBO level 4, where their previous course credits are again applied (CEDEFOP, 2014a). In 2014, about 26% of all MBO students were enrolled in the MBO level 3 program (CEDEFOP, 2014h).
The middle management training program (MBO level 4) lasts three years and qualifies graduates to work independently while holding organizational responsibilities. Access requirements are the same as for the MBO level 3 program. Graduates are eligible for MBO level 4 specialist training, which is an additional year that prepares them to take responsibility in a specialized field. Specialist training is classified as non-tertiary post-secondary VET (ISCED 4). Alternatively, students can move on to higher education (HBO). Therefore, VET through MBO is not a dead end and allows students to pursue tertiary education (CEDEFOP, 2014a). In 2014, about 51% of all MBO students were enrolled in the MBO level 4 program (CEDEFOP, 2014h).
Educational finance of the VET pathway The government provides resources to MBO schools through block grant funding (ECBO, 2014). Each school’s funding amount depends on the number of enrolled students and the amount of diplomas awarded per year. “Cascade” funding was introduced in 2014, which ties government funding to the length of the student’s school stay and attempts to incentivize more efficient study cycles (ECBO, 2014). 44 The remaining 5% share refers to unknown categories. 45 After 2014, this program can alternatively be called the “entry level program” (MoECS, 2015c).
48
In addition to lump sum transfers, MBO schools may receive extra budget if they meet certain quality agreements46 (MoECS, 2015d). MBO schools decide autonomously how to spend their public money to provide all required services.
In addition to government funding, MBO schools receive tuition fees paid by students47 (ECBO, 2014). Students who are younger than 18 can apply for a tuition allowance (MoECS, 2014), and BOL students older than 18 can apply for student grants (ECBO, 2014). BOL students can also earn payments from their employers for the time they spend in the workplace during stages and traineeships (UKCES, 2013). MBO schools also earn money through firm contract commitments, in which they perform educational activities for specific companies (CEDEFOP, 2014a).
Training firms are financed through a system of subsidies (CEDEFOP, 2014a). In order to obtain a subsidy, firms have to offer learning places in the BBL program or the technical dual-track HBO, and must be accredited before they can apply for funding48. In addition, firms spent €1.9 billion on private training costs for the practical skill education of MBO students in 2013 (CBS, 2015).
Key actors in the VET pathway: Netherlands
The Ministry of Education, Culture and Science
The Minister and his or her Secretary are responsible for the strategic direction of the VET pathway, except for agricultural education. They are assisted by the Director-General of Higher and Vocational Education, Science, and Emancipation, who leads the Directorate for Secondary Vocational Education. The executive arm of the ministry, called DUO (Dienst Uitvoering Onderwijs), is responsible for the funding of the VET pathway. Directly subordinated to the Secretary General is the Education Inspectorate (Inspectie van het Onderwijs), which is responsible for quality assurance and financial compliance (MoECS, 2014).
The Ministry of Economic Affairs, Agriculture and Innovation
This ministry is responsible for agricultural VET courses (MoECS, 2014).
The Foundation for Cooperation on VET and the Labor Market (Samenwerking Beroepsonderwijs Bedrijfsleven [SBB])
The SBB provides central representation for a wide range of stakeholders (UKCES, 2013). The board of directors and the management consist of representatives from all relevant social partners involved in the VET pathway (SBB, 2015). These are the MBO Raad (association of all VET and adult education institutions), the AOB (largest teachers’ union in the Netherlands), the NRTO (umbrella organization for private education institutions), major lobbying organizations, employer associations, and major labor unions. The SBB is organized into eight sectoral chambers responsible for workplace learning quality and keeping VET qualifications up to date in their own sector. Each chamber is supported by actors from the employment system. Together, the SBB advises the Minister of Education on topics related to the VET pathway like skills needs, qualification and examination structures, etc. (ILO, 2014). It is also responsible for the accreditation of training firms and has a say in the design of the curriculum (SBB, 2016).
Education Council (Onderwijsraad)
The Council advises the government on education in general and the VET pathway in particular. It is an independent governmental body that can advise the minister upon his request or on its own initiative (MoECS, 2014).
46 For example, professional development of teachers may lead to extra budget. 47 Course fees per school year are €1,065 in the BOL program and €221 for BBL MBO 1-2, €536 for BBL MBO 3-4, respectively. Students younger than 18 years can apply for tuition allowance (MoECS, 2014), BOL students older than 18 years for student grants (ECBO, 2014). 48 The Dutch government wants to give subsidies only in sectors where market failures prevail (ECBO, 2014).
49
Association for Vocational and Adult Education (MBO Raad)
This umbrella organization advises the government and other stakeholders on educational policy issues and promotes the collective interests of the VET pathway (UKCES, 2013). It is composed of representatives from the Regional Education and Training Centers (Regionaal Opleidingencentrum [ROC]), providers of non-agricultural VET courses including continuing VET (UKCES, 2013), the Agricultural Education and Training Centers (Agrarische Opleidingscentrum [AOC]), and providers of agricultural VET courses (MoECS, 2014).
CVC processes This section describes the Netherlands’ VET processes in the MBO program.
Curriculum design phase In the curriculum design phase, actors decide on the curriculum content and standards. For the MBO levels 2-4, firms and educational institutions work together to design a curriculum that fits the needs of the labor market. The cooperation between these actors was institutionalized in 2012 with the founding of the SBB. The main task of the SBB is to provide a platform to facilitate interaction among different stakeholders (UKCES, 2013).
Qualification files are the core of the Dutch curriculum design process as they set national education standards for all curriculum profiles49. Each file describes the required competencies, skills, and knowledge for a specific curriculum so that students can be taught and examined accordingly (ECBO, 2012). Each MBO diploma is tied to a specific qualification file. Since 2015, the SBB develops qualification files that are eventually approved by the Ministry of Education, Culture and Science (UKCES, 2013). Qualification files contain process-skill matrices with thorough descriptions of each required work process and descriptions of how each skill should be acquired (H-MBO, 2015).
The content and structure of examinations is also decided in the curriculum design phase. According to law, each MBO school independently compiles its own examinations and assessments of both school and workplace content. However, the law requires that firms offering workplace training must be involved in the process (CEDEFOP, 2014a).
Curriculum application phase The curriculum application phase is about when, where, how, and in what conditions students actually learn the contents of the curriculum. A major part of each qualification file is devoted to workplace learning, including regulations for both school and workplace learning (H-MBO, 2015). Depending on the subject50, MBO programs can be school-based or dual. Both programs contain a minimum level of school and work-based education and they lead to the same qualification certificate51 (UKCES, 2013). Most students (75% in 2013) choose the school-based program (Table 4.5). MBO schools have autonomy in applying the curriculum as long as they fulfil the goals set by legislation and the qualification files (UKCES, 2013).
In the school-based program (BOL), students typically spend one day a week in workplace training in a firm and four days in school, though that varies by program and school. Workplace training for the school-based program typically takes place during stages or traineeships (CEDEFOP, 2014b; UKCES, 2013). In the dual program (BBL), students typically spend four days each week in workplace training and one day in school. On average, 80% of time is spent in the workplace. Students in this program must have an employment contract with an accredited training firm, which guarantees them a minimum wage and makes them apprentices. BBL workplace training is much more in-depth than BOL. BBL can also be attended on a part-time basis, though very few (1-2%) students take this route (CEDEFOP, 49 All qualification files are available on http://kwalificaties.s-bb.nl/. 50MBO programs leading to professions that require more practical training (technical subjects) are offered in the BBL program. While programs that require a higher share of theory e.g. office-based ones, are usually offered in the school-based BOL program (CEDEFOP, 2014b). 51Graduate diplomas do not even mention the program taken (CEDEFOP, 2014b).
50
2014b; UKCES, 2013; EIF, 2016). While BOL students may change their employer several times over the duration of their course, BBL students usually stay with one firm.
Firms have to fulfil a number of criteria to earn the right to supervise and train students. Workplace instructors must have at least basic pedagogical skills and a qualification at the same level they are teaching. Firms must offer diverse training environments so students learn more than firm-specific skills. If a firm satisfies all requirements, it can offer work placements on a dedicated website (stagemarkt.nl). SBB accredits training firms as the central representative body for a wide range of stakeholders52. Accreditation has to be renewed every four years (CEDEFOP, 2014a).
Quality assurance is managed by the national Inspectorate of Education. The Inspectorate visits each MBO school once every three years to assess their quality (MoECS, 2015e). It has the power to close schools if quality standards are not met (UKCES, 2013)53. In addition to the Inspectorate, all MBO schools must create and employ an internal auditing system (De Ridder, 2015). This is a legal requirement for all educational VET institutions. The national Inspectorate of Education supervises the quality of examinations in terms of content, level, and procedures (CEDEFOP, 2014a).
Curriculum feedback phase This phase is about evaluating education outcomes and feeding the information back into the system. In the Netherlands, the Research Centre for Education and the Labor Market (ROA) is responsible for gathering sectoral labor market data. Its forecasts are used by the MBO schools to adjust their course offerings and capacity so that future school and labor market linkage is guaranteed (UKCES, 2013). Some MBO schools also conduct market research internally to forecast the future demand on the regional level (CEDEFOP, 2014a).
Following a recent reform towards flexibility, transparency, innovation, and efficiency of qualification files, all qualification files must be updated four times a year. In order to meet the target of the reform, a completely new file structure has been implemented (H-MBO, 2015)54.
KOF EELI discussion The Netherlands score just below the average KOF EELI score with 3.7 overall, and also score near the average for each dimension. The design phase is the Netherlands’ strongest point with an overall 3.8 that is driven by the high linkage in employers’ involvement quality. Dutch employers are well represented, have some legal rights and responsibilities, and enter both individually and through associations. The system also focuses on preparing students for occupations, which is exemplified by the qualification files system. Dutch employers are involved in setting and deciding on qualification standards through the SBB, though their role could be expanded. The weakest point of the design phase is on setting the examination form, as employers have only a very small role.
In the application phase, the Dutch system excels at the highly-weighted learning place dimension. Students in both BOL and BBL programs spend at least some time in the workplace, and the overall share of workplace learning is sufficient to earn the MBO program a “dual VET” designation from the OECD. While the share could be higher, the fact that it is laid out in the curriculum raises the Netherlands’ score. While employers participate in the design phase and in workplace training in the application phase, they lag behind in the application-phase features that require them to bear costs,
52Beforehand, the so-called knowledge centers (Kenniscentra Beroepsonderwijs Bedrijfsleven or KBB) was the body representing employers and employees in Dutch the VET system and, among other things responsible for the accreditation and recruiting of training firms (UKCES, 2013). As per August 2015, the former 17 different KBBs (sorted by industry/ sector) had to hand over their statutory duties to the SBB (SBB, 2016). 53 On top of that, a yearly evaluation framework may lead to inspection outside of regular cycles. 54Each qualification file (and therefore, each diploma) is now structured into three parts (H-MBO, 2015): basic part containing occupation-specific and general subjects (approx. 50 % of the course program), a profile part with VET courses (approx. 35 %) and an elective part (approx. 15 %) which was the main innovation of the reform. The elective part gives educational and corporate stakeholders the option to influence the design of the curriculum so that special regional labor market characteristics are taken into consideration. Furthermore, the file content can be revised more quickly and it allows students to differentiate their own skills and competencies (H-MBO, 2015).
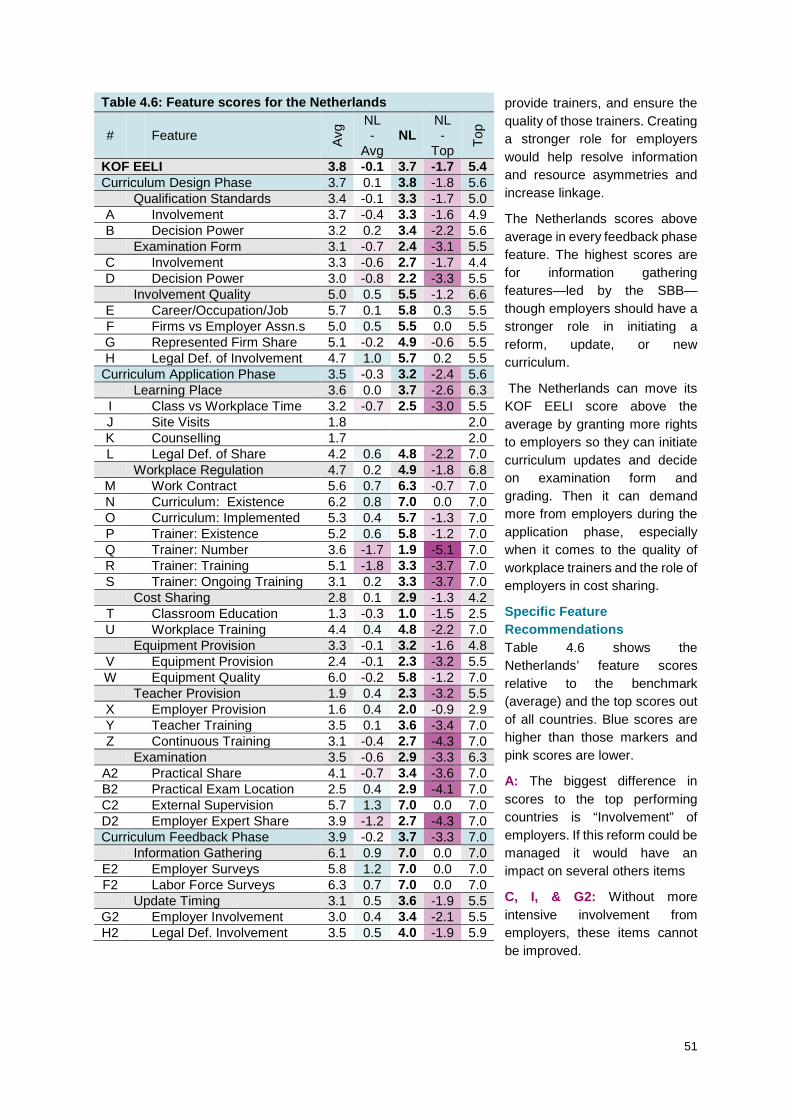
51
provide trainers, and ensure the quality of those trainers. Creating a stronger role for employers would help resolve information and resource asymmetries and increase linkage.
The Netherlands scores above average in every feedback phase feature. The highest scores are for information gathering features—led by the SBB—though employers should have a stronger role in initiating a reform, update, or new curriculum.
The Netherlands can move its KOF EELI score above the average by granting more rights to employers so they can initiate curriculum updates and decide on examination form and grading. Then it can demand more from employers during the application phase, especially when it comes to the quality of workplace trainers and the role of employers in cost sharing.
Specific Feature Recommendations Table 4.6 shows the Netherlands’ feature scores relative to the benchmark (average) and the top scores out of all countries. Blue scores are higher than those markers and pink scores are lower.
A: The biggest difference in scores to the top performing countries is “Involvement” of employers. If this reform could be managed it would have an impact on several others items
C, I, & G2: Without more intensive involvement from employers, these items cannot be improved.
Table 4.6: Feature scores for the Netherlands
# Feature Avg NL
-Avg
NL NL -
Top Top
KOF EELI 3.8 -0.1 3.7 -1.7 5.4 Curriculum Design Phase 3.7 0.1 3.8 -1.8 5.6 Qualification Standards 3.4 -0.1 3.3 -1.7 5.0 A Involvement 3.7 -0.4 3.3 -1.6 4.9 B Decision Power 3.2 0.2 3.4 -2.2 5.6 Examination Form 3.1 -0.7 2.4 -3.1 5.5 C Involvement 3.3 -0.6 2.7 -1.7 4.4 D Decision Power 3.0 -0.8 2.2 -3.3 5.5 Involvement Quality 5.0 0.5 5.5 -1.2 6.6 E Career/Occupation/Job 5.7 0.1 5.8 0.3 5.5 F Firms vs Employer Assn.s 5.0 0.5 5.5 0.0 5.5 G Represented Firm Share 5.1 -0.2 4.9 -0.6 5.5 H Legal Def. of Involvement 4.7 1.0 5.7 0.2 5.5
Curriculum Application Phase 3.5 -0.3 3.2 -2.4 5.6 Learning Place 3.6 0.0 3.7 -2.6 6.3 I Class vs Workplace Time 3.2 -0.7 2.5 -3.0 5.5 J Site Visits 1.8 2.0 K Counselling 1.7 2.0 L Legal Def. of Share 4.2 0.6 4.8 -2.2 7.0 Workplace Regulation 4.7 0.2 4.9 -1.8 6.8 M Work Contract 5.6 0.7 6.3 -0.7 7.0 N Curriculum: Existence 6.2 0.8 7.0 0.0 7.0 O Curriculum: Implemented 5.3 0.4 5.7 -1.3 7.0 P Trainer: Existence 5.2 0.6 5.8 -1.2 7.0 Q Trainer: Number 3.6 -1.7 1.9 -5.1 7.0 R Trainer: Training 5.1 -1.8 3.3 -3.7 7.0 S Trainer: Ongoing Training 3.1 0.2 3.3 -3.7 7.0 Cost Sharing 2.8 0.1 2.9 -1.3 4.2 T Classroom Education 1.3 -0.3 1.0 -1.5 2.5 U Workplace Training 4.4 0.4 4.8 -2.2 7.0 Equipment Provision 3.3 -0.1 3.2 -1.6 4.8 V Equipment Provision 2.4 -0.1 2.3 -3.2 5.5 W Equipment Quality 6.0 -0.2 5.8 -1.2 7.0 Teacher Provision 1.9 0.4 2.3 -3.2 5.5 X Employer Provision 1.6 0.4 2.0 -0.9 2.9 Y Teacher Training 3.5 0.1 3.6 -3.4 7.0 Z Continuous Training 3.1 -0.4 2.7 -4.3 7.0 Examination 3.5 -0.6 2.9 -3.3 6.3
A2 Practical Share 4.1 -0.7 3.4 -3.6 7.0 B2 Practical Exam Location 2.5 0.4 2.9 -4.1 7.0 C2 External Supervision 5.7 1.3 7.0 0.0 7.0 D2 Employer Expert Share 3.9 -1.2 2.7 -4.3 7.0 Curriculum Feedback Phase 3.9 -0.2 3.7 -3.3 7.0 Information Gathering 6.1 0.9 7.0 0.0 7.0
E2 Employer Surveys 5.8 1.2 7.0 0.0 7.0 F2 Labor Force Surveys 6.3 0.7 7.0 0.0 7.0 Update Timing 3.1 0.5 3.6 -1.9 5.5
G2 Employer Involvement 3.0 0.4 3.4 -2.1 5.5 H2 Legal Def. Involvement 3.5 0.5 4.0 -1.9 5.9

52
Singapore – Institutes of Technical Education
Singapore’s Institute of Technical Education (ITE) programs have a duration of 2 years. Approximately 25% of students choose a VET pathway at the level of the ITEs, though Singapore’s education system and lack of VET at the upper-secondary level means we do not focus on that level here. ITEs aim to prepare students for entry into the labor market. They mainly consist of classroom education, with workplace training making up far less than 50% of students’ time. When students are in firms, it is only after classroom education is over and they might return to alternate periods of work and schooling. Students in work have contracts, according to responses to the KOF EELI survey. The vast majority of the ITE program is not dual VET. In classroom education, over 50% of content is occupation-specific.
Key data about the program Time spent in workplace (vs. classroom) <50% (ITE, 2012 & 2016) Work contract Yes (KOF EELI data) Transferrable content (vs. specific) <50% (KOF EELI data) Classroom/workplace sequencing Alternating (KOF EELI data) Frequency of workplace learning After completing classroom ed. (KOF EELI data) Program duration 2 years (APEC, 2010) VET out of all upper secondary 65% (APEC, 2010) Program out of all VET 38.5% = 25% of all post-secondary Number of curricula/qualifications 97 (Nitecs and Higher Nitecs) (ITE, 2015)
Policy Implications for Singapore
Singapore’s scores are below average for employer participation in the curriculum design phase. The quality of involvement, however, scores only slightly below average because the focus on whole occupations and the involvement of employers as both individual firms and employer associations make up for the small share of represented firms and the severe lack of a legal definition of involvement.
Singapore can improve linkage substantially by increasing the share of workplace training and the legal definition thereof. While Singapore’s scores are average for workplace regulation, cost sharing, equipment provision, and teacher provision in the curriculum application phase, the practical share
of examinations remains low, seldom takes place in the workplace, and is not often supervised by employer-provided experts.
While Singapore gathers information well in the curriculum feedback phase, it scores below average in terms of involving employers in the decision to update the curriculum.
Score Rank KOF EELI 2.94 16/20 Curriculum Design Phase 2.79 16/20 Curriculum Application Phase 2.99 14/20 Curriculum Feedback Phase 3.45 10/20
01234567
QualificationStandards
Examination Form
InvolvementQuality
Learning Place
WorkplaceRegulation
Cost SharingEquipmentProvision
Teacher Provision
Examination
InformationGathering
Update Timing
Top Average SGSubdimensions
Design Phase Application Phase Feedback Phase
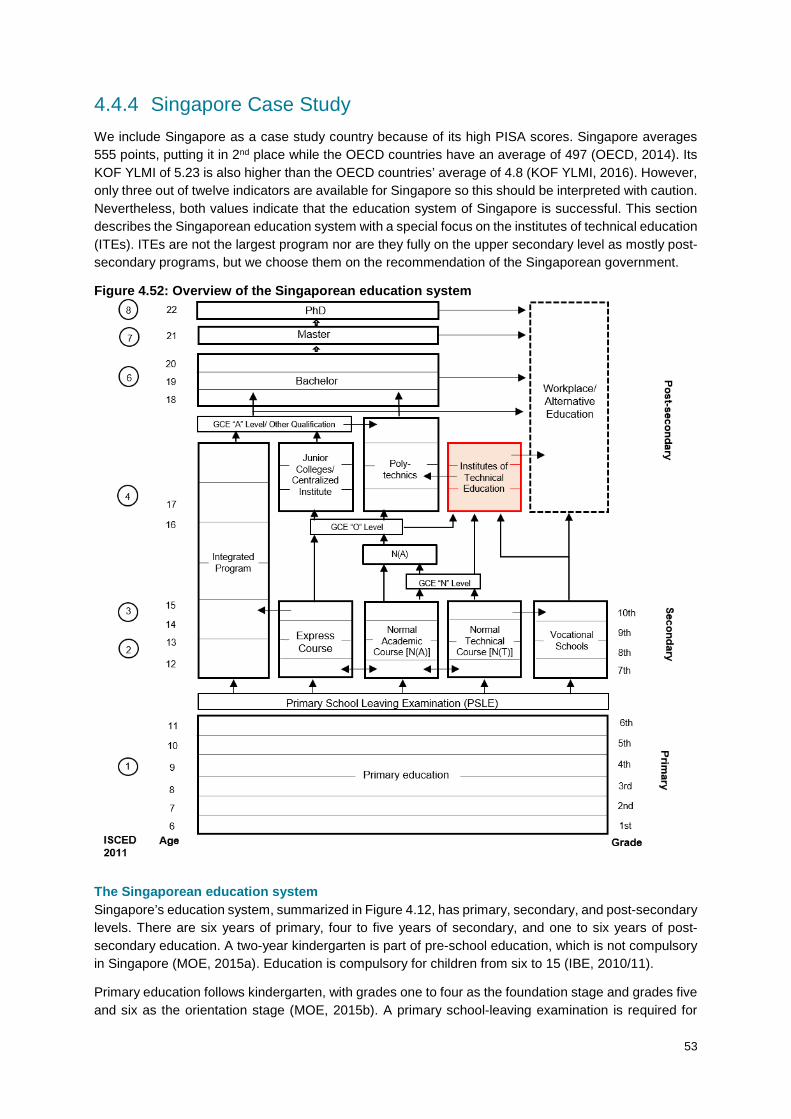
53
4.4.4 Singapore Case Study We include Singapore as a case study country because of its high PISA scores. Singapore averages 555 points, putting it in 2nd place while the OECD countries have an average of 497 (OECD, 2014). Its KOF YLMI of 5.23 is also higher than the OECD countries’ average of 4.8 (KOF YLMI, 2016). However, only three out of twelve indicators are available for Singapore so this should be interpreted with caution. Nevertheless, both values indicate that the education system of Singapore is successful. This section describes the Singaporean education system with a special focus on the institutes of technical education (ITEs). ITEs are not the largest program nor are they fully on the upper secondary level as mostly post-secondary programs, but we choose them on the recommendation of the Singaporean government.
Figure 4.52: Overview of the Singaporean education system
The Singaporean education system Singapore’s education system, summarized in Figure 4.12, has primary, secondary, and post-secondary levels. There are six years of primary, four to five years of secondary, and one to six years of post-secondary education. A two-year kindergarten is part of pre-school education, which is not compulsory in Singapore (MOE, 2015a). Education is compulsory for children from six to 15 (IBE, 2010/11).
Primary education follows kindergarten, with grades one to four as the foundation stage and grades five and six as the orientation stage (MOE, 2015b). A primary school-leaving examination is required for

54
secondary education (PSLE; MOE, 2015a). PSLE results are used to track students into a secondary, or students can directly enroll in secondary education before the PSLE and take the direct school admission exercise.
Students are typically 13 years old when they enroll in secondary education. There they have the choice between three main programs: Express, Normal (Academic) and Normal (Technical), plus a program for academically gifted students called the Integrated Program. The Express programs take four years and end with the Singapore-Cambridge General Certificate of Education (Ordinary Level), abbreviated as GCE O. The Normal (Academic) programs and Normal (Technical) programs each last four years and end with GCE N(A) and N(T) for Normal (Academic) and Normal (Technical). Students in the Normal (Academic) program and with good grades can take a fifth year of schooling and the GCE O examination. Permeability between secondary programs is high, and students can change programs at various occasions. Students in the Integrated Programs study for six years and finish with the pre-university examination, which is the GCE A for Advanced Level (IBE, 2010/11; MOE, 2015a; MOE, 2015b).
Students with GCE N(T)s can pursue National ITE Certificate (Nitec) programs at the ITEs or go for a GCE N(A) (MOE, 2015a). GCE N(A) holders can continue with the one-year Polytechnic Foundation Program or the two-year Direct-Entry Scheme to enter the Polytechnics, Higher Nitec programs at ITEs, or take the GCE O examination (MOE, 2015b). Those with the GCE O can move on to pre-university programs at junior colleges, the polytechnics, or ITEs (IBE, 2010/11). They can also attend Integrated Programs for two years to attempt the GCE A. Students with the GCE A have access to universities (MOE, 2015a).
Table 4.7 summarizes the postsecondary options for Singaporean students. Junior colleges and universities are general education providers. The 12 junior colleges provide pre-university education and preparation for the GCE A (MOE, 2015c). The six publicly funded universities offer full-time degree programs and part-time degree programs (MOE, 2015a; MOE, 2015b).
Polytechnics and ITEs are VET55 programs, and make up 65% of postsecondary choices (APEC, 2010). Students can attend one of the five polytechnics either full- or part-time (MOE, 2015a). Their programs take three years and prepare graduates for middle-level professions and
management (APEC, 2010). Graduates from the polytechnics can enter the labor market or continue on to university (MOE, 2015b). ITEs offer full-time and part-time programs in VET on three campuses (IBE, 2010/11). Earning a National ITE Certificate or a Higher National ITE Certificate takes two years (APEC, 2010). ITEs prepare students for the labor market at a technician and semi-professional level, as well as for further studies at polytechnics (APEC, 2010; MOE, 2015b). A few minor private VET providers like the Approved Training Centers (ATC) provide in-firm programs. Approved Training Providers (ATP) provide licensed ITE programs to paying students (APEC, 2010).
Focus program: Institutes of Technical Education (ITEs) Because there are no upper-secondary VET programs in Singapore, its government recommended that we focus on the ITE programs, which come closest to the other programs in this study. This is the reason
55 In Singapore, the term used for VET is vocational and technical education (VTE). To have a consistent terminology within the entire study, we will stick to the term VET for secondary education programs and PET for post-secondary programs.
Table 4.7: Post-secondary enrollment Level & Type Enrollment Junior College 25 % Polytechnic 40 % ITE 25 % Other 10 % Total VET share 65%
of which Polytechnic 61.5 % ITE 38.5 % Source: Own table with data from APEC (2010) and own calculation

55
why we consider the ITEs, even though they are neither an upper secondary education program nor the largest VET program on their education level for Singapore.
The ITEs serve roughly a quarter of each cohort, a share that has been very stable since 1999 (ITE, 2012). The Ministry of Education (MOE) established ITEs in 1992 to transmit technical skills and knowledge to students in a practical way and to provide workforce for industry (APEC, 2010; MOE, 2015c). Their maxim is to provide a “hands-on, minds-on, hearts-on” college education (ITE, 2012). ITEs cater to students with lower grades than the polytechnics, so ITE programs are rarely the first choice of students and parents (APEC, 2010; ITE, 2012).
In total the ITE provides four kinds of certifications: Nitec, Higher Nitec, Master Nitec, and Technical Diploma. The Nitec and Higher Nitec programs last for two years—some Nitec programs are shorter—and the Master Nitec programs are only available as part-time programs in collaboration with industry. In 2014, ITEs provided 97 full-time Nitec and Higher Nitec curricula and three Technical Diploma courses on three campuses scattered around the island (ITE, 2012; ITE, 2015; MOE, 2015c; ITE, 2016).
The average ITE student is between 17 and 20 years old and has an aptitude for hands-on learning (MOE, 2015a; MOE, 2015c). To qualify for an ITE, Nitec students need either the GCE N or GCE O plus the Joint Intake Exercise and Higher Nitec students need the GCE O plus the Joint Admission Exercise (MOE, 2015c). Nitec students can switch to Higher Nitec if they fulfill the program-specific entry requirements (MOE, 2015c). Students with the GCE N(A) and remarkable grades can apply for polytechnics through Higher Nitec and the Direct-Entry Scheme, which grants them entry into polytechnics after two years of Higher Nitec at an ITE. To enroll in the Master Nitec, students need a Nitec diploma and three years of working experience in the relevant field. Technical Diploma applicants need a Higher Nitec or Nitec (ITE, 2012). All ITE students must be physically, medically, and mentally healthy (ITE, 2016).
ITE graduation requires sufficient training credits in the specific program, earned by attending program modules (ITE, 2016). 85% of ITE students graduate, and of those 87% have employment within six months of graduation (ITE, 2015). ITE graduates with a Nitec certification can also continue to a Higher Nitec program. After the Higher Nitec, graduates with high enough grades can continue to a polytechnic (MOE, 2015c). The Master Nitec program is open to Nitec and Higher Nitec graduates.
Key actors in the VET pathway: Singapore
The ITE Act of 1992 governs ITEs in Singapore (APEC, 2010). The key actors are manifold. However, they can be assigned to three categories: government, ITEs, and industry.
Ministry of Education (MOE)
The MOE appoints the Board of Governors for a term of three years to balance the needs of the ITE stakeholders. It was also involved in the development of the ITE Code of Corporate Governance (ITE, 2012).
National Manpower Council (NMC)
The NMC is a cross-ministry council headed by the Ministry of Manpower with member ministries including the MOE, the Ministry of Trade and Industry, and the Ministry of Finance. Its task is to align the plans and strategies of key ministries. Its decisions influence ITE with projected training capacities or enrollment levels (APEC, 2010).
ITE Board of Governors (BOG)
The BOG is an independent board appointed by the MOE and composed of representatives from the government, employers, and trade unions. The ITE Act of 1992 and the ITE Code of Corporate Governance define the role of the BOG and state its responsibilities. It should provide leadership, develop annual plans and strategic directions, and guarantee a framework for simple risk assessment and management. Additionally, the board appoints Academic Advisory Committees to hear industry

56
expertise and takes advice from the Technical Advisory and Certification Council on industry-based certification and examination procedures (APEC, 2010; ITE, 2012).
Academic Advisory Committees
Academic Advisory Committees from different industry clusters are selected by the BOG to share their expertise and advice from industry. Their goals are to provide the BOG with information on current industry trends and developments and to identify which industry clusters need new VET programs (APEC, 2010).
Technical Advisory and Certification Council
The Technical Advisory and Certification Council advises the ITE colleges on the development of VET certifications, examination standards, and skills standards. It approves standards before they are put in place (APEC, 2010).
ITE Headquarters
The ITE headquarters oversees the ITE system by making sure that the three colleges have the same standards and quality. It further controls certifications, handles policy issues, operates ITE branding, and manages human resources (ITE, 2012).
Senior Management
Senior management of the ITEs consists of a director and CEO, four deputy CEOs, and three principals—one for each college (ITE; 2012). The CEO reports to the BOG, which also gives him or her specific responsibilities (APEC, 2010). The responsibility of the senior management is to develop the ITE’s area of excellence and the ITE Mission, Vision and Values (ITE; 2012). The three key decision-making bodies chaired by the ITE CEO are the Academic Council, the Executive Committee, and the Organizational Excellence Steering Committee.
Industry partners
The ITE has about 92 active Memorandum of Understanding partnerships with key firms (ITE, 2012; MOE, 2015c). These industry partners provide learning and development opportunities not only for students but also for ITE staff (ITE, 2012).
Educational finance of the VET pathway The ITEs are publicly funded to a great extent, as they receive an annual operating grant from the MOE. The size of the grant depends on the expected number of students and the expected training costs. To develop new programs, the ITE receives additional development grants from the MOE. Other funding comes from consultancy services and student fees, which are heavily subsidized by the government for Singaporean citizens (APEC, 2010; ITE, 2016).
CVC processes This section describes Singapore’s VET processes in the ITE program.
Curriculum design phase In the curriculum design phase, actors decide on the curriculum content and standards. The curriculum framework at ITE in Singapore is called the career cluster-based curriculum framework; ITE programs are collections of modular courses so students can specialize in a career, in a system that still facilitates career switching and lifelong learning. Eight Academic Advisory Committees of experts and employer representatives identify what curricula are needed. These committees approve the programs and course syllabi so they meet the industry standards. ITEs use the DACUM process for competency-based curriculum, and validate the curriculum with industry practitioner surveys (ITE, 2012; ITE, 2016).
Curriculum application phase The curriculum application phase is about when, where, how, and in what conditions students actually learn the contents of the curriculum. Most ITE learning takes place at school, and about 20% of the
57
curriculum is provided via e-learning. ITE students also have the opportunity to participate in project work, simulated work environments, and enhanced internships to get closer to real-life learning (ITE, 2012; ITE, 2016). Full-time ITE programs are about 30% theory and 70% practical training (MOE, 2015b). Part-time students can do a traineeship with an “earn-as-you-learn” arrangement (ITE, 2016). These students attend school and work at a firm where they are treated as workers and earn a monthly salary. Each one is guided and overseen by a trained and qualified supervisor. This is the most similar to an apprenticeship out of all ITE curricula, but is not a large share of students.
ITE teachers are required to have technical expertise and pedagogical skills. To keep up with the changes in industry, they must regularly participate in industry attachments (ITE, 2016). ITEs also provide Career Service Centers to advise students on their options and career choices (ITE, 2012). ITEs have an Academic Quality Assurance System for the entire education process, which earned them the ISE 9001:2000/8 certification.
Curriculum feedback phase ITEs conduct Student Satisfaction Surveys at the end of each term to get student feedback. They observe graduates after they leave through the Annual Graduate Employment Survey for information on the transition period and the value of the ITE programs. Twice a year, the ITE also conducts Employer Satisfaction Surveys to assess the quality of its programs. Every five years, the Quality Assurance Framework is assessed (ITE, 2012).
KOF EELI Discussion Singapore’s KOF EELI score is 2.9, which puts it in a cluster of Asian countries that score around 3 overall. The design phase is similarly low for Singapore at 2.8, but that and the subdimension scores in the design phase hide a wide range of scores at the feature level. The ITE program’s focus on career clusters allows students to learn a curriculum with enough generality to stay flexible on the labor market. Similarly, employers can be engaged in the design phase through multiple opportunities and this is a strength of the ITE program. The areas where Singapore struggles in the design phase are all about passing power to the employment system: despite the many stakeholders and the elaborate network of industry advisors, the ITE program does not allow employers any formal role or decision-making power.
In the application phase, the key issue for Singapore is that ITEs do not contain a significant amount of workplace training. Simulated work environments are not sufficient to resolve the information and resource asymmetries between education and employment, so they do not improve linkage. Even though there is a curriculum and other strong features of regulation for what little workplace training does exist, the role of employers is simply insufficient to constitute linkage. Again, employers have almost no rights or responsibilities and this absence is particularly egregious in their lack of formal standing as VET providers. For example, the practical share of the examination is low, testing could take place at least partly in the workplace so students can work on real situations and with industry-standard equipment, and exams should be supervised at least partly by employer-provided experts who know what firms need from a specific task.
Singapore does an excellent job of collecting information on ITE student outcomes and the labor market—many of the key VET actors described above have information-gathering as part of their role. However, employers do not have the power to do more than advise the curriculum updating process, and without a mechanism through which employers can initiate change, linkage remains low.
Specific Feature Recommendations Table 4.8 shows Singapore’s feature scores relative to the benchmark (average) and the top scores out of all countries. Blue scores are higher than those markers and pink scores are lower.
A, B, C, D: All features of the curriculum and examination form design process are very low for Singapore. These cannot be raised unless employers get a formal role in designing official curricula.
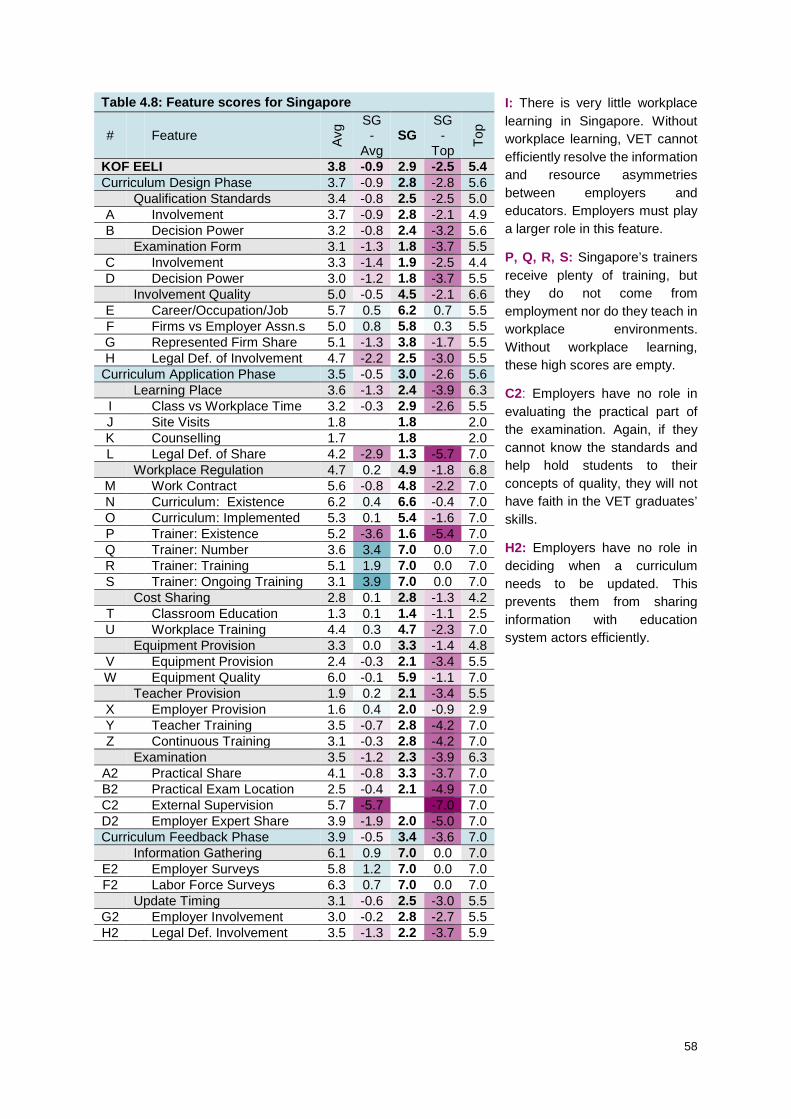
58
I: There is very little workplace learning in Singapore. Without workplace learning, VET cannot efficiently resolve the information and resource asymmetries between employers and educators. Employers must play a larger role in this feature.
P, Q, R, S: Singapore’s trainers receive plenty of training, but they do not come from employment nor do they teach in workplace environments. Without workplace learning, these high scores are empty.
C2: Employers have no role in evaluating the practical part of the examination. Again, if they cannot know the standards and help hold students to their concepts of quality, they will not have faith in the VET graduates’ skills.
H2: Employers have no role in deciding when a curriculum needs to be updated. This prevents them from sharing information with education system actors efficiently.
Table 4.8: Feature scores for Singapore
# Feature Avg SG
-Avg
SG SG -
Top Top
KOF EELI 3.8 -0.9 2.9 -2.5 5.4 Curriculum Design Phase 3.7 -0.9 2.8 -2.8 5.6 Qualification Standards 3.4 -0.8 2.5 -2.5 5.0 A Involvement 3.7 -0.9 2.8 -2.1 4.9 B Decision Power 3.2 -0.8 2.4 -3.2 5.6 Examination Form 3.1 -1.3 1.8 -3.7 5.5 C Involvement 3.3 -1.4 1.9 -2.5 4.4 D Decision Power 3.0 -1.2 1.8 -3.7 5.5 Involvement Quality 5.0 -0.5 4.5 -2.1 6.6 E Career/Occupation/Job 5.7 0.5 6.2 0.7 5.5 F Firms vs Employer Assn.s 5.0 0.8 5.8 0.3 5.5 G Represented Firm Share 5.1 -1.3 3.8 -1.7 5.5 H Legal Def. of Involvement 4.7 -2.2 2.5 -3.0 5.5
Curriculum Application Phase 3.5 -0.5 3.0 -2.6 5.6 Learning Place 3.6 -1.3 2.4 -3.9 6.3 I Class vs Workplace Time 3.2 -0.3 2.9 -2.6 5.5 J Site Visits 1.8 1.8 2.0 K Counselling 1.7 1.8 2.0 L Legal Def. of Share 4.2 -2.9 1.3 -5.7 7.0 Workplace Regulation 4.7 0.2 4.9 -1.8 6.8 M Work Contract 5.6 -0.8 4.8 -2.2 7.0 N Curriculum: Existence 6.2 0.4 6.6 -0.4 7.0 O Curriculum: Implemented 5.3 0.1 5.4 -1.6 7.0 P Trainer: Existence 5.2 -3.6 1.6 -5.4 7.0 Q Trainer: Number 3.6 3.4 7.0 0.0 7.0 R Trainer: Training 5.1 1.9 7.0 0.0 7.0 S Trainer: Ongoing Training 3.1 3.9 7.0 0.0 7.0 Cost Sharing 2.8 0.1 2.8 -1.3 4.2 T Classroom Education 1.3 0.1 1.4 -1.1 2.5 U Workplace Training 4.4 0.3 4.7 -2.3 7.0 Equipment Provision 3.3 0.0 3.3 -1.4 4.8 V Equipment Provision 2.4 -0.3 2.1 -3.4 5.5 W Equipment Quality 6.0 -0.1 5.9 -1.1 7.0 Teacher Provision 1.9 0.2 2.1 -3.4 5.5 X Employer Provision 1.6 0.4 2.0 -0.9 2.9 Y Teacher Training 3.5 -0.7 2.8 -4.2 7.0 Z Continuous Training 3.1 -0.3 2.8 -4.2 7.0 Examination 3.5 -1.2 2.3 -3.9 6.3
A2 Practical Share 4.1 -0.8 3.3 -3.7 7.0 B2 Practical Exam Location 2.5 -0.4 2.1 -4.9 7.0 C2 External Supervision 5.7 -5.7 -7.0 7.0 D2 Employer Expert Share 3.9 -1.9 2.0 -5.0 7.0 Curriculum Feedback Phase 3.9 -0.5 3.4 -3.6 7.0 Information Gathering 6.1 0.9 7.0 0.0 7.0
E2 Employer Surveys 5.8 1.2 7.0 0.0 7.0 F2 Labor Force Surveys 6.3 0.7 7.0 0.0 7.0 Update Timing 3.1 -0.6 2.5 -3.0 5.5
G2 Employer Involvement 3.0 -0.2 2.8 -2.7 5.5 H2 Legal Def. Involvement 3.5 -1.3 2.2 -3.7 5.9

59
South Korea – VET High Schools
Courses of study at South Korea’s VET High Schools last 3 years. While only a minority (17.6%) of each cohort chooses a VET pathway at the upper secondary level, VET High Schools are the most popular option within the VET sector with 95.5% of all upper secondary VET students. Learning takes place mainly in the classroom, with the share of workplace training far below 50%. When workplace training exists, it takes place at least semiannually. While VET High School students do not have work contracts when they train at work, those at Meister High Schools do have such contracts. In VET High School classroom education, 50% of the content is occupation-specific.
Key data about the program Time spent in workplace (vs. classroom) <50% (Heo, 2014) Work contract Experts disagree (KOF EELI data) Transferrable content (vs. specific) 50% (KOF EELI data) Classroom/workplace sequencing Experts disagree (KOF EELI data) Frequency of workplace learning Experts disagree (KOF EELI data) Program duration 3 years (IQAS, 2009) VET out of all upper secondary 17.6% (Choi, 2014) Program out of all VET 95.5% = 16.8% of all upper secondary Number of curricula/qualifications 5 sectors (Choi, 2014)
Policy Implications for South Korea
The involvement quality subdimension of the curriculum design phase scores above average even though students prepare for a career rather than an occupation. South Korea should increase the involvement and decision power of employers for qualification standards and the examination form.
South Korea also struggles in the curriculum application phase, especially in terms of the share of workplace training and its corresponding legal definition. Ameliorating this would require an improvement in all features of workplace training regulation. The strengths of the Korean system are its average cost sharing subdimension and high provision of classroom equipment by firms. However, South Korea scores below average on employers’ teacher provision and examination.
The curriculum feedback phase scores for both information gathering and update timing subdimension are well below average.
Score Rank KOF EELI 2.87 17/20 Curriculum Design Phase 3.53 13/20 Curriculum Application Phase 2.59 16/20 Curriculum Feedback Phase 2.08 16/20
01234567
QualificationStandards
Examination Form
InvolvementQuality
Learning Place
WorkplaceRegulation
Cost SharingEquipmentProvision
Teacher Provision
Examination
InformationGathering
Update Timing
Top Average KRSubdimensions
Design Phase Application Phase Feedback Phase
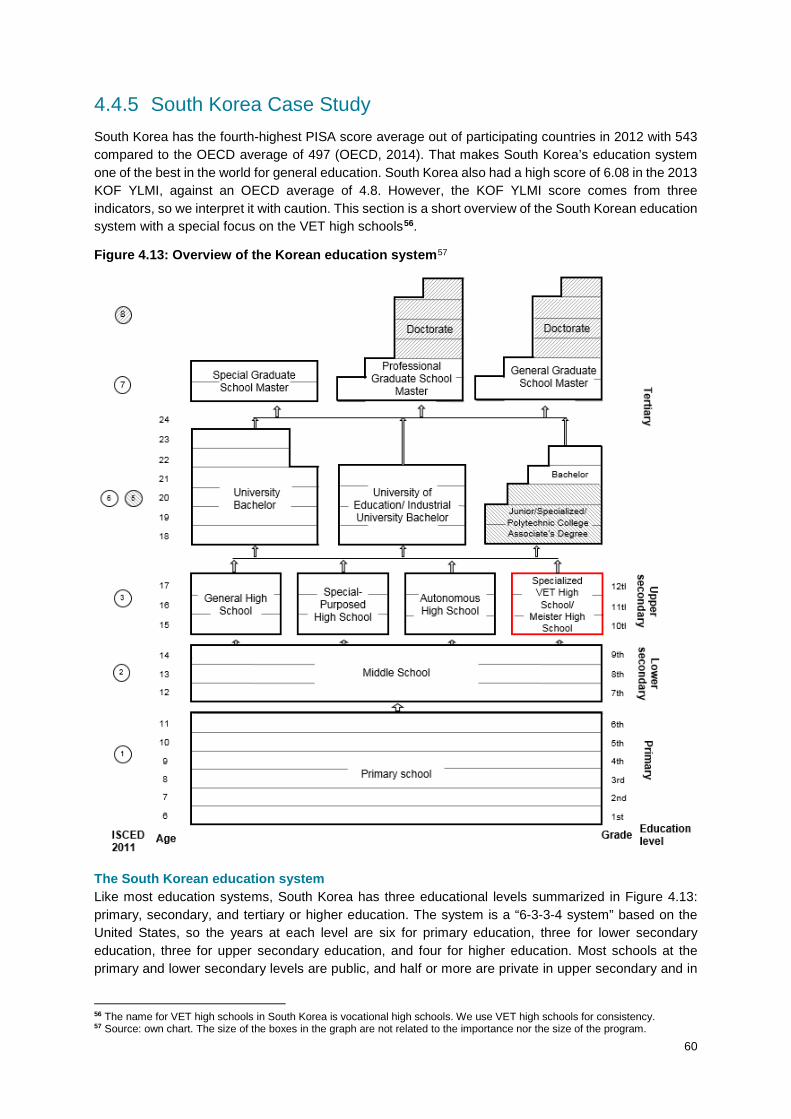
60
4.4.5 South Korea Case Study South Korea has the fourth-highest PISA score average out of participating countries in 2012 with 543 compared to the OECD average of 497 (OECD, 2014). That makes South Korea’s education system one of the best in the world for general education. South Korea also had a high score of 6.08 in the 2013 KOF YLMI, against an OECD average of 4.8. However, the KOF YLMI score comes from three indicators, so we interpret it with caution. This section is a short overview of the South Korean education system with a special focus on the VET high schools56.
Figure 4.13: Overview of the Korean education system57
The South Korean education system Like most education systems, South Korea has three educational levels summarized in Figure 4.13: primary, secondary, and tertiary or higher education. The system is a “6-3-3-4 system” based on the United States, so the years at each level are six for primary education, three for lower secondary education, three for upper secondary education, and four for higher education. Most schools at the primary and lower secondary levels are public, and half or more are private in upper secondary and in
56 The name for VET high schools in South Korea is vocational high schools. We use VET high schools for consistency. 57 Source: own chart. The size of the boxes in the graph are not related to the importance nor the size of the program.
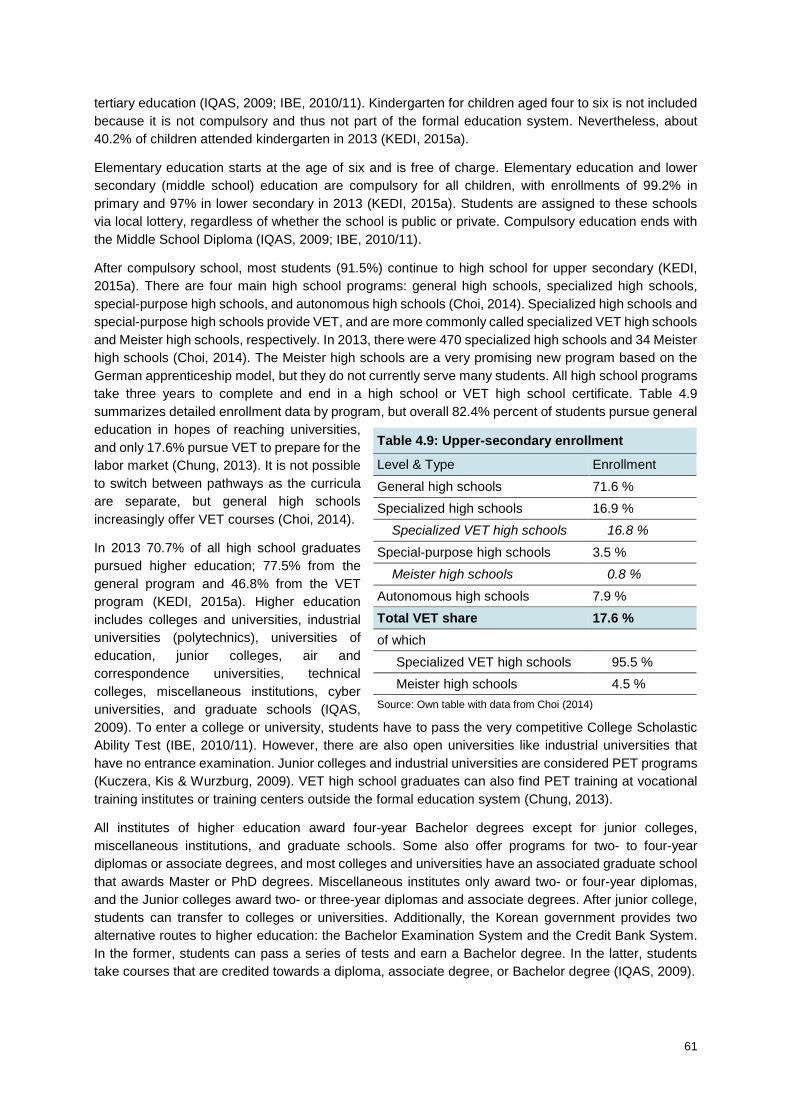
61
tertiary education (IQAS, 2009; IBE, 2010/11). Kindergarten for children aged four to six is not included because it is not compulsory and thus not part of the formal education system. Nevertheless, about 40.2% of children attended kindergarten in 2013 (KEDI, 2015a).
Elementary education starts at the age of six and is free of charge. Elementary education and lower secondary (middle school) education are compulsory for all children, with enrollments of 99.2% in primary and 97% in lower secondary in 2013 (KEDI, 2015a). Students are assigned to these schools via local lottery, regardless of whether the school is public or private. Compulsory education ends with the Middle School Diploma (IQAS, 2009; IBE, 2010/11).
After compulsory school, most students (91.5%) continue to high school for upper secondary (KEDI, 2015a). There are four main high school programs: general high schools, specialized high schools, special-purpose high schools, and autonomous high schools (Choi, 2014). Specialized high schools and special-purpose high schools provide VET, and are more commonly called specialized VET high schools and Meister high schools, respectively. In 2013, there were 470 specialized high schools and 34 Meister high schools (Choi, 2014). The Meister high schools are a very promising new program based on the German apprenticeship model, but they do not currently serve many students. All high school programs take three years to complete and end in a high school or VET high school certificate. Table 4.9 summarizes detailed enrollment data by program, but overall 82.4% percent of students pursue general education in hopes of reaching universities, and only 17.6% pursue VET to prepare for the labor market (Chung, 2013). It is not possible to switch between pathways as the curricula are separate, but general high schools increasingly offer VET courses (Choi, 2014).
In 2013 70.7% of all high school graduates pursued higher education; 77.5% from the general program and 46.8% from the VET program (KEDI, 2015a). Higher education includes colleges and universities, industrial universities (polytechnics), universities of education, junior colleges, air and correspondence universities, technical colleges, miscellaneous institutions, cyber universities, and graduate schools (IQAS, 2009). To enter a college or university, students have to pass the very competitive College Scholastic Ability Test (IBE, 2010/11). However, there are also open universities like industrial universities that have no entrance examination. Junior colleges and industrial universities are considered PET programs (Kuczera, Kis & Wurzburg, 2009). VET high school graduates can also find PET training at vocational training institutes or training centers outside the formal education system (Chung, 2013).
All institutes of higher education award four-year Bachelor degrees except for junior colleges, miscellaneous institutions, and graduate schools. Some also offer programs for two- to four-year diplomas or associate degrees, and most colleges and universities have an associated graduate school that awards Master or PhD degrees. Miscellaneous institutes only award two- or four-year diplomas, and the Junior colleges award two- or three-year diplomas and associate degrees. After junior college, students can transfer to colleges or universities. Additionally, the Korean government provides two alternative routes to higher education: the Bachelor Examination System and the Credit Bank System. In the former, students can pass a series of tests and earn a Bachelor degree. In the latter, students take courses that are credited towards a diploma, associate degree, or Bachelor degree (IQAS, 2009).
Table 4.9: Upper-secondary enrollment
Level & Type Enrollment General high schools 71.6 % Specialized high schools 16.9 % Specialized VET high schools 16.8 %
Special-purpose high schools 3.5 % Meister high schools 0.8 %
Autonomous high schools 7.9 % Total VET share 17.6 % of which
Specialized VET high schools 95.5 % Meister high schools 4.5 %
Source: Own table with data from Choi (2014)

62
Focus program: VET High Schools In this section, we focus on VET high schools, which are the program measured by the KOF EELI. Middle school graduates are free to apply to any VET high school. Admission is based on middle school records, a series of tests, and an interview (Heo, 2014). VET high schools are categorized by sector: agricultural biotechnology, industry, commerce information, fishery and marine, and vocational home economics (Choi, 2014). Students specialize in a major within their particular VET high school. The most popular specialization is industrial arts and engineering (45.9%) followed by social science (19.9%), liberal arts (14.3%), and arts and sports (11.1%; Chung, 2013). Other less popular majors are natural science, medicine, and education.
The aim of specialized high schools is stated in Article 91 of the Enforcement Decree of the Elementary and Secondary Education Act as: “provide experience-centered education aiming at training talents in a special field intended for students who are similar in temperament, aptitude, and abilities” (found in Heo, 2014, p. 65). Students are trained to become craftsmen and skilled workers, and completion qualifies them for higher education, the labor market, or the military (IQAS, 2009). VET is important to the South Korean labor market as it struggles with high unemployment among young college graduates due to imbalanced skills supply and demand. The previous government promoted entering the labor market after high school with the “employment first, university later” policy (Park et al., 2014). To motivate VET high school graduates to get a job first and then continue with education, the government has introduced special admission procedures for higher education, like that VET high school graduates coming from the labor market do not need to pass the CSAT (Chung, 2013).
Educational finance of the VET pathway The Metropolitan and Provincial Offices of Education (MPOE) are responsible for the operation of VET high schools and thus for their funding. However, depending on their individual industry sectors, schools might receive further support from government ministries, local autonomous governments, or industrial groups. Schools supported by government ministries had a budget of approximately $160,000 USD in 2013, and high schools supported by local autonomous governments were directly provided with a budget for facilities, equipment, and teacher wages (Heo, 2014). Public funding comes from tax revenues, and private funding from industrial groups and students’ parents through tuition fees (KEDI, 2015b).
The schools supported by industrial groups are mostly Meister high schools, who also receive $2.5 million USD in public funding to establish the school within a year. Thereafter, the MPOE, the local governments and the industrial groups provide the funding. The MOE supports them by paying between $900,000 USD and $1.1 million USD for industry-customized curriculum development (Chung, 2013).
Key actors in the VET pathway: South Korea
The Korean VET pathway involves up to four actors depending on the program. Responsibility is mostly in the hands of the Metropolitan and Provincial Offices of Education and the Ministry of Education (Park et al., 2014). For Meister high schools, industrial groups play a role as does KRIVET (Chung, 2013).
Ministry of Education (MOE)
The MOE is the ministry at the central government responsible for VET policy as part of secondary education (Park et al., 2014). The MOE “plans and coordinates national education policies, formulates school curricula [also for VET high schools], publishes and approves school textbooks, provides administrative and financial support for all levels of schools, supervises and supports provincial and local educational authorities and operates the teacher training system” (IQAS, 2009, p. 12). If schools offer specific training for industries that are governed by other ministries like the Ministry of National Defense or the Ministry of Knowledge Economy, then these ministries might get involved in supporting those schools. This is especially true for Meister high schools (Huh & Kim, 2013 found in Park et al., 2014).
63
Metropolitan and Provincial Offices of Education (MPOEs)
The MPOEs are the leading actors in VET at the upper secondary level (Park et al., 2014). This has been the case since the decentralization of educational administration in 1991 following the Local Autonomy Law (KEDI, 2015b). The MPOEs are responsible for the establishment of schools, the organization and operation of school curricula, the placement of teachers, and most school funding (Park et al., 2014).
Research institutions
The think tank “Korean Educational Development Institute” (KEDI), the educational research center “Korea Institute of Curriculum and Evaluation” (KICE) and the national research institute “Korea Research Institute for Vocational Education and Training” (KRIVET) support the VET actors in policy development and implementation by collecting information and data on the VET pathway. The establishment of KRIVET is mandated by the Vocational Education and Training Promotion Act (1997; IQAS, 2009).
Industry partners
Industry partners are not involved in VET high schools, although the government has been encouraging them to participate (Park et al., 2014). They do take part in the school management of Meister high schools and are involved in developing their curriculum. In addition, they provide school principals and teachers for those schools (KEDI, 2015b).
CVC processes This section describes South Korea’s VET processes in the VET high school program.
Curriculum design phase: In the curriculum design phase, actors decide on the curriculum content and standards. VET high school curriculum design starts with the school’s establishment when its specialization is decided. For this decision the school body considers the local industry and its demands; the structure of manpower; the status of current departments, teachers, and school facilities; and national and regional industrial development plans (Heo, 2014). Only after that process does the school decide on the programs it wants to offer and build the responsible departments.
Individual departments create their own curricula based on the MOE’s central framework, called the “Elementary and Secondary School Curriculum,” and the MPOE’s “Guidelines for Organization/Operation of Secondary Education Curriculum” (Choi, 2014; Heo, 2014). The general content includes regular subjects like Korean language, mathematics, or English, and the VET content has some compulsory courses but mostly depends on the specialization of the school and the student’s major (Choi, 2014; Heo, 2014; IQAS, 2009). Schools are relatively free to create the VET part of the curricula, mostly according to local industry demands (Kuczera, Kis & Wurzburg, 2009).
Officially, industrial groups and employers are not involved in curriculum design, but they might influence content through negotiations with the VET high schools (Kuczera, Kis & Wurzburg, 2009). When designing curricula, the VET high schools try to identify the demand for knowledge, technology, and employees on the labor market and shape the curriculum according to industry needs using the DACUM Occupational Analysis (Heo, 2014). Each VET high school has a supervisory “operation committee of the school curriculum” consisting of teaching staff, curriculum experts, parents of students, and sometimes industry partners (Heo, 2014).
Curriculum application phase The curriculum application phase is about when, where, how, and in what conditions students actually learn the contents of the curriculum. Overall, VET high school education takes place at school, though a few VET high schools offer some field training in the sixth semester (Heo, 2014). To support students in their career planning, the government placed 1,000 VET guidance experts and 4,500 VET and career

64
counseling teachers in VET high schools (Chung, 2013). Their task is to orient students to their possible options, mentor support projects, and establish follow-up services for graduates.
“Teacher” is an umbrella term for anyone who works with students or at schools, including principals and counselors (Choi, 2014).Teacher training for secondary education takes place at national and private teacher colleges, comprehensive universities, graduate schools of education, and the department of education (KEDI, 2015b). Teacher candidates have to take the “Teacher Certification Examination” to become licensed before they can teach, creating fierce selection of candidates and high social status—and compensation—for teachers (KEDI, 2015b). VET high schools employ teachers for regular subjects and teachers for VET subjects (Choi, 2014). To become a VET teacher at a high school, candidates have to pass many stringent tests, but almost no evaluation of their knowledge of industry (Jang et al., 2014 found in Choi, 2014). To remedy the potential lack of knowledge, VET high schools temporarily employ experienced workers (Choi, 2014).
The MOE grants VET high school graduation degrees to students. However, as the curricula are not standardized and there is no strong quality assurance in place, employers’ confidence into the degrees is rather low. There are national training qualifications (NTQ), which are supervised by the Ministry of Employment and Labor, but the VET curricula are not coordinated with them. (Kuczera, Kis & Wurzburg, 2009; Choi, 2014)
Curriculum feedback phase This phase is about evaluating education outcomes and feeding the information back into the system. The research institutions collect and analyze labor market data. There is no formal process for VET high school curriculum updating since it is all done in-school. Employers officially play no role in the updating process.
KOF EELI discussion South Korea, like the other Asian countries selected for this study due to their high PISA scores, falls near the bottom of the KOF EELI with an overall score of 2.9. We remind readers that South Korea also has the lowest response rate of our focus countries due primarily to the language barrier, so specific numbers should be taken as suggestions and not clear measurements.
In the design phase, South Korea finds its highest feature-level scores on the quality of employer involvement. Although employers’ role is almost negligible, it is formalized in law. However, the rest of the design phase is very poor because employers have almost no official role in deciding the curriculum for VET. Curriculum design is all school-level and fully internal to the education system, so employers cannot participate. The information and resource asymmetries that come with school-based VET are present in full force, minimizing linkage and limiting the ability of VET to help students on the labor market. If South Korea moves towards a centralized curriculum based on the NQF or one that is created at the school level but in collaboration with industry like the Meister high schools do, they might be able to improve linkage in this dimension. Overall, it will take major change.
Workplace training is almost nonexistent in VET high schools, so South Korea’s score in the application phase is also very low. Even when workplace training does exist for a few students in a few schools and lasting a short period of time, the features of legal framework surrounding workplace learning show that the process is again largely informal and unregulated. It is primarily built on teachers’ personal relationships with industry actors rather than any systematic cooperation between education and employment. South Korea’s employers do share some costs and provide equipment for use in the classroom, so it is not hard to imagine they might welcome additional roles and responsibilities in workplace training, cost-sharing, and examination of VET students.
South Korea’s scores in features for information gathering and update timing are both low. Although research institutions gather information, they rarely share their findings with the teachers who are responsible for curriculum. Update timing is even more problematic, because employers cannot possibly
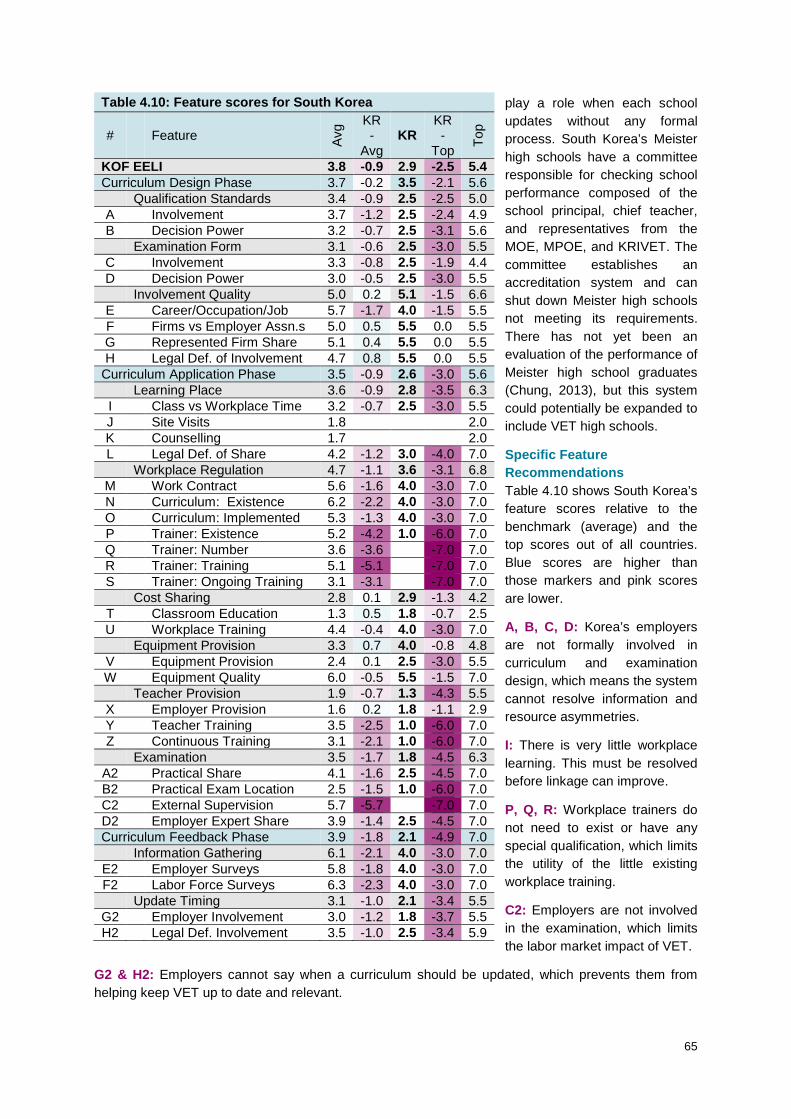
65
play a role when each school updates without any formal process. South Korea’s Meister high schools have a committee responsible for checking school performance composed of the school principal, chief teacher, and representatives from the MOE, MPOE, and KRIVET. The committee establishes an accreditation system and can shut down Meister high schools not meeting its requirements. There has not yet been an evaluation of the performance of Meister high school graduates (Chung, 2013), but this system could potentially be expanded to include VET high schools.
Specific Feature Recommendations Table 4.10 shows South Korea’s feature scores relative to the benchmark (average) and the top scores out of all countries. Blue scores are higher than those markers and pink scores are lower.
A, B, C, D: Korea’s employers are not formally involved in curriculum and examination design, which means the system cannot resolve information and resource asymmetries.
I: There is very little workplace learning. This must be resolved before linkage can improve.
P, Q, R: Workplace trainers do not need to exist or have any special qualification, which limits the utility of the little existing workplace training.
C2: Employers are not involved in the examination, which limits the labor market impact of VET.
G2 & H2: Employers cannot say when a curriculum should be updated, which prevents them from helping keep VET up to date and relevant.
Table 4.10: Feature scores for South Korea
# Feature Avg KR
-Avg
KR KR -
Top Top
KOF EELI 3.8 -0.9 2.9 -2.5 5.4 Curriculum Design Phase 3.7 -0.2 3.5 -2.1 5.6 Qualification Standards 3.4 -0.9 2.5 -2.5 5.0 A Involvement 3.7 -1.2 2.5 -2.4 4.9 B Decision Power 3.2 -0.7 2.5 -3.1 5.6 Examination Form 3.1 -0.6 2.5 -3.0 5.5 C Involvement 3.3 -0.8 2.5 -1.9 4.4 D Decision Power 3.0 -0.5 2.5 -3.0 5.5 Involvement Quality 5.0 0.2 5.1 -1.5 6.6 E Career/Occupation/Job 5.7 -1.7 4.0 -1.5 5.5 F Firms vs Employer Assn.s 5.0 0.5 5.5 0.0 5.5 G Represented Firm Share 5.1 0.4 5.5 0.0 5.5 H Legal Def. of Involvement 4.7 0.8 5.5 0.0 5.5
Curriculum Application Phase 3.5 -0.9 2.6 -3.0 5.6 Learning Place 3.6 -0.9 2.8 -3.5 6.3 I Class vs Workplace Time 3.2 -0.7 2.5 -3.0 5.5 J Site Visits 1.8 2.0 K Counselling 1.7 2.0 L Legal Def. of Share 4.2 -1.2 3.0 -4.0 7.0 Workplace Regulation 4.7 -1.1 3.6 -3.1 6.8 M Work Contract 5.6 -1.6 4.0 -3.0 7.0 N Curriculum: Existence 6.2 -2.2 4.0 -3.0 7.0 O Curriculum: Implemented 5.3 -1.3 4.0 -3.0 7.0 P Trainer: Existence 5.2 -4.2 1.0 -6.0 7.0 Q Trainer: Number 3.6 -3.6 -7.0 7.0 R Trainer: Training 5.1 -5.1 -7.0 7.0 S Trainer: Ongoing Training 3.1 -3.1 -7.0 7.0 Cost Sharing 2.8 0.1 2.9 -1.3 4.2 T Classroom Education 1.3 0.5 1.8 -0.7 2.5 U Workplace Training 4.4 -0.4 4.0 -3.0 7.0 Equipment Provision 3.3 0.7 4.0 -0.8 4.8 V Equipment Provision 2.4 0.1 2.5 -3.0 5.5 W Equipment Quality 6.0 -0.5 5.5 -1.5 7.0 Teacher Provision 1.9 -0.7 1.3 -4.3 5.5 X Employer Provision 1.6 0.2 1.8 -1.1 2.9 Y Teacher Training 3.5 -2.5 1.0 -6.0 7.0 Z Continuous Training 3.1 -2.1 1.0 -6.0 7.0 Examination 3.5 -1.7 1.8 -4.5 6.3
A2 Practical Share 4.1 -1.6 2.5 -4.5 7.0 B2 Practical Exam Location 2.5 -1.5 1.0 -6.0 7.0 C2 External Supervision 5.7 -5.7 -7.0 7.0 D2 Employer Expert Share 3.9 -1.4 2.5 -4.5 7.0 Curriculum Feedback Phase 3.9 -1.8 2.1 -4.9 7.0 Information Gathering 6.1 -2.1 4.0 -3.0 7.0
E2 Employer Surveys 5.8 -1.8 4.0 -3.0 7.0 F2 Labor Force Surveys 6.3 -2.3 4.0 -3.0 7.0 Update Timing 3.1 -1.0 2.1 -3.4 5.5
G2 Employer Involvement 3.0 -1.2 1.8 -3.7 5.5 H2 Legal Def. Involvement 3.5 -1.0 2.5 -3.4 5.9
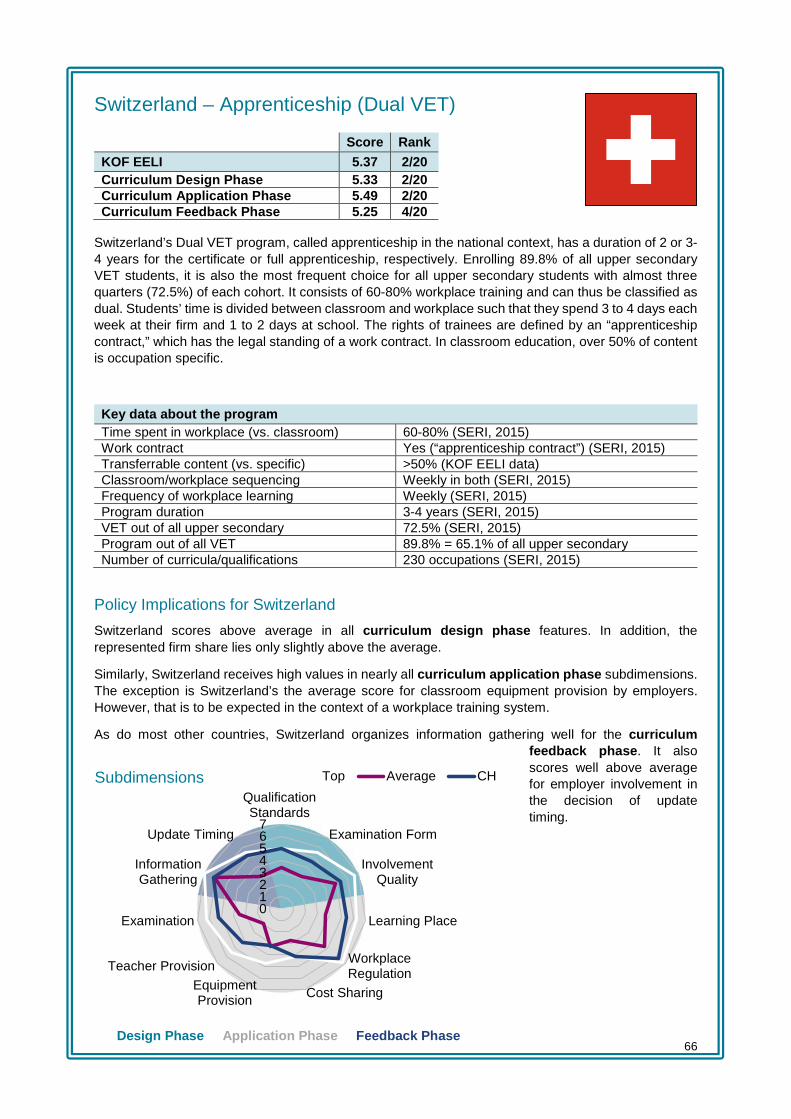
66
Switzerland – Apprenticeship (Dual VET)
Switzerland’s Dual VET program, called apprenticeship in the national context, has a duration of 2 or 3-4 years for the certificate or full apprenticeship, respectively. Enrolling 89.8% of all upper secondary VET students, it is also the most frequent choice for all upper secondary students with almost three quarters (72.5%) of each cohort. It consists of 60-80% workplace training and can thus be classified as dual. Students’ time is divided between classroom and workplace such that they spend 3 to 4 days each week at their firm and 1 to 2 days at school. The rights of trainees are defined by an “apprenticeship contract,” which has the legal standing of a work contract. In classroom education, over 50% of content is occupation specific.
Key data about the program Time spent in workplace (vs. classroom) 60-80% (SERI, 2015) Work contract Yes (“apprenticeship contract”) (SERI, 2015) Transferrable content (vs. specific) >50% (KOF EELI data) Classroom/workplace sequencing Weekly in both (SERI, 2015) Frequency of workplace learning Weekly (SERI, 2015) Program duration 3-4 years (SERI, 2015) VET out of all upper secondary 72.5% (SERI, 2015) Program out of all VET 89.8% = 65.1% of all upper secondary Number of curricula/qualifications 230 occupations (SERI, 2015)
Policy Implications for Switzerland Switzerland scores above average in all curriculum design phase features. In addition, the represented firm share lies only slightly above the average.
Similarly, Switzerland receives high values in nearly all curriculum application phase subdimensions. The exception is Switzerland’s the average score for classroom equipment provision by employers. However, that is to be expected in the context of a workplace training system.
As do most other countries, Switzerland organizes information gathering well for the curriculum feedback phase. It also scores well above average for employer involvement in the decision of update timing.
Score Rank KOF EELI 5.37 2/20 Curriculum Design Phase 5.33 2/20 Curriculum Application Phase 5.49 2/20 Curriculum Feedback Phase 5.25 4/20
01234567
QualificationStandards
Examination Form
InvolvementQuality
Learning Place
WorkplaceRegulation
Cost SharingEquipmentProvision
Teacher Provision
Examination
InformationGathering
Update Timing
Top Average CHSubdimensions
Design Phase Application Phase Feedback Phase
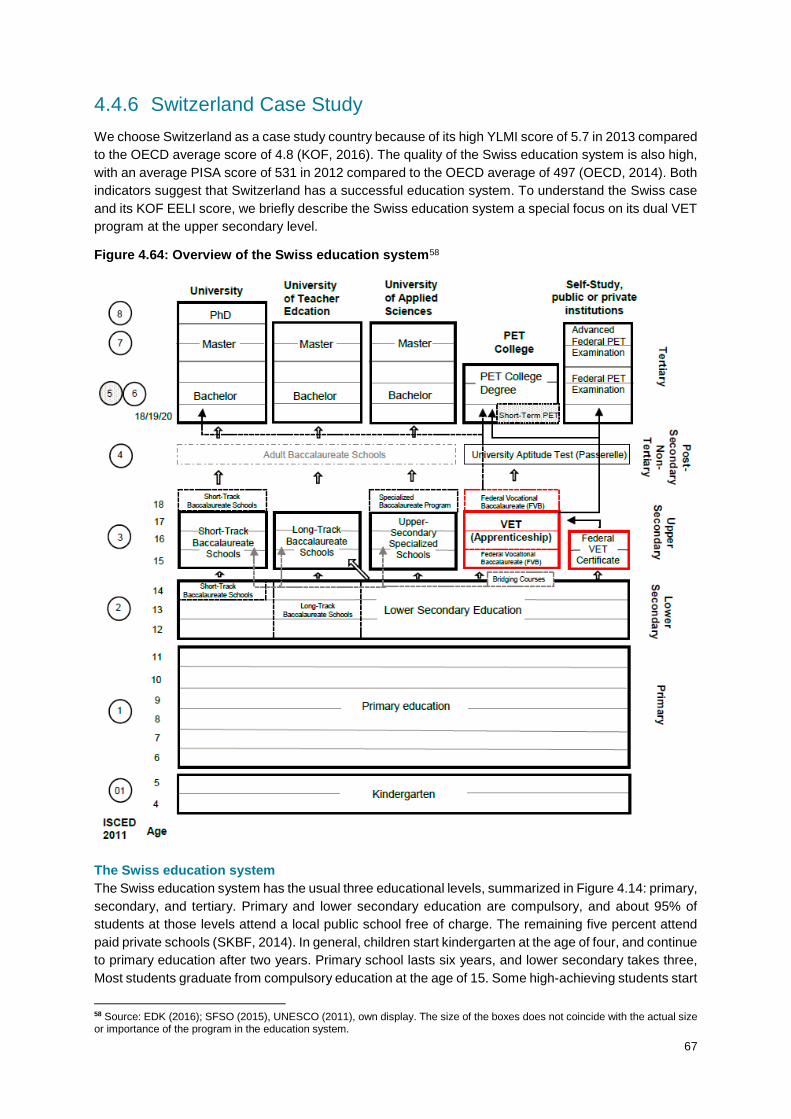
67
4.4.6 Switzerland Case Study We choose Switzerland as a case study country because of its high YLMI score of 5.7 in 2013 compared to the OECD average score of 4.8 (KOF, 2016). The quality of the Swiss education system is also high, with an average PISA score of 531 in 2012 compared to the OECD average of 497 (OECD, 2014). Both indicators suggest that Switzerland has a successful education system. To understand the Swiss case and its KOF EELI score, we briefly describe the Swiss education system a special focus on its dual VET program at the upper secondary level.
Figure 4.64: Overview of the Swiss education system58
The Swiss education system The Swiss education system has the usual three educational levels, summarized in Figure 4.14: primary, secondary, and tertiary. Primary and lower secondary education are compulsory, and about 95% of students at those levels attend a local public school free of charge. The remaining five percent attend paid private schools (SKBF, 2014). In general, children start kindergarten at the age of four, and continue to primary education after two years. Primary school lasts six years, and lower secondary takes three, Most students graduate from compulsory education at the age of 15. Some high-achieving students start
58 Source: EDK (2016); SFSO (2015), UNESCO (2011), own display. The size of the boxes does not coincide with the actual size or importance of the program in the education system.

68
the baccalaureate early during lower secondary education, then take six years to complete that degree. For students who start after lower secondary, the baccalaureate takes only four years. In 2012, 72.3% of students started upper secondary education directly after lower secondary, and 12.8% use transitional options like a 10th school year or preparatory courses before proceeding (SERI, 2015).
At the upper secondary level (summarized in Table 4.11), students have the choice between the general education and VET pathways, which are both free of charge. In the 2012 cohort, 17.5% of young people completed general education and 72.5% got a VET qualification. Overall, 95% of Swiss young people complete at least upper secondary education (SERI, 2015). General education students can choose between one of the six baccalaureate (Gymnasium) majors and one of the seven specialized baccalaureate (Fachmaturität) majors (SKBF, 2014). The baccalaureate takes four years to complete and the specialized baccalaureate takes four years. All general graduates can proceed directly to higher education and indirectly to PET colleges by fulfilling additional requirements.
Students who choose the VET pathway have the choice between two-year VET programs that lead to the federal VET certificate, three- to four-year VET programs leading to the federal VET diploma, and finally the option to top-up the federal VET diploma with an additional federal vocational baccalaureate. The federal VET certificate is for academically weaker students. The majority of students choose the federal VET diploma, and a few of those combine their studies for the federal VET diploma with the federal vocational baccalaureate (SERI, 2015). These VET programs are offered as dual or school-based depending on the
region. In dual VET, students split their time between a VET school for classroom instruction and a host firm for workplace training. In school-based VET, students are only in the VET school. Dual VET is the prevalent system, though school-based VET is popular in the French- and Italian-speaking regions. With a federal VET diploma, students can continue with PET or enter the labor market. The federal vocational baccalaureate grants access to the universities of applied sciences (UAS). The transition into higher education programs, like universities, is indirect through the university aptitude test (SERI, 2015)
On the tertiary level, Switzerland has ten universities, two federal institutes of technology, 17 universities of teacher education, nine UAS, and various PET schools. In PET, students study for one of the 400 (advanced) federal PET diploma or one of the 57 PET college degrees (SERI, 2015). These study programs focus on teaching students the necessary competences for handling challenging tasks in a given profession. According to EDK (2015) roughly 45% of the adult population in Switzerland has a tertiary education, of which 30% is from a university and 15% is from PET.
Focus program: Dual VET (Apprenticeship) About two thirds of all upper secondary students start a VET program (SERI, 2015), well above the OECD average of 46% (OECD, 2015). To enter the dual VET program, students start by choosing one of the 230 curricula. As most students have had little contact with the 230 occupations offered under this program, compulsory school reserves time to inform them during class. In addition, students can go to neutral career guidance centers to learn about the options. After they decide, they can apply for an apprenticeship position through the apprenticeship market. Firms advertise their open positions and students apply by sending applications to the firms. After job interviews, firms are free to decide on the most suitable candidates for their positions. There are no special entry requirements for any curriculum. When students accept positions, they sign an apprenticeship contract with firm and their parents. Of all Swiss firms large enough to train apprentices, about 40% do so (SERI, 2015).
The dual VET program takes two to four years to complete, depending on the degree and curriculum. The most common arrangement for apprentices is to study and work part-time: they attend VET school
Table 4.11: Upper secondary enrollment
Level & Type Enrollment
General education 27.5%
Total VET share 72.5 %
of which
Dual VET 89.8%
School-based VET 10.2%
Source: Own table, data of 2014 SERI (2015)
69
one or two days a week to learn theoretical and general knowledge along with technical, methodological, and social skills; on the other three or four days, apprentices work at their host firm to learn practical know-how, knowledge, and skills. From time to time, students attend intercompany courses that complement the school and workplace parts of the curriculum with essential curriculum-wide practical skills. These industry-specific courses are offered by training centers run by the respective industry (association). The training content of each learning place is coordinated through curriculum-specific VET ordinances. (SERI, 2015)
At the end of apprenticeship training, apprentices hold a dual degree that allows them entry into tertiary education and the labor market. Thanks to the vocational and professional education and training act (VPETA) and the curriculum-specific ordinances, VET and PET degrees are recognized nationwide.
Key actors in the VET pathway: Switzerland
In Switzerland, three partners are responsible for managing and guiding the VET pathway: the Confederation, the cantons, and the professional organizations. In this box we summarize the responsibilities and institutions of each partner as stated by SERI (2015).
Confederation
The Confederation of Switzerland is responsible for the strategic management and development of the VET pathway. It develops and promotes the VET pathway and assures its quality. The Confederation recognizes VET programs and enacts each curriculum-specific VET ordinance, which ensure the comparability and transparency of VET courses across Switzerland and in the National Qualification Framework (NQF).
The two institutions entrusted with these tasks are the State Secretariat for Education, Research and Innovation (SERI) and the Swiss Federal Institute for Vocational Education and Training (SFIVET). SERI regulates and co-funds the VET pathway, and SFIVET educates VET teachers and examiners.
Another institution stipulated by the VPETA (Art. 69/70), is the Federal Commission for VPET (EBBK). This commission consists of no more than 15 representatives from the Confederation, the cantons, the professional organizations, and the academy. It supports the Confederation by giving advice on VPET matters so that VPET continuously develops while staying coordinated (EBBK, 2015).
Cantons
Each canton is responsible for the implementation of the VPET act in its jurisdiction. Furthermore, the cantons issue the permits for host firms so that they can train apprentices, and supervise them along with the VET schools. The cantons also provide vocational, educational, and career guidance centers; train and certify apprenticeship trainers; and help prepare students for VET.
The institutions here are the 26 cantonal VET offices, the vocational, educational, and career guidance services, the VET schools, and the Swiss Conference of Cantonal Ministers of Education (EDK). The cantonal VET offices implement VET regulations and the EDK coordinates and consolidates them. Guidance services provide neutral information and advice to young people and adults alike. VET schools are responsible for classroom instruction in school-based VET, dual VET, and for the federal vocational baccalaureate.
Professional organizations
The professional organizations are responsible for training content and the national qualification procedures for the VET and PET programs. They draft the curriculum-specific VET ordinances, provide apprenticeship positions, offer intercompany courses, and manage VPET funds. They include other relevant organizations, VPET providers, and the host firms. Professional organizations decide on training content and national qualification procedures for VET and PET programs. They support the development of the VPET system, and host firms provide apprenticeship positions.
70
Educational finance of the VET pathway VET pathway funding is regulated by the VPETA, which requires all three partners—the Confederation, the cantons, and the professional organizations—to cover VET expenses. The Swiss VET pathway receives both public and private funding, with the public sector contributing around 40% of total funding since 2000 (CHF 3.4 billion in 2013; SERI, 2015; Egg & Renold, 2016), which the Confederation and cantons split 25%-75%, respectively. The private sector, especially host firms, covers the remaining 60% of funding. Host firms are willing to bear these costs because, according to a cost-benefit study done by Strupler and Wolter (2012), the firms earn a net gain from training apprentices through the apprentices’ productive work and saved recruiting costs. For curricula in which the host firms do not generate a net benefit, professional organizations might establish a VPET fund. In some cases, the Confederation might declare the contribution mandatory for all firms in a curriculum’s sector (SERI, 2015).
Public funding is mainly used to cover the costs of VET schools, and the private funding pays the salaries of the apprentices as well as in-firm training costs like materials and trainers. The salaries of the apprentices are set between the firm and the apprentice but the professional organizations set recommendations for every curriculum (Hoeckel, Field and Grubb, 2009). Apprentices themselves do not provide any funding as the apprenticeships are free of charge.
CVC processes This section describes Switzerland’s VET processes in the dual VET program.
Curriculum design phase In the curriculum design phase, actors decide on the curriculum content and standards. The professional organizations drive the formulation and revision of each curriculum-specific ordinance, which contains the VET framework curricula for each curriculum (Hoeckel, Field & Grubb, 2009). The framework curricula sets qualification standards or “Standards of Excellence,” which VET students need to achieve in order to receive the VET qualification (Egg & Renold, 2015). Development of detailed VET curricula that fit current labor market requirements is done by a commission composed of all three VET partners: members of the professional organizations, the cantonal offices, and SFIVET as a representative of the Confederation (Hoeckel, Field & Grubb, 2009).
Curriculum application phase The curriculum application phase is about when, where, how, and in what conditions students actually learn the contents of the curriculum. The framework curricula are applied in all three learning locations: the VET school, the host firm, and intercompany courses. Usually, students spend three to four days a week at the host firm and one or two days a week at the VET school (SERI, 2015). Intercompany courses are seminars that take a few weeks each year. The curricula are intentionally implemented in different training locations to increase students’ learning success. A syllabus is developed for each learning place based on the framework curriculum, so the syllabi are well coordinated and matched (Egg & Renold, 2015). Examinations are held during and at the end of training at both VET schools and host firms.
VET school teachers at the upper-secondary education level go through extensive training. They must have a tertiary degree, six months of professional experience, and have attended 1800 hours of VET pedagogy preparation. VET supervisors at host firms are also required to acquire a special credential for which they must attend 100 hours of training in pedagogy, VET law, VPET system knowledge, and problem solving methods for adolescents. VET instructors for intercompany courses have to complete 600 hours of pedagogy preparation and there are also special requirement for examiners (Hoeckel, Field & Grubb, 2009).
As students have to decide quite early which career path they would like to follow, there is an extensive career guidance and counselling system in place. Students attend mandatory information sessions at school and must visit of a career guidance center during lower secondary education (Hoeckel, Field & Grubb, 2009). The centers are independent institutions providing unbiased information and counseling

71
about possible career paths to students and adults based on their abilities. The service is free for students.
Curriculum feedback phase This phase is about evaluating education outcomes and feeding the information back into the system. The cantons are responsible for quality control of dual VET. One instrument for quality is the QualiCarte, a checklist of 28 quality criteria (Hoeckel, Field & Grubb, 2009). This instrument is public, so firms can evaluate themselves from time to time and ask for a coach if they need help. Cantons use different quality assurance instruments to check the quality of VET schools, like the EFQM, ISO, or eduQua standards (KOF, 2015). The quality of students is measured during and at the end of the apprenticeship with national examinations developed by external agencies, and these allow employers to hire recent graduates with confidence in their abilities (Egg & Renold, 2015).
The Swiss Coordination Centre for Research in Education monitors the entire VET pathway and publishes a report every four years (Hoeckel, Field & Grubb, 2009). Additionally, there are various instruments assessing the quality of important parts of the VET pathway. In 1997 the apprenticeship market barometer was established to monitor the situation on the apprenticeship market. A similar instrument is the job entry barometer introduced in 2012 to capture the transition smoothness of graduates from education to the labor market (OPET, 2012). To support research in VET, the Confederation finances Leading Houses with different research foci. Furthermore, SFIVET conducts periodical cost-benefit studies for firms.
KOF EELI discussion Switzerland is one of the top scorers in the KOF EELI and the top scorer among focus countries with a large sample of responding experts. Its design phase score is 5.3, which reflects above-average scores for all features. Employers have power in the curriculum and qualification standards design processes, including the power to make decisions. Employers’ roles are also legally defined in the VET laws, and many firms are represented.
In the application phase, Switzerland also scores highly overall. This time, some features have lower scores and might present opportunities for the Swiss system to improve further. Employers do not provide classroom equipment, which is fine in the dual system but might decrease linkage where school-based VET is more common in the French part of Switzerland. In those areas, Switzerland should ensure that students still have access to industry-standard equipment and instruction either through increased dual training or increased contributions from the firms. Otherwise, Switzerland scores exceptionally high for all workplace learning dimensions because of its strong, curriculum-guided system and excellent quality assurance regulation.
Like many other countries, Switzerland’s feedback phase has high scores for the information gathering dimensions. Switzerland is also among the very highest for the features related to the update timing subdimension: employers lead the curriculum updating process and their role is clearly defined and easily accessed. This prevents Switzerland’s VET pathway from becoming obsolete as technology and occupational requirements change over time.
Specific Feature Recommendations Table 4.12 shows Switzerland’s feature scores relative to the benchmark (average) and the top scores from all KOF EELI countries. Because Switzerland is the top performer out of all countries with multiple observations, we do not compare it against any other top performer. Blue scores are higher than the benchmark and pink scores are lower.
A, B, C, D: Switzerland score very high in all of the qualification and examination design features because firms and professional organizations play such a huge role in the system as a whole.
E: Switzerland’s only below-average score is on the career/occupation/job feature, and we suspect this is because some respondents found the question confusing. The case study above clearly illustrates
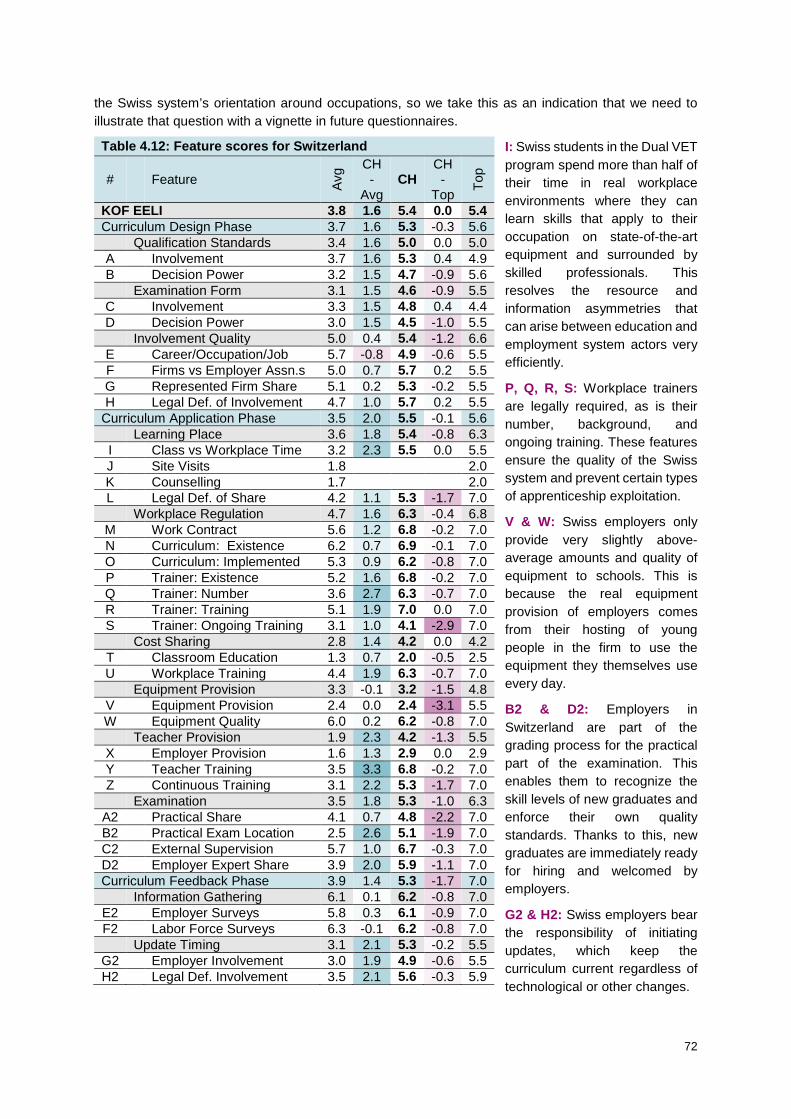
72
the Swiss system’s orientation around occupations, so we take this as an indication that we need to illustrate that question with a vignette in future questionnaires.
I: Swiss students in the Dual VET program spend more than half of their time in real workplace environments where they can learn skills that apply to their occupation on state-of-the-art equipment and surrounded by skilled professionals. This resolves the resource and information asymmetries that can arise between education and employment system actors very efficiently.
P, Q, R, S: Workplace trainers are legally required, as is their number, background, and ongoing training. These features ensure the quality of the Swiss system and prevent certain types of apprenticeship exploitation.
V & W: Swiss employers only provide very slightly above-average amounts and quality of equipment to schools. This is because the real equipment provision of employers comes from their hosting of young people in the firm to use the equipment they themselves use every day.
B2 & D2: Employers in Switzerland are part of the grading process for the practical part of the examination. This enables them to recognize the skill levels of new graduates and enforce their own quality standards. Thanks to this, new graduates are immediately ready for hiring and welcomed by employers.
G2 & H2: Swiss employers bear the responsibility of initiating updates, which keep the curriculum current regardless of technological or other changes.
Table 4.12: Feature scores for Switzerland
# Feature Avg CH
-Avg
CH CH -
Top Top
KOF EELI 3.8 1.6 5.4 0.0 5.4 Curriculum Design Phase 3.7 1.6 5.3 -0.3 5.6 Qualification Standards 3.4 1.6 5.0 0.0 5.0 A Involvement 3.7 1.6 5.3 0.4 4.9 B Decision Power 3.2 1.5 4.7 -0.9 5.6 Examination Form 3.1 1.5 4.6 -0.9 5.5 C Involvement 3.3 1.5 4.8 0.4 4.4 D Decision Power 3.0 1.5 4.5 -1.0 5.5 Involvement Quality 5.0 0.4 5.4 -1.2 6.6 E Career/Occupation/Job 5.7 -0.8 4.9 -0.6 5.5 F Firms vs Employer Assn.s 5.0 0.7 5.7 0.2 5.5 G Represented Firm Share 5.1 0.2 5.3 -0.2 5.5 H Legal Def. of Involvement 4.7 1.0 5.7 0.2 5.5
Curriculum Application Phase 3.5 2.0 5.5 -0.1 5.6 Learning Place 3.6 1.8 5.4 -0.8 6.3 I Class vs Workplace Time 3.2 2.3 5.5 0.0 5.5 J Site Visits 1.8 2.0 K Counselling 1.7 2.0 L Legal Def. of Share 4.2 1.1 5.3 -1.7 7.0 Workplace Regulation 4.7 1.6 6.3 -0.4 6.8 M Work Contract 5.6 1.2 6.8 -0.2 7.0 N Curriculum: Existence 6.2 0.7 6.9 -0.1 7.0 O Curriculum: Implemented 5.3 0.9 6.2 -0.8 7.0 P Trainer: Existence 5.2 1.6 6.8 -0.2 7.0 Q Trainer: Number 3.6 2.7 6.3 -0.7 7.0 R Trainer: Training 5.1 1.9 7.0 0.0 7.0 S Trainer: Ongoing Training 3.1 1.0 4.1 -2.9 7.0 Cost Sharing 2.8 1.4 4.2 0.0 4.2 T Classroom Education 1.3 0.7 2.0 -0.5 2.5 U Workplace Training 4.4 1.9 6.3 -0.7 7.0 Equipment Provision 3.3 -0.1 3.2 -1.5 4.8 V Equipment Provision 2.4 0.0 2.4 -3.1 5.5 W Equipment Quality 6.0 0.2 6.2 -0.8 7.0 Teacher Provision 1.9 2.3 4.2 -1.3 5.5 X Employer Provision 1.6 1.3 2.9 0.0 2.9 Y Teacher Training 3.5 3.3 6.8 -0.2 7.0 Z Continuous Training 3.1 2.2 5.3 -1.7 7.0 Examination 3.5 1.8 5.3 -1.0 6.3
A2 Practical Share 4.1 0.7 4.8 -2.2 7.0 B2 Practical Exam Location 2.5 2.6 5.1 -1.9 7.0 C2 External Supervision 5.7 1.0 6.7 -0.3 7.0 D2 Employer Expert Share 3.9 2.0 5.9 -1.1 7.0 Curriculum Feedback Phase 3.9 1.4 5.3 -1.7 7.0 Information Gathering 6.1 0.1 6.2 -0.8 7.0
E2 Employer Surveys 5.8 0.3 6.1 -0.9 7.0 F2 Labor Force Surveys 6.3 -0.1 6.2 -0.8 7.0 Update Timing 3.1 2.1 5.3 -0.2 5.5
G2 Employer Involvement 3.0 1.9 4.9 -0.6 5.5 H2 Legal Def. Involvement 3.5 2.1 5.6 -0.3 5.9
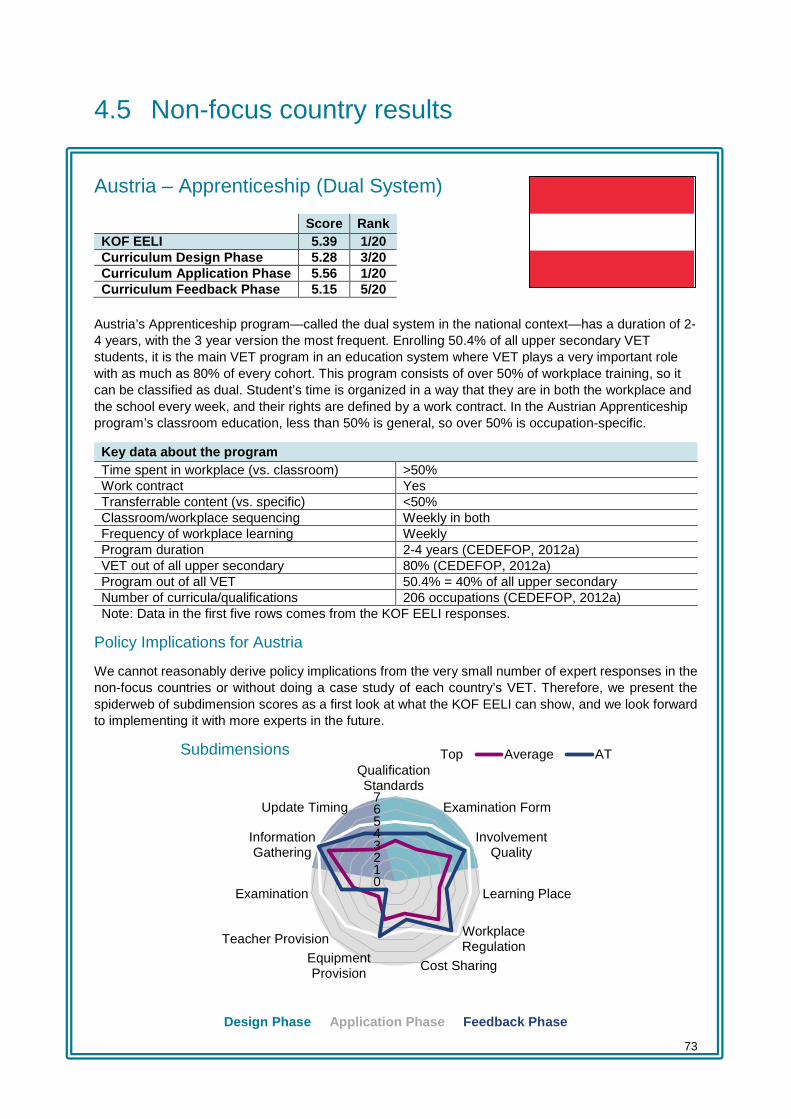
73
01234567
QualificationStandards
Examination Form
InvolvementQuality
Learning Place
WorkplaceRegulation
Cost SharingEquipmentProvision
Teacher Provision
Examination
InformationGathering
Update Timing
Top Average AT
4.5 Non-focus country results Austria – Apprenticeship (Dual System)
Austria’s Apprenticeship program—called the dual system in the national context—has a duration of 2-4 years, with the 3 year version the most frequent. Enrolling 50.4% of all upper secondary VET students, it is the main VET program in an education system where VET plays a very important role with as much as 80% of every cohort. This program consists of over 50% of workplace training, so it can be classified as dual. Student’s time is organized in a way that they are in both the workplace and the school every week, and their rights are defined by a work contract. In the Austrian Apprenticeship program’s classroom education, less than 50% is general, so over 50% is occupation-specific.
Key data about the program Time spent in workplace (vs. classroom) >50% Work contract Yes Transferrable content (vs. specific) <50% Classroom/workplace sequencing Weekly in both Frequency of workplace learning Weekly Program duration 2-4 years (CEDEFOP, 2012a) VET out of all upper secondary 80% (CEDEFOP, 2012a) Program out of all VET 50.4% = 40% of all upper secondary Number of curricula/qualifications 206 occupations (CEDEFOP, 2012a)
Note: Data in the first five rows comes from the KOF EELI responses.
Policy Implications for Austria
We cannot reasonably derive policy implications from the very small number of expert responses in the non-focus countries or without doing a case study of each country’s VET. Therefore, we present the spiderweb of subdimension scores as a first look at what the KOF EELI can show, and we look forward to implementing it with more experts in the future.
Score Rank KOF EELI 5.39 1/20 Curriculum Design Phase 5.28 3/20 Curriculum Application Phase 5.56 1/20 Curriculum Feedback Phase 5.15 5/20
Subdimensions
Design Phase Application Phase Feedback Phase

74
Canada – VET at Secondary Schools
The VET programs offered at Canadian Secondary Schools are probably the most diverse program we consider as a single program. Canada is a strongly federalized country where educational authority is located at the province or territory level and not at the federal level. In addition, Canadian provinces and territories often do not officially differentiate between VET programs and general education programs at the upper secondary education level. Programs with a VET character can be taught either in secondary schools offering both VET and general education or in dedicated VET centers. There are many local or unique programs that last 4-6 years and lead to very different kinds of diplomas, and with no other form of VET at the upper secondary level they represent 100% of all VET students. Owing to this diversity, it was also impossible to find any experts who felt able to respond the EELI survey without unmanageable effort. Due to this fundamental feasibility issue, we cannot present any KOF EELI results.
Key data about the program Time spent in workplace (vs. classroom) - Work contract - Transferrable content (vs. specific) - Classroom/workplace sequencing - Frequency of workplace learning - Program duration 4-6 years (CMEC, 2008) VET out of all upper secondary Unknown Program out of all VET 100% (CMEC, 2008) Number of curricula/qualifications Unknown
Note: Data in the first five rows comes from the KOF EELI responses.
Policy Implications for Canada
No expert was able to respond for the Canadian system, even at individual province levels. Canadian KOF EELI scores may only be feasible by surveying experts at the local or even school levels.
Score Rank* KOF EELI 0.00 19/20* Curriculum Design Phase 0.00 19/20* Curriculum Application Phase 0.00 19/20* Curriculum Feedback Phase 0.00 19/20* *Lithuania and Canada tie because both have no scores.
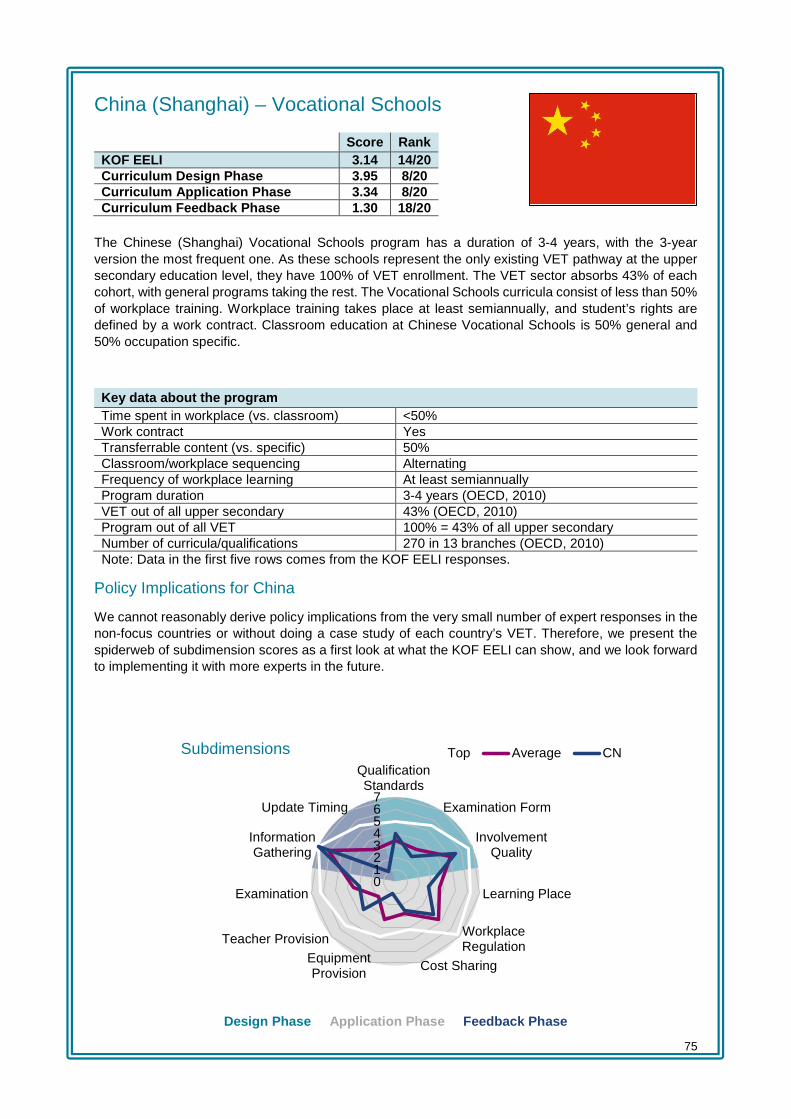
75
China (Shanghai) – Vocational Schools
The Chinese (Shanghai) Vocational Schools program has a duration of 3-4 years, with the 3-year version the most frequent one. As these schools represent the only existing VET pathway at the upper secondary education level, they have 100% of VET enrollment. The VET sector absorbs 43% of each cohort, with general programs taking the rest. The Vocational Schools curricula consist of less than 50% of workplace training. Workplace training takes place at least semiannually, and student’s rights are defined by a work contract. Classroom education at Chinese Vocational Schools is 50% general and 50% occupation specific.
Key data about the program Time spent in workplace (vs. classroom) <50% Work contract Yes Transferrable content (vs. specific) 50% Classroom/workplace sequencing Alternating Frequency of workplace learning At least semiannually Program duration 3-4 years (OECD, 2010) VET out of all upper secondary 43% (OECD, 2010) Program out of all VET 100% = 43% of all upper secondary Number of curricula/qualifications 270 in 13 branches (OECD, 2010)
Note: Data in the first five rows comes from the KOF EELI responses.
Policy Implications for China
We cannot reasonably derive policy implications from the very small number of expert responses in the non-focus countries or without doing a case study of each country’s VET. Therefore, we present the spiderweb of subdimension scores as a first look at what the KOF EELI can show, and we look forward to implementing it with more experts in the future.
Score Rank KOF EELI 3.14 14/20 Curriculum Design Phase 3.95 8/20 Curriculum Application Phase 3.34 8/20 Curriculum Feedback Phase 1.30 18/20
01234567
QualificationStandards
Examination Form
InvolvementQuality
Learning Place
WorkplaceRegulation
Cost SharingEquipmentProvision
Teacher Provision
Examination
InformationGathering
Update Timing
Top Average CNSubdimensions
Design Phase Application Phase Feedback Phase

76
Estonia – School-based VET
The Estonian School-based VET Program, which gives access to higher education, has a duration of at least 3 years. With an enrolment rate of 90.6% of all upper secondary VET students, it is by far the main VET pathway, though VET does not play a very important role at the upper secondary level with only 28% of each cohort. The share of workplace training is less than 50%, which is unsurprising in a school-based program. Also unsurprisingly, students do not have work contracts and over 50% of content in classroom education is general and not occupation-specific. Students are in firms at least annually despite the school-based nature of the program, and alternate small periods of work with large periods of schooling.
Key data about the program Time spent in workplace (vs. classroom) <50% Work contract No Transferrable content (vs. specific) >50% Classroom/workplace sequencing Alternation Frequency of workplace learning At least annually Program duration 3 years (CEDEFOP, 2014b) VET out of all upper secondary 28% (CEDEFOP, 2014b) Program out of all VET 90.6% = 25.4% of all upper secondary Number of curricula/qualifications 657 (Kerem, 2012)
Note: Data in the first five rows comes from the KOF EELI responses.
Policy Implications for Estonia
We cannot reasonably derive policy implications from the very small number of expert responses in the non-focus countries or without doing a case study of each country’s VET. Therefore, we present the spiderweb of subdimension scores as a first look at what the KOF EELI can show, and we look forward to implementing it with more experts in the future.
Score Rank KOF EELI 3.95 8/20 Curriculum Design Phase 3.58 12/20 Curriculum Application Phase 3.16 12/20 Curriculum Feedback Phase 5.72 3/20
01234567
QualificationStandards
Examination Form
InvolvementQuality
Learning Place
WorkplaceRegulation
Cost SharingEquipmentProvision
Teacher Provision
Examination
InformationGathering
Update Timing
Top Average EESubdimensions
Design Phase Application Phase Feedback Phase
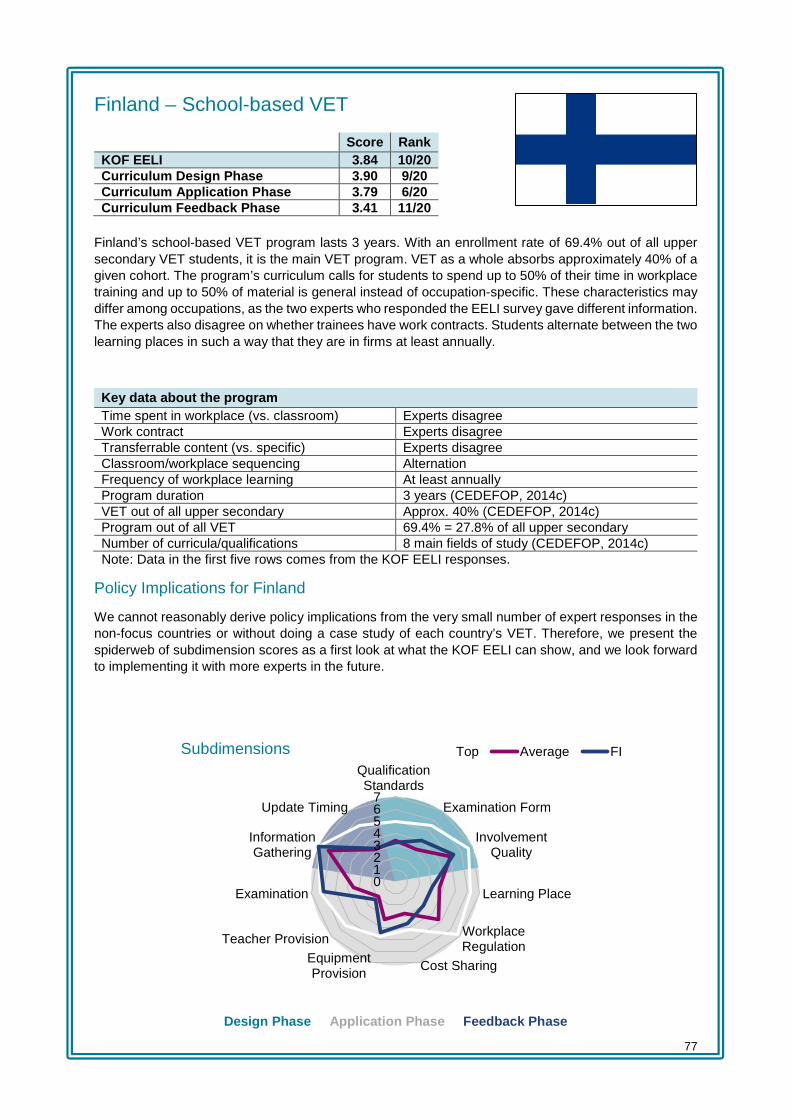
77
Finland – School-based VET
Finland’s school-based VET program lasts 3 years. With an enrollment rate of 69.4% out of all upper secondary VET students, it is the main VET program. VET as a whole absorbs approximately 40% of a given cohort. The program’s curriculum calls for students to spend up to 50% of their time in workplace training and up to 50% of material is general instead of occupation-specific. These characteristics may differ among occupations, as the two experts who responded the EELI survey gave different information. The experts also disagree on whether trainees have work contracts. Students alternate between the two learning places in such a way that they are in firms at least annually.
Key data about the program Time spent in workplace (vs. classroom) Experts disagree Work contract Experts disagree Transferrable content (vs. specific) Experts disagree Classroom/workplace sequencing Alternation Frequency of workplace learning At least annually Program duration 3 years (CEDEFOP, 2014c) VET out of all upper secondary Approx. 40% (CEDEFOP, 2014c) Program out of all VET 69.4% = 27.8% of all upper secondary Number of curricula/qualifications 8 main fields of study (CEDEFOP, 2014c)
Note: Data in the first five rows comes from the KOF EELI responses.
Policy Implications for Finland
We cannot reasonably derive policy implications from the very small number of expert responses in the non-focus countries or without doing a case study of each country’s VET. Therefore, we present the spiderweb of subdimension scores as a first look at what the KOF EELI can show, and we look forward to implementing it with more experts in the future.
Score Rank KOF EELI 3.84 10/20 Curriculum Design Phase 3.90 9/20 Curriculum Application Phase 3.79 6/20 Curriculum Feedback Phase 3.41 11/20
01234567
QualificationStandards
Examination Form
InvolvementQuality
Learning Place
WorkplaceRegulation
Cost SharingEquipmentProvision
Teacher Provision
Examination
InformationGathering
Update Timing
Top Average FISubdimensions
Design Phase Application Phase Feedback Phase
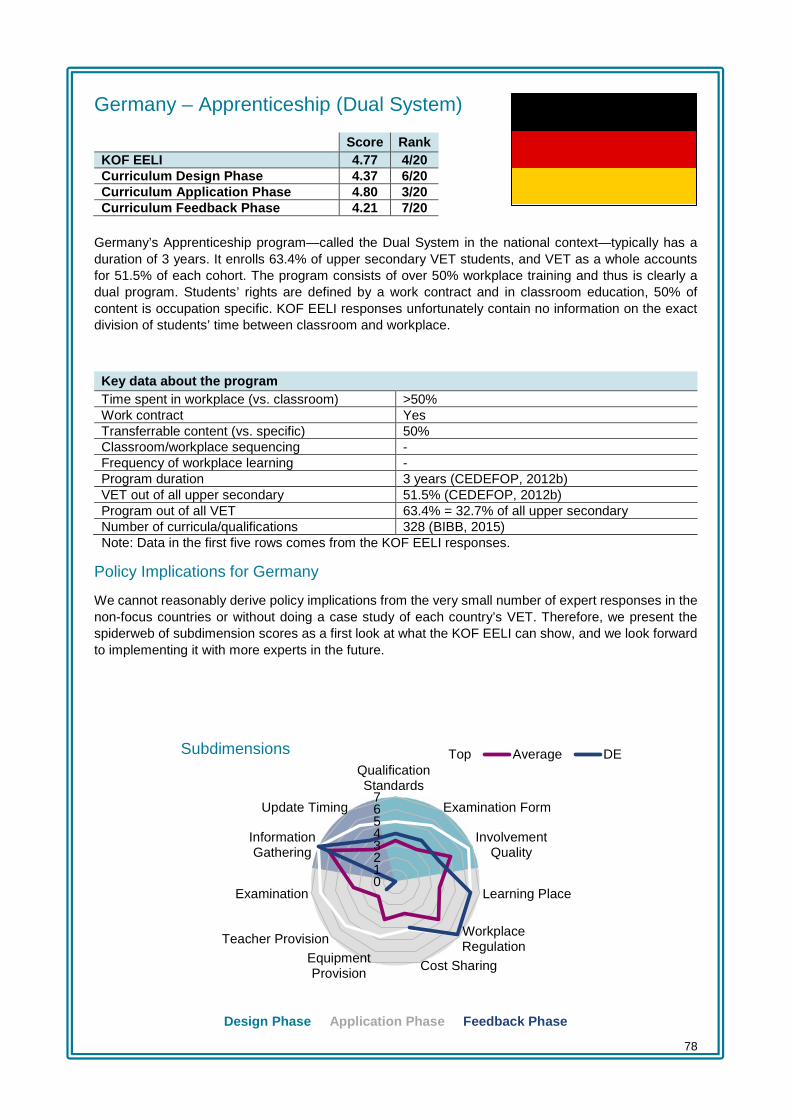
78
Germany – Apprenticeship (Dual System)
Germany’s Apprenticeship program—called the Dual System in the national context—typically has a duration of 3 years. It enrolls 63.4% of upper secondary VET students, and VET as a whole accounts for 51.5% of each cohort. The program consists of over 50% workplace training and thus is clearly a dual program. Students’ rights are defined by a work contract and in classroom education, 50% of content is occupation specific. KOF EELI responses unfortunately contain no information on the exact division of students’ time between classroom and workplace.
Key data about the program Time spent in workplace (vs. classroom) >50% Work contract Yes Transferrable content (vs. specific) 50% Classroom/workplace sequencing - Frequency of workplace learning - Program duration 3 years (CEDEFOP, 2012b) VET out of all upper secondary 51.5% (CEDEFOP, 2012b) Program out of all VET 63.4% = 32.7% of all upper secondary Number of curricula/qualifications 328 (BIBB, 2015)
Note: Data in the first five rows comes from the KOF EELI responses.
Policy Implications for Germany
We cannot reasonably derive policy implications from the very small number of expert responses in the non-focus countries or without doing a case study of each country’s VET. Therefore, we present the spiderweb of subdimension scores as a first look at what the KOF EELI can show, and we look forward to implementing it with more experts in the future.
Score Rank KOF EELI 4.77 4/20 Curriculum Design Phase 4.37 6/20 Curriculum Application Phase 4.80 3/20 Curriculum Feedback Phase 4.21 7/20
01234567
QualificationStandards
Examination Form
InvolvementQuality
Learning Place
WorkplaceRegulation
Cost SharingEquipmentProvision
Teacher Provision
Examination
InformationGathering
Update Timing
Top Average DESubdimensions
Design Phase Application Phase Feedback Phase
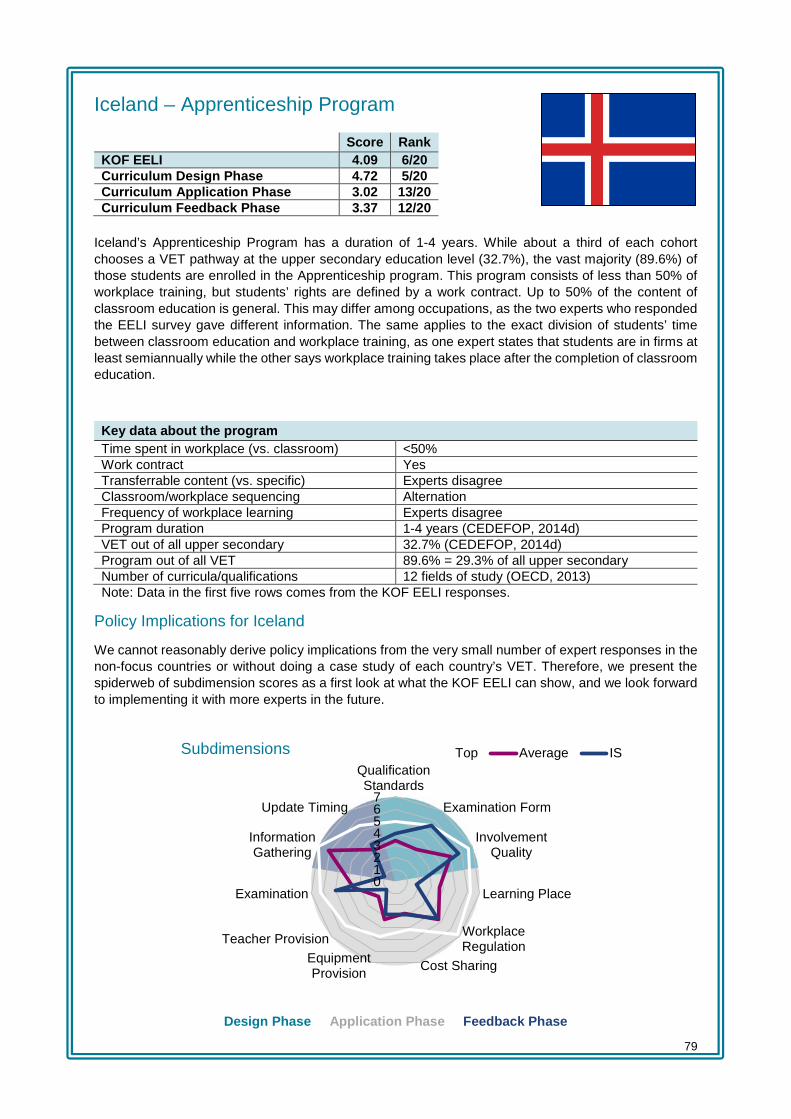
79
Iceland – Apprenticeship Program
Iceland’s Apprenticeship Program has a duration of 1-4 years. While about a third of each cohort chooses a VET pathway at the upper secondary education level (32.7%), the vast majority (89.6%) of those students are enrolled in the Apprenticeship program. This program consists of less than 50% of workplace training, but students’ rights are defined by a work contract. Up to 50% of the content of classroom education is general. This may differ among occupations, as the two experts who responded the EELI survey gave different information. The same applies to the exact division of students’ time between classroom education and workplace training, as one expert states that students are in firms at least semiannually while the other says workplace training takes place after the completion of classroom education.
Key data about the program Time spent in workplace (vs. classroom) <50% Work contract Yes Transferrable content (vs. specific) Experts disagree Classroom/workplace sequencing Alternation Frequency of workplace learning Experts disagree Program duration 1-4 years (CEDEFOP, 2014d) VET out of all upper secondary 32.7% (CEDEFOP, 2014d) Program out of all VET 89.6% = 29.3% of all upper secondary Number of curricula/qualifications 12 fields of study (OECD, 2013)
Note: Data in the first five rows comes from the KOF EELI responses.
Policy Implications for Iceland
We cannot reasonably derive policy implications from the very small number of expert responses in the non-focus countries or without doing a case study of each country’s VET. Therefore, we present the spiderweb of subdimension scores as a first look at what the KOF EELI can show, and we look forward to implementing it with more experts in the future.
Score Rank KOF EELI 4.09 6/20 Curriculum Design Phase 4.72 5/20 Curriculum Application Phase 3.02 13/20 Curriculum Feedback Phase 3.37 12/20
01234567
QualificationStandards
Examination Form
InvolvementQuality
Learning Place
WorkplaceRegulation
Cost SharingEquipmentProvision
Teacher Provision
Examination
InformationGathering
Update Timing
Top Average ISSubdimensions
Design Phase Application Phase Feedback Phase
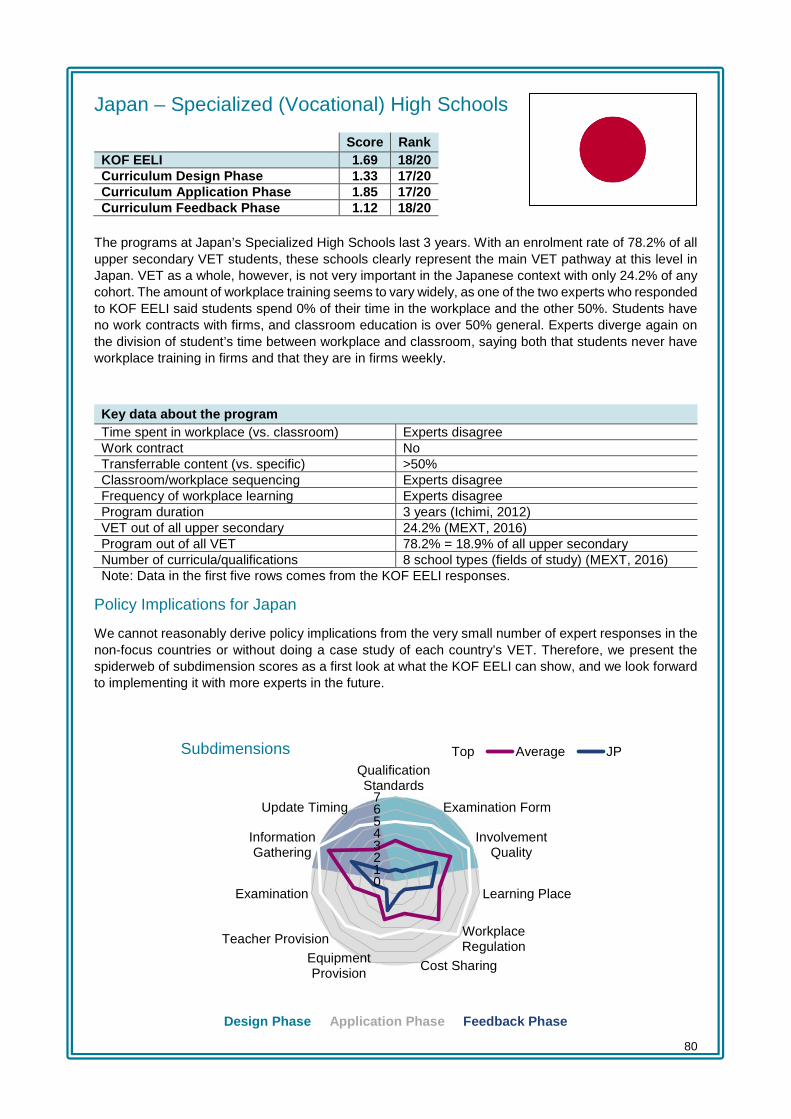
80
Japan – Specialized (Vocational) High Schools
The programs at Japan’s Specialized High Schools last 3 years. With an enrolment rate of 78.2% of all upper secondary VET students, these schools clearly represent the main VET pathway at this level in Japan. VET as a whole, however, is not very important in the Japanese context with only 24.2% of any cohort. The amount of workplace training seems to vary widely, as one of the two experts who responded to KOF EELI said students spend 0% of their time in the workplace and the other 50%. Students have no work contracts with firms, and classroom education is over 50% general. Experts diverge again on the division of student’s time between workplace and classroom, saying both that students never have workplace training in firms and that they are in firms weekly.
Key data about the program Time spent in workplace (vs. classroom) Experts disagree Work contract No Transferrable content (vs. specific) >50% Classroom/workplace sequencing Experts disagree Frequency of workplace learning Experts disagree Program duration 3 years (Ichimi, 2012) VET out of all upper secondary 24.2% (MEXT, 2016) Program out of all VET 78.2% = 18.9% of all upper secondary Number of curricula/qualifications 8 school types (fields of study) (MEXT, 2016)
Note: Data in the first five rows comes from the KOF EELI responses.
Policy Implications for Japan
We cannot reasonably derive policy implications from the very small number of expert responses in the non-focus countries or without doing a case study of each country’s VET. Therefore, we present the spiderweb of subdimension scores as a first look at what the KOF EELI can show, and we look forward to implementing it with more experts in the future.
Score Rank KOF EELI 1.69 18/20 Curriculum Design Phase 1.33 17/20 Curriculum Application Phase 1.85 17/20 Curriculum Feedback Phase 1.12 18/20
01234567
QualificationStandards
Examination Form
InvolvementQuality
Learning Place
WorkplaceRegulation
Cost SharingEquipmentProvision
Teacher Provision
Examination
InformationGathering
Update Timing
Top Average JPSubdimensions
Design Phase Application Phase Feedback Phase

81
Lithuania – School-based VET
Lithuania’s School-based VET Program lasts 3 years. It is the main program within the upper secondary VET sector, though we can find no exact enrolment rate of the program in VET as a whole. Compared to upper secondary general education, 26.8% of each cohort pursues VET. It was not possible to find any experts who were able and willing to respond the KOF EELI questionnaire. Due to this essential feasibility issue, there are no EELI data to be presented here.
Key data about the program Time spent in workplace (vs. classroom) - Work contract - Transferrable content (vs. specific) - Classroom/workplace sequencing - Frequency of workplace learning - Program duration 3 years (CEDEFOP, 2014e) VET out of all upper secondary 26.8% (CEDEFOP, 2014e) Program out of all VET Main (CEDEFOP, 2014e) Number of curricula/qualifications 10 sectoral qualifications (CEDEFOP, 2014e)
Note: Data in the first five rows comes from the KOF EELI responses.
Policy Implications for Lithuania
We were not able to identify an expert who felt qualified to respond to the KOF EELI questionnaire. This might be because there is a language barrier, because VET is not widely studied in Lithuania, or due to cultural issues. KOF EELI scores for Lithuania might require personally visiting the country.
Score Rank* KOF EELI 0.00 19/20* Curriculum Design Phase 0.00 19/20* Curriculum Application Phase 0.00 19/20* Curriculum Feedback Phase 0.00 19/20* *Lithuania and Canada tie because both have no scores.
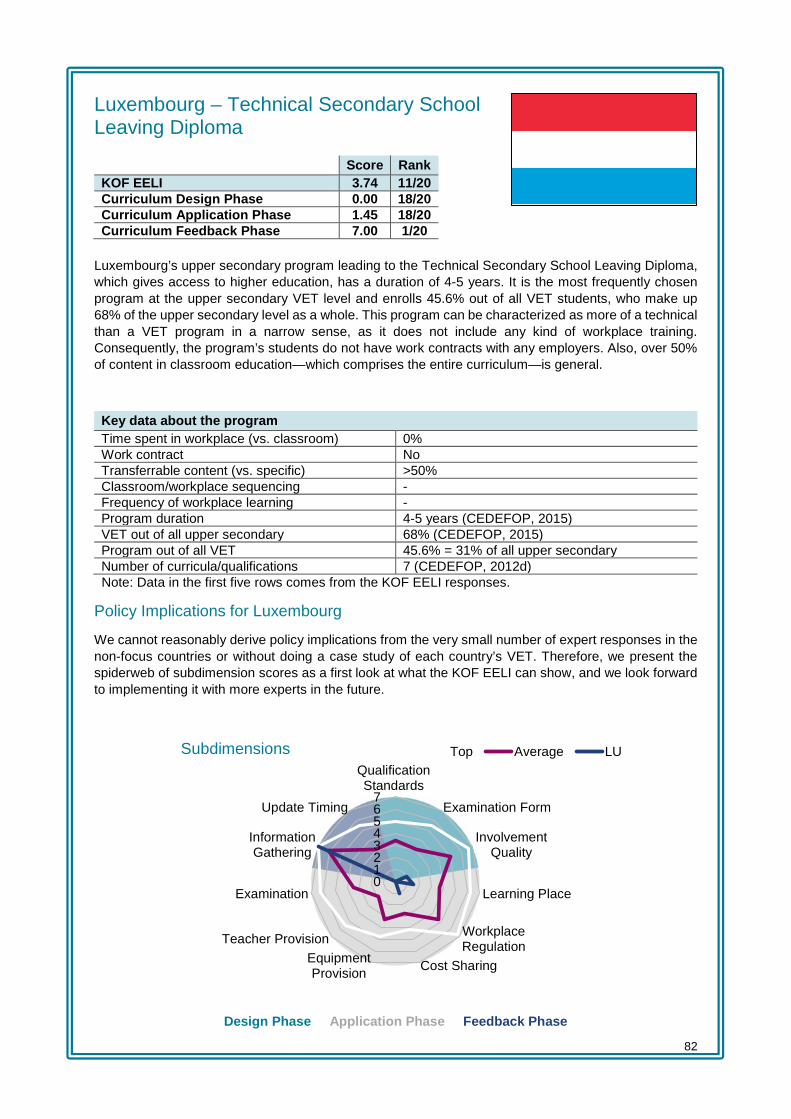
82
Luxembourg – Technical Secondary School Leaving Diploma
Luxembourg’s upper secondary program leading to the Technical Secondary School Leaving Diploma, which gives access to higher education, has a duration of 4-5 years. It is the most frequently chosen program at the upper secondary VET level and enrolls 45.6% out of all VET students, who make up 68% of the upper secondary level as a whole. This program can be characterized as more of a technical than a VET program in a narrow sense, as it does not include any kind of workplace training. Consequently, the program’s students do not have work contracts with any employers. Also, over 50% of content in classroom education—which comprises the entire curriculum—is general.
Key data about the program Time spent in workplace (vs. classroom) 0% Work contract No Transferrable content (vs. specific) >50% Classroom/workplace sequencing - Frequency of workplace learning - Program duration 4-5 years (CEDEFOP, 2015) VET out of all upper secondary 68% (CEDEFOP, 2015) Program out of all VET 45.6% = 31% of all upper secondary Number of curricula/qualifications 7 (CEDEFOP, 2012d)
Note: Data in the first five rows comes from the KOF EELI responses.
Policy Implications for Luxembourg
We cannot reasonably derive policy implications from the very small number of expert responses in the non-focus countries or without doing a case study of each country’s VET. Therefore, we present the spiderweb of subdimension scores as a first look at what the KOF EELI can show, and we look forward to implementing it with more experts in the future.
Score Rank KOF EELI 3.74 11/20 Curriculum Design Phase 0.00 18/20 Curriculum Application Phase 1.45 18/20 Curriculum Feedback Phase 7.00 1/20
01234567
QualificationStandards
Examination Form
InvolvementQuality
Learning Place
WorkplaceRegulation
Cost SharingEquipmentProvision
Teacher Provision
Examination
InformationGathering
Update Timing
Top Average LUSubdimensions
Design Phase Application Phase Feedback Phase

83
Norway – Apprenticeship (2+2 System)
Norway’s Apprenticeship Program—called the 2+2 System in the national context—lasts 4 years and is the most frequently chosen program within upper secondary VET (72.8%). The upper secondary VET sector as a whole absorbs 52% of a cohort and is thus quite important. This program’s curriculum consists of 50% workplace training and 50% classroom education. As the informal name of the program suggests, students’ time is divided between classroom and workplace in such a way that they first attend 2 years of fulltime classroom education and then change to the workplace for two years of fulltime training. When at work, their rights are defined by work contracts. During the classroom education phase, 50% of content is occupation-specific.
Key data about the program Time spent in workplace (vs. classroom) 50% Work contract Yes Transferrable content (vs. specific) 50% Classroom/workplace sequencing Alternating Frequency of workplace learning After completing classroom ed. Program duration 4 years (CEDEFOP, 2014f) VET out of all upper secondary 52% (CEDEFOP, 2014f) Program out of all VET 72.8% = 37.9% of all upper secondary Number of curricula/qualifications 180 approximately (CEDEFOP, 2014f)
Note: Data in the first five rows comes from the KOF EELI responses.
Policy Implications for Norway
We cannot reasonably derive policy implications from the very small number of expert responses in the non-focus countries or without doing a case study of each country’s VET. Therefore, we present the spiderweb of subdimension scores as a first look at what the KOF EELI can show, and we look forward to implementing it with more experts in the future.
Score Rank KOF EELI 3.91 9/20 Curriculum Design Phase 4.00 7/20 Curriculum Application Phase 4.40 5/20 Curriculum Feedback Phase 2.73 14/20
01234567
QualificationStandards
Examination Form
InvolvementQuality
Learning Place
WorkplaceRegulation
Cost SharingEquipmentProvision
Teacher Provision
Examination
InformationGathering
Update Timing
Top Average NOSubdimensions
Design Phase Application Phase Feedback Phase

84
Poland – School-based VET
The Polish School-based VET Program with access to higher education—called Technikum in the national context—has a duration of 4 years. With an enrolment rate of 72.4% of all upper secondary VET students, it is the most important VET pathway within a system where upper secondary VET plays a major role at 56.5% of a cohort. The program consists of less than 50% of workplace training, but Technikum’s students’ rights are still defined by a work contract. In classroom education, 50% of content is occupation-specific and students alternate between classroom and workplace such that they are in firms at least semiannually.
Key data about the program Time spent in workplace (vs. classroom) <50% Work contract Yes Transferrable content (vs. specific) 50% Classroom/workplace sequencing Alternating Frequency of workplace learning At least semiannually Program duration 4 years (CEDEFOP, 2014g) VET out of all upper secondary 56.5% (CEDEFOP, 2014g) Program out of all VET 72.4% = 40.9% of all upper secondary Number of curricula/qualifications 200 (CEDEFOP, 2014g)
Note: Data in the first five rows comes from the KOF EELI responses.
Policy Implications for Poland
We cannot reasonably derive policy implications from the very small number of expert responses in the non-focus countries or without doing a case study of each country’s VET. Therefore, we present the spiderweb of subdimension scores as a first look at what the KOF EELI can show, and we look forward to implementing it with more experts in the future.
Score Rank KOF EELI 4.45 5/20 Curriculum Design Phase 3.58 11/20 Curriculum Application Phase 3.76 7/20 Curriculum Feedback Phase 7.00 1/20
01234567
QualificationStandards
Examination Form
InvolvementQuality
Learning Place
WorkplaceRegulation
Cost SharingEquipmentProvision
Teacher Provision
Examination
InformationGathering
Update Timing
Top Average PLSubdimensions
Design Phase Application Phase Feedback Phase

85
Slovenia – Technical Upper Secondary
The Slovenian Technical Upper Secondary program, which is school-based and gives access to higher education, lasts 4 years. With an enrolment rate of 65.4% in VET, it is the most common program. VET as a whole accounts for more than half of a given cohort (59.7%). The program takes place mainly in the classroom since its workplace training share is less than 50%. Notwithstanding, the students of the Technical Upper Secondary program have their rights defined by a work contract when at work. In classroom education, over 50% of content is occupation-specific. Workplace training can take place before, after, or at least annually during classroom education.
Key data about the program Time spent in workplace (vs. classroom) <50% Work contract Yes Transferrable content (vs. specific) <50% Classroom/workplace sequencing Alternating Frequency of workplace learning Before, after or at least annually during
classroom ed. Program duration 4 years (CEDEFOP, 2014j) VET out of all upper secondary 59.7% (CEDEFOP, 2014j) Program out of all VET 65.4% = 39% of all upper secondary Number of curricula/qualifications 48 (CEDEFOP, 2014j)
Note: Data in the first five rows comes from the KOF EELI responses.
Policy Implications for Slovenia
We cannot reasonably derive policy implications from the very small number of expert responses in the non-focus countries or without doing a case study of each country’s VET. Therefore, we present the spiderweb of subdimension scores as a first look at what the KOF EELI can show, and we look forward to implementing it with more experts in the future.
Score Rank KOF EELI 3.96 7/20 Curriculum Design Phase 5.59 1/20 Curriculum Application Phase 2.90 15/20 Curriculum Feedback Phase 2.50 15/20
01234567
QualificationStandards
Examination Form
InvolvementQuality
Learning Place
WorkplaceRegulation
Cost SharingEquipmentProvision
Teacher Provision
Examination
InformationGathering
Update Timing
Top Average SISubdimensions
Design Phase Application Phase Feedback Phase
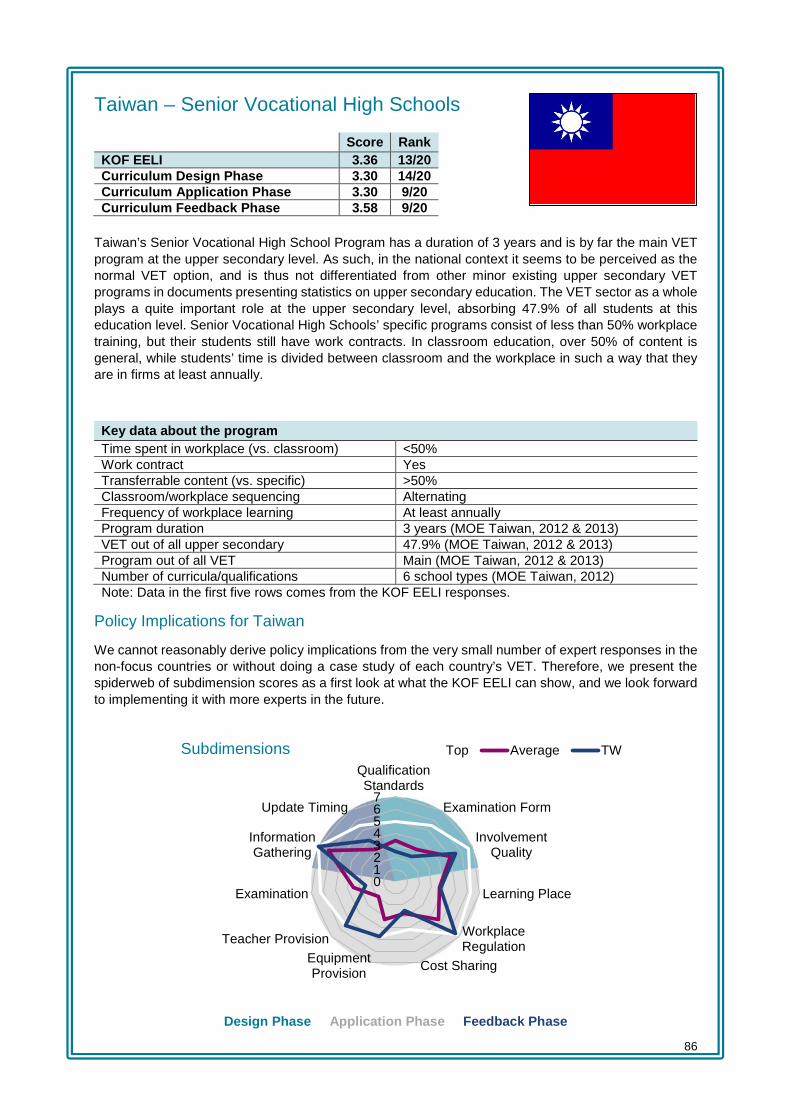
86
Taiwan – Senior Vocational High Schools
Taiwan’s Senior Vocational High School Program has a duration of 3 years and is by far the main VET program at the upper secondary level. As such, in the national context it seems to be perceived as the normal VET option, and is thus not differentiated from other minor existing upper secondary VET programs in documents presenting statistics on upper secondary education. The VET sector as a whole plays a quite important role at the upper secondary level, absorbing 47.9% of all students at this education level. Senior Vocational High Schools’ specific programs consist of less than 50% workplace training, but their students still have work contracts. In classroom education, over 50% of content is general, while students’ time is divided between classroom and the workplace in such a way that they are in firms at least annually.
Key data about the program Time spent in workplace (vs. classroom) <50% Work contract Yes Transferrable content (vs. specific) >50% Classroom/workplace sequencing Alternating Frequency of workplace learning At least annually Program duration 3 years (MOE Taiwan, 2012 & 2013) VET out of all upper secondary 47.9% (MOE Taiwan, 2012 & 2013) Program out of all VET Main (MOE Taiwan, 2012 & 2013) Number of curricula/qualifications 6 school types (MOE Taiwan, 2012)
Note: Data in the first five rows comes from the KOF EELI responses.
Policy Implications for Taiwan
We cannot reasonably derive policy implications from the very small number of expert responses in the non-focus countries or without doing a case study of each country’s VET. Therefore, we present the spiderweb of subdimension scores as a first look at what the KOF EELI can show, and we look forward to implementing it with more experts in the future.
Score Rank KOF EELI 3.36 13/20 Curriculum Design Phase 3.30 14/20 Curriculum Application Phase 3.30 9/20 Curriculum Feedback Phase 3.58 9/20
01234567
QualificationStandards
Examination Form
InvolvementQuality
Learning Place
WorkplaceRegulation
Cost SharingEquipmentProvision
Teacher Provision
Examination
InformationGathering
Update Timing
Top Average TWSubdimensions
Design Phase Application Phase Feedback Phase
87
5 Outlook and conclusions 5.1 Limitations and feasibility issues The purpose of this feasibility study is to address the challenge of identifying the main features of VET curricula in top-performing countries. We use the top performers identified in Phase I of the study to test out an EEL-based strategy for comparing VET programs and find that the KOF EELI is a useful tool that can identify the characteristics of stronger and weaker VET programs. The KOF EELI also passes our initial tests of relevance by confirming our hypotheses that higher KOF EELI scores should correlate with better KOF YLMI outcomes and lower youth unemployment rates. KOF EELI captures at least some part of what makes a VET program strong in terms of its ability to improve young people’s situation on the labor market.
Curriculum comparison for general education entails finding, matching, and relating the contents of curricula in the same subject and different education systems. However, even if every country had the same qualification standards for some occupation they would still not be meaningfully comparable because VET takes place throughout the CVC. Delivery formats range from stackable modules in school to occupational framework curricula across all learning locations. Factors like how well standards match labor market demand, where material is taught and by whom, what equipment is used, how well employers understand graduates’ skills, and how efficiently curricula are updated matter just as much as what the qualification is on paper. As a result, enacted and experienced curricula are very different from written intended curricula.
We conclude that comparing intended curricula is not the right approach to comparing our 20 VET top performers, since it does not capture the enacted and experienced curricula that are so important in VET. We take an alternative approach by measuring EEL, which captures the process that governs the quality of curricula, its match to the labor market, and its actual implementation through the CVC. This approach is the feasible way to meaningfully compare VET curricula in their intended, enacted, and experienced forms.
Measuring EEL still comes with some challenges. Collecting data is difficult when working across multiple countries, cultures, and languages; the sheer variety of systems makes it difficult to be sure we have included every possible feature of EEL in our index; there is a great deal of heterogeneity in EEL even within VET programs; and the KOF EELI is currently measured for just one program within each country’s VET pathway. We begin by summarizing the feasibility issues of comparing intended curricula, then detail the feasibility issues we encountered and expect to encounter with measuring EEL.
5.1.1 Feasibility of comparing intended curricula The first issue with comparing written curricula is finding readable curricula. This means they must be written down, freely available, and in English. We specify English because translating from every country’s native language greatly detracts from feasibility. While the curriculum is available in English in Hong Kong, it only exists in the native languages of Denmark, Switzerland, and the Netherlands. The problem of availability is even more severe in the case of workplace curricula. To find out how difficult this would be, we included an item in the KOF EELI questionnaire asking if the curriculum governing workplace training is publicly available in English. The only countries where at least some experts indicated that such curricula exist in English are Denmark and Hong Kong. Native-language curricula are available in most countries, and if not public can be accessed upon request. Still, 15% of experts indicated that their country’s VET curricula are inaccessible in any language. The first step of acquiring curricula to compare seems not to be feasible.
88
The second issue arises because VET programs might aim to prepare students for a specific job, an entire occupation, or simply offer career-oriented general education. As shown in sections 4.4 and 4.5, this results in high variation on features like how general or occupation-specific curricula are, which renders a curriculum comparison more challenging. This can also be illustrated by the fact that the share of classroom education that is occupation-specific varies from mostly general (Estonia, Japan, Luxembourg, and Taiwan) to mostly occupation-specific (Austria, Denmark, and Singapore). Hence, a curriculum comparison needs to address the issue of how to deal with the variation in terms of occupation-specificity of classroom education.
Similarly, the third problem arises because the share of classroom and workplace training differs, which creates the problem of combining the two learning places’ curricula. This is particularly difficult because they might be formulated differently. The fourth issue arises because of heterogeneity in the scope of curricula. Section 3.1.4 shows that the roles of regions and schools differs across. Hence, national curricula differ in their specificity, which represents a further challenge. In addition, the program description in sections 4.4 and 4.5 show that the number of occupations differ substantially across countries, and comparability of curricula requires comparability of the occupation: the same occupation is different in a country where it is one of 200 and another where it is one of ten.
However, even if we managed to identify comparable intended curricula, we would still run into challenges because of the differences between intended, enacted, and experienced curricula. The written curricula capture the intended part of that triad, and might have nothing to do with what actually happens in the classroom and what students actually learn. The curriculum application phase subdimensions of learning place, workplace regulation, cost sharing, teacher provision, equipment provision, and the examination determine the latter two curriculum types, and they would not be captured at all in the written curriculum. For example, if there is no quality assurance or centralized examination and teachers are free to ignore the written curriculum, its meaning is essentially zero. This would become an even larger issue as we began to expand beyond only the top-performing countries.
Because of the difficulties associated with getting and reading curricula and the limitations of what the intended curricula can tell us about enacted and experienced curricula, we are forced to conclude that simply comparing the contents of written curricula is not only unfeasible but also potentially irrelevant. Therefore, we measure VET by assessing the role of employment-system actors in the design, application, and updating of VET curricula at the program level. EEL is a foundational characteristic of strong VET programs, and the CVC lets us examine the entire curriculum process and all its context factors.
5.1.2 Feasibility of measuring EEL Heterogeneity within VET pathways, programs, and curricula
As we have discussed before, one of the primary concerns for feasibility in measuring VET is that there are many programs within the VET pathway and many curricula within each program. Since curricula are at the level of the curriculum—or career, or field of study, or job—heterogeneity within the VET program is a challenge to the feasibility of using a program-level measure for EEL. Furthermore, using only a single program is a challenge to the feasibility of evaluating entire VET pathways.
We resolve the issue of multiple programs within VET pathways in this application of the KOF EELI by clearly specifying that our results are only for the one program under study, and using the largest program so results are maximally policy-relevant. Still, an ideal measurement and potential future direction for the KOF EELI is to measure EEL in every VET program within the pathway and aggregate their scores according to enrollment numbers to truly score EEL in an entire country’s upper secondary VET pathway. We could even extend this further to include all levels of VET.
More pressingly, each program includes multiple curricula and even different qualifications, creating heterogeneity within VET programs. This means that students in a single program in a single country

89
might experience different levels of EEL. It is not feasible to ask about every curriculum in a program individually, as the numbers can be very large and also very different across countries and therefore incomparable. For example, Switzerland has 230 occupations with clearly delineated curricula in individual ordinances, but other countries may have more than 900 legally-specified curricula, just a few broad fields of study in which teachers or schools can create their own occupational curricula, or some combination of the above. Since curriculum-level measurement is not currently feasible, we focus on program-level measurement.
Within-program heterogeneity is compounded by potential differences at the level of schools, teachers, regions, workplaces, and sectors at the curriculum or program level. One school may have excellent connections with nearby employers while another might not, and though both could be implementing the same curriculum correctly their students will experience different EEL. Even if we could measure individual curricula, we would quickly find ourselves measuring the practices of each school or even teacher, which is not feasible.
Our current solution to all this heterogeneity is to ask experts to respond for the average situation in the program, which is feasible and sufficiently accurate. Ideally we will be able to ask many more experts in the future so that the responses represent more perspectives and a more accurate average situation within a given program. If we want to measure VET pathways as a whole instead of individual programs, we will need to ask still more experts about the average situation within each program and aggregate these together. If we decide to expand the KOF EELI to include tertiary VET as well as upper secondary VET, the pool of experts will grow accordingly larger.
The feasibility of addressing within-VET heterogeneity decreases as we expand our scope: our current solution is feasible and measures the single largest program within the upper secondary VET pathway. There is also a trade-off between accuracy and feasibility, as better measurement requires more experts. Adding additional programs or levels beyond the original program will also decrease feasibility and increase number of necessary experts, so the final solution will most likely be a balance between the scope of the KOF EELI and the limitations of surveying legions of experts.
Missing features
One further issue is whether a questionnaire instrument can fully measure EEL at all. In addition to testing the consistency of the KOF EELI against two different methodologies (see Appendix 5), we included open-ended items in the questionnaire where experts could identify any features they considered missing from our index. Some experts did respond to those items, raising issues with our approach to measurement and highlighting the trade-offs we faced in choosing our strategy. However, the specific features in the KOF EELI appear to capture the most relevant aspects of EEL, suggesting that completeness is not a problem.
The first issue that arose for multiple experts is heterogeneity within VET programs. As discussed above, single programs, comprise many—possibly very many—curricula and/or qualifications and their corresponding curricula. Experts from Denmark, Hong Kong, Singapore, and Switzerland expressed concern about differences across sectors and curricula, and experts from the Netherlands and Poland cited differences across regions and schools. A number of experts indicated that the national curricula of different qualifications within a program might have varying scope and depth.
The second issue that came up repeatedly was the role of employee unions in VET. Several experts from Denmark, Finland, and Singapore criticized the questionnaire for focusing on the role of firms and employer associations rather than modeling linkage as a tripartite system. This raised additional questions on how we should treat indirect involvement of employers through governing bodies that include diverse actors and of which employers are only part. Finally, one expert objected to the questionnaire’s phrasing that “individual firms/employer associations share power equally,” stating that it can refer to power sharing between individual firms and employer associations instead of power sharing between both employment actors and other actors in education.

90
The last issue that came up for experts was how they should deal with ongoing changes in the VET program. Experts from Finland and the Netherlands pointed out that that EEL varies with time, especially when VET curricula are frequently updated.
Overall, we can be confident that the KOF EELI is not missing any important features of EEL. We can clarify and rephrase small parts of the questionnaire using vignette techniques and possibly create a role for unions in future iterations of the index, but we can also consider the results of this KOF EELI to be adequate. Even an instrument specifically designed to capture a diversity of VET systems without privileging any specific structure will run into some difficulty when it attempts to address every system. However, these issues are not insurmountable and measuring EEL can certainly be considered feasible.
Solidifying a policymaker toolkit
In our own assessment of the KOF EELI, we add that additional data will help us further refine the weighting scheme of individual features, subdimensions, and dimensions. The weights of each feature is a very policy-relevant characteristic of KOF EELI because it enables us to prioritize the most important changes for improving KOF EELI scores. In order to further improve, we need to collect additional data to refine and reinforce the weights of each feature. At the same time, we will be able to investigate interrelations among features with a larger sample size: if high scores in the learning place subdimension diminish the weight of the equipment and teacher provision subdimensions as we suspect they do, we need more data to know how. We hope to solidify the weighting scheme for individual features, but our current results are robust enough to design a policymaker toolkit, which we present in a separate document.
Data collection
Since measuring EEL with an index is feasible conceptually, we can move on to the logistics of actually collecting data. Our questionnaire methodology for the KOF EELI minimizes the potential flaws in asking experts to rate EEL, but it also requires us to collect data from a large number of experts. Feasibility concerns force us to offer the questionnaire in English only, which further compounds the difficulty of consulting so many international experts. The challenges around data collection are identifying, contacting, and getting responses from experts around the world. In addition, we need to communicate effectively with experts by using vignettes for some questions.
Identifying experts was not complicated thanks to our clear conditions for selection, but it was not easy. In cases where we have personal connections or are very familiar with the national context, it was not difficult to specify all of the relevant institutions and organizations and the people who could best answer the questionnaire. In countries where we are not intimately familiar with the system but do have personal connections, we were able to identify the obvious experts and ask key informants to flesh out the list with experts, organizations, and institutions we might have missed as well as their contact information. This was an enormous help to us and we are very grateful to the key experts who performed this task. In countries where we are neither very familiar with the system nor personally connected to anyone who could serve as a key informant, the situation was much more difficult. We relied on international organizations, embassies, second-order connections, and even cold-emailing potential informants in addition to a great deal of desk research. This was sufficient in some cases but not in others. Contact was primarily through email and occasionally over the telephone to explain elements of the online survey. In short, identifying and contacting experts is feasible in contexts where the research team knows the system and the people, but can be very difficult and almost unfeasible without insider knowledge and connections.
Eliciting responses from the experts we identified and contacted was an entirely separate problem. Here feasibility was affected by language barriers, the length of the survey, and our ability to find organizations with local importance to partner with us in requesting responses to the survey. The most evident difficulty with conducting the KOF EELI as an online questionnaire was the language barrier. It was much more difficult to get responses from our experts in countries where English is not generally
91
spoken, and this greatly impacted response rates. The questionnaire also had to be quite detailed, and as a result required as much as 30 minutes for experts to fill it out completely. While experts did generally complete the survey, we suspect that many non-responders are in that category because they were unwilling or unable to commit so much time to a survey. In cases where our organization is not well known, we partnered with local institutions like ministries of education to send out the questionnaire with their logo as well as ours. This seemed to help response rates and we are very grateful to the organizations that agreed to support the KOF EELI. The language and length issues were compounded in countries where no locally recognized institution supported the survey. The varying difficulties getting responses is evident in the range of response rates and numbers we received for both focus and secondary countries, including the two cases where we could not get any responses at all.
A large project like this one requires a great deal from respondents, so selecting the right people and actually getting a response can be very difficult. We found that factors improving feasibility are familiarity with the system, personal connections to potential respondents, support from key informants who can provide institutional knowledge and contact information, and sponsorship from local-recognized organizations willing to endorse the project. The language barrier, the necessity of a long questionnaire, and the lack of any of the above factors all diminished feasibility greatly. There is also the element of time: one person worked on contacting and communicating with experts full-time for the duration of this phase, and other members of the team were also involved in identifying and getting responses from experts. That does not include the traditional research activities of designing and implementing the instrument, cleaning and analyzing data, or determining and writing up the results. Data collection for the KOF EELI is feasible, but these factors need to be taken into account in planning.
5.2 Conclusions Feasibility
Despite the challenges, intricacies, logistics, and resource needs of measuring VET systems with the KOF EELI, we conclude that it is feasible and that expanding the strategy is also feasible. We can compare VET systems and derive policy implications from KOF EELI results, so we also conclude that it is an effective means of identifying the main features of VET curricula in top-performing countries.
The KOF EELI enables VET comparison as demonstrated in this report with the index, dimension, subdimension, and feature-level evaluations across our 20 top-performing countries. Those assessments are useful for showing policymakers where their own systems struggle and succeed compared to the strongest VET programs and the average of the surveyed countries. It is easy to compare scores at multiple levels, and to explore where high and low scores come from at the feature level. Features and subdimensions translate easily into policy objectives.
Factors Improving Feasibility:
− Familiarity with the system − Personal connections to experts − Key informants with familiarity
and personal connections − Endorsements from locally-
known organizations
Factors Diminishing Feasibility:
− Language barriers − Questionnaire length − Time commitment for
researchers
92
Key characteristics of VET top performers
Identifying the characteristics of top-performing VET programs is where the KOF EELI really shines. Because the questionnaire is designed to measure the relative weights of each feature in addition to the experts’ scores, we can identify the most important characteristics of the best VET programs. These provide policymakers with priorities for how to proceed. At the dimension level, the design phase is most important and accounts for 41.9% of the total index score. At the subdimension level, the most important are employers’ involvement in curriculum update timing (22.5%), their role in the design of qualification standards (15.8%), the quality of employers’ involvement in the design phase (14.3%), and the learning place (13.2%).
The feature level is perhaps the most immediately policy-relevant. The main features of VET in top-performing countries are that employers are involved in setting qualification standards (15.8%), deciding when an update needs to happen (15.7%), and setting the examination form (11.8%); and that students spend most of their time in the workplace instead of the classroom (13.2%). This information, combined with a country’s scores, provides policymakers with a priority list for VET reforms and a means of assessing their current status and progress towards VET improvement goals.
The main features of VET in top-performing countries are: employers are involved in setting qualification standards, deciding when an update needs to happen, and setting the examination form; and students spend most of their time in the workplace instead of the classroom.

93
References Act on Employer’s Contribution to Education and Training (2015). Retrieved from https://www.retsinformation.dk/Forms/R0710.aspx?id=172904.
Act on Professional Higher Education (2013). Retrieved from https://www.retsinformation.dk/Forms/R0710.aspx?id=164381.
Al-Samarrai, S. (2013). Local Governance and Education Performance: A Survey of the Quality of Local Education governance in 50 Indonesian Districts. Jakarta: The World Bank Office.
APEC Asia-Pacific Economic Cooperation (2010). Case Study on Institute of Technical Education (ITE) Singapore. Retrieved from http://hrd.apec.org/images/6/6b/77.1.pdf.
Backes-Gellner, U. (1996). Betriebliche Bildungs- und Wettbewerbsstrategien im deutsch-britischen Vergleich. München: Rainer Hampp Verlag.
BIBB (2015). Verzeichnis der anerkannten Ausbildungsberufe 2015. Retrieved from: https://www.bibb.de/dokumente/pdf/Verzeichnis_anerk_AB_2015.pdf
Billett, S. (2006). Constituting the workplace curriculum. Journal of curriculum studies, 38(1), 31-48.
Brower, P. (2012). Creatief Met Curriculum. ECBO. Retrieved from: http://www.canonberoepsonderwijs.nl/curriculumontwerp.
Brown, A. C., Stern, J., Tenenbaum, B. W., and D. Gencer (2006). Handbook for Evaluating Infrastructure Regulatory Systems. Washington, D.C.: World Bank Publications.
Carrero Perez, E. (2006). Reforming Technical and Vocational Education and Training in the Middle East and North Africa: Experiences and Challenges. Luxembourg: European Training Foundation.
CBS (2015). Education; Education Expenditure and CBS/OECD Indicators. Central Bureau of Statistics of the Netherlands. Retrieved from http://statline.cbs.nl/Statweb/publication/?DM=SLEN&PA=80393ENG&D1 =a&D2=6&D3=l&LA=EN&HDR=G2,G1&STB=T&VW=T.
CEDEFOP (2008). Initial Vocational Education and Training (ITVET) in Europe: Review. Thessaloniki: European Centre for the Development of Vocational Training.
CEDEFOP (2012a). Austria: VET in Europe – Country report. Retrieved from: http://www.CEDEFOP.europa.eu/en/publications-and-resources/country-reports/austria-vet-europe-country-report-2012.
CEDEFOP (2012b). Germany: VET in Europe – Country report. Retrieved from: www.CEDEFOP.europa.eu/files/2012_cr_de.pdf.
CEDEFOP (2012c). Denmark: VET in Europe - Country report. Retrieved from: http://www.CEDEFOP.europa. eu/en/publications-and-resources/country-reports/denmark-vet-europe-country-report-2012.
CEDEFOP (2012d): Luxembourg: VET in Europe – Country report. Retrieved from: http://www.CEDEFOP.europa.eu/en/publications-and-resources/country-reports/luxemburg-vet-europe-country-report-2012.
CEDEFOP (2014a). Denmark: VET in Europe – Country report. Retrieved from: https://cumulus.CEDEFOP.europa.eu/files/vetelib/2014/2014_CR_DK.pdf.
94
CEDEFOP (2014b). Estonia: VET in Europe – Country report. Retrieved from: https://cumulus.CEDEFOP.europa.eu/files/vetelib/2014/2014_CR_EE.pdf.
CEDEFOP (2014c). Finland: VET in Europe – Country report. Retrieved from: https://cumulus.CEDEFOP.europa.eu/files/vetelib/2014/2014_CR_FI.pdf.
CEDEFOP (2014d). Iceland: VET in Europe – Country report. Retrieved from: https://cumulus.CEDEFOP.europa.eu/files/vetelib/2014/2014_CR_IS.pdf.
CEDEFOP (2014e). Lithuania: VET in Europe – Country report. Retrieved from: https://cumulus.CEDEFOP.europa.eu/files/vetelib/2014/2014_CR_LT.pdf.
CEDEFOP (2014f). Norway: VET in Europe – Country report. Retrieved from: https://cumulus.CEDEFOP.europa.eu/files/vetelib/2014/2014_CR_NO.pdf.
CEDEFOP (2014g): Poland: VET in Europe – Country report. Retrieved from: https://cumulus.CEDEFOP.europa.eu/files/vetelib/2014/2014_CR_PL.pdf.
CEDEFOP (2014h). Netherlands. VET in Europe - Country Report 2014. Retrieved from: https://cumulus.CEDEFOP.europa.eu/files/vetelib/2014/2014_CR_NL.pdf.
CEDEFOP (2014i). Netherlands: Apprenticeship-type Schemes and Structured Work-based Learning Programmes. Retrieved from: https://cumulus.CEDEFOP.europa.eu/files/vetelib/2015/ReferNet_NL_2014_WBL.pdf.
CEDEFOP (2014j): Slovenia: VET in Europe – Country report. Retrieved from: https://cumulus.CEDEFOP.europa.eu/files/vetelib/2014/2014_CR_SI.pdf.
CEDEFOP (2016). VET in the Netherlands: Short Description. CEDEFOP Information Series. Retrieved from: http://www.CEDEFOP.europa.eu/de/publications-and-resources/publications/4142.
Choi, D. S. (2014). Overview of Secondary Vocational Education. In: Park, Y. and M. H. Jang (Ed.). The Present and Future of Secondary Vocational Education. Seoul: KRIVET Korea Research Institute for Vocational Education and Training, p. 39-54. Retrieved from: http://eng.krivet.re.kr/eu/zc/prg_euZ_prA.jsp?dv=G&gn=M06|M060000064|1.
Chung, J. (2013). Vocational Education System. In: Y. Park and J. Chung (Ed.). Vocational Education and Training in Korea. Seoul: KRIVET Korea Research Institute for Vocational Education and Training, p. 31-65. Retrieved from: https://www.krivet.re.kr/ku/zi/prg_kuZ_prA.jsp?dv=G&gn=M06%7CM060000056%7C1
CIA Central Intelligence Agency (2013). The World Factbook 2013-2014: Denmark.
CIA Central Intelligence Agency (2014). The World Factbook: Hong Kong. Washington, DC. Retrieved from: https://www.cia.gov/library/publications/the-world-factbook/geos/hk.html.
CIC Construction Industry Council (2012). Training Output. Retrieved from: http://www.hkcic.org/eng/courses/output.aspx?langType=1033.
CITA Clothing Industry Training Authority (2014). About Us. Retrieved from: http://www.cita.org.hk/en/about-cita/about-us/.
CMEC (2008): Education in Canada. Council of Ministers of Education, Toronto, Canada. Retrieved from: http://www.cmec.ca/Publications/Lists/Publications/Attachments/64/Education-in-Canada2008.pdf.
De Ridder, W. (2015). Quality Assurance and Quality Development and Experience on the Use of Peer Review in the Netherlands. Retrieved from: http://www.peer-review-education.net/calimero/tools/proxy.php?id=15366.
Diploma Yi Jin (2016). Website. Retrieved from: http://www.yijin.edu.hk/eindex.html.
95
DMCEGE (2008a). The Danish Vocational Education and Training System. Danish Ministry for Children, Education and Gender Equality. Retrieved from: http://pub.uvm.dk/2008/VET2/The_Danish_VET_System_web.pdf.
DMCEGE (2008b). The Danish Approach to Quality. Danish Ministry for Children, Education and Gender Equality. Retrieved from: http://pub.uvm.dk/2008/vetquality2/.
DMCEGE (2014a). Improving Vocational Education and Training - Overview of Reform of the Danish Vocational Education System. Danish Ministry for Children, Education and Gender Equality. Retrieved from: http://www.uvm.dk/~/media/UVM/Filer/English/PDF/140708%20Improving%20Vocational%20 Education%20and%20Training.ashx?smarturl404=true.
DMCEGE (2014b). Youth Guarantee and Policy Reform in VET in Demark. Danish Ministry for Children, Education and Gender Equality. Retrieved from: http://www.garanziagiovani.gov.it/Documentazione/ Documents/Piano-di-attuazione-Youth-Guarantee-Danimarca.pdf.
DMCEGE (2015a). Education: Upper Secondary School. The Danish Ministry for Children, Education and Gender Equality. Retrieved from: http://eng.uvm.dk/Education/Upper-Secondary-Education
DMCEGE (2015b). Danish Ministry for Children, Education and Gender Equality. Retrieved from: http://uvm.dk/Uddannelser/Erhvervsuddannelser/Uddannelser.
DMCEGE (2015c). Graphical Overview over the Vocational Education and Training System. Danish Ministry for Children, Education and Gender Equality. Retrieved from: http://uvm.dk/Uddannelser/Erhvervsuddannelser/Uddannelser/Overblik/Grafisk-overblik.
DMCEGE (2015d). The Taximeter System. Danish Ministry for Children, Education and Gender Equality. Retrieved from: http://eng.uvm.dk/Education/General/The-taximeter-system.
DMCEGE (2016a). Education: Primary and Lower Secondary Education. Danish Ministry for Children, Education and Gender Equality. Retrieved from: http://eng.uvm.dk/Education/Primary-and-Lower-Secondary-Education/The-Folkeskole.
DMCEGE (2016b). Education: Upper Secondary Education. Danish Ministry for Children, Education and Gender Equality. Retrieved from: http://uvm.dk/Uddannelser/Erhvervsuddannelser/Uddannelser/Eud.
DMHES Danish Ministry of Higher Education and Science (2015). Website. Retrieved from: http://ufm.dk/en/education-and-institutions/higher-education.
EBBK Federal Vocational and Professional Education and Training Commission (2015). Jahresbericht 2014. Retrieved from: http://www.sbfi.admin.ch/berufsbildung/01583/index.html?lang=de.
EC European Commission (2015). Country Report Denmark 2015. Retrieved from: http://ec.europa.eu/europe2020/pdf/csr2015/cr2015_denmark_en.pdf.
EC European Commission (2016). Education and Training Education and Training Monitor 2015 Netherlands. Retrieved from: http://ec.europa.eu/education/tools/docs/2015/monitor2015-netherlands_en.pdf.
ECBO (2014). OECD Review: Skills Beyond School. National Background Report for the Netherlands. OECD. Retrieved from: http://www.ecbo.nl/_images/user/ecbo.14-163-oecd-review-skills-beyond-school-background-nl.pdf
EDB Education Bureau (2014). Careers Guidance Handbook for Secondary School Graduates 2014. Retrieved from: http://www.edb.gov.hk/en/student-parents/careers-guidance/about-careers-guidance/index.html.
96
EDK Swiss Conference of Cantonal Ministers of Education (2015). The Swiss Education System. Retrieved from: http://www.edk.ch/dyn/16342.php.
EDK Swiss Conference of Cantonal Ministers of Education (2016). Swiss Education System. Retrieved from: http://www.edk.ch/dyn/16833.php.
Egg, M.E., Renold, U. (2016). “The Swiss education system, with a special focus on vocational education and training.” In: Renold/Probst (eds.). The Swiss Vocational Education and Training Initiative India. Background, Concept and Results of the Pilot Project 2008-2013. Bern. hep-Verlag. P. 27-52
Eichmann, R. (1989). Diskurs Gesellschaftlicher Teilsysteme: Zur Abstimmung von Bildungssystem und Beschäftigungssystem. Wiesbaden: Deutscher Universitäts-Verlag.
EIF Education in Figures (Onderwijs in Cijfers) (2016). Key Figures on the Dutch Education System. Retrieved from: http://www.onderwijsincijfers.nl/kengetallen.
EP-Nuffic (2015). Education System: The Netherlands. The Dutch Education System Described. Retrieved from: https://www.epnuffic.nl/en/publications/find-a-publication/education-system-the-netherlands.pdf.
ERB Employees Retraining Board (2014). Main Courses. Retrieved from: http://www.erb.org/home/erb/en/.
ETF European Training Foundation (2013). Good Multilevel Governance for Vocational Education and Training. ETF Working Paper. Retrieved from: http://www.etf.europa.eu/web.nsf/pages/Multilevel_governance_for_VET_EN.
FSO Swiss Federal Statistical Office (2016). Education and Science – Key Figures. Educational Degrees and Certificates. Educational Degrees and Certificates by Educational Level. Educational Degrees and Certificates 2014. Retrieved from: http://www.bfs.admin.ch/bfs/portal/en/index/themen/15/01/key/blank/03.html.
GovHK (2008). Hong Kong Qualifications Framework. Generic Level Descriptors. Retrieved from: http://www.gov.hk/en/residents/education/qf/.
GovHK (2014a). Hong Kong: The Facts, Education. Retrieved from: http://www.gov.hk/en/about/abouthk/factsheets/.
GovHK (2014b). Hong Kong: The Facts. Government Structure. Retrieved from: http://www.gov.hk/en/about/abouthk/factsheets/
GovHK (2015a). Information Note Review of Development of Vocational Education in Hong Kong. Retrieved from: http://www.legco.gov.hk/research-publications/english/1415in15-review-of-development-of-vocational-education-in-hong-kong-20150813-e.pdf.
GovHK (2015b). Report of the Task Force on Promotion of Vocational Education. Retrieved from http://www.gov.hk/en/residents/government/policy/government_reports/reports/docs/Report_of_the_Task_Force_on_Promotion_of_Vocational_Education.pdf.
GovHK (2016a). Hong Kong Qualifications Framework (HKQF). Retrieved from: http://www.hkqf.gov.hk/en/home/index.html.
GovHK (2016b). Factsheet, Hong Kong: The Facts. Retrieved from: http://www.gov.hk/en/about/abouthk/factsheets/.
Hannan, D. F., Raffe, D., and E. Smyth (1996). Cross-national Research on School to Work Transitions: An Analytical Framework. Paper Commissioned by the OECD Secretariat to Provide Background for the Transition Thematic Review. Retrieved from: https://search.oecd.org/edu/skills-beyond-school/1925587.pdf
97
Heo, Y. J. (2014). Policies for Specialized High School Promotion and Accomplishments. In: Park, Y. and M. H. Jang (Ed.). The Present and Future of Secondary Vocational Education. Seoul: KRIVET Korea Research Institute for Vocational Education and Training, p. 55-83. Retrieved from: http://eng.krivet.re.kr/eu/zc/prg_euZ_prA.jsp?dv=G&gn=M06|M060000064|1.
H-MBO. (2015). Kwalificatiestructuur mbo. Herziening MBO. Retrieved from: http://www.herzieningmbo.nl/de-herziening/inhoud/.
Hoeckel, K., Field, S. and W.N. Grubb (2009). Learning for Jobs: Switzerland. OECD Reviews of Vocational Education and Training. Paris: OECD Publishing.
IBE International Bureau of Education (2010/11). World Data on Education. Republic of Korea. 7th edition. June 2011. Retrieved from: http://www.ibe.unesco.org/fileadmin/user_upload/Publications/WDE/2010/pdf-versions/Republic_of_Korea.pdf.
IBE International Bureau of Education (2010/11). World Data on Education. Singapore. 7th edition. May 2011. Retrieved from: http://www.ibe.unesco.org/fileadmin/user_upload/Publications/WDE/2010/pdf-versions/Singapore.pdf.
Ichimi, M. (2012). Upper Secondary Education in Japan. Retrieved from: https://www.nier.go.jp/English/educationjapan/pdf/201209SE.pdf
IQAS International Qualification Assessment Service (2009). International Education Guide. For the Assessment of Education from South Korea. Government of Alberta, Canada. Second Printing 2009. Retrieved from: https://work.alberta.ca/documents/korea-international-education-guide.pdf.
ITE Institute of Technical Education (2012). Transformation in Technical Education Changes a Nation. 2011 Singapore Quality Award with Special Commendation Winner. Summary Report. Retrieved from: http://www.spring.gov.sg/Building-Trust/Business-Excellence/The-BE-Community-Partners/Documents/SQASC_ITE_2011_Summary_Report.pdf.
ITE Institute of Technical Education (2015). Annual Report 14/15 for the Year Ended 31 March 2015. Singapore.
ITE Institute of Technical Education (2016). Prospectus 2016. Retrieved from: https://www.ite.edu.sg/wps/portal/fts.admission.ft#prospectus.
KEDI Korean Educational Development Institute (2015a). Brief Statistics on Korean Education 2015. Retrieved from: http://cesi.kedi.re.kr/eng/publ/publFile/pdfjs?survSeq=2015&menuSeq=3894& publSeq=4&menuCd=66669&itemCode=02&menuId=1_2&language=en.
KEDI Korean Educational Development Institute (2015b). Education for the Future. Korean Education Policy Development. June 2015. Retrieved from: http://eng.kedi.re.kr/khome/eng/education/genernalInfo.do#.
Kelly, A. V. (2009). The curriculum: Theory and practice. Sage.
Kerem, K. (2012): Estonian professional qualifications system. Retrieved from: http://www.kpmpc.lt/LTKS_EKS/Katrin_Kutsekoda_ENG.pdf
Klieme, E., Avenarius, H., Baethge, M., Döbert, H., Hetmeier, H., Meister-Scheufelen, G., Rauschenbach, T., Wolter, A. (2006). Grundkonzeption der Bildungsberichterstattung in Deutschland. In: Zeitschrift für Erziehungswissenschaft. Bildungs- und Sozialberichterstattung. Beiheft 6, p. 129-145.
KOF Swiss Economic Institute (2015). KOF Factbook Education System Singapore. KOF Factbook Education System Series, ed. 1. Retrieved from: https://www.kof.ethz.ch/en/publications/kof-factbooks-education-system/.

98
KOF Swiss Economic Institute (2016). KOF Youth Labour Market Index. Retrieved from: http://www.kof.ethz.ch/en/indikatoren/ylm-index.
Kuczera, M., Kis, V. and G. Wurzburg (2009). Learning for Jobs: Korea. OECD Reviews of Vocational Education and Training. Paris: OECD Publishing. Retrieved from: http://www.oecd.org/korea/42689417.pdf.
Lee, E. and E. Young (2003). Pioneering the Community College Movement in Hong Kong. In: International Journal of Lifelong Education, 22(3), p. 147-158.
Lee, W. (2014). Opening Up a Road to Somewhere: Development of Associate Degree Students in Hong Kong. In: International Journal of Lifelong Education, 33(5), p. 1-18.
Loi, S. (2015). Leading and Governing for Sustainable Outcomes. The ITE Singapore Model. Singapore: International TVET Conference 2015.
Luhmann, N. (1988). Doppelkreislauf im Wirtschaftssystem. In: Luhmann, N. Die Wirtschaft der Gesellschaft. Frankfurt a. M., p. 131–150.
MEXT (2016): Statistics on Japanese High Schools, Ministry of Education, Culture, Sports, Science and Technology, Japan. Retrieved from: http://www.mext.go.jp/a_menu/shotou/shinkou/genjyo/021201.htm
MOE Ministry of Education Singapore (2015a). Bringing Out the Best in Every Child. Education in Singapore. Retrieved from: https://www.moe.gov.sg/docs/default-source/document/about/files/moe-corporate-brochure.pdf.
MOE Ministry of Education Singapore (2015b). Education Statistics Digest 2015. Singapore. Retrieved from: https://www.moe.gov.sg/about/publications/education-statistics.
MOE Ministry of Education Singapore (2015c). Post-Secondary Education. Bringing out Your Best with Different Learning Styles. Retrieved from: https://www.moe.gov.sg/docs/default-source/document/education/post-secondary/files/post-secondary-brochure.pdf.
MOE Taiwan (2012). Technological and Vocational Education in Taiwan, Republic of China, Ministry of Education, Taiwan. Retrieved from: http://www.studyintaiwan.org/album/v4_publications/5254f7bd7b0ec.pdf
MOE Taiwan (2013). Education in Taiwan 2013-2014, Republic of China, Ministry of Education, Taiwan. Retrieved from: https://stats.moe.gov.tw/files/ebook/Education_in_Taiwan/2013-2014_Education_in_Taiwan.pdf
MoECS (2011). Overcoming School Failure. Ministry of Education, Culture and Science of the Netherlands. Retrieved from: http://www.oecd.org/edu/school/49528317.pdf.
MoECS (2014a). Key Figures 2009-2013. Ministry of Education, Culture and Science of the Netherlands. Retrieved from: https://www.government.nl/documents/reports/2014/08/12/key-figures-2009-2013-ministry-of-education-culture-and-science.
MoECS (2015a). Senior general secondary education (HAVO) and pre university education (VWO). Ministry of Education, Culture and Science of the Netherlands. Retrieved from: https://www.government.nl/topics/secondary-education/contents/senior-general-secondary-education-havo-and-pre-university-education-vwo.
MoECS (2015b). Pre-vocational secondary education (VMBO). Ministry of Education, Culture and Science of the Netherlands. Retrieved from: https://www.government.nl/topics/secondary-education/contents/pre-vocational-secondary-education-vmbo.
MoECS (2015c). Secondary Vocational Education (MBO). Ministry of Education, Culture and Science of the Netherlands. Retrieved from: https://www.government.nl/topics/secondary-vocational-education-mbo-and-higher-education/contents/secondary-vocational-education-mbo.

99
MoECS (2015d). Financiering beroepsonderwijs en volwasseneneducatie. Ministry of Education, Culture and Science of the Netherlands. Retrieved from: https://www.rijksoverheid.nl/onderwerpen/financiering-onderwijs/inhoud/financiering-middelbaar-beroepsonderwijs-en-volwasseneneducatie.
MoECS (2015e). The inspection process of the Dutch Inspectorate of Education. Ministry of Education, Culture and Science of the Netherlands. Retrieved from: http://www.onderwijsinspectie.nl/english/the-inspection-process-of-the-dutch-inspectorate-of-education.
OECD Organisation for Economic Co-operation and Development (2010). Learning for Jobs: OECD Reviews of Vocational Education and Training – Options for China. OECD Publishing. Retrieved from: http://www.oecd.org/edu/skills-beyond-school/45486493.pdf
OECD Organisation for Economic Co-operation and Development (2011). Singapore: Rapid Improvement Followed by Strong Performance. In: Lessons from PISA for the United States. OECD Publishing, p. 159–176. Retrieved from: http://dx.doi.org/10.1787/9789264096660-8-en.
OECD Organisation for Economic Co-operation and Development (2013). OECD Reviews of Vocational Education and Training. A Skills beyond School Commentary on Iceland. OECD Publishing. Retrieved from: https://www.oecd.org/edu/skills-beyond-school/ASkillsBeyondSchoolCommentaryOnIceland.pdf
OECD Organisation for Economic Co-operation and Development (2014). OECD Economic Surveys: Denmark 2013. OECD Publishing. Retrieved from: http://www.oecd-ilibrary.org/docserver/download/ 1013211e.pdf?expires=1449051893&id=id&accname=ocid72024074a&checksum=EC6D465D9A5714AF0E8F61B93B81C07E (accessed December 2, 2015).
OECD Organisation for Economic Co-operation and Development (2014). PISA 2012 Results in Focus: What 15-year-olds know and what they can do with what they know. OECD Publishing. Retrieved from: http://www.oecd.org/pisa/keyfindings/pisa-2012-results-overview.pdf.
OECD Organisation for Economic Co-operation and Development (2015), Education at a Glance 2015: OECD Indicators. OECD Publishing. Retrieved from: http://dx.doi.org/10.1787/eag-2015-en (accessed April 6, 2016).
OECD Organisation for Economic Co-operation and Development (2016). Education GPS. OECD Publishing. Retrieved from: http://gpseducation.oecd.org/Content/MapOfEducationSystem/DNK/DNK_2011_EN.pdf.
OECD Organisation for Economic Co-operation and Development (2016). Netherlands 2016: Foundations for the Future, OECD Publishing, Paris. DOI: http://dx.doi.org/10.1787/9789264257658-en
OPET Federal Office for Professional Education and Technology (2012).Entering the Labour Market. Report on Measures to Ease the Transition to Upper-secondary Level. Berne: OPET.
Palmer, R. (2007). Skills for Work? From Skills Development to Decent Livelihoods in Ghana's Rural Informal Economy. In: International Journal of Educational Development, 27(4), p. 397-420.
Park, Y., Jang, M. H., Yoon, H. J, and D. S. Choi (2014). Historical Overview and Recent Trends in Secondary Vocational Education. In: Park, Y. and M. H. Jang (Ed.). The Present and Future of Secondary Vocational Education. Seoul: KRIVET Korea Research Institute for Vocational Education and Training, p. 39-54. Retrieved from: http://eng.krivet.re.kr/eu/zc/prg_euZ_prA.jsp?dv=G&gn=M06|M060000064|1.
RDC (2015). The Law on Secondary Education. Rijksdienst Dutch Caribbean. Retrieved from: https://www.rijksdienstcn.com/rijksdienstcn.com/up1/ZuubdtuIgU_04-0_De_Wet_Voortgezet_Onderwijs_BES_ENG.pdf.
100
Renold, U., Bolli, T, Egg, M, and F. Pusterla (2014). On the Multiple Dimensions of Youth Labour Markets, KOF Studies, 51. Zurich.
Ryan, P., Backes-Gellner, U., Teuber, S., and Wagner, K. (2013). Apprentice pay in Britain, Germany and Switzerland: Institutions, market forces and market power. European Journal of Industrial Relations, 19(3), 201-220.
Rolls, S. (2014). Denmark: VET in Europe – Country Report. Luxembourg: Publications Office of the European Union.
SBB (2015). Partners onderwijs en bedrijfsleven. Beroepsonderwijs Bedrijfsleven. Retrieved from: https://www.s-bb.nl/over-sbb/partners-onderwijs-en-bedrijfsleven.
SBB (2016). Veranderingen 2015. Beroepsonderwijs Bedrijfsleven. Retrieved from: https://www.s-bb.nl/veranderingen-2015.
SERI State Secretariat for Education, Research and Innovation (2015). Vocational and Professional Education and Training in Switzerland. Facts and Figures 2015. Retrieved from: http://www.sbfi.admin.ch/aktuell/medien/00483/01323/?lang=en.
SERI State Secretariat for Education, Research and Innovation (2016). Vocational and Professional Education and Training in Switzerland. Facts and Figures 2016. Retrieved from: http://www.sbfi.admin.ch/aktuell/medien/00483/01323/?lang=en.
SFSO Swiss Federal Statistical Office (2015). Education and Science. Retrieved from: http://www.bfs.admin.ch/bfs/portal/en/index/themen/15.html.
SKBF Swiss Coordination Centre for Research in Education (2014). Swiss Education Report 2014. Retrieved from: http://skbf-csre.ch/fileadmin/files/pdf/bildungsmonitoring/Swiss_Education_Report_2014.pdf.
Statistics Denmark (2016). Statistics on full-time education. Retrieved from: http://www.dst.dk/en/Statistik/emner/fuldtidsuddannelser.
Strupler, M. and S.C. Wolter (2012). Die duale Lehre eine Erfolgsgeschichte – auch für Betriebe. Ergebnisse der dritten Kosten-Nutzen-Erhebung der Lehrlingsausbildung aus der Sicht der Betriebe. Rüegger Verlag: Glarus/Chur.
Study Start (2015). Academy Profession Degree. Retrieved from: http://studystart.eu/programme-type/academic-programme/.
Tam, M. (2013). Increasing Professionalization and Vocationalization of Continuing Education in Hong Kong: Trends and Issues. In: International Journal of Lifelong Education, 32(6), p. 741-756.
Tan, J. P., Lee, K. H., Valerio, A., and R. McGough (2012). What Matters in Workforce Development: An Analytical Framework for the Pilot Phase. Washington, DC: World Bank. Retrieved from: http://siteresources.worldbank.org/EDUCATION/Resources/278200-1290520949227/7575842-1336502112143/SABER_WfD_Framework_Paper_9-07-12.pdf.
UKCES (2013). The VET System in the Netherlands. UK Commission for Employment and Skills.
UNESCO United Nations Educational, Scientific and Cultural Organization (2011). International Standard Classification of Education ISCED 2011. UNESCO Institute for Statistics. Retrieved from: http://www.uis.unesco.org/Education/ Documents/isced-2011-en.pdf.
UNESCO United Nations Educational, Scientific and Cultural Organization (2016). ISCED Mappings, Singapore. Retrieved from: http://www.uis.unesco.org/Education/ISCEDMappings/Pages/default.aspx.
Van Leeuwen, B., Thijs, A., and M. Zandbergen (2008). Inclusive Education in the Netherlands. Enschede: Netherlands Institute for Curriculum Development.
101
Van Liemt, G. (2014). Business and Initial VET in the Netherlands: A Schematic Overview. Working Paper No. 307. Geneva: International Labour Office ILO. Retrieved from: http://www.ilo.org/wcmsp5/groups/ public/@ed_dialogue/@sector/documents/publication/wcms_344805.pdf
VTC Vocational Training Council (2016). Website. Retrieved from: http://www.vtc.edu.hk/html/en/.
VTC Vocational Training Council (2006). Training Boards and General Committees. Retrieved from: http://www.proact.edu.hk/vtc/web/template/ trainingBoardDual.jsp?fldr_id=207.
Waters, J. and M. Leung (2014). These Are Not the Best Students: Continuing Education, Transnationalisation and Hong Kong's Young Adult ‘Educational Non-Elite’. In: Children's Geographies, 12(1, p. 56-69.
WENR World Education News and Reviews (2013). Secondary Education in Hong Kong. Retrieved from: http://wenr.wes.org/2013/01/wenr-januaryfebruary-2013-hong-kong-secondary-education.
World Bank (2012). SABER Workforce Development Country Report: Singapore 2012 (English). Retrieved from: http://saber.worldbank.org/index.cfm?indx=9&pd=7.
World Bank (2013a). What Matters for Workforce Development: A Framework and Tool for Analysis, SABER Working Paper Series. Retrieved from: http://saber.worldbank.org/index.cfm?indx=14.
World Bank (2013b). SABER Workforce Development Country Report: Republic of Korea 2013 (English). Retrieved from: http://saber.worldbank.org/index.cfm?indx=9&pd=7.
World Bank (2014). SABER Workforce Development Country Report: China Xinjiang Province 2014 (English). Retrieved from: at http://saber.worldbank.org/index.cfm?indx=9&pd=7.
World Bank (2016). World Bank Open Data. Official Entrance Age to Primary Education (years). Retrieved from: http://data.worldbank.org/indicator/SE.PRM.AGES.
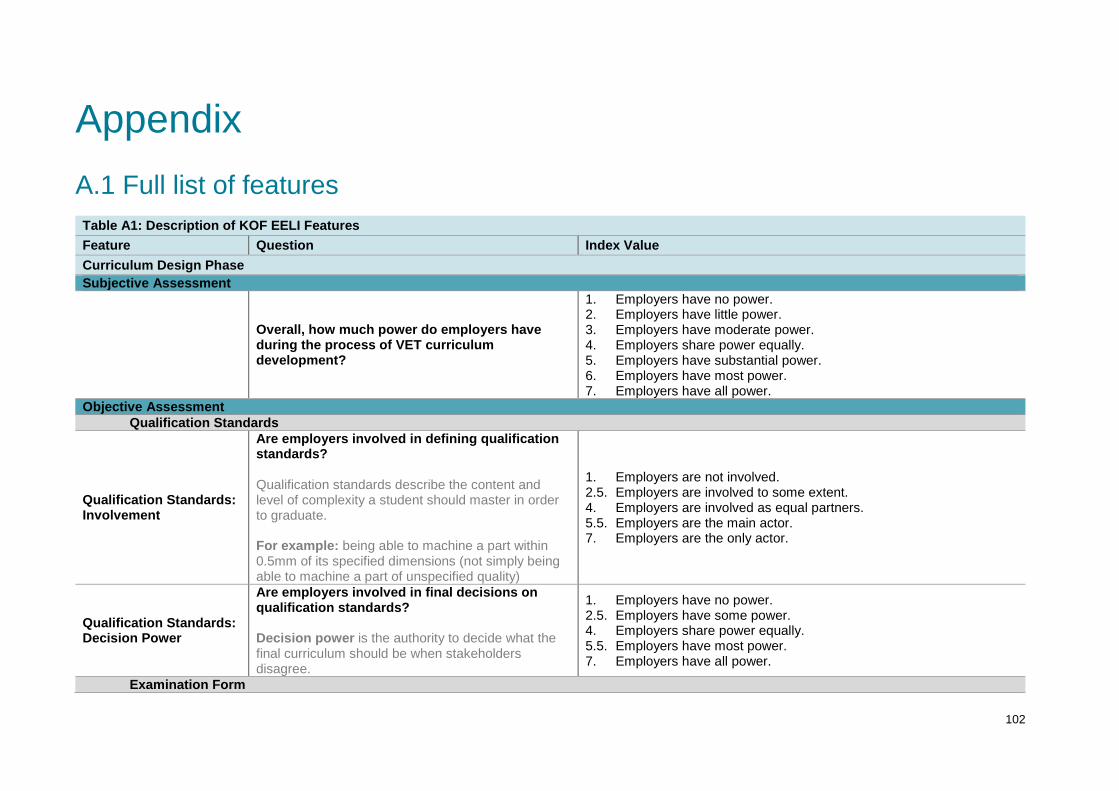
102
Appendix A.1 Full list of features Table A1: Description of KOF EELI Features Feature Question Index Value Curriculum Design Phase Subjective Assessment
Overall, how much power do employers have during the process of VET curriculum development?
1. Employers have no power. 2. Employers have little power. 3. Employers have moderate power. 4. Employers share power equally. 5. Employers have substantial power. 6. Employers have most power. 7. Employers have all power.
Objective Assessment Qualification Standards
Qualification Standards: Involvement
Are employers involved in defining qualification standards? Qualification standards describe the content and level of complexity a student should master in order to graduate. For example: being able to machine a part within 0.5mm of its specified dimensions (not simply being able to machine a part of unspecified quality)
1. Employers are not involved. 2.5. Employers are involved to some extent. 4. Employers are involved as equal partners. 5.5. Employers are the main actor. 7. Employers are the only actor.
Qualification Standards: Decision Power
Are employers involved in final decisions on qualification standards? Decision power is the authority to decide what the final curriculum should be when stakeholders disagree.
1. Employers have no power. 2.5. Employers have some power. 4. Employers share power equally. 5.5. Employers have most power. 7. Employers have all power.
Examination Form
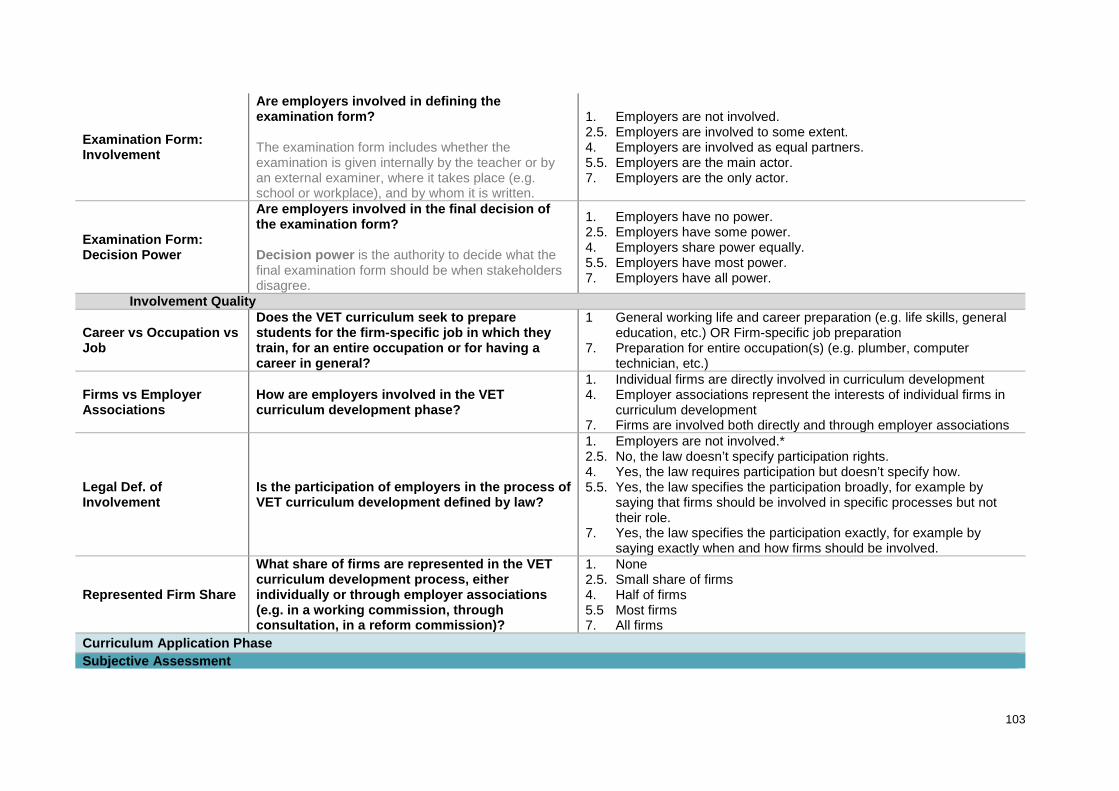
103
Examination Form: Involvement
Are employers involved in defining the examination form? The examination form includes whether the examination is given internally by the teacher or by an external examiner, where it takes place (e.g. school or workplace), and by whom it is written.
1. Employers are not involved. 2.5. Employers are involved to some extent. 4. Employers are involved as equal partners. 5.5. Employers are the main actor. 7. Employers are the only actor.
Examination Form: Decision Power
Are employers involved in the final decision of the examination form? Decision power is the authority to decide what the final examination form should be when stakeholders disagree.
1. Employers have no power. 2.5. Employers have some power. 4. Employers share power equally. 5.5. Employers have most power. 7. Employers have all power.
Involvement Quality
Career vs Occupation vs Job
Does the VET curriculum seek to prepare students for the firm-specific job in which they train, for an entire occupation or for having a career in general?
1 General working life and career preparation (e.g. life skills, general education, etc.) OR Firm-specific job preparation
7. Preparation for entire occupation(s) (e.g. plumber, computer technician, etc.)
Firms vs Employer Associations
How are employers involved in the VET curriculum development phase?
1. Individual firms are directly involved in curriculum development 4. Employer associations represent the interests of individual firms in
curriculum development 7. Firms are involved both directly and through employer associations
Legal Def. of Involvement
Is the participation of employers in the process of VET curriculum development defined by law?
1. Employers are not involved.* 2.5. No, the law doesn’t specify participation rights. 4. Yes, the law requires participation but doesn’t specify how. 5.5. Yes, the law specifies the participation broadly, for example by
saying that firms should be involved in specific processes but not their role.
7. Yes, the law specifies the participation exactly, for example by saying exactly when and how firms should be involved.
Represented Firm Share
What share of firms are represented in the VET curriculum development process, either individually or through employer associations (e.g. in a working commission, through consultation, in a reform commission)?
1. None 2.5. Small share of firms 4. Half of firms 5.5 Most firms 7. All firms
Curriculum Application Phase Subjective Assessment
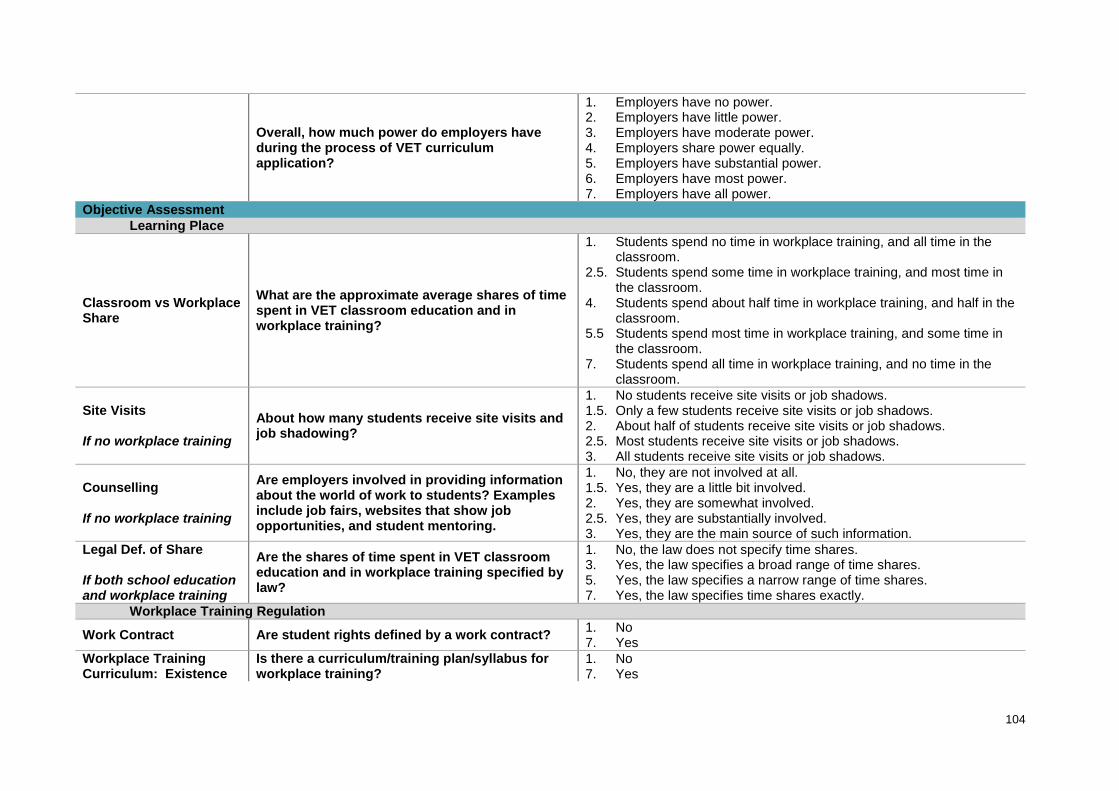
104
Overall, how much power do employers have during the process of VET curriculum application?
1. Employers have no power. 2. Employers have little power. 3. Employers have moderate power. 4. Employers share power equally. 5. Employers have substantial power. 6. Employers have most power. 7. Employers have all power.
Objective Assessment Learning Place
Classroom vs Workplace Share
What are the approximate average shares of time spent in VET classroom education and in workplace training?
1. Students spend no time in workplace training, and all time in the classroom.
2.5. Students spend some time in workplace training, and most time in the classroom.
4. Students spend about half time in workplace training, and half in the classroom.
5.5 Students spend most time in workplace training, and some time in the classroom.
7. Students spend all time in workplace training, and no time in the classroom.
Site Visits If no workplace training
About how many students receive site visits and job shadowing?
1. No students receive site visits or job shadows. 1.5. Only a few students receive site visits or job shadows. 2. About half of students receive site visits or job shadows. 2.5. Most students receive site visits or job shadows. 3. All students receive site visits or job shadows.
Counselling If no workplace training
Are employers involved in providing information about the world of work to students? Examples include job fairs, websites that show job opportunities, and student mentoring.
1. No, they are not involved at all. 1.5. Yes, they are a little bit involved. 2. Yes, they are somewhat involved. 2.5. Yes, they are substantially involved. 3. Yes, they are the main source of such information.
Legal Def. of Share If both school education and workplace training
Are the shares of time spent in VET classroom education and in workplace training specified by law?
1. No, the law does not specify time shares. 3. Yes, the law specifies a broad range of time shares. 5. Yes, the law specifies a narrow range of time shares. 7. Yes, the law specifies time shares exactly.
Workplace Training Regulation Work Contract Are student rights defined by a work contract? 1. No
7. Yes Workplace Training Curriculum: Existence
Is there a curriculum/training plan/syllabus for workplace training?
1. No 7. Yes
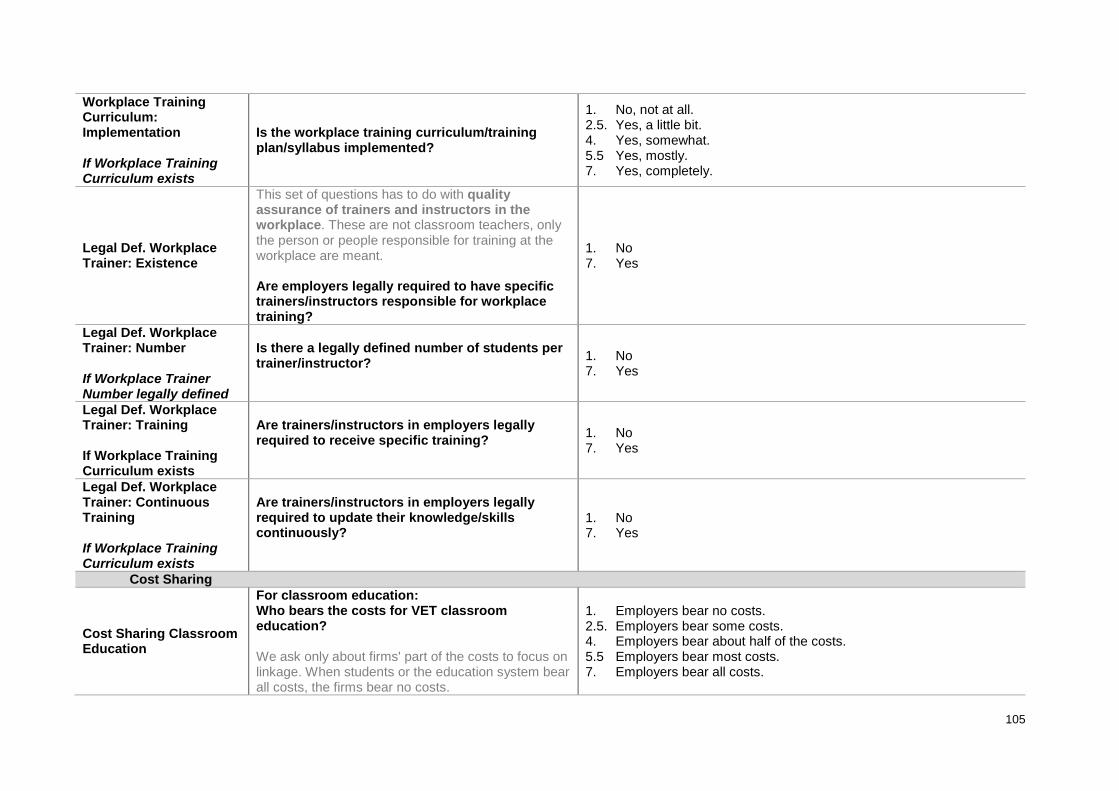
105
Workplace Training Curriculum: Implementation If Workplace Training Curriculum exists
Is the workplace training curriculum/training plan/syllabus implemented?
1. No, not at all. 2.5. Yes, a little bit. 4. Yes, somewhat. 5.5 Yes, mostly. 7. Yes, completely.
Legal Def. Workplace Trainer: Existence
This set of questions has to do with quality assurance of trainers and instructors in the workplace. These are not classroom teachers, only the person or people responsible for training at the workplace are meant. Are employers legally required to have specific trainers/instructors responsible for workplace training?
1. No 7. Yes
Legal Def. Workplace Trainer: Number If Workplace Trainer Number legally defined
Is there a legally defined number of students per trainer/instructor?
1. No 7. Yes
Legal Def. Workplace Trainer: Training If Workplace Training Curriculum exists
Are trainers/instructors in employers legally required to receive specific training?
1. No 7. Yes
Legal Def. Workplace Trainer: Continuous Training If Workplace Training Curriculum exists
Are trainers/instructors in employers legally required to update their knowledge/skills continuously?
1. No 7. Yes
Cost Sharing
Cost Sharing Classroom Education
For classroom education: Who bears the costs for VET classroom education? We ask only about firms' part of the costs to focus on linkage. When students or the education system bear all costs, the firms bear no costs.
1. Employers bear no costs. 2.5. Employers bear some costs. 4. Employers bear about half of the costs. 5.5 Employers bear most costs. 7. Employers bear all costs.
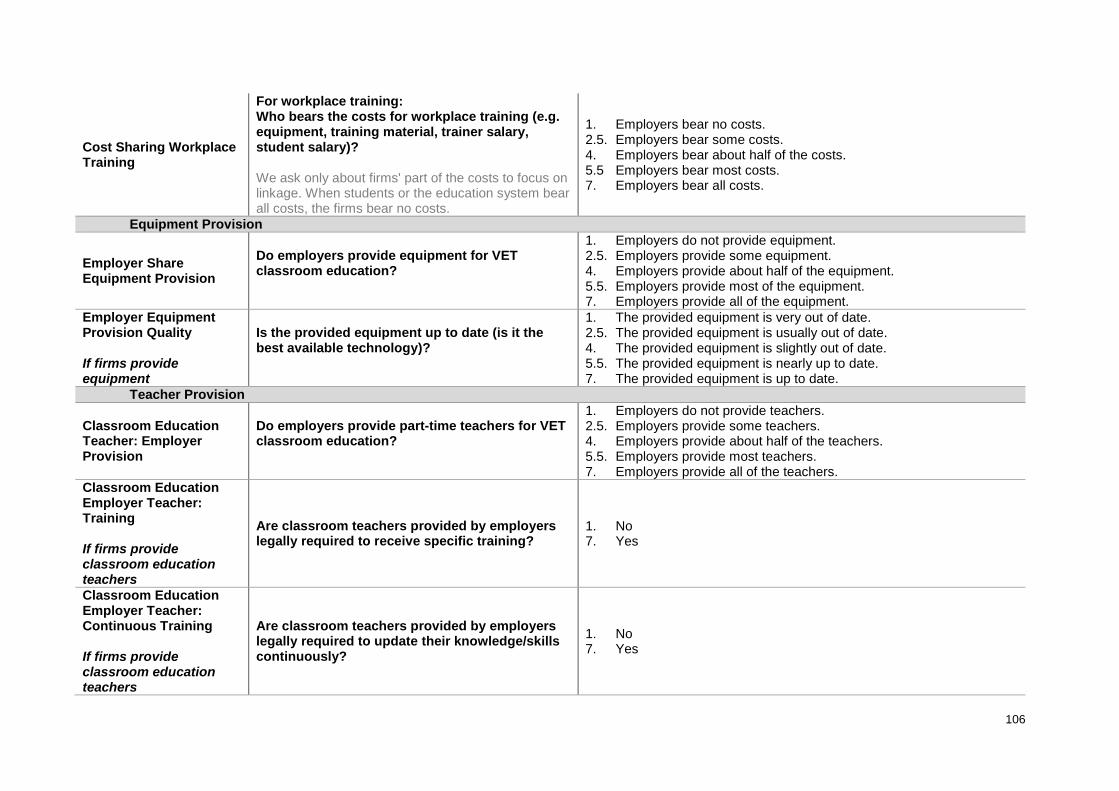
106
Cost Sharing Workplace Training
For workplace training: Who bears the costs for workplace training (e.g. equipment, training material, trainer salary, student salary)? We ask only about firms' part of the costs to focus on linkage. When students or the education system bear all costs, the firms bear no costs.
1. Employers bear no costs. 2.5. Employers bear some costs. 4. Employers bear about half of the costs. 5.5 Employers bear most costs. 7. Employers bear all costs.
Equipment Provision
Employer Share Equipment Provision
Do employers provide equipment for VET classroom education?
1. Employers do not provide equipment. 2.5. Employers provide some equipment. 4. Employers provide about half of the equipment. 5.5. Employers provide most of the equipment. 7. Employers provide all of the equipment.
Employer Equipment Provision Quality If firms provide equipment
Is the provided equipment up to date (is it the best available technology)?
1. The provided equipment is very out of date. 2.5. The provided equipment is usually out of date. 4. The provided equipment is slightly out of date. 5.5. The provided equipment is nearly up to date. 7. The provided equipment is up to date.
Teacher Provision
Classroom Education Teacher: Employer Provision
Do employers provide part-time teachers for VET classroom education?
1. Employers do not provide teachers. 2.5. Employers provide some teachers. 4. Employers provide about half of the teachers. 5.5. Employers provide most teachers. 7. Employers provide all of the teachers.
Classroom Education Employer Teacher: Training If firms provide classroom education teachers
Are classroom teachers provided by employers legally required to receive specific training?
1. No 7. Yes
Classroom Education Employer Teacher: Continuous Training If firms provide classroom education teachers
Are classroom teachers provided by employers legally required to update their knowledge/skills continuously?
1. No 7. Yes

107
Examination
Practical Share of Examination
How much of final grades are defined by the practical part of the examination?
1. They are not defined by the practical part of the examination at all. 2.5. They are defined by the practical part of the examination to some
extent. 4. About half of them are defined by the practical part of the
examination. 5.5. They are defined by the practical part of the examination to the most
part. 7. They are completely defined by the practical part of the
examination.
Practical Examination: Location If practical examination exists
How much of the grade for the practical part of the examination is defined by examination that happens at the workplace?
1. No part of the practical examination grade is tested at the workplace.
2.5. Some of the practical examination grade is tested at the workplace. 4. Half of the practical examination grade is tested at the workplace. 5.5. Most of the practical examination grade is tested at the workplace. 7. All of the practical examination grade is tested at the workplace.
Practical Examination: Employer Expert Share If practical examination exists
What share of experts in the practical part of the examination are provided by employers?
1. Employers provide no experts. 2.5. Employers provide some experts. 4. Employers provide about half of the experts. 5.5. Employers provide most experts. 7. Employers provide all of the experts.
Practical Examination: External Supervision If practical examination takes place at workplace
Is the exam overseen or given by experts from outside the learning place (e.g. members of national or regional commissions)?
1. No 7. Yes
Curriculum Feedback Phase Subjective Assessment
Overall, how much power do employers have during the process of VET curriculum feedback?
1. Employers have no power. 2. Employers have little power. 3. Employers have moderate power. 4. Employers share power equally. 5. Employers have substantial power. 6. Employers have most power. 7. Employers have all power.
Objective Assessment Information Gathering

108
Employer Surveys
Are there any surveys asking employers whether graduates of the VET program perform well in the workplace? For example: Do graduate Web-designers really know how to design a website on their own? Do graduates generally perform well in the workplace?
1. No 7. Yes
Labor Force Surveys
Are there any labor force surveys on how graduates of the VET program fare on the labor market? For example: Do graduating web designers find jobs? Do they go on to work in the web design industry?
1. No 7. Yes
Update Timing
Employer Involvement To what extent are employers involved in deciding when updates are necessary?
1. Employers are not involved at all. 2.5. Employers are involved to some extent. 4. Employers are involved as equal partners. 5.5. Employers are the main actor. 7. Employers are the only actor.
Legal Def. Employer Involvement If firms involved
Is the involvement of employers in deciding when updates are necessary defined by law?
1. Employers are not involved at all.* 2.5. No, the law doesn’t specify participation rights. 4. Yes, the law requires participation but doesn’t specify how. 5.5. Yes, the law specifies the participation broadly. 7. Yes, the law specifies the participation exactly.
*This answer category comes from the filter question, hence the different and rather inappropriate wording.

109
A.2 Weighting This section discusses the weighting scheme used to calculate the KOF EELI. The weighting scheme differs depending on whether we calculate the KOF EELI based on the subjective evaluation of EEL in each curriculum value chain phase or whether we use the semi-objective calculation methodology which calculates the KOF EELI based on the measured features of each phase.
We label the former the semi-objective calculation methodology because information regarding features such as the legal definition of employer involvement in the curriculum design phase, the share of classroom and workplace training and the existence of employer surveys regarding program outcomes represent objective information. However, the responses to the feature evaluation also contain some subjectivity due to four reasons. First, we survey some features, such as the involvement intensity of employers in the curriculum design phase, in a subjective manner. Second, in order to facilitate responses, we survey shares, for example the share of classroom and workplace training, in categories rather than numbers. Third, experts might differ in the quality of knowledge about the VET program, which creates measurement error in the responses that can be interpreted as subjectivity. Fourth, we survey experts regarding a program on country level, asking them to provide an approximation of the average situation across country and occupation. To the extent that programs differ within a country or within curricula, this process of mental averaging might differ, introducing further subjectivity into the measure. The resulting subjectivity can be illustrated by the fact that substantial heterogeneity of assessments within a country exists. Therefore, Chapter 3.1.5 discusses this issue of within-country heterogeneity of expert assessments.
In the case of the subjective calculation methodology, the calculation of the index requires only one aggregation step, namely the aggregation of the curriculum design, application and feedback phase into the KOF EELI. Our starting point is the so-called Equal weighting scheme, which simply uses equal weights for each of the three dimensions.
In order to determine the weights of the three dimensions based on empirical evidence, we asked experts to distribute 100% across these dimensions regarding how important the collaboration between actors of the education and employment system is in each of these dimensions. We label the corresponding weighting scheme Single. Figure A2.1 shows the results for each country in addition to the mean weights across country. The later suggest that according to the judgment of the surveyed experts, EEL is most important in the curriculum design phase with a value of 42%, followed by the curriculum application phase with 34% and the curriculum feedback phase with 24%. Hence, the data-driven Single weighting scheme differs from the Equal weighting scheme by increasing the weight of the curriculum design phase at the expense of the curriculum feedback phase.
Figure A2.1 further shows that the assessments differ substantially across countries. However, the average among experts of the six focus-countries agree that EEL is most important in the curriculum design phase, followed by the curriculum application and finally the curriculum feedback phase. The weights assigned by experts of non-focus countries differ more substantially. The curriculum application phase receives the highest weight in Austria, Shanghai (CN), Finland, Norway and Poland. Furthermore, the curriculum feedback phase has higher weight than the curriculum application phase in Denmark, Estonia, Iceland and Taiwan. However, the small variation across focus-countries suggests that these deviations reflect measurement error due to the small sample size rather than substantive variation in the evaluation59.
Since the experts of focus countries represent the main part of the respondents and focus-country experts agree on the relative weights of the three CVC phases, it is not surprising that the average weights across experts takes similar values as the weights across countries. Concretely, the weights across experts amount to 43%, 31% and 26% in the curriculum design, application and feedback phase, respectively.
59 Using country-specific weights yields the same results of the KOF EELI.
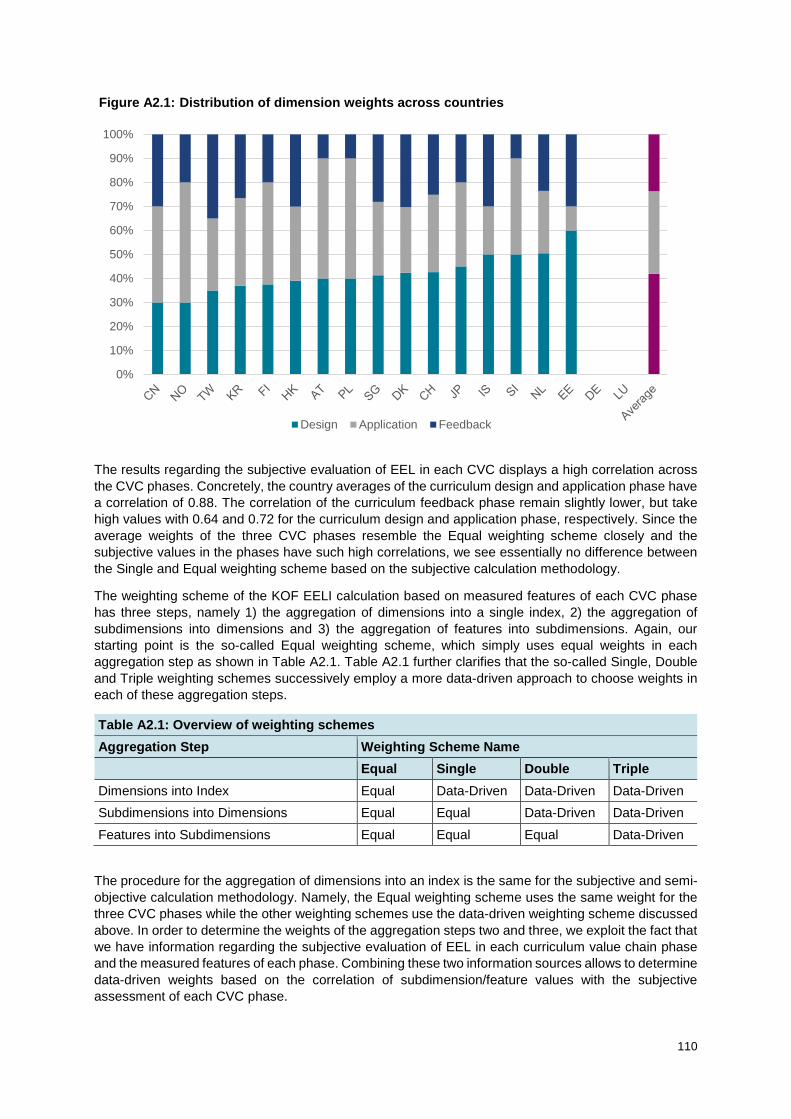
110
The results regarding the subjective evaluation of EEL in each CVC displays a high correlation across the CVC phases. Concretely, the country averages of the curriculum design and application phase have a correlation of 0.88. The correlation of the curriculum feedback phase remain slightly lower, but take high values with 0.64 and 0.72 for the curriculum design and application phase, respectively. Since the average weights of the three CVC phases resemble the Equal weighting scheme closely and the subjective values in the phases have such high correlations, we see essentially no difference between the Single and Equal weighting scheme based on the subjective calculation methodology.
The weighting scheme of the KOF EELI calculation based on measured features of each CVC phase has three steps, namely 1) the aggregation of dimensions into a single index, 2) the aggregation of subdimensions into dimensions and 3) the aggregation of features into subdimensions. Again, our starting point is the so-called Equal weighting scheme, which simply uses equal weights in each aggregation step as shown in Table A2.1. Table A2.1 further clarifies that the so-called Single, Double and Triple weighting schemes successively employ a more data-driven approach to choose weights in each of these aggregation steps.
Table A2.1: Overview of weighting schemes Aggregation Step Weighting Scheme Name Equal Single Double Triple Dimensions into Index Equal Data-Driven Data-Driven Data-Driven Subdimensions into Dimensions Equal Equal Data-Driven Data-Driven Features into Subdimensions Equal Equal Equal Data-Driven
The procedure for the aggregation of dimensions into an index is the same for the subjective and semi-objective calculation methodology. Namely, the Equal weighting scheme uses the same weight for the three CVC phases while the other weighting schemes use the data-driven weighting scheme discussed above. In order to determine the weights of the aggregation steps two and three, we exploit the fact that we have information regarding the subjective evaluation of EEL in each curriculum value chain phase and the measured features of each phase. Combining these two information sources allows to determine data-driven weights based on the correlation of subdimension/feature values with the subjective assessment of each CVC phase.
0%
10%
20%
30%
40%
50%
60%
70%
80%
90%
100%
Figure A2.1: Distribution of dimension weights across countries
Design Application Feedback

111
Hence, to obtain the weights of the Double weighting scheme, we regress the subjective evaluation of EEL in each curriculum value chain phase on the calculated values for each corresponding subdimension. The relative size of the resulting coefficients yields information regarding how well each subdimension explains EEL according to the subjective calculation methodology. Hence, calculating the sum of subdimension coefficients allows to present data-driven weights that reflect the relative size of the subdimension coefficients. Similarly, the weights of the Triple weighting scheme result from a regression of the subjective evaluations of EEL in each CVC phase on the calculated values for each corresponding feature.
These regressions can be conducted on either the expert or country level. Estimations on the expert level have the drawback that the data contains more measurement errors. Regressions on the country level have the drawback that the small number of observations limits the precision of estimations and increases the problem of multicollinearity. In this report, we take a long-term perspective that assumes a larger sample of countries for which data of the KOF EELI is available. Hence, we focus on the country-level regressions in our analysis and use the expert level regressions to check the plausibility of the country level regressions only. Nevertheless, we caution the reader to keep in mind the limited sample used in these regressions, suggesting that the resulting estimates should be treated with a grain of salt.
These estimations have two further issues that need to be addressed. The first issue arises because estimations have negative coefficient estimates arising due to multicollinearity of subdimensions and features. In such cases, we replace the corresponding weight by zero in order to avoid that a subdimension or feature enters the index negatively. The second issue arises in the case of the Triple weighting scheme because some features are filtered, e.g. information regarding workplace training regulation only exists for programs that have some share of workplace training. Note that the same issue arises because of item non-response, though this problem has much smaller magnitude in the present application. These missing values suggest that estimations including all individual features restrict the estimation sample substantially. Therefore, the regressions for the curriculum application phase entails five regression variables that collapse multiple features into a single variable using equal weighting. First, we combine the share of classroom and workplace training with the low intensity ways to provide workplace information to students in the form of site visits and career counselling. Second, we aggregate four variables regarding the legal requirements of workplace trainers, namely their existence, their number, their training and their continuous training. Third, we aggregate employer share equipment provision and the quality of the provided equipment. Fourth, we combine the information regarding provision of part-time classroom teachers by employers with the corresponding questions regarding the initial and continuous training received by these part-time teachers. Fifth, we aggregate the features capturing whether practical examination takes place at the workplace and whether these examinations are externally supervised. This approach of aggregating features into a single variable allows to increase the number of observations to a reasonable amount, but has the drawback that the data-driven weighting within the aggregated variable remains unknown. Therefore, we only aggregated variables where necessary to ensure a reasonable sample size.
Tables A2.2, A2.3, and A2.4 display the results of the regression analysis as well as the resulting weights for the curriculum design, application and feedback phase, respectively. Each table consists of four panels. The first and second panels show the weights of subdimensions and features in the final index according to the Equal and Single weighting scheme. The third panel shows the weights resulting from the regression results of the Double weighting scheme, which regresses EEL in the CVC phase on subdimension values. Similarly, the fourth panel shows the regression results and the resulting weights according to the Triple weighting scheme.
Regarding the curriculum design phase, the results of Table A2.2 show that the weights of features increase in the Single weighting scheme compared to the Equal weighting scheme because the weight of the curriculum design phase increases from 33% to 42% as discussed above. Rather surprisingly, the regression results for the Double weighting scheme differ substantially between the expert and country level regressions. While the expert level regressions place higher weight on the qualification standard subdimension, the country level regressions stress the importance of involvement quality. While the Double weighting scheme places equal value on the features within each subdimension, the Triple weighting scheme further differentiates these weights. The results show that both the expert and country level regressions yield similar results as the Single weighting scheme on the level of
112
subdimensions. The qualification standards and involvement quality receive a somewhat higher weight at the cost of the examination form. Looking at the results for the individual features shows surprising negative coefficients of the decision power features, which stems from multicollinearity of the involvement and decision power features. Further note, that the legal definition of employer involvement represents an important predictor of EEL in the curriculum design phase. Furthermore, it matters whether employers are engaged as individual firms or affect the curriculum design phase through an employer association. The represented firm share as well as the orientation of the VET program to prepare for a job, occupation or career on the other hand receive a weight of zero. However, this fails to surprise because these two features display relatively little variation as discussed in the results section.
The results for the curriculum application phase shown in Table A2.3 show that the Single weighting scheme has nearly the same weight of the curriculum application phase as the Equal weighting scheme. Note that the weights appearing in both the Equal and Single weighting scheme are not the same for all feature variables because some of these variables represent aggregates of multiple features to allow a reasonable amount of observations in the Triple weighting scheme. The Double weighting scheme regressions suggest that the Equal weighting scheme places substantially too little emphasis on the learning place subdimension. The data-driven weights of workplace regulation are similar to the Equal weighting scheme. While the expert and country level regressions agree in this respect, they differ substantially regarding cost sharing, which receives a very high weight in the country level but not in the expert level regression, while the equipment provision and examination subdimension receive a higher weight in the expert level regression than in the country level regression. However, both regressions place a zero weight on the teacher provision subdimension. Comparing the expert level and country level regressions, we see more stable estimates in the Triple weighting scheme than in the Double weighting scheme, which resonates the results from the curriculum design phase. The Triple weighting scheme increases the weight of the learning place even more than the Double weighing scheme due to a high weight of the share of classroom education and workplace training. Hence, this feature receives the highest weight in the Triple weighting scheme based on country level regressions, which also increases the weight of the workplace regulation subdimension. The cost sharing and equipment provision subdimension receive a similar weight as in the Equal weighting scheme according to the regressions on expert level, while the regressions on the country level neglect these subdimensions. The teacher provision subdimension has a low weight though the Triple weighting scheme in the country-level regression puts some weight on it. Finally, while the Triple weighting scheme increases the weight of the examination subdimension compared to the Equal weighting scheme, because the expert share provided by employers represents an important feature.
The data-driven weights deviate the strongest from the Equal weighting scheme in the case of the curriculum feedback phase. The experts consider information gathering as largely unimportant and put nearly all emphasis on the involvement of employers in the decision of the update timing. However, since this might reflect the high level of EEL in the analyzed countries, reflected in the low amount of variation in the information gathering subdimension, it will be interesting to see whether these results change in a sample of countries that have a less well developed education system.
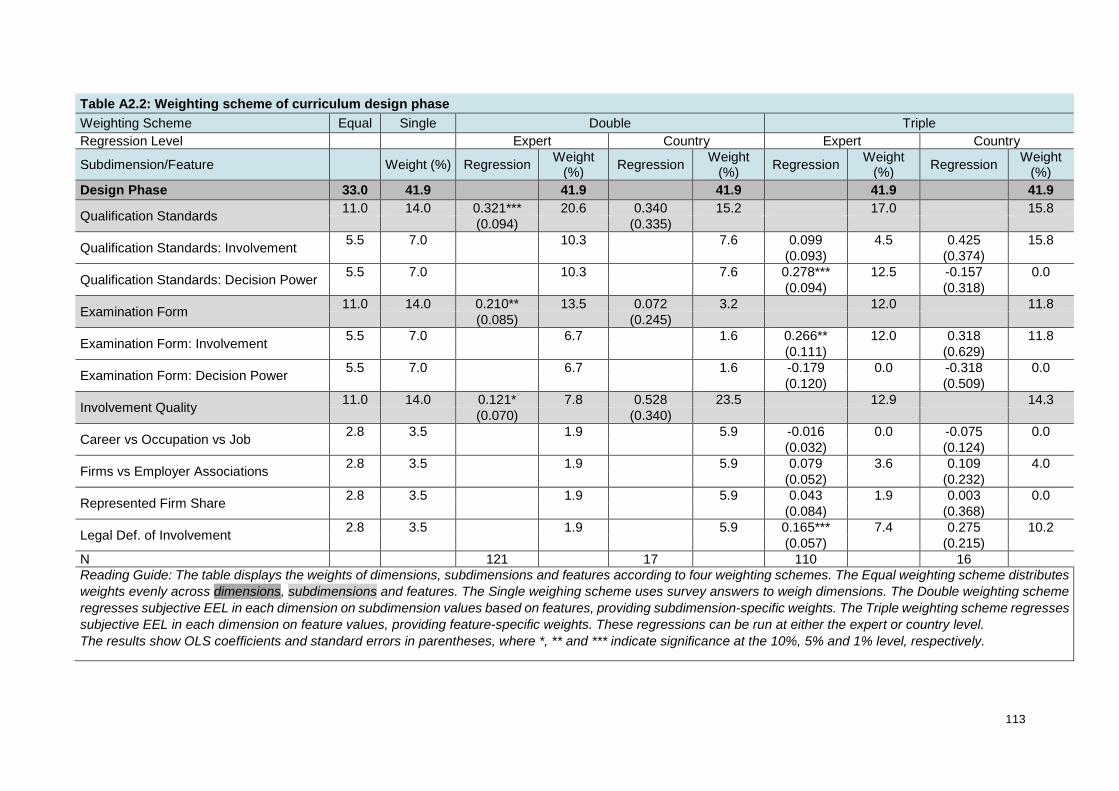
113
Table A2.2: Weighting scheme of curriculum design phase Weighting Scheme Equal Single Double Triple Regression Level Expert Country Expert Country
Subdimension/Feature Weight (%) Regression Weight (%) Regression Weight
(%) Regression Weight (%) Regression Weight
(%) Design Phase 33.0 41.9 41.9 41.9 41.9 41.9
Qualification Standards 11.0 14.0 0.321*** 20.6 0.340 15.2 17.0 15.8 (0.094) (0.335)
Qualification Standards: Involvement 5.5 7.0 10.3 7.6 0.099 4.5 0.425 15.8 (0.093) (0.374)
Qualification Standards: Decision Power 5.5 7.0 10.3 7.6 0.278*** 12.5 -0.157 0.0 (0.094) (0.318)
Examination Form 11.0 14.0 0.210** 13.5 0.072 3.2 12.0 11.8 (0.085) (0.245)
Examination Form: Involvement 5.5 7.0 6.7 1.6 0.266** 12.0 0.318 11.8 (0.111) (0.629)
Examination Form: Decision Power 5.5 7.0 6.7 1.6 -0.179 0.0 -0.318 0.0 (0.120) (0.509)
Involvement Quality 11.0 14.0 0.121* 7.8 0.528 23.5 12.9 14.3 (0.070) (0.340)
Career vs Occupation vs Job 2.8 3.5 1.9 5.9 -0.016 0.0 -0.075 0.0 (0.032) (0.124)
Firms vs Employer Associations 2.8 3.5 1.9 5.9 0.079 3.6 0.109 4.0 (0.052) (0.232)
Represented Firm Share 2.8 3.5 1.9 5.9 0.043 1.9 0.003 0.0 (0.084) (0.368)
Legal Def. of Involvement 2.8 3.5 1.9 5.9 0.165*** 7.4 0.275 10.2 (0.057) (0.215)
N 121 17 110 16 Reading Guide: The table displays the weights of dimensions, subdimensions and features according to four weighting schemes. The Equal weighting scheme distributes weights evenly across dimensions, subdimensions and features. The Single weighing scheme uses survey answers to weigh dimensions. The Double weighting scheme regresses subjective EEL in each dimension on subdimension values based on features, providing subdimension-specific weights. The Triple weighting scheme regresses subjective EEL in each dimension on feature values, providing feature-specific weights. These regressions can be run at either the expert or country level. The results show OLS coefficients and standard errors in parentheses, where *, ** and *** indicate significance at the 10%, 5% and 1% level, respectively.
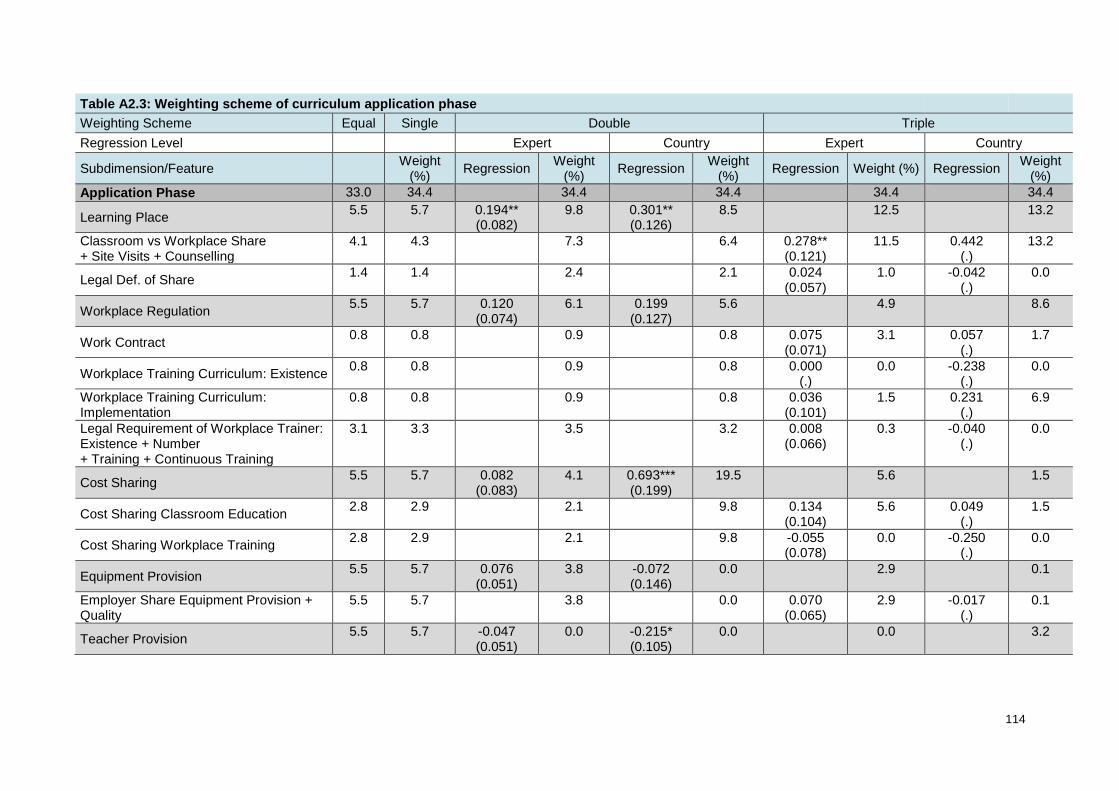
114
Table A2.3: Weighting scheme of curriculum application phase Weighting Scheme Equal Single Double Triple Regression Level Expert Country Expert Country
Subdimension/Feature Weight (%) Regression Weight
(%) Regression Weight (%) Regression Weight (%) Regression Weight
(%) Application Phase 33.0 34.4 34.4 34.4 34.4 34.4
Learning Place 5.5 5.7 0.194** (0.082)
9.8 0.301** (0.126)
8.5 12.5 13.2
Classroom vs Workplace Share + Site Visits + Counselling
4.1 4.3 7.3 6.4 0.278** (0.121)
11.5 0.442 (.)
13.2
Legal Def. of Share 1.4 1.4 2.4 2.1 0.024 (0.057)
1.0 -0.042 (.)
0.0
Workplace Regulation 5.5 5.7 0.120 (0.074)
6.1 0.199 (0.127)
5.6 4.9 8.6
Work Contract 0.8 0.8 0.9 0.8 0.075 (0.071)
3.1 0.057 (.)
1.7
Workplace Training Curriculum: Existence 0.8 0.8 0.9 0.8 0.000 (.)
0.0 -0.238 (.)
0.0
Workplace Training Curriculum: Implementation
0.8 0.8 0.9 0.8 0.036 (0.101)
1.5 0.231 (.)
6.9
Legal Requirement of Workplace Trainer: Existence + Number + Training + Continuous Training
3.1 3.3 3.5 3.2 0.008 (0.066)
0.3 -0.040 (.)
0.0
Cost Sharing 5.5 5.7 0.082 (0.083)
4.1 0.693*** (0.199)
19.5 5.6 1.5
Cost Sharing Classroom Education 2.8 2.9 2.1 9.8 0.134 (0.104)
5.6 0.049 (.)
1.5
Cost Sharing Workplace Training 2.8 2.9 2.1 9.8 -0.055 (0.078)
0.0 -0.250 (.)
0.0
Equipment Provision 5.5 5.7 0.076 (0.051)
3.8 -0.072 (0.146)
0.0 2.9 0.1
Employer Share Equipment Provision + Quality
5.5 5.7 3.8 0.0 0.070 (0.065)
2.9 -0.017 (.)
0.1
Teacher Provision 5.5 5.7 -0.047 (0.051)
0.0 -0.215* (0.105)
0.0 0.0 3.2
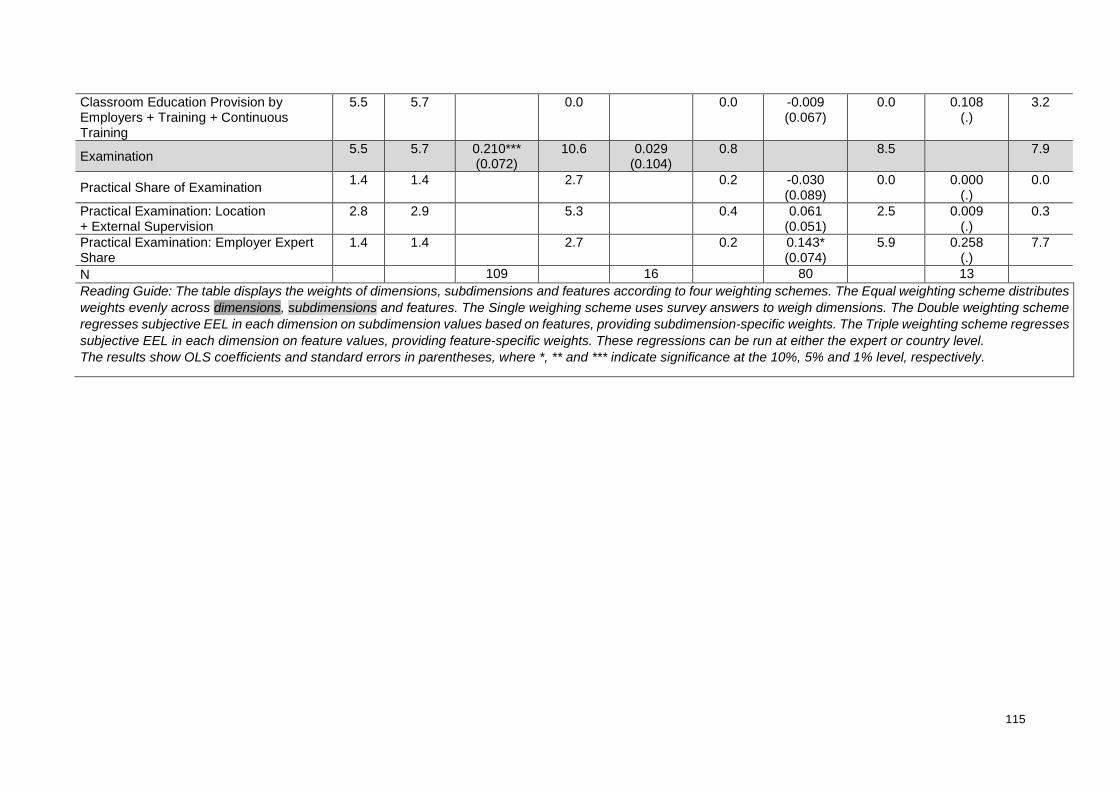
115
Classroom Education Provision by Employers + Training + Continuous Training
5.5 5.7 0.0 0.0 -0.009 (0.067)
0.0 0.108 (.)
3.2
Examination 5.5 5.7 0.210*** (0.072)
10.6 0.029 (0.104)
0.8 8.5 7.9
Practical Share of Examination 1.4 1.4 2.7 0.2 -0.030 (0.089)
0.0 0.000 (.)
0.0
Practical Examination: Location + External Supervision
2.8 2.9 5.3 0.4 0.061 (0.051)
2.5 0.009 (.)
0.3
Practical Examination: Employer Expert Share
1.4 1.4 2.7 0.2 0.143* (0.074)
5.9 0.258 (.)
7.7
N 109 16 80 13 Reading Guide: The table displays the weights of dimensions, subdimensions and features according to four weighting schemes. The Equal weighting scheme distributes weights evenly across dimensions, subdimensions and features. The Single weighing scheme uses survey answers to weigh dimensions. The Double weighting scheme regresses subjective EEL in each dimension on subdimension values based on features, providing subdimension-specific weights. The Triple weighting scheme regresses subjective EEL in each dimension on feature values, providing feature-specific weights. These regressions can be run at either the expert or country level. The results show OLS coefficients and standard errors in parentheses, where *, ** and *** indicate significance at the 10%, 5% and 1% level, respectively.

116
Table A2.4: Weighting scheme of curriculum feedback phase Weighting Scheme Equal Single Double Triple Regression Level Expert Country Expert Country
Subdimension/Feature Weight
(%) Regression Weight (%) Regression Weight
(%) Regression Weight (%) Regression Weight
(%) Feedback 33.0 23.7 23.7 23.7 23.7 23.7
Information Gathering 16.5 11.8 -0.050 (0.049)
0.0 0.018 (0.088)
1.0 2.2 1.2
Employer Surveys 8.3 5.9 0.0 0.5 0.068 (0.052)
2.2 0.016 (0.092)
0.7
Labor Force Surveys 8.3 5.9 0.0 0.5 -0.132** (0.056)
0.0 0.011 (0.119)
0.5
Update Timing 16.5 11.8 0.582*** (0.057)
23.7 0.392*** (0.107)
22.6 21.5 22.5
Employer Involvement 8.3 5.9 11.8 11.3 0.637*** (0.092)
20.7 0.353* (0.170)
15.7
Legal Def. Employer Involvement 8.3 5.9 11.8 11.3 0.023 (0.071)
0.7 0.151 (0.146)
6.7
N 119 15 99 13 Reading Guide: The table displays the weights of dimensions, subdimensions and features according to four weighting schemes. The Equal weighting scheme distributes weights evenly across dimensions, subdimensions and features. The Single weighing scheme uses survey answers to weigh dimensions. The Double weighting scheme regresses subjective EEL in each dimension on subdimension values based on features, providing subdimension-specific weights. The Triple weighting scheme regresses subjective EEL in each dimension on feature values, providing feature-specific weights. These regressions can be run at either the expert or country level. The results show OLS coefficients and standard errors in parentheses, where *, ** and *** indicate significance at the 10%, 5% and 1% level, respectively.

117
In order to assess the consistency of results across these calculation methodologies, Table A2.5 displays correlations of the corresponding KOF EELIs. The results suggest that the correlation between the calculated KOF EELIs are surprisingly high.
Table A2.5: Spearman correlations by calculation method and weighting scheme N=17 Semi-
Objective Semi-Objective
Semi-Objective
Semi-Objective
Semi-Objective
Semi-Objective Subjective
Equal Single Double Expert
Double Country
Triple Expert
Triple Country
Equal
Semi-Objective
Equal 1
Semi-Objective
Single 0.97 1
Semi-Objective
Double Expert 0.86 0.94 1
Semi-Objective
Double Country 0.89 0.94 0.94 1
Semi-Objective
Triple Expert 0.89 0.95 0.98 0.97 1
Semi-Objective
Triple Country 0.85 0.84 0.82 0.89 0.86 1
Subjective Equal 0.70 0.79 0.82 0.83 0.84 0.76 1 Subjective Single 0.67 0.76 0.79 0.81 0.82 0.73 1.00
The lower part of Table A2.5 further compares the KOF EELI based on the subjective evaluation of EEL in each curriculum value chain phase and the KOF EELI based on the measured features of each phase. The results suggest that the correlation between these two calculation methods is relatively high, particularly in the case of Double and Triple weighting, which account for the relative weight of subdimensions and features in the assessment of the experts.
In order to understand the differences between the KOF EELI based on the subjective and semi-objective methodology, Figure A2.2 plots the KOF EELI based on the semi-objective methodology against the KOF EELI subjective methodology. The diagonal line indicates that the two methodologies yield the same value. Most values in Figure A2.2 are close to the diagonal line, validating that the difference between the two methodologies is relatively small. Slovenia deviates slightly, scoring high in the subjective methodology and mediocre in the semi-objective methodology. The semi-objective methodology yields a higher score for Luxembourg, Estonia, Iceland and Poland. These deviations only arise for countries for which we have a small number of observations. Therefore, it is plausible to assume that the deviation reflects measurement error in the subjective measure. Because of that and the high correlation between the subjective and semi-objective measures, we focus on the semi-objective method, which also provides information on the subdimensions and features of the KOF EELI.
AT CH
CN
DE DK
EE FIHK
IS
JP
KRLU NL NO
PL
SG
SITW
1
2
3
4
5
6
7
1 2 3 4 5 6 7
Sem
i-Obj
ectiv
e
Subjective
Figure A2.2: Relationship between subjective and semi-objective method
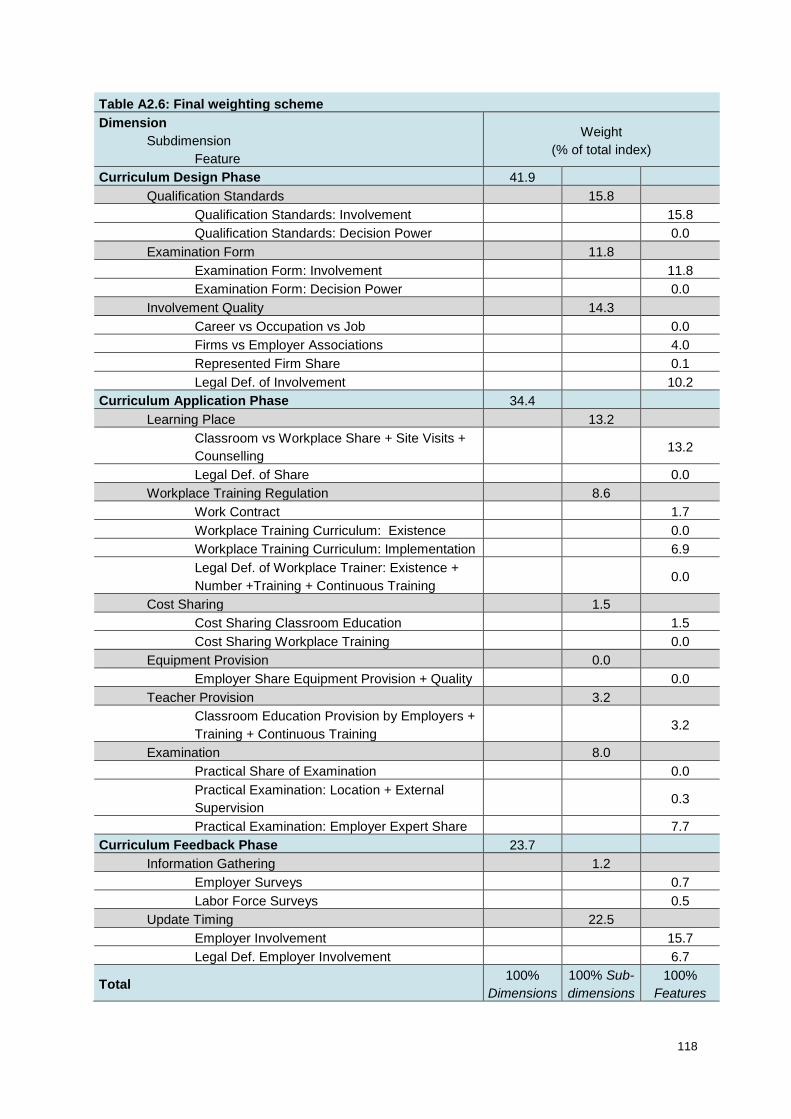
118
Table A2.6: Final weighting scheme Dimension
Subdimension Feature
Weight (% of total index)
Curriculum Design Phase 41.9 Qualification Standards 15.8
Qualification Standards: Involvement 15.8 Qualification Standards: Decision Power 0.0
Examination Form 11.8 Examination Form: Involvement 11.8 Examination Form: Decision Power 0.0
Involvement Quality 14.3 Career vs Occupation vs Job 0.0 Firms vs Employer Associations 4.0 Represented Firm Share 0.1 Legal Def. of Involvement 10.2
Curriculum Application Phase 34.4 Learning Place 13.2
Classroom vs Workplace Share + Site Visits + Counselling 13.2
Legal Def. of Share 0.0 Workplace Training Regulation 8.6
Work Contract 1.7 Workplace Training Curriculum: Existence 0.0 Workplace Training Curriculum: Implementation 6.9 Legal Def. of Workplace Trainer: Existence + Number +Training + Continuous Training
0.0
Cost Sharing 1.5 Cost Sharing Classroom Education 1.5 Cost Sharing Workplace Training 0.0
Equipment Provision 0.0 Employer Share Equipment Provision + Quality 0.0
Teacher Provision 3.2 Classroom Education Provision by Employers + Training + Continuous Training 3.2
Examination 8.0 Practical Share of Examination 0.0 Practical Examination: Location + External Supervision 0.3
Practical Examination: Employer Expert Share 7.7 Curriculum Feedback Phase 23.7
Information Gathering 1.2 Employer Surveys 0.7 Labor Force Surveys 0.5
Update Timing 22.5 Employer Involvement 15.7 Legal Def. Employer Involvement 6.7
Total 100% Dimensions
100% Sub-dimensions
100% Features
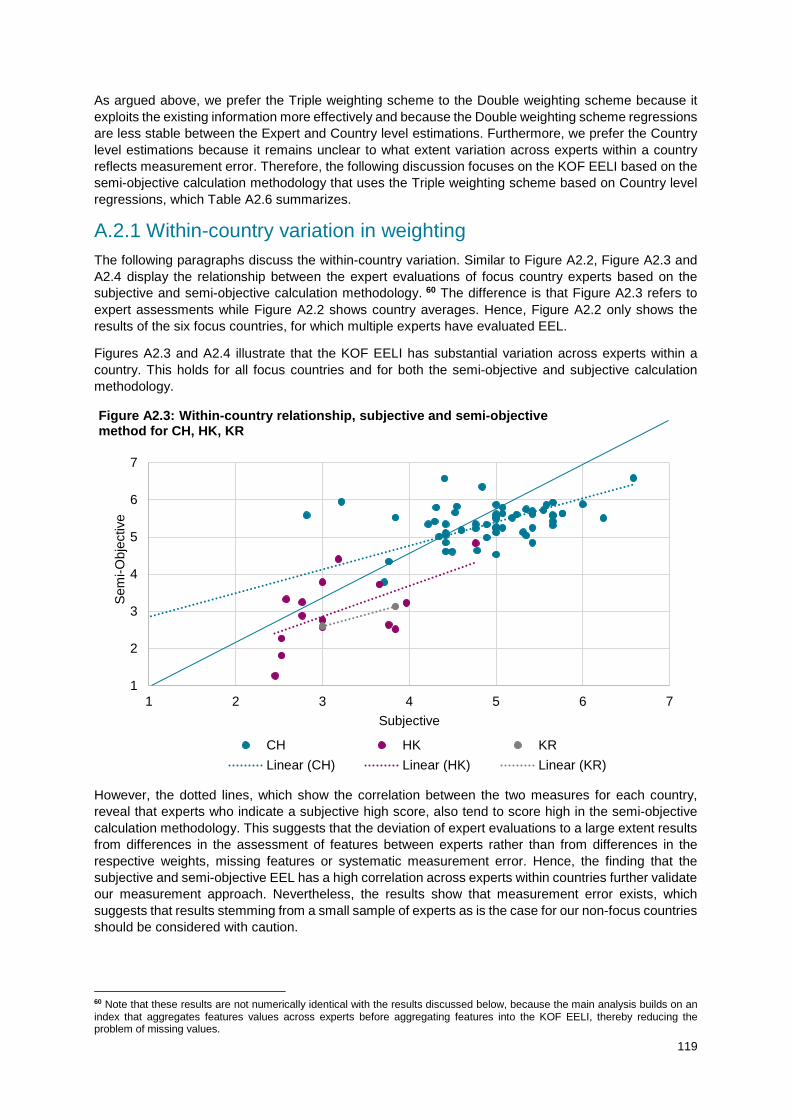
119
As argued above, we prefer the Triple weighting scheme to the Double weighting scheme because it exploits the existing information more effectively and because the Double weighting scheme regressions are less stable between the Expert and Country level estimations. Furthermore, we prefer the Country level estimations because it remains unclear to what extent variation across experts within a country reflects measurement error. Therefore, the following discussion focuses on the KOF EELI based on the semi-objective calculation methodology that uses the Triple weighting scheme based on Country level regressions, which Table A2.6 summarizes.
A.2.1 Within-country variation in weighting The following paragraphs discuss the within-country variation. Similar to Figure A2.2, Figure A2.3 and A2.4 display the relationship between the expert evaluations of focus country experts based on the subjective and semi-objective calculation methodology. 60 The difference is that Figure A2.3 refers to expert assessments while Figure A2.2 shows country averages. Hence, Figure A2.2 only shows the results of the six focus countries, for which multiple experts have evaluated EEL.
Figures A2.3 and A2.4 illustrate that the KOF EELI has substantial variation across experts within a country. This holds for all focus countries and for both the semi-objective and subjective calculation methodology.
However, the dotted lines, which show the correlation between the two measures for each country, reveal that experts who indicate a subjective high score, also tend to score high in the semi-objective calculation methodology. This suggests that the deviation of expert evaluations to a large extent results from differences in the assessment of features between experts rather than from differences in the respective weights, missing features or systematic measurement error. Hence, the finding that the subjective and semi-objective EEL has a high correlation across experts within countries further validate our measurement approach. Nevertheless, the results show that measurement error exists, which suggests that results stemming from a small sample of experts as is the case for our non-focus countries should be considered with caution.
60 Note that these results are not numerically identical with the results discussed below, because the main analysis builds on an index that aggregates features values across experts before aggregating features into the KOF EELI, thereby reducing the problem of missing values.
1
2
3
4
5
6
7
1 2 3 4 5 6 7
Sem
i-Obj
ectiv
e
Subjective
Figure A2.3: Within-country relationship, subjective and semi-objective method for CH, HK, KR
CH HK KRLinear (CH) Linear (HK) Linear (KR)
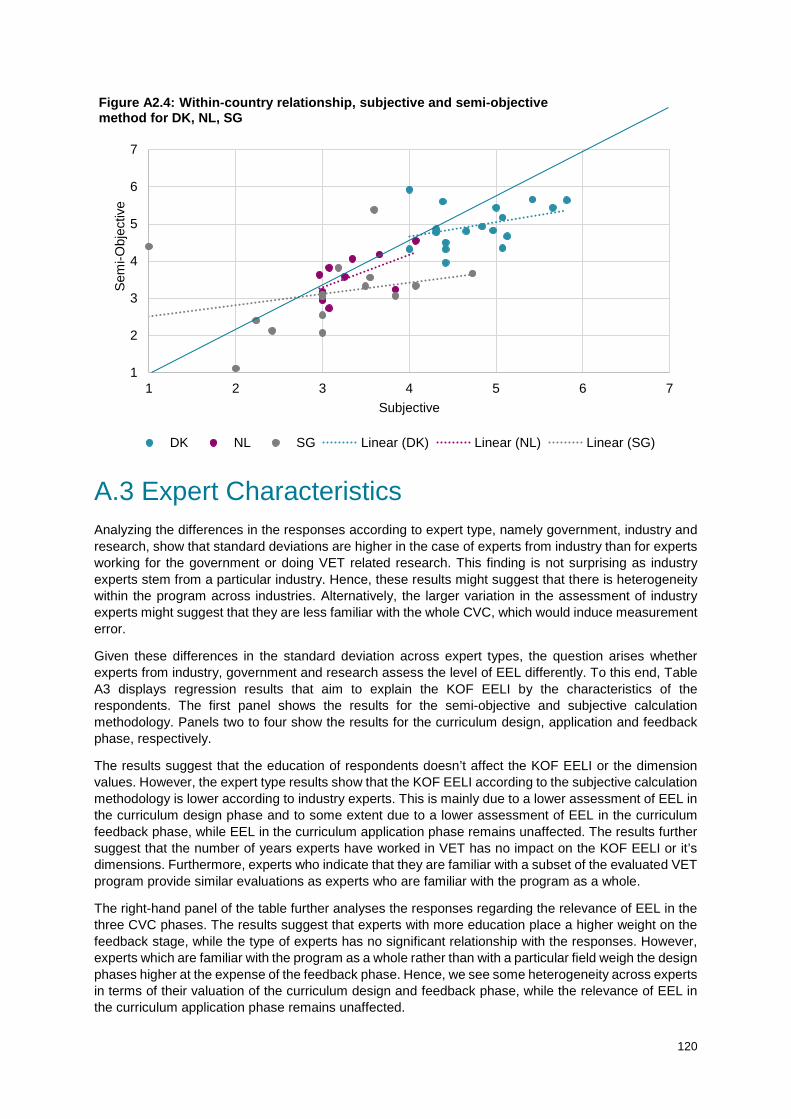
120
A.3 Expert Characteristics Analyzing the differences in the responses according to expert type, namely government, industry and research, show that standard deviations are higher in the case of experts from industry than for experts working for the government or doing VET related research. This finding is not surprising as industry experts stem from a particular industry. Hence, these results might suggest that there is heterogeneity within the program across industries. Alternatively, the larger variation in the assessment of industry experts might suggest that they are less familiar with the whole CVC, which would induce measurement error.
Given these differences in the standard deviation across expert types, the question arises whether experts from industry, government and research assess the level of EEL differently. To this end, Table A3 displays regression results that aim to explain the KOF EELI by the characteristics of the respondents. The first panel shows the results for the semi-objective and subjective calculation methodology. Panels two to four show the results for the curriculum design, application and feedback phase, respectively.
The results suggest that the education of respondents doesn’t affect the KOF EELI or the dimension values. However, the expert type results show that the KOF EELI according to the subjective calculation methodology is lower according to industry experts. This is mainly due to a lower assessment of EEL in the curriculum design phase and to some extent due to a lower assessment of EEL in the curriculum feedback phase, while EEL in the curriculum application phase remains unaffected. The results further suggest that the number of years experts have worked in VET has no impact on the KOF EELI or it’s dimensions. Furthermore, experts who indicate that they are familiar with a subset of the evaluated VET program provide similar evaluations as experts who are familiar with the program as a whole.
The right-hand panel of the table further analyses the responses regarding the relevance of EEL in the three CVC phases. The results suggest that experts with more education place a higher weight on the feedback stage, while the type of experts has no significant relationship with the responses. However, experts which are familiar with the program as a whole rather than with a particular field weigh the design phases higher at the expense of the feedback phase. Hence, we see some heterogeneity across experts in terms of their valuation of the curriculum design and feedback phase, while the relevance of EEL in the curriculum application phase remains unaffected.
1
2
3
4
5
6
7
1 2 3 4 5 6 7
Sem
i-Obj
ectiv
e
Subjective
Figure A2.4: Within-country relationship, subjective and semi-objective method for DK, NL, SG
DK NL SG Linear (DK) Linear (NL) Linear (SG)

121
Table A3: Estimation of the Relationship between Expert Assessment and Expert Characteristics
Total Design Application Feedback Weight Objective Subj. Objective Subj. Objective Subj. Objective Subj. Design Application Feedback
Respondent Education (Baseline: No PhD)
PhD 0.802** 0.286 0.498 0.345 0.637* 0.352 0.401 0.012 -8.150 -2.923 11.073* (0.327) (0.357) (0.508) (0.541) (0.379) (0.466) (0.718) (0.605) (8.189) (7.017) (6.558)
Professor 0.097 0.078 0.416 0.721 -0.255 0.002 -0.163 -1.031 -8.560 -10.817 19.377*** (0.419) (0.458) (0.566) (0.603) (0.486) (0.598) (0.801) (0.777) (9.129) (7.821) (7.310)
Respondent Sector (Baseline: Government)
Industry -0.108 -0.441*** -0.296* -0.505*** 0.005 0.029 0.052 -0.822*** 3.747 -1.895 -1.852
(0.131) (0.143) (0.176) (0.192) (0.152) (0.191) (0.250) (0.243) (2.846) (2.438) (2.279)
Research -0.027 0.059 -0.057 0.054 -0.054 -0.035 0.042 0.280 -1.074 3.068 -1.994 (0.199) (0.218) (0.268) (0.287) (0.231) (0.285) (0.380) (0.369) (4.325) (3.706) (3.463)
Years Working in VET 0.000 -0.011 0.001 -0.013 0.005 -0.009 -0.008 -0.013 0.097 -0.125 0.028 (0.006) (0.007) (0.008) (0.009) (0.007) (0.009) (0.012) (0.011) (0.131) (0.112) (0.105)
Familiarity with Program (Baseline: Familiar with Particular Field only)
Familiar with Program as a Whole -0.167 -0.263 0.040 0.115 -0.295 -0.353 -0.325 -0.606 10.879** -2.290 -8.589** (0.207) (0.226) (0.284) (0.303) (0.239) (0.296) (0.421) (0.383) (4.576) (3.921) (3.664)
N 123 123 121 119 123 120 121 122 121 121 121 Country FE Yes Yes Yes Yes Yes Yes Yes Yes Yes Yes Yes
Notes: The table shows OLS coefficients and standard errors in parentheses. *, **, and *** indicate significance on the level of 10%, 5% and 1%, respectively.

122
A.4 EELI results by feature This section discusses the detailed results for each feature of the KOF EELI. Table A4 shows a comparison of feature values across countries for either one or two features. Feature values range from one to seven as they enter the KOF EELI, with low scores colored pinker, high scores darker teal, and scores around the middle colored white.
Table A4: KOF EELI feature scores by country Country AT CH CN DE DK EE FI HK IS JP KR LU NL NO PL SG SI TW A
vg
Top
KOF EELI 5.4 5.4 3.1 4.8 4.9 3.9 3.8 3 4.1 1.7 2.9 3.7 3.7 3.9 4.4 2.9 4 3.4 3.8 5.4 Curriculum Design Phase 5.3 5.3 3.9 4.4 5 3.6 3.9 3 4.7 1.3 3.5 0 3.8 4 3.6 2.8 5.6 3.3 3.7 5.6 Qualification Standards 4 5 4 4 4.4 3.3 3.3 2.6 4 1 2.5 0 3.3 3.3 4 2.5 4 2.5 3.4 5.0 Qualification Standards: Involvement 5.5 5.3 4 4 4.4 4 3.3 3 4 1 2.5 3.3 4 4 2.8 5.5 2.5 3.7 4.9
Qualification Standards: Decision Power 2.5 4.7 4 4 4.4 2.5 3.3 2.3 5.5 1 2.5 3.4 2.5 4 2.4 2.5 2.5 3.2 5.6
Examination Form 4.8 4.6 2.5 4 4.5 2.5 4 1.9 5.5 1 2.5 0 2.4 4 1.8 1.8 3.3 2.5 3.1 5.5 Examination Form: Involvement 5.5 4.8 2.5 4 4.6 2.5 4 2 5.5 1 2.5 2.7 4 2.5 1.9 4 2.5 3.3 4.4 Examination Form: Decision Power 4 4.5 2.5 4 4.4 2.5 4 1.8 5.5 1 2.5 2.2 4 1 1.8 2.5 2.5 3 5.5
Involvement Quality 6.3 5.4 5.5 4 5.7 5.1 5.3 4.3 5.7 3.7 5.1 1 5.5 5 5.1 4.5 6.6 5.5 5 6.6 Career vs Occupation vs Job 7 4.9 7 1 6 7 7 4.6 7 7 4 1 5.8 7 7 6.2 7 7 5.7 5.5 Firms vs Employer Associations 7 5.7 4 4 4.5 4 4 4.7 4 4 5.5 5.5 4 4 5.8 7 7 5 5.5 Represented Firm Share 7 5.3 5.5 5.5 5.9 5.5 5.5 4.4 5.5 2.5 5.5 4.9 5.5 3.8 5.5 4 5.1 5.5 Legal Def. of Involvement 4 5.7 5.5 5.5 6.3 4 4.8 3.1 6.3 1.8 5.5 5.7 4 4 2.5 7 4 4.7 5.5 Curriculum Application Phase 5.6 5.5 3.3 4.8 4.6 3.2 3.8 3.2 3 1.8 2.6 1.5 3.2 4.4 3.8 3 2.9 3.3 3.5 5.6 Learning Place 4.3 5.4 2.8 6.3 4.9 2.8 3.1 2.5 1.8 3 2.8 1.5 3.7 5.5 4.8 2.4 4.8 3.8 3.6 6.3 Classroom vs Workplace Share 5.5 5.5 2.5 5.5 5.1 2.5 3.3 3 2.5 2.5 2.5 1 2.5 4 2.5 2.9 2.5 2.5 3.2 5.5 Site Visits 1.5 2 1.8 1.8 2.0 Counselling 1.5 1.5 2 1.8 1.7 2.0 Legal Def. of Share 3 5.3 3 7 4.7 3 3 2.1 1 5 3 4.8 7 7 1.3 7 5 4.2 7.0 Workplace Regulation 6.1 6.3 4.2 6.8 4.8 4.8 3.1 4.6 4.6 1 3.6 0 4.9 4.2 5.3 4.9 4.9 6.6 4.7 6.8 Work Contract 7 6.8 7 7 6.7 1 4 5.2 7 1 4 6.3 7 7 4.8 7 7 5.6 7.0 Workplace Training Curriculum: Existence 7 6.9 7 7 6.7 7 4 6.1 7 1 4 7 7 7 6.6 7 7 6.2 7.0
Workplace Training Curriculum: Implementation 7 6.2 5.5 5.5 5.6 5.5 5.5 5.8 2.5 4 5.7 5.5 7 5.4 4 4 5.3 7.0
Legal Def. Workplace Trainer: Existence 7 6.8 7 7 4.8 7 1 3.3 7 1 1 5.8 7 7 1.6 7 7 5.2 7.0
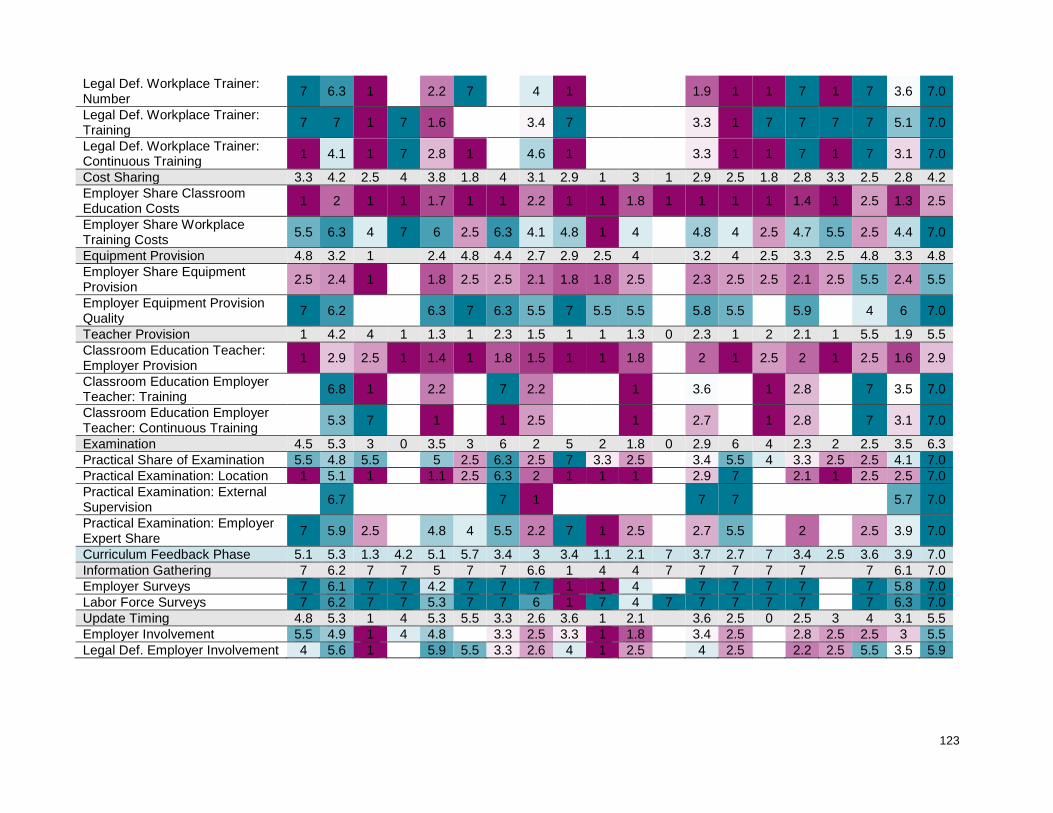
123
Legal Def. Workplace Trainer: Number 7 6.3 1 2.2 7 4 1 1.9 1 1 7 1 7 3.6 7.0
Legal Def. Workplace Trainer: Training 7 7 1 7 1.6 3.4 7 3.3 1 7 7 7 7 5.1 7.0
Legal Def. Workplace Trainer: Continuous Training 1 4.1 1 7 2.8 1 4.6 1 3.3 1 1 7 1 7 3.1 7.0
Cost Sharing 3.3 4.2 2.5 4 3.8 1.8 4 3.1 2.9 1 3 1 2.9 2.5 1.8 2.8 3.3 2.5 2.8 4.2 Employer Share Classroom Education Costs 1 2 1 1 1.7 1 1 2.2 1 1 1.8 1 1 1 1 1.4 1 2.5 1.3 2.5
Employer Share Workplace Training Costs 5.5 6.3 4 7 6 2.5 6.3 4.1 4.8 1 4 4.8 4 2.5 4.7 5.5 2.5 4.4 7.0
Equipment Provision 4.8 3.2 1 2.4 4.8 4.4 2.7 2.9 2.5 4 3.2 4 2.5 3.3 2.5 4.8 3.3 4.8 Employer Share Equipment Provision 2.5 2.4 1 1.8 2.5 2.5 2.1 1.8 1.8 2.5 2.3 2.5 2.5 2.1 2.5 5.5 2.4 5.5
Employer Equipment Provision Quality 7 6.2 6.3 7 6.3 5.5 7 5.5 5.5 5.8 5.5 5.9 4 6 7.0
Teacher Provision 1 4.2 4 1 1.3 1 2.3 1.5 1 1 1.3 0 2.3 1 2 2.1 1 5.5 1.9 5.5 Classroom Education Teacher: Employer Provision 1 2.9 2.5 1 1.4 1 1.8 1.5 1 1 1.8 2 1 2.5 2 1 2.5 1.6 2.9
Classroom Education Employer Teacher: Training 6.8 1 2.2 7 2.2 1 3.6 1 2.8 7 3.5 7.0
Classroom Education Employer Teacher: Continuous Training 5.3 7 1 1 2.5 1 2.7 1 2.8 7 3.1 7.0
Examination 4.5 5.3 3 0 3.5 3 6 2 5 2 1.8 0 2.9 6 4 2.3 2 2.5 3.5 6.3 Practical Share of Examination 5.5 4.8 5.5 5 2.5 6.3 2.5 7 3.3 2.5 3.4 5.5 4 3.3 2.5 2.5 4.1 7.0 Practical Examination: Location 1 5.1 1 1.1 2.5 6.3 2 1 1 1 2.9 7 2.1 1 2.5 2.5 7.0 Practical Examination: External Supervision 6.7 7 1 7 7 5.7 7.0
Practical Examination: Employer Expert Share 7 5.9 2.5 4.8 4 5.5 2.2 7 1 2.5 2.7 5.5 2 2.5 3.9 7.0
Curriculum Feedback Phase 5.1 5.3 1.3 4.2 5.1 5.7 3.4 3 3.4 1.1 2.1 7 3.7 2.7 7 3.4 2.5 3.6 3.9 7.0 Information Gathering 7 6.2 7 7 5 7 7 6.6 1 4 4 7 7 7 7 7 7 6.1 7.0 Employer Surveys 7 6.1 7 7 4.2 7 7 7 1 1 4 7 7 7 7 7 5.8 7.0 Labor Force Surveys 7 6.2 7 7 5.3 7 7 6 1 7 4 7 7 7 7 7 7 6.3 7.0 Update Timing 4.8 5.3 1 4 5.3 5.5 3.3 2.6 3.6 1 2.1 3.6 2.5 0 2.5 3 4 3.1 5.5 Employer Involvement 5.5 4.9 1 4 4.8 3.3 2.5 3.3 1 1.8 3.4 2.5 2.8 2.5 2.5 3 5.5 Legal Def. Employer Involvement 4 5.6 1 5.9 5.5 3.3 2.6 4 1 2.5 4 2.5 2.2 2.5 5.5 3.5 5.9
124
A.4.1 Curriculum design phase Qualification Standard Employer involvement is highest in Slovenia, Austria and Switzerland. This group is followed by seven countries where employers are involved as equal partners. Employers are involved to some extent in the Netherlands, Finland and the Southeast Asian countries Hong Kong, Singapore, Taiwan and South Korea, while Japanese employers are not involved in the qualification standard definition of the curriculum design phase.
Comparing the results for employer involvement and employer decision power reveals a very high correlation. Notable exceptions are Austria, Singapore and Slovenia where employer involvement reaches high values while decision power is relatively low. Though involvement is higher than decision power in most cases, Iceland and to a lesser extent the Netherlands surprisingly display a higher value regarding decision power than involvement intensity.
Examination Form The examination form subdimension has similar results to the qualification standards subdimension. Both Austria and Switzerland also feature in the group of countries with the highest employer involvement. Iceland scores highest in this respect though and Denmark fares good as well. The group of medium countries consists of Germany, Finland and Norway. Slovenia is the only Eastern European country in this middle group, while employers have only some involvement in the remaining Eastern European countries. Employers have only some involvement in the examination form definition in all of the Southeast Asian countries and even none in Japan.
We also see a high correlation between the involvement and decision power features. Similar to the results regarding qualification standards, Austria and Slovenia have substantially higher involvement than decision power of employers. Regarding the examination form, this also holds for Poland.
Involvement Quality There is relatively low variation regarding whether the VET program prepares for a career, an occupation or a job. Experts of non-focus countries mostly suggest that the program prepares for a particular occupation. The only exceptions are Germany and Luxembourg, where experts indicate that the program prepares for a career. In all of the six focus countries, more than half of experts suggest that the program prepares for an occupation, but experts differ in terms of the share indicating that this is the case. While the share is highest in Singapore, followed closely by Denmark and the Netherlands, a sizeable share of experts in Switzerland, Hong Kong and South Korea consider the program to prepare for a career. Only four experts answered that the program prepares for a particular job.
There is substantial variation in how the involvement of employers in the curriculum design phase is legally defined. This feature reaches the highest value in Slovenia, followed by Denmark, Iceland, Switzerland, the Netherlands, Germany and Shanghai. Conversely, legal definition is poor in Hong Kong, Singapore and particularly Japan.
The question regarding the way to involve employers in the curriculum design process elicited relatively little variation. In all of the countries, employers engage in the curriculum design process through employer associations. This might reflect the fact that the sample of countries reflects top performing countries, which have higher EEL than other countries. However, this finding also raises the question of whether the item should be phrased more specifically regarding the concrete development of the curricula, since it might be possible that employer associations engage in the curriculum design process in its strategic direction rather than in the concrete development of the curricula. The share of experts who indicate that employers engage both directly through firms and indirectly through employer associations is highest in Austria, Estonia and Slovenia, followed by Switzerland, Singapore, the Netherlands and South Korea.

125
The represented firm share is highest in Austria, followed by eleven countries with a value of about 5.5. Hence, variation in this respect is surprisingly low as well. The represented firm share is lower in Hong Kong, Taiwan, Singapore and particularly Japan.
A.4.2 Curriculum application phase Learning Place The results regarding the learning place reveal that the share of workplace education reaches the highest values in Germany, Austria and Switzerland, followed by Denmark and Norway. The VET students in remaining countries spend most time in the classroom and some time in the workplace. In Luxembourg, no workplace training takes place.
The second feature of the learning place subdimension captures how accurately the law defines the share of workplace training. The results show that countries differ substantially in this respect. While the share is exactly defined in Singapore, Norway, Poland and Slovenia, the law defines a narrow range in Switzerland, Estonia, Japan, the Netherlands and Denmark. In six of the remaining countries, the law specifies a broad range of shares, while the law doesn’t specify the share in Iceland and Singapore at all.
For the few experts in Hong Kong, Japan and Singapore which indicated that no workplace training takes place, we can see how many students receive the opportunity to make site visits or job shadowing and to what extent employers engage in providing information about the world of work, for example through job fairs and student mentoring. In order to account for the fact that these represent less intensive employer engagement than workplace training, we rescale the maximum for these features to 3. Hence, the results suggest that employer engagement remains low even regarding these less intensive engagement ways.
Workplace Regulation The results regarding work contract reveal that VET students in most countries for which data exists have a work contract. Exceptions are Finland, Hong Kong, South Korea and Singapore, where about half of the experts say that VET students have a work contract. This variation might reflect differences in the VET.
Furthermore, most country experts argue that a curriculum for the workplace training curriculum exists. Only Finland and South Korea score substantially below seven in this respect. However, countries differ substantially in terms of curriculum implementation. It is implemented completely in Austria, Poland and nearly completely in Switzerland. In most other countries, the curriculum is implemented mostly. South Korea, Slovenia and Taiwan, implement the workplace curriculum somewhat and the curriculum is implemented a little bit in Iceland.
The law of many countries specifies that a workplace trainer needs to exist. Experts in Denmark and Hong Kong disagree in this respect, which might reflect heterogeneity of the VET program across curricula. The law does not specify the existence of a workplace trainer in Singapore, Finland, Japan and South Korea.
A smaller number of countries where the existence of a workplace trainer is legally defined also have a law that specifies the number of workplace trainers. Concretely, these are Austria, Switzerland, Estonia and Taiwan. Interestingly, the few experts indicating that the law defines the existence of a trainer in Singapore, also responded that the law regulates the number of trainers. The results for Hong Kong remain ambiguous, while most experts of the remaining countries do not think that the law defines the number of workplace trainers.
The legal definition of the training for workplace trainers includes whether they need to receive initial training and whether they need to update their knowledge continuously. The results suggest that workplace trainer number definition goes hand in hand with the legal requirement of training in Singapore and Taiwan. The law in Switzerland and Austria require workplace trainers to receive initial training, but only half of the Swiss expert indicated that the law requires them to update their knowledge continuously. Estonia, the last country that defines the number of workplace trainers in the law, does not require them to receive training, though. Germany requires workplace trainers to receive initial training and update their knowledge continuously,
126
while Iceland and Poland focus on the initial training. Interestingly, half of experts for Hong Kong indicate that the law requires workplace trainers to receive both initial and continuous training.
Cost Sharing Results suggest that employers contribute little to financing classroom education in all countries. Employers bear some share of costs in Taiwan, Hong Kong, Switzerland, Denmark and Finland.
The share of workplace training costs borne by employers varies substantially across countries. It is highest in Germany, followed by Switzerland, Finland and Denmark. Conversely, employers bear only a small part of workplace training costs in Estonia, Taiwan, Poland and Japan.
Equipment Provision The equipment provision subdimension entails two features. The first feature captures the share of equipment used in classroom education that is provided by employers. The second feature captures whether the equipment provided by employers is up to date with the technological developments or whether the employers provide equipment they themselves can no longer use.
The results show that employers provide small amounts of equipment used in classroom education. The only exception is Taiwan, where employers provide most of the equipment. The little equipment provided by employers for classroom education is up-to-date in Estonia and Iceland, and nearly up-to date in the other countries. The provided equipment is slightly out of date in Taiwan. Rather surprisingly, this result suggests that the quality of the provided equipment display the reversed picture than equipment provision intensity. Hence, the little equipment provided in most countries is of somewhat higher quality than the large share of equipment provided in Taiwan.
Teacher Provision The subdimension Teacher Provision consists of three features. The first feature captures to what extent employers provide part-time teachers for classroom education. The other two features capture whether the law requires classroom teachers provided by employers to receive specific training and to update their knowledge and skills continuously.
The results show that employers provide no teachers in most countries and that the share of classroom teachers provided by employers remains low in most countries. The share of classroom teachers provided by employers is highest in Switzerland, where nearly half of classroom teachers also work in a firm. Furthermore, some of the teachers in Shanghai, Poland, Taiwan and the Netherlands stem from the private sector. Teachers working in a firm play a minor role in Finland, South Korea, Hong Kong and Denmark, while the employers provide no teachers in the remaining countries.
The results regarding the training of classroom teachers provided by employers suggest that the law requires employer-provided teachers to obtain special training and to update their knowledge continuously in Switzerland and Taiwan. Furthermore, Finland requires these teachers to receive special training and Shanghai demands continuous updating of knowledge. Training is also regulated to some extent in Hong Kong, the Netherlands, Singapore and Denmark, while the law doesn’t specify training requirements in the remaining countries.
Examination The four features of the Examination subdimension capture the relevance of practical examinations in the VET program, the location of the practical examination, whether the practical examination is externally supervised and how important employer experts are in the practical examination.
The results regarding practical examination show that practical examination determines all of the grades in Iceland and nearly all of the grades in Finland. Furthermore, practical examination makes up most of the grades in Austria, Shanghai (CN), Norway, Denmark and Switzerland. Practical examination determine about half of grades in Poland, the Netherlands, Japan and Singapore, while having slight relevance in the remaining countries.
127
Practical examination in the workplace matters most in Norway, Finland and Switzerland. There is some relevance of workplace examinations in the Netherlands, Estonia, Taiwan, Singapore and Hong Kong but none in the other countries. Hence, practical examination at the workplace matters relatively little in most of the analyzed countries.
Examinations at the workplace raise the question of whether the examination ensures the quality of education and training, including whether the practical examination at the workplace is externally supervised. External supervision takes place in most of the countries with the exception of Hong Kong.
Workplace examinations also include the extent to which employers provide experts in practical examinations, thereby capturing how the information of employers regarding the evaluation of practical tasks enter the grading system. The results show that Iceland and Austria make most use of this resource, followed by Switzerland, Finland, Norway, Denmark and Estonia. In the remaining countries, employer provided some or even none of the experts evaluating practical examinations.
A.4.3 Curriculum feedback phase Information Gathering In order to update the curriculum in the curriculum feedback phase, the information regarding outcomes of the VET program need to be gathered. The corresponding results suggest that most countries gather information regarding outcomes of the VET program through both employer and labor force surveys. An exception are Denmark and Korea, for which part of experts indicate that this type of information exists. In Iceland, neither type of information exists, while Japan just gathers outcome information through labor force surveys.
Update Timing The results regarding the involvement of employers in defining the update timing suggest that employers represent the main actor in Austria, Switzerland and Denmark. They act as equal partners in Germany, the Netherlands, Finland and Iceland, but are involved to some extent or not at all in the remaining countries.
The results for the legal definition of firm involvement show that the law defines the employer involvement at least broadly in Denmark, Switzerland, Estonia and Taiwan. The law also specifies their role to some extent in Austria, Iceland and the Netherlands. Most of the other laws defines employer involvement, but do not specify how. In Shanghai and Japan, the law does not require employer involvement in the decision of the update timing.
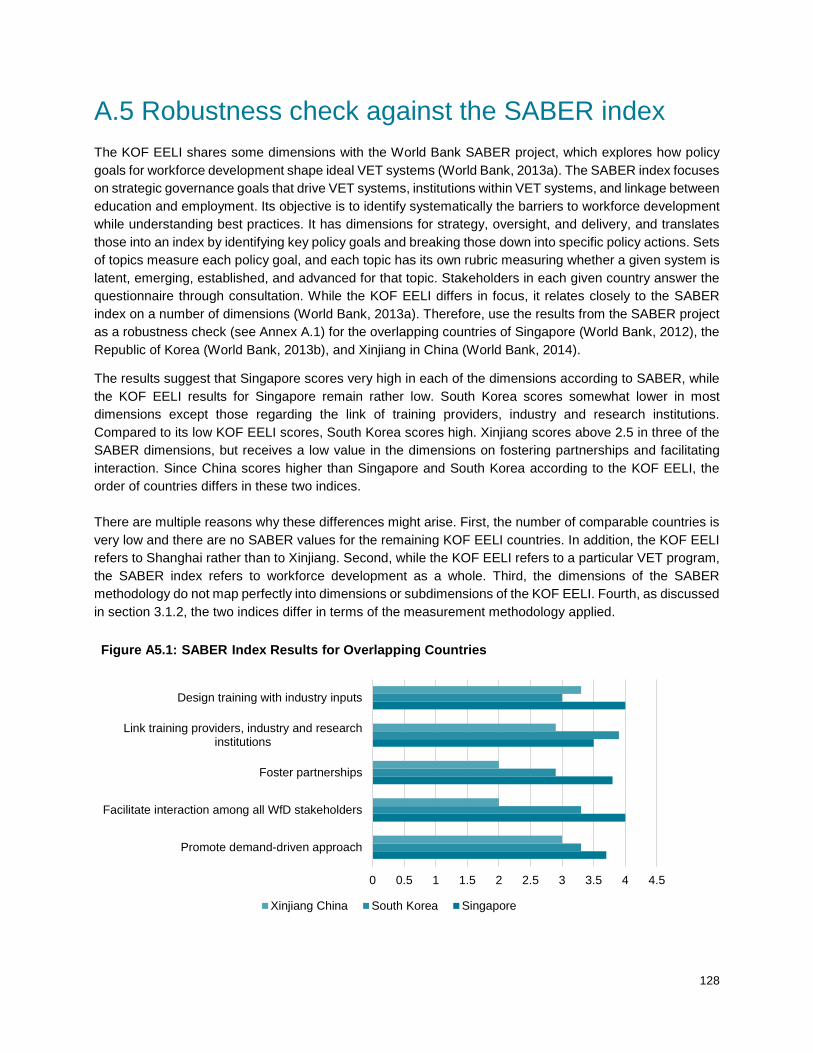
128
A.5 Robustness check against the SABER index The KOF EELI shares some dimensions with the World Bank SABER project, which explores how policy goals for workforce development shape ideal VET systems (World Bank, 2013a). The SABER index focuses on strategic governance goals that drive VET systems, institutions within VET systems, and linkage between education and employment. Its objective is to identify systematically the barriers to workforce development while understanding best practices. It has dimensions for strategy, oversight, and delivery, and translates those into an index by identifying key policy goals and breaking those down into specific policy actions. Sets of topics measure each policy goal, and each topic has its own rubric measuring whether a given system is latent, emerging, established, and advanced for that topic. Stakeholders in each given country answer the questionnaire through consultation. While the KOF EELI differs in focus, it relates closely to the SABER index on a number of dimensions (World Bank, 2013a). Therefore, use the results from the SABER project as a robustness check (see Annex A.1) for the overlapping countries of Singapore (World Bank, 2012), the Republic of Korea (World Bank, 2013b), and Xinjiang in China (World Bank, 2014).
The results suggest that Singapore scores very high in each of the dimensions according to SABER, while the KOF EELI results for Singapore remain rather low. South Korea scores somewhat lower in most dimensions except those regarding the link of training providers, industry and research institutions. Compared to its low KOF EELI scores, South Korea scores high. Xinjiang scores above 2.5 in three of the SABER dimensions, but receives a low value in the dimensions on fostering partnerships and facilitating interaction. Since China scores higher than Singapore and South Korea according to the KOF EELI, the order of countries differs in these two indices. There are multiple reasons why these differences might arise. First, the number of comparable countries is very low and there are no SABER values for the remaining KOF EELI countries. In addition, the KOF EELI refers to Shanghai rather than to Xinjiang. Second, while the KOF EELI refers to a particular VET program, the SABER index refers to workforce development as a whole. Third, the dimensions of the SABER methodology do not map perfectly into dimensions or subdimensions of the KOF EELI. Fourth, as discussed in section 3.1.2, the two indices differ in terms of the measurement methodology applied.
0 0.5 1 1.5 2 2.5 3 3.5 4 4.5
Promote demand-driven approach
Facilitate interaction among all WfD stakeholders
Foster partnerships
Link training providers, industry and researchinstitutions
Design training with industry inputs
Figure A5.1: SABER Index Results for Overlapping Countries
Xinjiang China South Korea Singapore

129
A.6 Biographies of Authors Ursula Renold is head of the research center for comparative education systems at the Swiss Federal Institute of Technology (ETH) in Zurich. In addition, she is Chairman of the University Board of the University of Applied Sciences and Arts, Northwestern Switzerland. She was a Visiting Fellow at the Harvard Graduate School of Education between September 2012 and March 2013. Prior to this, Renold was Director General of the Federal Office for Professional Education and Technology (OPET) until June 2012. In this position, she headed Switzerland‘s competence center for professional education, the universities of applied sciences, and led program innovation starting in 2005. Before becoming Director General, she was head of OPET’s Vocational Education and Training Division and Director of the Swiss
Federal Institute of Vocational Education and Training (teacher education). During her career, Renold has launched numerous key initiatives that have had great impact on the Vocational and Professional Education and Training system in Switzerland. She holds an honorary Professorship in Professional Education at the University of Applied Labor Studies in Mannheim (Germany).
Thomas Bolli is a postdoctoral researcher in the research center for comparative education systems at the Swiss Federal Institute of Technology (ETH) in Zurich. Before starting this position in April of 2013, he was awarded a Swiss National Science Foundation grant to visit the University of Lancaster as a postdoctoral researcher. He wrote his PhD thesis on the production and measurement of knowledge capital in the research center for innovation at the Swiss Federal Institute of Technology (ETH) in Zurich. Building on this, his research interests consist of the statistical analysis of knowledge, in particular applying microeconometrics to questions regarding the economics of education, research, and innovation.
Katherine Caves is a postdoctoral researcher in the research center for comparative education systems at the Swiss Federal Institute of Technology (ETH) in Zurich. She has a bachelor’s degree from the University of California at Berkeley and earned her master’s degree in the field of Education. Her PhD research was on the economics of education at the University of Zurich. Her research interests center around the economic, institutional, and infrastructure foundations of strong vocational education and training (VET) systems all over the world, especially what those foundations are in successful VET systems and how they can be developed in nascent VET systems. In addition to this project, she is currently working on identifying the success factors and barriers to labor market-oriented education systems reforms with the Center for the Economics and Management of Education and Training Systems (CEMETS).
130
Jutta Buergi is a research assistant and intern in the research center for comparative education systems at the Swiss Federal Institute of Technology (ETH) in Zurich. She has a university degree in sociology from the University of Chile, Santiago de Chile and received her master’s degree in sociology and political science from the Faculty of Arts at the University of Zurich, Switzerland. Her research interests lie in sociology of education, vocational education and training, tertiary/higher education, education policy, as well as research policy and government support of research.
Maria Esther Egg is a researcher and doctoral student in the research center for comparative education systems at the Swiss Federal Institute of Technology (ETH) in Zurich. She did her bachelor studies in Economics at the University of St. Gallen Switzerland and graduated in 2010. For the master studies in Economics she moved to Zurich, Switzerland, and graduated in 2013 from the University of Zurich. Her dissertation area is in education economics and labor economics. Thereby, she focuses on the relation between the youth labor market and vocational education and training.
Johanna Kemper is a researcher and doctoral student in the research center for comparative education systems at the Swiss Federal Institute of Technology (ETH) in Zurich. She received her master’s degree in economics from the University of Vienna, Austria. In her PhD thesis, she analyses the effect of labor market regulation on educational and labor market outcomes. She focuses on the effect of employment protection legislation (EPL) on firm behavior. For example, she analyzes if EPL increases the willingness of firms to invest in the skills of their employees. She also looks at the strategies firms choose to circumvent the costs of EPL. Currently, she is a visiting scholar at the University of California at Berkeley.
Ladina Rageth is a researcher and doctoral student in the research center for comparative education systems at the Swiss Federal Institute of Technology (ETH) in Zurich. She has a master’s degree from the Institute of Sociology in the Faculty of Arts at the University of Zurich, Switzerland. She is currently working on her PhD in the fields of sociology of education, focusing on comparative research on vocational education and training, as well as its outcomes on the youth labor market. In addition, her research interest lies in the social status of vocational education and training.
Editor
KOF Swiss Economic Institute, ETH Zurich© 2016 KOF Swiss Economic Institute, ETH Zurich
Authors
Dr. Ursula Renold, Dr. Thomas Bolli, Dr. Katherine Caves, Jutta Bürgi, Maria Esther Egg, Johanna Kemper and Ladina Rageth
Imprint
ETH ZurichKOF Swiss Economic InstituteLEE G 116Leonhardstrasse 218092 Zurich, Switzerland
Phone +41 44 632 42 39Fax +41 44 632 12 [email protected]