michal thesis - photothermal spectroscopy as a …
TRANSCRIPT

i
TEL AVIV UNIVERSITY
The Iby and Aladar Fleischman Faculty of Engineering
The Zandman-Slaner School of Graduate Studies
PHOTOTHERMAL SPECTROSCOPY AS A
NONINVASIVE METHOD FOR EARLY DETECTION OF
CANCEROUS TUMORS
A thesis submitted toward the degree of
Master of Science in Biomedical Engineering
by
Michal Tepper
October 2009

ii
TEL AVIV TEL AVIV UNIVERSITY
The Iby and Aladar Fleischman Faculty of Engineering
The Zandman-Slaner School of Graduate Studies
PHOTOTHERMAL SPECTROSCOPY AS A
NONINVASIVE METHOD FOR EARLY DETECTION OF
CANCEROUS TUMORS
A thesis submitted toward the degree of
Master of Science in Biomedical Engineering
by
Michal Tepper
This research was carried out in the Department of Biomedical Engineering
under the supervision of Prof. Israel Gannot
October 2009

iii

i
Acknowledgements
I would like to take this opportunity to thank the people who helped me bring this
work to completion:
• My advisor, Prof. Israel Gannot, for his guidance, support and inspiration, and
for exposing me to the biomedical world.
• Dr. Moshe Ben-David, for his generous help and for answering a million
questions, treating each one like it was the first.
• Rotem Neeman and Yonat Milstein, for their help in performing most of the
experiments described in this work
• All my friends in the lab, for their company, advice and ice-cream breaks
• Last but not least, my family: My parents, Baruch and Dorit, my brother, Lior
and my husband, Uri, for their love and encouragement throughout all the way
Formatted: Left
ii
Abstract
The objective of this study is to develop a minimal invasive thermal imaging method
to determine the oxygenation level of an internal tissue.
In this method, the tissue is illuminated using an optical fiber by several wavelengths
in the visible and the near IR range. Each wavelength is absorbed by the tissue and
causes an increase in its temperature. The temperature increase is observed by a
coherent waveguide bundle in the mid-IR range. The thermal imaging of the tissue is
done using a thermal camera through the coherent bundle. Analyzing the temperature
rise allows estimating the tissue composition in general, and specifically the
oxygenation level. Such a system will enable to image the temperature and oxygen
saturation within body cavities through a commercial endoscope. As an intermediate
stage, the method will be applied and tested on exposed skin tissue.
A curve-fitting algorithm is used to find the most suitable saturation value affecting
the temperature function. The algorithm was evaluated on a theoretical tissue model
with various parameters, implemented for this study, and on agar phantom models.
The calculated saturation values are in agreement with the real saturation values.

iii
Table of Contents
List of Symbols ............................................................................................................ vv
List of Figures ............................................................................................................ vivi
List of Tables ......................................................................................................... viii viii
1. Background .......................................................................................................... 11
1.1. Introduction ................................................................................................... 11
1.2. Oxygen saturation measurement ..................................................................... 2
1.2.1. Importance ................................................................................................ 2
1.2.2. Measurement methods............................................................................ 55
1.3. spectroscopy .................................................................................................. 77
1.3.1. Brief Introduction to spectroscopy ......................................................... 77
1.3.2. Absorption spectroscopy methods ......................................................... 99
1.3.3. Photothermal spectroscopy ................................................................ 1111
1.4. Research objective ..................................................................................... 1414
2. Method .............................................................................................................. 1616
2.1. Theoretical model ...................................................................................... 1616
2.1.1. Description of the model .................................................................... 1616
2.1.2. Model constants.................................................................................. 1818
2.2. Simulation plan ......................................................................................... 2020
2.3. Theoretical model of the temperature function ......................................... 2121
3. Theoretical results ............................................................................................ 2524
3.1. Preliminary calculations ............................................................................ 2524
3.2. Comparison between calculations and the theoretical model ................... 2927
3.3. Algorithm .................................................................................................. 3733

iv
3.4. Saturation estimation ................................................................................. 3834
3.4.1. Skin tissue .......................................................................................... 3834
3.4.2. Skin tissue without melanin – internal tissue ..................................... 4238
4. Experimental validation ................................................................................... 4541
4.1. Setup .......................................................................................................... 4541
4.2. Methods and Materials .............................................................................. 4541
4.3. Results ....................................................................................................... 4844
4.4. Preliminary results with fiber bundle ........................................................ 5147
5. Discussion ........................................................................................................ 5450
6. Summary .......................................................................................................... 5652
6.1. Conclusions ............................................................................................... 5652
6.2. Future Research ......................................................................................... 5652
6.2.1. Preparation ......................................................................................... 5652
6.2.2. Multi-layered phantoms experiments ................................................. 5753
6.2.3. Improvement of experimental apparatus ............................................ 5753
6.2.4. Tissue simulating phantoms ............................................................... 5854
6.2.5. In-vivo experiments............................................................................ 5955
6.2.6. Clinical trials ...................................................................................... 6056
6.2.7. Fiber bundle mediation....................................................................... 6258
6.2.8. Other applications .............................................................................. 6258
7. References ........................................................................................................ 6460

v
List of Symbols
Symbol Meaning Common units
S Oxygen saturation / oxygenation [%]
pO2 partial oxygen pressure [mmHg]
λ Wavelength [nm]
T Temperature [K]
∆T Temperature increase [K]
T0 Initial temperature [K]
μa Absorption coefficient [cm-1]
μH Effective hemoglobin absorption [cm-1]
μHb Deoxygenated hemoglobin absorption [cm-1]
μHbO Oxygenated hemoglobin absorption [cm-1]
μM Melanin absorption [cm-1]
μB Baseline tissue absorption [cm-1]
μMB Methylene Blue absorption [cm-1]
μICG ICG absorption [cm-1]

vi
List of Figures
Figure 1 - Schematic representation of the paramount importance of hypoxia in the
malignant progression of solid tumors through progressive genome changes and
clonal selection of hypoxia/+ phenotypes. ................................................................... 55
Figure 2 - Oxygenated and deoxygenated hemoglobin spectra .................................... 77
Figure 3 – Various optical interactions ........................................................................ 88
Figure 4 - Comparision of photothermal response of normal and PWS tissue ........ 1212
Figure 5 - 3D thermal image of a 90nm liposome at different time delays obtained
with a phtothermal method ...................................................................................... 1313
Figure 6 – Schematic chart of the computational model .......................................... 1716
Figure 7 - Example of CONV output for skin tissue ................................................ 2524
Figure 8 - Example of COMSOL output for skin tissue .......................................... 2625
Figure 9 – Thermal image of the tissue .................................................................... 2725
Figure 10 – Temperature as a function of wavelength for different melanin
concentrations and oxygen saturation values ........................................................... 2826
Figure 11 -temperature dependance on water concentration .................................... 3028
Figure 12 -temperature dependance on hemoglobin concentration ......................... 3129
Figure 13 -temperature dependance on hemoglobin saturation ............................... 3229
Figure 14 -temperature dependance on melanin concentration ................................ 3430

vii
Figure 15 -temperature dependance on melanin and hemoglobin concentrations,
with doubled baseline absorption coefficient ........................................................... 3531
Figure 16 – Initial saturation algorithm results for very fair skin: 2.5%-5% melanin4036
Figure 17 – Initial saturation algorithm results for moderately pigmented skin:
7.5%-10% melanin ................................................................................................... 4036
Figure 18 – Algorithm results for very fair skin: 2.5%-5% melanin ........................ 4137
Figure 19 – Algorithm results for moderately pigmented skin: 7.5%-10% melanin 4138
Figure 20 – Initial saturation algorithm results for skin tissue without melanin
(internal tissue) ......................................................................................................... 4339
Figure 21 – Algorithm results for skin tissue without melanin (internal tissue) ...... 4440
Figure 22 – ICG, Methylene Blue and the ink absorption spectra ........................... 4743
Figure 23 - Optical fiber mediation effect on the temperature increase measurement
by the thermal camera .............................................................................................. 5248
Figure 24 - Saturation estimation results with fiber bundle mediation (right) and the
thermal image of the bundle (left) ............................................................................ 5349
viii
List of Tables
Table 1 - Median pO2 values in various normal tissues anil in tumors of patients ..... 44
Table 2 – Skin layers parameters used as input to the model. ................................. 1918
Table 3 –Error RMS of saturation for different skin compositions ......................... 4238
Table 4 –Error RMS of saturation for skin tissue without melanin (internal tissue)
................................................................................................................................. 4440
1
1. Background
1.1. Introduction
Detection of oxygen saturation in general and minimally invasive detection
specifically, is a common and important research topic. Measuring the oxygen
saturation is significant in many procedures, including tumor detection, cancer
treatment adjustment and ischemia monitoring during medical procedures [1].
Detecting the oxygen saturation level in an efficient minimal invasive method can
substantially improve the treatment in such cases.
There is a variety of minimally invasive methods for estimating the oxygen saturation.
Most of them are based on the differences between the optical properties of
oxygenated and deoxygenated hemoglobin in the visual and near IR regions, such as
the absorption or scattering [2-3].
One of the possible suitable methods is the photothermal spectroscopy which is
sensitive to the changes in the absorption spectrum. This method was investigated
thoroughly and used for numerous applications[4-6]. The high sensitivity of the
method to surface measurements[7] is extremely valuable in cancer detection, since
the majority of human cancers arise from epithelial cells[8].
The recent development of a flexible coherent hollow waveguide bundle in the mid-
IR range[9-10] can allow the use of such a method through a commercially available
endoscope and expand the detection possibilities within body cavities. The bundle
enables imaging of the saturation in the examined tissue using a thermal camera and
reduces the error caused by the fiber mediation by eliminating the need of fixed
distance and orientation from the fibers.

2
Although there are some implementations of saturation measurement methods for
internal use, none of them utilizes the advantages of the fiber bundle and
photothermal spectroscopy for oxygen saturation imaging of internal tissues.
The objective of this research was to develop a minimally invasive thermal imaging
method to determine the oxygenation level of an internal tissue. In this method, the
tissue is illuminated by a laser and observed by a thermal camera through the coherent
hollow waveguide bundle. As a result of the photo-thermal effect, the tissue
temperature rises. Small temperature changes can be detected because of the high
resolution of the system. Since this increase depends on tissue composition,
illuminating it in several wavelengths provides sufficient information for the
estimation of the oxygenation level.
The objective of this paperthesis is to present an algorithm, which had been developed
for assessment of the oxygen saturation, and the results of implementing it on a
theoretical tissue model, which had been developed for this study as well, and on agar
phantoms. In addition, preliminary examination of the method's accuracy when
applied through a fiber bundle was also performed. The algorithm will be examined
initially on exposed skin tissue and generic internal organ tissue.
1.2. Oxygen saturation measurement
1.2.1. Importance
Oxygen saturation of a tissue is a function of the condition of the cell. There is great
clinical importance to measurements of the patient's oxygenation as a whole and to
measuring the oxygenation of a specific tissue. The main parameters used to describe
the oxygenation are pO2 (partial oxygen pressure value) and oxygen saturation of the
hemoglobin (used for most of this work). The saturation (sometimes called
3
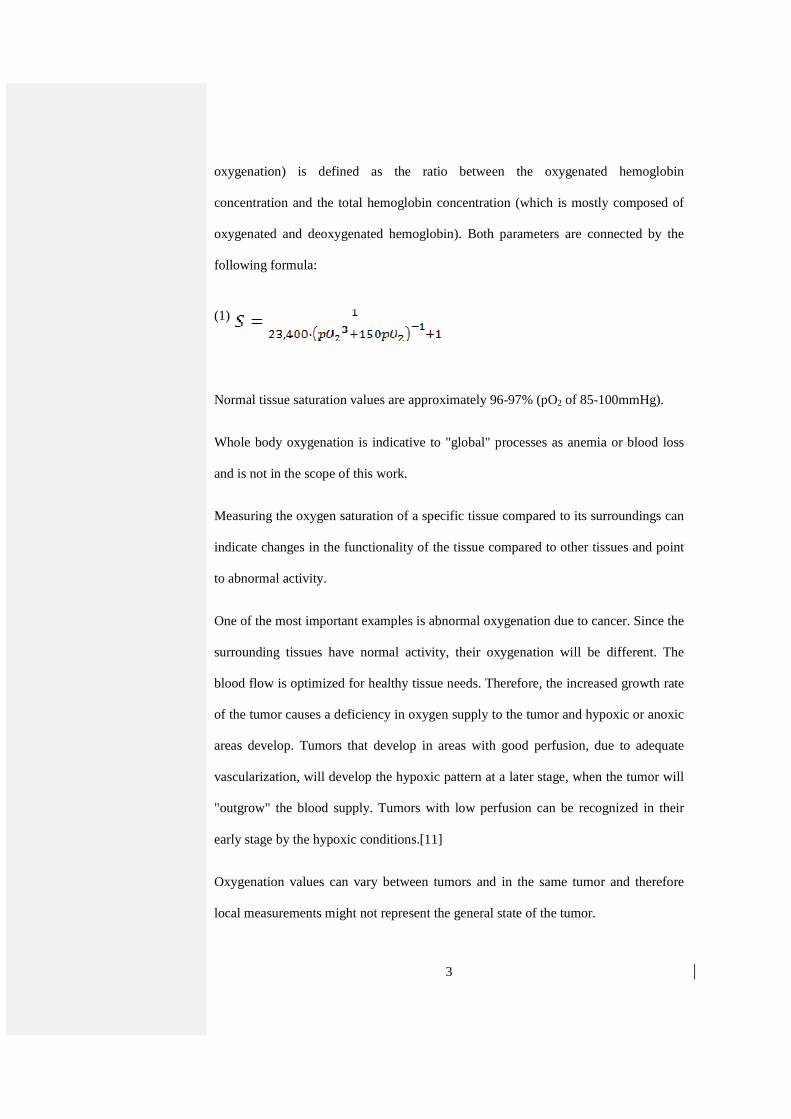
oxygenation) is defined as the ratio between the oxygenated hemoglobin
concentration and the total hemoglobin concentration (which is mostly composed of
oxygenated and deoxygenated hemoglobin). Both parameters are connected by the
following formula:
(1)
Normal tissue saturation values are approximately 96-97% (pO2 of 85-100mmHg).
Whole body oxygenation is indicative to "global" processes as anemia or blood loss
and is not in the scope of this work.
Measuring the oxygen saturation of a specific tissue compared to its surroundings can
indicate changes in the functionality of the tissue compared to other tissues and point
to abnormal activity.
One of the most important examples is abnormal oxygenation due to cancer. Since the
surrounding tissues have normal activity, their oxygenation will be different. The
blood flow is optimized for healthy tissue needs. Therefore, the increased growth rate
of the tumor causes a deficiency in oxygen supply to the tumor and hypoxic or anoxic
areas develop. Tumors that develop in areas with good perfusion, due to adequate
vascularization, will develop the hypoxic pattern at a later stage, when the tumor will
"outgrow" the blood supply. Tumors with low perfusion can be recognized in their
early stage by the hypoxic conditions.[11]
Oxygenation values can vary between tumors and in the same tumor and therefore
local measurements might not represent the general state of the tumor.

4
Error! Reference source not found.Table 1 shows these patterns in a comparison
between normal and cancerous tissues in the same organs.
Table 1 - Median pO2 values in various normal tissues anil in tumors of patients [11]
Tissue Median pO2 (mm Hg) Reference value
Spleen 66 83
Subcutis 50 84-89
Gastric mucosa 47 90
Uterine cervix 36 91
Skeletal muscle 28 92-95
Myocardium 25 96
Liver 24 97
Brain 24 98-100
Cervix cancers
Stage 0
Stage I
Stage II
20
13
5
91
91
91,101
Adenocarcinomas 10-12 86,90
Squamous cell carcinomas 15 84,86,87,102
Breast cancers 17 84,88,102-104
Even after a tumor was detected, there is great clinical importance to measuring its
oxygenation. Hypoxia in tumors is related to tumor spreading, local and metastatic,
and to resistance to therapy, which make it an important factor in determining the
prognosis [12]. Figure 1Figure 1 shows a schematic representation of the involvement
of hypoxia in the malignant progression of tumors.

5
Figure 1 - Schematic representation of the paramount importance of hypoxia in the malignant
progression of solid tumors through progressive genome changes and clonal selection of
hypoxia/+ phenotypes [13].
In addition, detection of hypoxic areas in the tumor offers an opportunity to improve
treatment as it enables using hypoxia specific treatments, such as hypoxia specific
gene therapy [14].
The majority of human cancers (up to 85%) are carcinomas, which are cancers of the
epithelial cells [8]. These cells are located in the epithelium, lining the cavities and
structures throughout the body. Therefore the measurement of oxygenation in these
superficial layers is highly important.
Other possible applications include ischemia monitoring [15], early detection of
flowed blood supply to transplanted skin flaps [16] and burn classification [17].
1.2.2. Measurement methods
The clinical importance of oxygen saturation led to the development of various
invasive and noninvasive methods for its measurements.

6
The current gold standard method is needle electrode measurement. Although this
procedure is relatively accurate, it has several disadvantages. Since the electrode
consumes oxygen by electrochemical reduction, the oxygenation is slightly
underestimated and the electrode must be moved inside the tissue in order to avoid
signal decrease over time. The continuous movement and the invasive nature of the
method injure the tissue and do not allow oxygenation monitoring over time or
imaging (making it mostly useful for local measurements) [18-20].
An improvement to the electrode, based on optical measurement was also suggested.
In this device, the electrode contains a fluorophore stimulated by laser or diode, and
its lifetime is measured in order to deduce the oxygenation [20]. Although the method
allows monitoring of the oxygenation over time, it is still invasive and suitable for
local measurement only.
Another invasive, yet accurate, procedure is cryospectrophotometry, which includes
spectroscopic determination of the oxygenation ion frozen samples extracted from the
tissue [21]. For obvious reasons, this procedure is also unsuitable for entire tumor
oxygenation measurement.
Some methods include insertion of various markers into the bloodstream and
measuring their distribution in the tissue. For example, insertion of hypoxia induced
markers, magnetic nanocrystals and fluorophores [13, 22-23]. In these methods the
markers are injected to the patient's blood and monitored using invasive or
noninvasive methods. Although some of these markers show reasonable sensitivity to
hypoxic tumors, the procedure is not fully developed, requires biological intervention
and the imaging might be invasive.
7
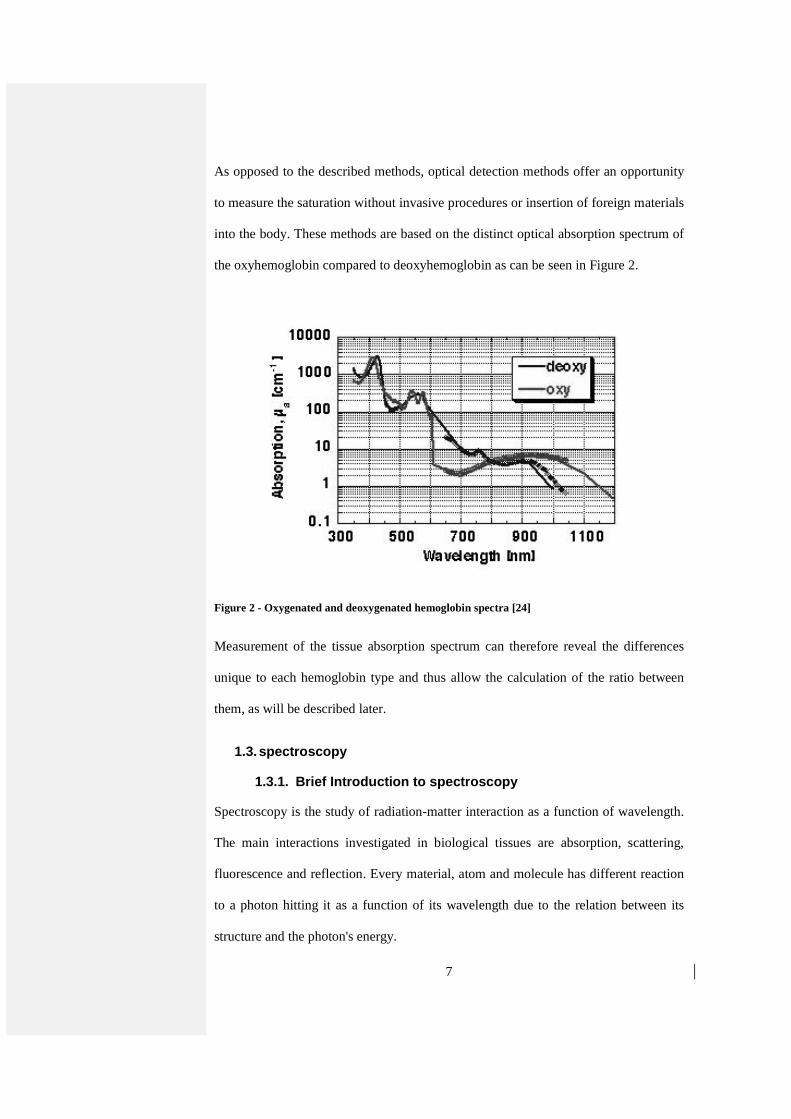
As opposed to the described methods, optical detection methods offer an opportunity
to measure the saturation without invasive procedures or insertion of foreign materials
into the body. These methods are based on the distinct optical absorption spectrum of
the oxyhemoglobin compared to deoxyhemoglobin as can be seen in Figure 2.
Figure 2 - Oxygenated and deoxygenated hemoglobin spectra [24]
Measurement of the tissue absorption spectrum can therefore reveal the differences
unique to each hemoglobin type and thus allow the calculation of the ratio between
them, as will be described later.
1.3. spectroscopy
1.3.1. Brief Introduction to spectroscopy
Spectroscopy is the study of radiation-matter interaction as a function of wavelength.
The main interactions investigated in biological tissues are absorption, scattering,
fluorescence and reflection. Every material, atom and molecule has different reaction
to a photon hitting it as a function of its wavelength due to the relation between its
structure and the photon's energy.

8
Figure 3 – Various optical interactions
Measuring the physical effects of these interactions can help determine the structure
and composition of the materials investigated. For example, in absorption processes
the absorbed photon's energy can excite an electron to a higher energy level.
Eventually, the electron will return to its original energy level, emitting another
photon (and the measured effect will be fluorescence) or producing heat (the
measured effect will be the temperature change). Measuring the emitted radiation
intensity or the produced heat can be used to estimate the number of absorbed photons
and calculate the absorbance.
The chances of each interaction to occur depend not only on the structure and
composition, but also on the wavelength. Therefore, by measuring the interaction at
several wavelengths, one can deduce the composition of the materials investigated.
This process, spectroscopy, is widely used in biomedical engineering and other fields
and is highly valuable in estimating the tissue's composition, structure and functional
state.

9
When interested in measuring a specific material concentration, one should know the
material's spectral properties in order to determine the appropriate spectroscopy
method. For example, materials which have a distinct absorbance (compared to the
surrounding tissue) can be detected using various methods of absorption spectroscopy.
The spectral properties of the tissue should also be considered. If the tissue is highly
scattering, measuring the absorption of a deep layer might be difficult.
Measuring the oxygenation can be performed using several spectroscopy methods,
based on the differences in the absorption of the hemoglobin types. As will be
described later, photothermal spectroscopy, used to measure absorption, is highly
sensitive in measuring superficial tissue spectral properties and therefore is the focus
of this research.
1.3.2. Absorption spectroscopy methods
The absorption spectrum of a tissue is obtained by measuring the absorption in several
wavelengths. Instead of directly measuring the number of photons absorbed, the
measurement focuses on measurable effects outside the tissue.
Since photons that are not absorbed have to leave the sample eventually, the
absorbance can be estimated by measuring the intensity of light emitted from the
sample by reflection or refraction. However, if the sample is scattering or composed
of more than one absorber, it will be difficult to estimate where the photons were
absorbed and the accuracy of absorbance calculation will be reduced. These are the
reasons this method is not highly accurate in measuring tissue absorbance. In addition,
since the measured organ is often large, it is hard to measure all the light emitting
from every direction. Several methods are based on this principle and include
transmission spectroscopy (measuring only the transmitted light, used for example in

10
pulse oximetry [25]) and diffuse spectroscopy (measuring only the reflected light after
scattering in the tissue [26]).
Another option is to measure side-effects of the absorption. As mentioned, the
absorbed energy is eventually released out of the tissue as heat or emitted photons.
Measuring the emitted fluorescence photons from preexisting molecules is called
autofluorescence spectroscopy. This method is limited by the optical properties of the
molecules of interest and requires careful calibration [27].
If the absorbed energy is released as heat, it could be measured by photothermal
spectroscopy (measuring the temperature increase, as will be discussed in detail in the
following section) or by photoacoustic spectroscopy (by measuring the ultrasonic
waves caused by the heating). Since photoacoustic spectroscopy measures the
temperature indirectly, it is sometimes considered as a photothermal method as well
(however, here it is treated separately). Although both methods are sensitive to
absorption, they differ in resolution and suitable applications.
Ultrasound scattering in biological tissue is significantly lower than optical scattering
and therefore the photoacoustic spectroscopy offers better spatial resolution in depth
measurements (deeper than 1mm). The increased resolution allows measuring fine
structures within the tissue, such as capillaries [28]. However, due to its nature, it has
reduced sensitivity to measurement on the tissue surface and therefore will have
reduced tumor detection rate. Another disadvantage is the need to couple the
ultrasonic reciever to the tissue, which cause difficulties in internal tissue
measurements [29].
Compared to the described methods, photothermal spectroscopy has clear advantages:
It offers high resolution to surface measurements (although weak in depth

11
measurements), strong sensitivity to hemoglobin oxygenation changes and requires no
prior injection of contrast agents. Measuring the temperature by radiometric means
removes the requirement of direct contact with the tissue, thus expanding
measurement possibilities. These characteristics make it ideal for surface oxygenation
measurements.
1.3.3. Photothermal spectroscopy
Photothermal spectroscopy was first introduced in a published paper inpaper in 1983
(initially observed in 1970 but not published). The basic principle of this method is
the measurement of temperature changes resulting from illumination on the sample
and extracting from them the material content of the sample. In this research, the
samples (potassium sulphate powders) were illuminated by a CO2 laser (wavelengths
of approximately 10µm) in order to estimate their spectra. The illumination was
selected to be pulsatile, causing increased and fast heating of the surface layers,
followed by a gradual heating of the lower layers and the entire sample. The algorithm
is based on the assumption that the temperature increase is proportional to the
absorption coefficient, and therefore uses the pulsatile pattern to deduce the spectrum,
thus reducing the effect of lower layers on the spectral measurement. Researchers
tried to avoid reaching "photothermal saturation", in which the heat from lower layers
reaches the surface of the specimen, causing the temperature increase to depend not
only on the upper layer and lowering the sensitivity to depth distribution [30].
The theory of the photothermal effects dependence on tissue structure was later
developed to include structures and tissues with different absorbing layers. Assuming
the tissue has bulk optical properties, with a single sub-surface layer with higher
absorption, the temperature measurement can indicate the depth of the absorbing

12
layer. A connection is described between the depth of the absorbing layer and the time
form pulse emission to measurement of temperature peak [31].
Depth profiling of absorbing layers in biological tissues was thoroughly investigated
for port-wine-stain (PWS) therapy. The treatment includes illumination with laser on
the PWS, causing thermal damage to the abnormal tissue followed by a wound-
healing response, clearing the PWS. The physician in such treatments should be aware
of the optical and structural properties of the tissue in order to avoid causing thermal
damage to other absorbing layers in the skin. A photothermal algorithm was
developed to assess the depth and width of the PWS layer (in which the main absorber
is hemoglobin) [6]. Figure 4 shows a comparison of the typical response to a pulse of
normal tissue and PSW tissue. The normal tissue has mainly one absorbing layer, the
epidermis which is effectively the highest layer (if we ignore the stratum corneum)
and therefore exhibits immediate temperature rise, followed by a slow decrease. The
PWS skin however, shows the epidermal response, followed by another temperature
increase, caused by the light absorbed in the PWS.
Figure 4 - Comparision of photothermal response of normal and PWS tissue [6]
13
In these researches the algorithms are based on the assumption that the absorption
coefficients of the bulk material and the absorbing layer are known, and only the
depth of the absorbing layer remains unknown. The algorithms do not compute the
spectrum of the tissue as it is assumed to be known [4, 32-33]. This assumption might
be reasonable for normal tissue but is irrelevant for tumors with unknown
oxygenation. Furthermore, assuming the absorption is not a function of wavelength
can result in erroneous results of the developed algorithms [34].
The accuracy of the depth and with of the absorbing layer calculation was evaluated
and found to decrease as the thickness/depth ratio decreases [7]. This conclusion
supports the assumption that photothermal spectroscopy should be used mainly for
surface tissues measurement.
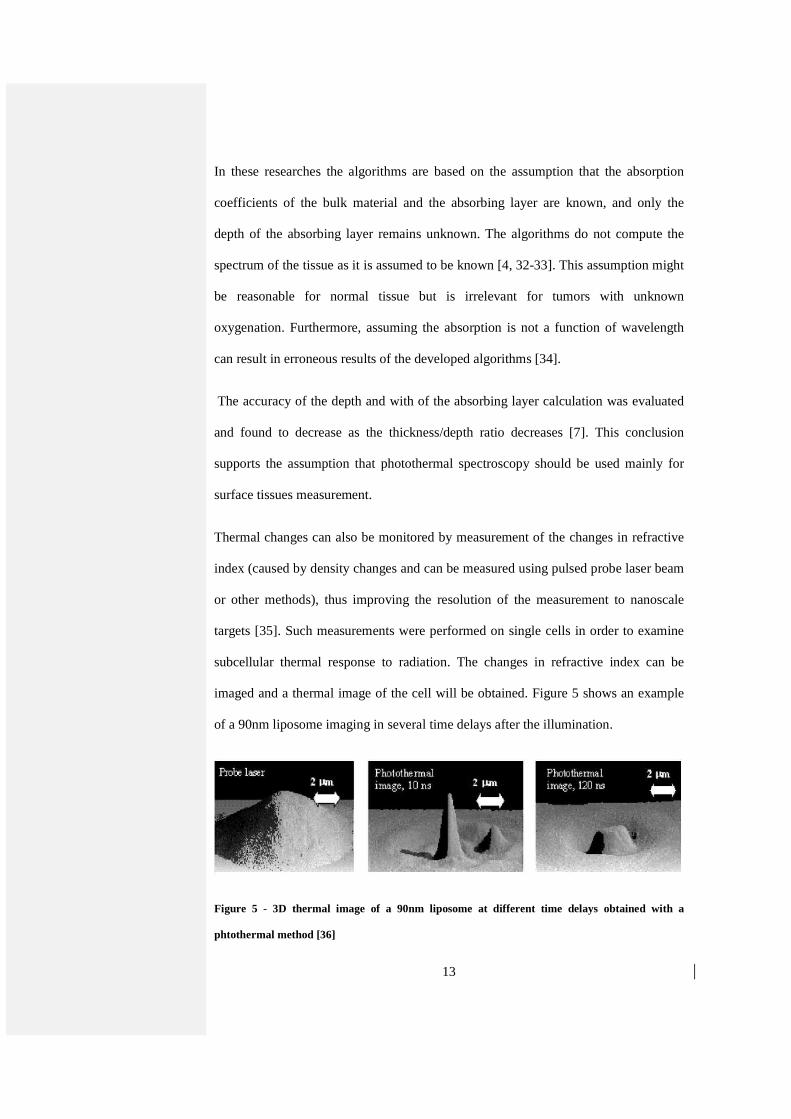
Thermal changes can also be monitored by measurement of the changes in refractive
index (caused by density changes and can be measured using pulsed probe laser beam
or other methods), thus improving the resolution of the measurement to nanoscale
targets [35]. Such measurements were performed on single cells in order to examine
subcellular thermal response to radiation. The changes in refractive index can be
imaged and a thermal image of the cell will be obtained. Figure 5 shows an example
of a 90nm liposome imaging in several time delays after the illumination.
Figure 5 - 3D thermal image of a 90nm liposome at different time delays obtained with a
phtothermal method [36]

14
The relatively fast measurement and high resolution allow imaging of moving cells
inside blood or lymph microvessels [37]. However, the method can only image a
single layer through transparent materials and therefore unsuitable to measurement of
layered tissue such as the skin.
1.4. Research objective
The importance of surface oxygenation measurements is undoubted, and the accuracy
of phtothermal spectroscopy in measuring surface heating was demonstrated, leading
to the conclusion that both should by combined to measure oxygenation
photothermally.
The described photothermal studied achieved impressive results and high resolution
but do not attempt to perform spectroscopy of a layered structure or tissue. Choosing
to use pulsed radiation focuses the measurement on the external layer of the tissue. In
case of oxygenation measurements, the center of attention should be on lower layers
containing most of the microvessels. These layers are relatively shallow, therefore
suitable for imaging photothermally, but absorb only a fraction of the pulse energy. In
other words, the information regarding the hemoglobin absorption spectrum can be
found on the photothermal saturation temperature and therefore can be better obtained
using CW radiation.
In addition, minimal invasive oxygenation measurement of internal organs was quite
restricted due to the described methods' limitations. The recent invention of IR fiber
bundles enables this measurement. Furthermore, the measurement can be performed
without limitations on fixed distance and orientation of the bundle. The fiber bundle
can be used inside a commercially available endoscope along with a fiber transmitting
the laser illumination.
15
This is the goal of the photothermal research in the lab. In order to use this method
through optical fibers, we would like first to have a reliable method working on
external tissues. When we know to how to deal with the challenges of tissue
measurement we can try to deal with the effect of fiber bundles.
To facilitate that, the objective of this thesis work is to create a reliable algorithm, and
procedures that could be used with minimal changes in different scenarios, including
different tissues and different mediations (such as different types of fibers). The
developed method is meant to be insensitive to errors and doesn't require calibration.
In order to develop the algorithm and test procedures, a theoretical model of the
photothermal response of a tissue was developed and could be used to test future
algorithm modifications.

16
2. Method
2.1. Theoretical model
2.1.1. Description of the model
A theoretical model of the problem was implemented in order to help design future
experimental setup and develop the algorithms and test procedures. The model
simulates the temperature rise in the tissue as a result of the laser illumination in the
same way that a thermal camera would capture it. A schematic chart of the model is
shown on Figure 6Figure 6.

17
Figure 6 – Schematic chart of the computational model
There are several theoretical models that describe the optical behavior of the skin,
varying on the layer division of the tissue and the method of calculating the effect of
illumination[38-39]. The most detailed model, a seven-layer model of the skin was
selected to estimate the optical properties of the skin depending on depth and
composition[40].
The integrated model was implemented using Matlab. All the sub-programs use a 2D
model with axial symmetry assumption. Most of the parameters of the model, such as
layer thickness or anisotropy, are considered as constants and were not changed
between calculations. However, they can be easily changed if necessary. Other, more
of interest, parameters, such as saturation or hemoglobin and melanin concentrations
were entered as input variables to the program.
The optical properties of each layer were calculated, taking into account material
concentrations and absorption spectrum, including the baseline absorption of the
tissue (the absorption of average tissue, without the main absorbers)[24, 41].

18
The program uses a Monte-Carlo simulation (MCML[42]) in order to evaluate the
absorption (photon density) in the skin for a given wavelength, depending on the
calculated optical properties. The convolution program CONV[43] was then used to
calculate the absorbed energy in the tissue as a function of radial distance and depth,
considering the radius of the beam and its shape.
The temperature rise of the tissue after the illumination was calculated using
COMSOL, a finite-element differential equation solver program. COMSOL solved
the heat transfer problem created using a predefined Bioheat module, which is
specifically designed for biological tissues. Although COMSOL has a user interface,
it was integrated into the simulation using the COMSOL script in order to fully
automate the simulation. The final temperature distribution on the surface of the skin
was considered as the predicted image that would have been seen by a thermal
camera.
By illuminating a large region of the tissue, using a wide beam or a scanning
apparatus, the saturation image of the tissue can be obtained. Otherwise, in order to
estimate the saturation at a single point, only the temperature measurements at the
point of interest are necessary. The latter option was selected for the calculations
throughout the paperthesis.
2.1.2. Model constants
The MCML program receives as input the optical properties of the layers, their
thickness and the number of photons to simulate.
The thickness of the layers, their optical properties and the concentration of blood and
water in each layer were taken from Meglinski et al.[40] and are presented on Error!
Reference source not found.Table 2.

19
Table 2 – Skin layers parameters used as input to the model[40].
Blood concentration [%]
H2O concentration [%]
Anisotropy Refraction index
Thickness [µm]
Layer
2.1*10-4 0.05 0.86 1.5 20 Stratum corneum
2.1*10-4 0.2 0.8 1.34 80 Epidermis
0.02 0.5 0.9 1.4 150 Papillary dermis
0.3 0.6 0.95 1.39 80 Upper blood net dermis
0.04 0.7 0.8 1.4 1500 Reticular dermis
0.1 0.7 0.95 1.38 80 Deep blood net dermis
0.05 0.7 0.75 1.44 6090 Hypodermis
The concentrations of the melanin and the hemoglobin were modified between
simulations and the absorption coefficient of each layer was calculated accordingly.
Show figure of absorption spectra here (oxyhem, deoxyhem, melanin, baseline).
The number of photons used as input for the simulation was usually 500,000 because
it produced reasonable repeatability in the final results (fluctuations of less than 0.1°C
– the resolution of the thermal camera). Since the accuracy of the model will be
unknown until the experimental stage, the repeatability of results was used as a
measure of accuracy.
The radial resolution and the z-axis resolution were selected as 0.01cm and 0.001cm
respectively for the MCML program and as 0.01cm and 0.06cm for the COMSOL
program. The resolution was selected according to computational limitations of both

20
programs and computing time limitations. The effect on the temperature calculation
results was compared to temperature calculations with better resolutions and was
found to be negligible (less than the resolution of the thermal camera).
An additional difference between the models that were calculated by both programs
was the tissue's depth. Since the MCML calculations showed negligible absorption in
deep layers of the tissue and their effect on external layer temperature is small, the
depth of the COMSOL tissue model was reduced from 0.8cm to 0.4cm in order to
reduce calculation time and memory use.
The radius of the gaussian laser beam used for the calculation of CONV was 0.5cm
and accordingly the radial size of the tissue in COMSOL was selected as 1.5cm
(instead of infinite as in MCML). The tissue illumination time was 0.2 seconds. The
laser energy was changed according to the melanin content of the tissue, in order to
achieve tissue temperatures up to 320K. Since the tissue is heated locally and for a
very short period of time, the damage to the tissue is minimal if not negligible[44].
Although the tissue is heated several times, the short and moderate heating also
prevents other changes in the tissue affecting the optical and thermal parameters. The
tissue's thermal parameters were based on COMSOL's database in correlation with
existing literature[45]. The density of the tissue and the blood was 1090kg/m3. The
specific heat was 3350 J/(kg·K). The thermal conductivity of the tissue was 0.3
W/(m·K). Blood perfusion rate was 0.0064 sec-1.
2.2. Simulation plan
Although all parameters of the model can be easily changed, only those that had a
significant effect on the tissue absorption and therefore on the temperature were

21
changed (such as melanin and hemoglobin concentration and hemoglobin oxygen
saturation). These changes account for different types of tissue.
The melanin concentrations in the simulation were changed between 0%-25% (but
mostly 0%-10%). Melanin concentration of 0% is technically skin without melanin
but can also represent an internal tissue. Melanin concentration of 10% represents
moderately pigmented skin[41].
The minimal hemoglobin concentration in the simulation was 9g/liter representing a
state of anemia and the maximal value was 15g/liter representing a normal state for
men and high concentration for women.
The hemoglobin saturation was calculated as the ratio between the concentration of
oxygenated hemoglobin and the total concentration of the hemoglobin. The simulated
values included the entire range of 0%-100%.
Running the simulation for a single wavelength with a 4GHz PC processor requires
about 180 seconds. Multiple runs with changes in parameters are easy to perform and
require additional 120 seconds per run.
2.3. Theoretical model of the temperature function
The measured temperature dependence on the oxygen saturation was studied in order
to develop the required saturation experimental measurement method.
The external temperature increase is composed of the contributions of all the heated
layers in the tissue. Each layer that absorbs energy is heated and some of the heat is
transferred to the upper layers and eventually affects the external temperature. The
effect of each layer depends on its depth, physical properties and other parameters.
The total external temperature increase will be:

22
(2) ( ) ( 1) ( 2) ( 3)T T layer T layer T layerλ = ∆ + ∆ + ∆ +⋯
The temperature contribution of each layer is marked by ∆ T(layer i).
The absorption of each layer is a function of its effective absorption coefficient and
the available energy for absorption arriving to it. The effective absorption coefficient
is the weighed sum of the absorption coefficients of the materials in each layer,
according to their relative concentrations. The available energy for absorption arriving
to a layer depends on the properties of the layers above it. Clearly, when the upper
layers absorb most of the available energy, the temperature increase at the layer under
consideration will be small, even if it has a high absorption coefficient. In a similar
manner, the same layer, placed below layers with small absorption coefficients, will
absorb more light and will heat to a higher temperature. The effect of the upper layers
depends on many variables, such as their thermal and optical properties, thickness and
other physical properties.
Therefore, the temperature function of the tissue is of the form:
(3) ( ) ( )0 1 1 2 1 2 3 1 2 3( ) ,T T f A f A A f A A Aλ = + ⋅ + ⋅ + ⋅ +⋯
Where each parameter Ai represents the absorption of the i-th layer's. The functions fi
represent the effect of the other mentioned parameters on the absorption of the i-th
layer (the absorption of the above layers and the thermal and physical properties of
the i-th layer, not shown in the equation).
The function f1 is independent of the absorption of any layer and depends only on
thermal and geometrical properties. Although other optical properties, such as
scattering, also depend on the wavelength, it is assumed that they are constant while
dealing with a narrow wavelength range. Therefore, f1 is independent of wavelength

23
and can be approximated as a constant for a specific set of measurements in similar
wavelengths.
(4) 11 af ≅
Using similar assumptions, the function f2 is independent of wavelength, except for
the dependency of A1. Therefore, it can be approximated using a Taylor series, for the
variable of A1.
(5) ( ) ( ) ( ) ( ) ( )2' ''2 1 2 2 1 2 1
10 0 0
2f A f f A f A≅ + ⋅ + ⋅
Since only A1 is a function of wavelength, the function f2 and its derivatives for a
specific value of A1 (in this case A1=0) can be written as:
(6) ( ) ( )22 1 1 2 1 3 1f A b b A b A≅ + ⋅ + ⋅
Where bi are coefficients that need to be determined from the problem
The function f3 can be written in a similar way.
(7) ( ) ( ) ( ) ( )3 3
3 1 2 3 1 2 1 2 1 3 21 2
, 0,0 0,0 0,0f f
f A A f A A c c A c AA A
∂ ∂≅ + ⋅ + ⋅ = + ⋅ + ⋅
∂ ∂
Using the above forms of the functions fi it is possible to rewrite the temperature
function shown in equation (3) (3). The number of coefficients in the equation is
determined by the required accuracy. For example, it could have the following form.
(8) ( )( ) ( )2
0 1 1 1 2 1 3 1 2 1 2 1 3 2 3( )T T a A b b A b A A c c A c A Aλ = + ⋅ + + ⋅ + ⋅ ⋅ + + ⋅ + ⋅ ⋅ +⋯
Fewer coefficients means lower accuracy, and the temperature equation takes the
following form:

24
(9) ( ) ( )0 1 1 1 2 1 2 1 2 1 3 2 3( )T T a A b b A A c c A c A Aλ = + ⋅ + + ⋅ ⋅ + + ⋅ + ⋅ ⋅ +⋯

25
3. Theoretical results
3.1. Preliminary calculations
An example of the results of CONV is presented on Figure 7Figure 7. The example
represents normal skin tissue with 5% melanin concentration, 15g/l Hemoglobin, 90%
saturation. The excitation was done by a 0.2W CW 434nm light source for 0.2
seconds and the radius of the laser beam was 0.5cm. The absorption is displayed in
J/cm3.
Most of the energy is absorbed in the epidermis (because of the melanin) and in the
upper blood net dermis (because of the hemoglobin). Deeper layers, or layers without
a significant concentration of these highly absorbing materials, absorb less energy but
are not insignificant. The color scale represents the absorption in units of Joule/cm3.
Figure 7 - Example of CONV output for skin tissue

26
The results of the COMSOL analysis for the same example can be seen in Figure
8Figure 8.
Figure 8 - Example of COMSOL output for skin tissue
Figure 7Figure 7 and Figure 8Figure 8 show that the tissue radius that is affected by
the laser illumination is lower than 1.5cm. As mentioned above, this value was
selected as the radial size of the tissue for the COMSOL simulations. The thermal
image the thermal camera will capture in this case is presented in Figure 9Figure 9.

27
Figure 9 – Thermal image of the tissue
The time constant for temperature relaxation back to equilibrium was also calculated
and is approximately 0.6 seconds.
In order to examine the effect of melanin in different wavelengths, a preliminary
calculation was performed on large wavelength range, with low wavelength resolution
(10nm). Figure 10Figure 10 shows the surface temperature on the illumination point as a
function of wavelength for several oxygen saturation levels (0%, 25%, 50%, 75% and
100%) and melanin concentrations (5%, 15% and 25%). Since the illumination source
operates in the visual or NIR range, it is not expected to affect the temperature
measurement, which is usually performed in the 8-12µm
28
range.
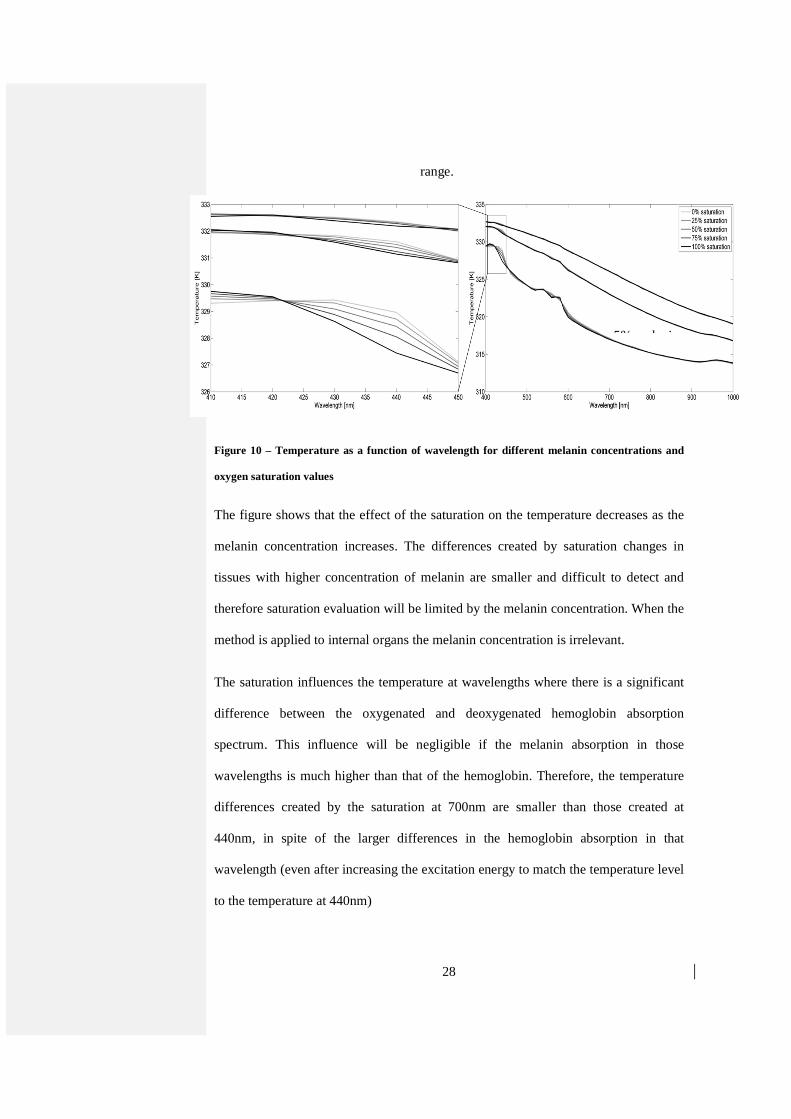
Figure 10 – Temperature as a function of wavelength for different melanin concentrations and
oxygen saturation values
The figure shows that the effect of the saturation on the temperature decreases as the
melanin concentration increases. The differences created by saturation changes in
tissues with higher concentration of melanin are smaller and difficult to detect and
therefore saturation evaluation will be limited by the melanin concentration. When the
method is applied to internal organs the melanin concentration is irrelevant.
The saturation influences the temperature at wavelengths where there is a significant
difference between the oxygenated and deoxygenated hemoglobin absorption
spectrum. This influence will be negligible if the melanin absorption in those
wavelengths is much higher than that of the hemoglobin. Therefore, the temperature
differences created by the saturation at 700nm are smaller than those created at
440nm, in spite of the larger differences in the hemoglobin absorption in that
wavelength (even after increasing the excitation energy to match the temperature level
to the temperature at 440nm)
5% melanin

29
In order to develop a method suitable to high melanin concentration as possible, the
most suitable wavelength range is 400-450nm. For internal organs applications, where
melanin is not present, one might consider the near IR range, where the absorption
differences between oxygenated and deoxygenates hemoglobin are higher.
The focus in the rest of this document is on the wavelength range between 410nm and
442nm. However the goal of this work is to develop a generic method that would also
apply to other wavelength ranges and applications.
3.2. Comparison between calculations and the theoretical model
In order to derive the calculated temperature dependence on wavelength, the
temperature function was evaluated again, this time from calculations of the
simulation on various types of skin tissues.
With that aim, the dependence of the surface temperature function on various
variables was calculated.
Water: Figure 11Figure 11 shows the temperature as a function of wavelength in a
skin tissue with 5% melanin concentration and 9g/dl hemoglobin concentration with
50% saturation. The power used was 0.8W for 0.2 second, with and without the
absorption of water (the absorption coefficient is set to zero).

30
Figure 11 -temperature dependance on water concentration
The figure shows that in the relevant wavelength range, the water's absorption hardly
affects the temperature because of their relatively small absorption coefficient.
Therefore, the temperature function is practically independent of the water
concentration.
Hemoglobin concentration: In order to evaluate the temperature's dependence on the
hemoglobin concentration, the simulation was performed on the same tissue model
Formatted: Left
31
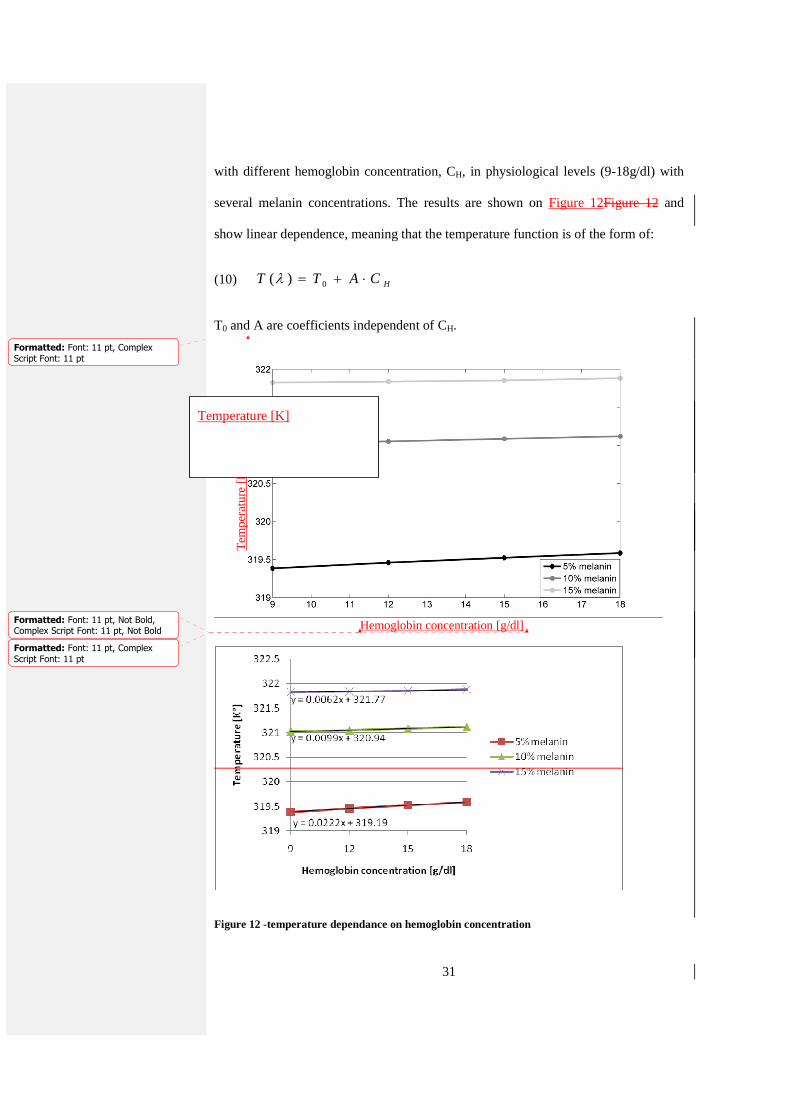
with different hemoglobin concentration, CH, in physiological levels (9-18g/dl) with
several melanin concentrations. The results are shown on Figure 12Figure 12 and
show linear dependence, meaning that the temperature function is of the form of:
(10) HCATT ⋅+= 0)(λ
T0 and A are coefficients independent of CH.
Figure 12 -temperature dependance on hemoglobin concentration
Hemoglobin concentration [g/dl]
Te
mpe
ratu
re [
K]
Temperature [K]
Formatted: Font: 11 pt, Not Bold,Complex Script Font: 11 pt, Not Bold
Formatted: Font: 11 pt, Complex
Script Font: 11 pt
Formatted: Font: 11 pt, Complex
Script Font: 11 pt

32
Oxygen saturation: Similarly, different saturation levels, S, were simulated in order
to evaluate the saturation's effect on temperature. Figure 13Figure 13 shows the
temperature dependence of the oxygenation for 5% melanin concentration and 12g/dl
hemoglobin concentration.
Figure 13 -temperature dependance on hemoglobin saturation
The results show that the temperature function is of the form:
(11) ( )( )0 0( ) 1H H H HbO HbT T B C T B C S Sλ µ µ µ= + ⋅ ⋅ = + ⋅ ⋅ ⋅ + − ⋅

33
µH is the effective absorption of the hemoglobin, depending on the saturation:
(12) ( )1H HbO HbS Sµ µ µ≡ ⋅ + − ⋅
µHb and µHbO are the deoxygenated and oxygenated hemoglobin absorption
coefficients. T0 and B are coefficients independent of CH, S and the hemoglobin
absorption.
Melanin concentration: Figure 10Figure 10 shows that the melanin concentration is
the main contributor to the temperature increase. Simulations shown in Figure
14Figure 14 show that the melanin adds a non linear contribution to the temperature
rise. Figure 12Figure 12 shows the changes in the melanin concentration also have an
effect on the hemoglobin contribution.

34
Figure 14 -temperature dependance on melanin concentration
Assuming the concentration and absorption coefficient of the melanin affect the
absorption in the same manner (since the absorption is proportional to their
multiplication), small changes in the absorption coefficient will have a linear effect on
the temperature, for constant hemoglobin absorption, and negligible effect on the
hemoglobin's contribution.
Baseline absorption: Since most of the tissue is considered as baseline tissue, the
concentration of that tissue will not change significantly due to changes in other
materials concentrations. The main reason for change in the baseline absorption is the
dependence of the absorption on the wavelength. The baseline absorption is 2.03cm-1
at 410nm and 1.345cm-1 at 442nm, ratio of 1.5. Figure 15Figure 15 shows the same
calculations as in Figure 12Figure 12, with doubled baseline absorption coefficient.
The hemoglobin contribution was hardly changed and the total temperature
contribution of the baseline tissue depends linearly on the melanin concentration.

35
Figure 15 -temperature dependance on melanin and hemoglobin concentrations, with doubled
baseline absorption coefficient
The re-evaluated temperature function is therefore of the form:
(13) ( ) ( ) ( )( )0( ) , , 1M M B B M M B B H HbO HbT T F C C G C C C S Sλ µ µ µ µ µ µ= + + ⋅ ⋅ ⋅ + − ⋅

36
µM and CM are the melanin absorption and concentration respectively. µB and CB are
the baseline tissue absorption and concentration respectively. F and G are functions of
melanin and baseline material concentrations and absorption coefficients.
However, for narrow wavelength range, the temperature function can be
approximated to the following simple equation:
(14) ( ) ( )( )0( ) , 1M M B B H HbO HbT T B C C A C S Sλ µ µ µ µ= + + ⋅ ⋅ ⋅ + − ⋅
Where A is a constant and B is a bilinear function of the melanin and baseline
absorptions.
Following the above calculations the following assumptions can be made:
The calculations of the effective absorption of the different layers do not need to take
into account the water content of the tissue, and may include only melanin,
hemoglobin and baseline absorption.
The linear dependence of the temperature on the hemoglobin concentration indicates
that higher order terms of A4 (the absorption of layers rich in hemoglobin) in
equations 7 and 8 can be neglected.
By comparing equation 2 and equation 12 it is seen that A4 is approximately the
hemoglobin absorption (the hemoglobin is the dominant absorber in the upper blood
net dermis, the forth layer). Any effect of the baseline absorption in the layer can be
corrected by slightly changing the bilinear function B.
Since the concentrations are unknown and are multiplied by other unknown
coefficients, the equation can be written in the following simple form:
37
(15) ( )0 1 2 3 4
1M B M B H
H HbO Hb
T T a a a a
S S
µ µ µ µ µ
µ µ µ
= + ⋅ + ⋅ + ⋅ ⋅ + ⋅
= ⋅ + − ⋅
This equation is consistent with the general temperature function calculated in
equation 8 (because the melanin layer is indeed above the baseline layer and the
stratum corneum absorbance is negligible).
3.3. Algorithm
The temperature function has a known form depending on a finite number of
unknown coefficients (T0, a1, a2, a3, a4 and S) and a set of well-known variables (the
absorption coefficients , ,M B Hµ µ µ ). The unknown coefficients are constant for a
specific set of measurements (although they can change between people and
measurement locations) and therefore by measuring, or in this case calculating, the
temperature in a sufficient number of wavelengths there will be sufficient data to
extract the unknowns, and specifically the saturation.
Although the temperature function is known, direct solution of the equation system is
not recommended, due to its high vulnerability to temperature measurement errors
and inaccuracies in the theory. Even though this method might work for the results of
the simulation, it might produce poor results on real experiments, unless the function
is calibrated and evaluated again. This would require measurements for a wide set of
material concentrations and different skin types and could be done on a later stage if
necessary.
Therefore, a more generic method is preferred. A generic method could also be
applied to internal organs with minimal adaptation.
The selected method was curve fitting between the measured temperature curve and
the theoretical temperature function, with the coefficients and the saturation value as

38
unknowns. The algorithm inputs are the estimated temperature function and a set of
measurements. Its output is the specific set of unknowns that provide the best fit to the
temperature equation. An example for a suitable algorithm is Matlab's curve-fitting
toolbox, which was used throughout this paper.
The accuracy of curve fitting algorithms improves as the number of measurement
points increases (in this case, the number of temperature measurements). However,
additional measurements require more time. Therefore, the number of measurements
should be a compromise between time and accuracy constraints. In this paperthesis,
each set of calculations included nine different wavelengths. As mentioned, the
selected wavelength range for the saturation evaluation was 410-442nm because in
that range the hemoglobin has a higher absorption coefficient compared to the
melanin. The calculations were performed for the following wavelengths: 410nm,
414nm, 418nm, 422nm, 426nm, 430nm, 434nm, 438nm and 442nm.
The probability of finding a solution (finding a set of values that would cause
convergence of the algorithm error to zero) depends on the number of unknowns and
on the initial guess entered to the program. Therefore, reducing the number of
unknowns and developing a good initial guess algorithm are essential to finding the
saturation accurately.
3.4. Saturation estimation
3.4.1. Skin tissue
In order to decrease the number of unknowns, the input function to the algorithm was
selected as the difference between the temperature function at the measured
wavelength and its value at 410nm, which eliminates the need to find T0. The new
function, marked as X, is therefore:

39
(16)
( )( )
1 2 3 4 410 1 , 2 , 3 , , 4 ,
1 ,410 2 ,410 3 ,410 ,410 4 ,410
, , , , ,M M B M B H
M B M B H
X a a a a C S T T a a a a
a a a a
λ λ λ λ λ λµ µ µ µ µ
µ µ µ µ µ
= − = ⋅ + ⋅ + ⋅ ⋅ + ⋅
− ⋅ + ⋅ + ⋅ ⋅ + ⋅
Another way to reduce the number of unknowns is by applying the algorithm on the
derivative of the temperature function, producing the following equation:
(17) '1 2 3(0.1 ' 0.9 ') ' 'M B B HT a a aµ µ µ µ= ⋅ ⋅ + ⋅ + ⋅ + ⋅
This equation is based on the assumption of CM=0.1 (10%) in order to reduce the
number of unknowns. Since the algorithm searches for the best fit to the actual
function, it will rectify the error caused by changing the weight of the papillary dermis
baseline absorption (a2) accordingly.
Calculating the temperature function's derivative might have low accuracy, depending
on the wavelength resolution of the temperature measurements and their accuracy.
However using this equation in the curve-fitting algorithm is less sensitive to the
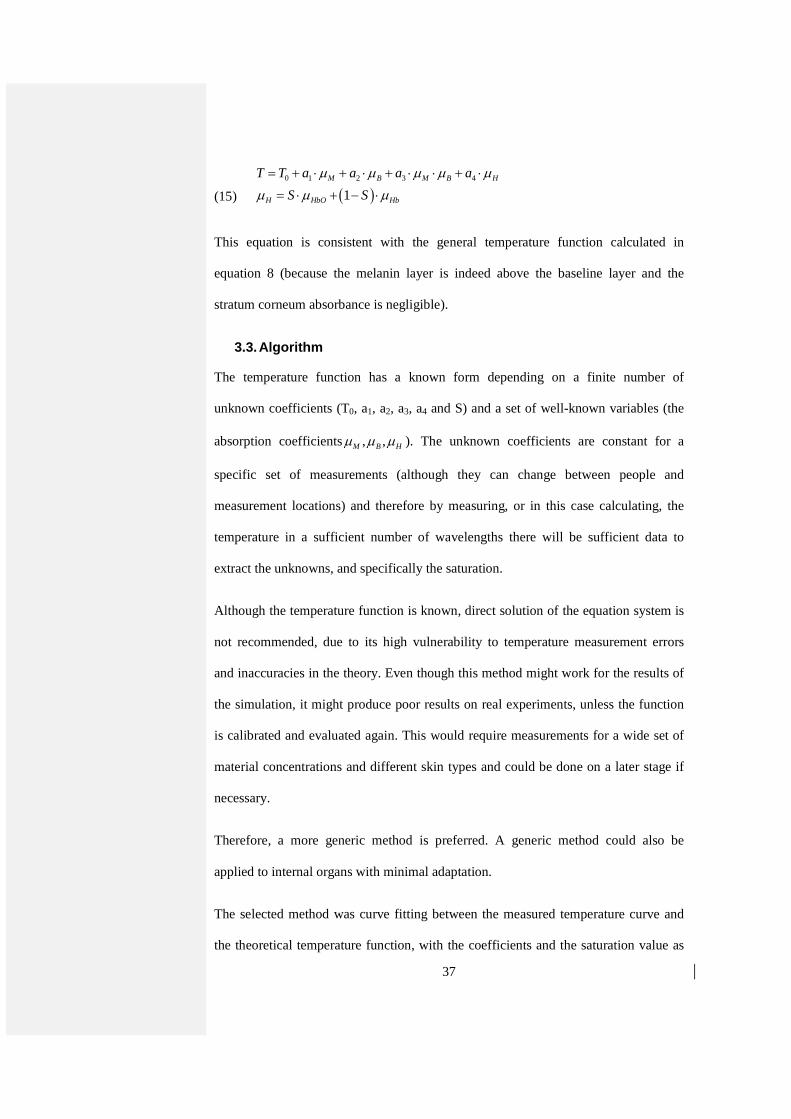
initial guess and therefore it can be used as the initial guess algorithm. Figure
16Figure 16 and Figure 17Figure 17 show the results of the algorithm when applied
on tissue temperature calculations for different concentrations of melanin. The initial
guess of the saturation was 50%. The estimated saturation is displayed as a function of
the true saturation that was used for the simulation. The black line indicates the ideal
result where the estimated saturation is equal to the true saturation.
40
Figure 16 – Initial saturation algorithm results for very fair skin: 2.5%-5% melanin
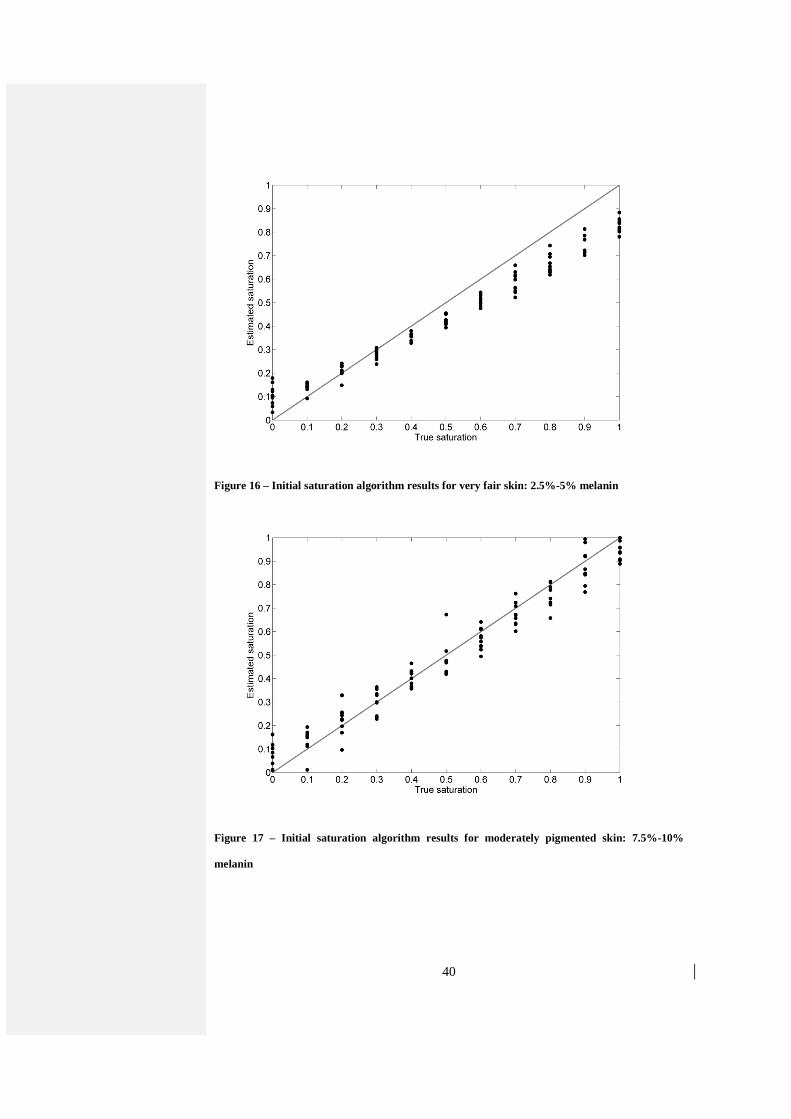
Figure 17 – Initial saturation algorithm results for moderately pigmented skin: 7.5%-10%
melanin

41
The estimated saturation results were then used as the initial guess for the algorithm
with the temperature difference function described above. The results are shown on
Figure 18Figure 18 and Figure 19Figure 19.
Figure 18 – Algorithm results for very fair skin: 2.5%-5% melanin
Figure 19 – Algorithm results for moderately pigmented skin: 7.5%-10% melanin

42
Error! Reference source not found.Table 3 shows the root mean square (RMS) of
the error of the saturation estimation results of the final algorithm.
Table 3 –Error RMS of saturation for different skin compositions
Hemoglobin: 9g/liter 10.5g/liter 12g/liter 13.5g/liter 15g/liter Total
2.5% melanin 8% 7.6% 6.8% 7.7% 8.1% 7.7%
5% melanin 8.7% 5.1% 6.3% 5.4% 6.8% 6.6%
7.5% melanin 5.2% 6.4% 5.9% 6.4% 8.1% 6.5%
10% melanin 9.1% 6.4% 7.1% 8.4% 5.7% 7.5%
3.4.2. Skin tissue without melanin – internal tissu e
As mentioned, the described method can be also applied on internal tissues, using a
commercially available endoscope. In order to evaluate the accuracy of the method
when applied on such a tissue, it was tested on the calculated skin tissue model,
without melanin. This model might not accurately describe any internal tissue, but as
a generic sample for a generic method, it should be sufficient for initial evaluation.
The temperature function is obviously different in this case. The melanin, which was
very dominant in the skin tissue, does not exist in the internal tissue modeled.
Therefore, the absorption of the epidermal layer will now be approximately equal to
the baseline absorption. In addition, the strong absorption of the melanin masked the
effect of lower layers and without it they become more significant. Therefore, the
absorption of the deep blood net dermis is stronger and affects the temperature
increase. The absorption of this layer is affected by the above absorption of the
hemoglobin and baseline tissue. According to the previously described
approximations, that would be manifested in the temperature function seen here.

43
(18) 2 2 2 2
0 1 2 3 4 5B B B H B H HT T a a a a aµ µ µ µ µ µ µ= + ⋅ + ⋅ + ⋅ ⋅ + ⋅ ⋅ + ⋅
The initial guess algorithm was based on the simplified equation:
(19) 0 1 2 HT T a aλ µ= + ⋅ + ⋅
This equation is based on an additional approximation of the temperature function.
The initial saturation guess for the initial guess algorithm was 50%.
Figure 20Figure 20 shows the result of the saturation initial guess algorithm.
Figure 20 – Initial saturation algorithm results for skin tissue without melanin (internal tissue)
The results of the initial guess algorithm are poor, but they were sufficient for
receiving good results in the final algorithm were therefore chosen.
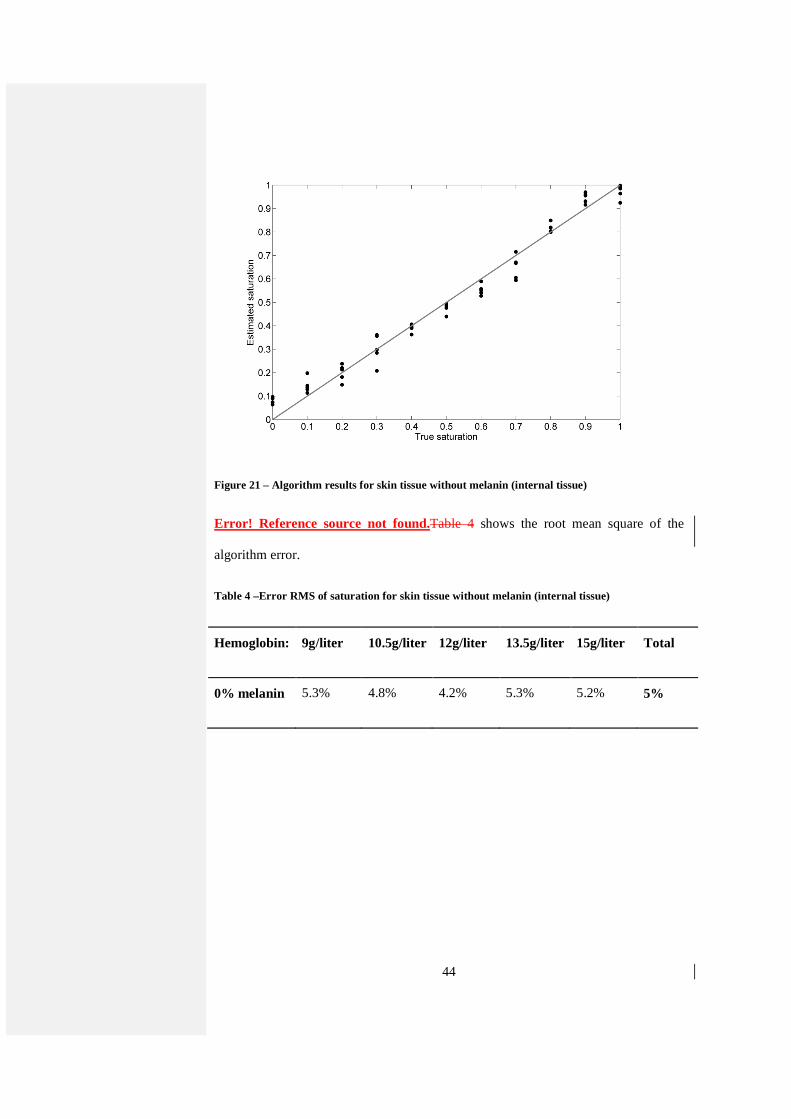
Figure 21Figure 21 shows the result of the final algorithm.
44
Figure 21 – Algorithm results for skin tissue without melanin (internal tissue)
Error! Reference source not found.Table 4 shows the root mean square of the
algorithm error.
Table 4 –Error RMS of saturation for skin tissue without melanin (internal tissue)
Hemoglobin: 9g/liter 10.5g/liter 12g/liter 13.5g/liter 15g/liter Total
0% melanin 5.3% 4.8% 4.2% 5.3% 5.2% 5%

45
4. Experimental validation
4.1. Setup
An experimental setup implementing the method was set up in the laboratory. The
models were illuminated by a continuous-wave tunable titanium–sapphire laser
(3900S; Spectra Physics) pumped by a frequency-doubled continuous-wave
neodymium/yttrium-vanadate (Nd:YVO4) laser (Millennia Vs; Spectra Physics) and
were imaged by a thermal imaging camera (Thermovision A40; FLIR Systems).
The imaging resolution is the camera's spatial resolution which is 1.3 mrad. The
thermal sensitivity (affected by the spectral resolution and other factors) is 0.08°C
which is of the same order as the simulation errors and therefore reasonable. The
camera acquires images at 30Hz, faster than the heating (which is in the order of a
minute) and therefore more than adequate for this application.
The relative intensity of the laser at every wavelength was measured and used to
normalize the results to an equal intensity level. The measurements were performed in
several wavelengths between 720nm-810nm.
4.2. Methods and Materials
Phantoms were prepared by adding various absorbers to agar solution (Gibco). The
absorbers were used to simulate materials with different absorption coefficients,
representing the oxygenated and deoxygenated hemoglobin and the melanin. Since the
method is not limited to estimating the saturation of a specific material, the absorption
spectra of the materials used does not have to be similar to the spectra of the materials
they represent.

46
The hemoglobin was represented by ICG (Cardiogreen, Fluka) and Methylene Blue (Sigma-
Aldrich). The Methylene Blue was diluted to a 32mg/liter solution which was
considered as 100% Methylene Blue in all the models prepared. The concentration
was selected because models containing this solution were heated to a reasonable
level of several degrees: High enough for detection but not to an unrealistic degree
which might damage a biological model. Whereas the Methylene Blue solution was
prepared prior to the experimental stage, the ICG solution had to be prepared before
each set of experiments, due to its sensitivity to light (causing its quick degradation).
The concentration was determined using trial and error before each set of
measurements because of the inaccuracies in weighing the small amount of powder
required (less than a milligram). The absorption of both solutions was measured to
ensure similar magnitude of absorption (like the hemoglobin in the blood). Since ICG
spectrum changes in different concentrations, the spectrum measurements were used
as input for the algorithms for each set of measurements.
The melanin was simulated with ink solution (Indian ink; Talens). The ink was selected
since its absorption dependence on wavelength is relatively linear, like that of the
melanin.
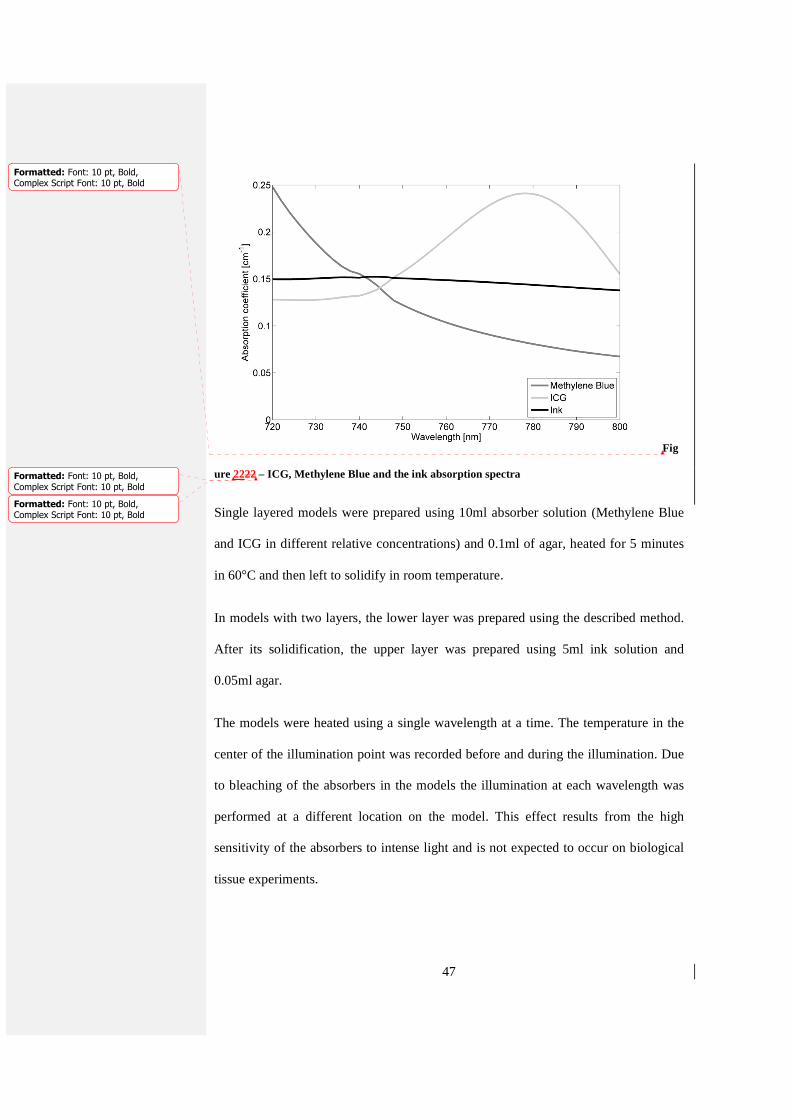
The absorption coefficients of all materials: Methylene Blue, ICG and the ink, for
one of the sets of measurements, can be seen on Figure 17.
47
Fig
ure 2222 – ICG, Methylene Blue and the ink absorption spectra
Single layered models were prepared using 10ml absorber solution (Methylene Blue
and ICG in different relative concentrations) and 0.1ml of agar, heated for 5 minutes
in 60°C and then left to solidify in room temperature.
In models with two layers, the lower layer was prepared using the described method.
After its solidification, the upper layer was prepared using 5ml ink solution and
0.05ml agar.
The models were heated using a single wavelength at a time. The temperature in the
center of the illumination point was recorded before and during the illumination. Due
to bleaching of the absorbers in the models the illumination at each wavelength was
performed at a different location on the model. This effect results from the high
sensitivity of the absorbers to intense light and is not expected to occur on biological
tissue experiments.
Formatted: Font: 10 pt, Bold,Complex Script Font: 10 pt, Bold
Formatted: Font: 10 pt, Bold,
Complex Script Font: 10 pt, Bold
Formatted: Font: 10 pt, Bold,Complex Script Font: 10 pt, Bold

48
Further emphasis was put on controlled measurement environment, including constant
room temperature and preventing cooling by air flow from external sources.
4.3. Results
The theoretical simulation used does not consider model cooling by external air and
therefore in the experiments the heating was slower and the temperature does not
exceed a certain limit. This limit temperature is reached when the model is in thermal
equilibrium with the surroundings. The temperature increase is considered as the
difference between the limit temperature and the initial temperature.
Since the heating is slow the limit temperature is reached after several minutes. An
algorithm decreasing the required measurement time was developed in order to
prevent inaccuracies resulting from the long measurement (changes in external
temperature, calibration drift and model bleaching). This algorithm estimates the
initial temperature as the average temperature before the illumination and the heating
as exponential using curve-fitting methods. Using the algorithm shortens the required
measuring time and reduces the effect of noise on the temperature estimation. Figure
18 shows the original temperature measurement (solid line) and the estimation
(dashed line). In this case the initial and limit temperatures were estimated at 293.57
and 296.13 degrees respectively.

49
Figure 18 – Temperature measurement of the agar model (solid line) and the algorithm's
approximation (dashed line)
The temperature increase for each wavelength used for the illumination was
calculated in this manner and used to estimate the model's saturation. The saturation is
defined as the ratio of Methylene Blue to (Methylene Blue + ICG).
Initially, single layer phantoms were prepared and measured in 5 wavelengths (720,
740, 760, 780 and 800 nm). The initial saturation guess was 50% and the temperature
function used was:
(20) ( )1 2 1MB ICGT a a S Sµ µ ∆ = + + −
The combined results of several experiments are presented in Figure 19. The solid
lines represent +10%, 0% and -10% deviations from accurate estimation.

50
Figure 19 – Algorithm results for single layer phantoms (5 wavelengths)
The accuracy of the algorithm was reasonable (8.5% RMS) and therefore more
complicated phantoms were created. These phantoms were composed of two layers:
An absorbing upper layer simulating the epidermis which contains ink and the lower
layer simulating the blood net layers containing the ICG and Methylene Blue.
The temperature function used was:
(21) ( )1 2 31MB ICG inkT a a S S aµ µ µ ∆ = + + − +
Seven wavelengths (720, 735, 750, 765, 780, 795 and 810 nm) were used. In order to
improve the estimation, the results of the saturation estimation were used for
additional runs of the algorithm in order to reach better convergence. In this case
instead of 50% initial guess, 10 different initial guesses were used and the final results
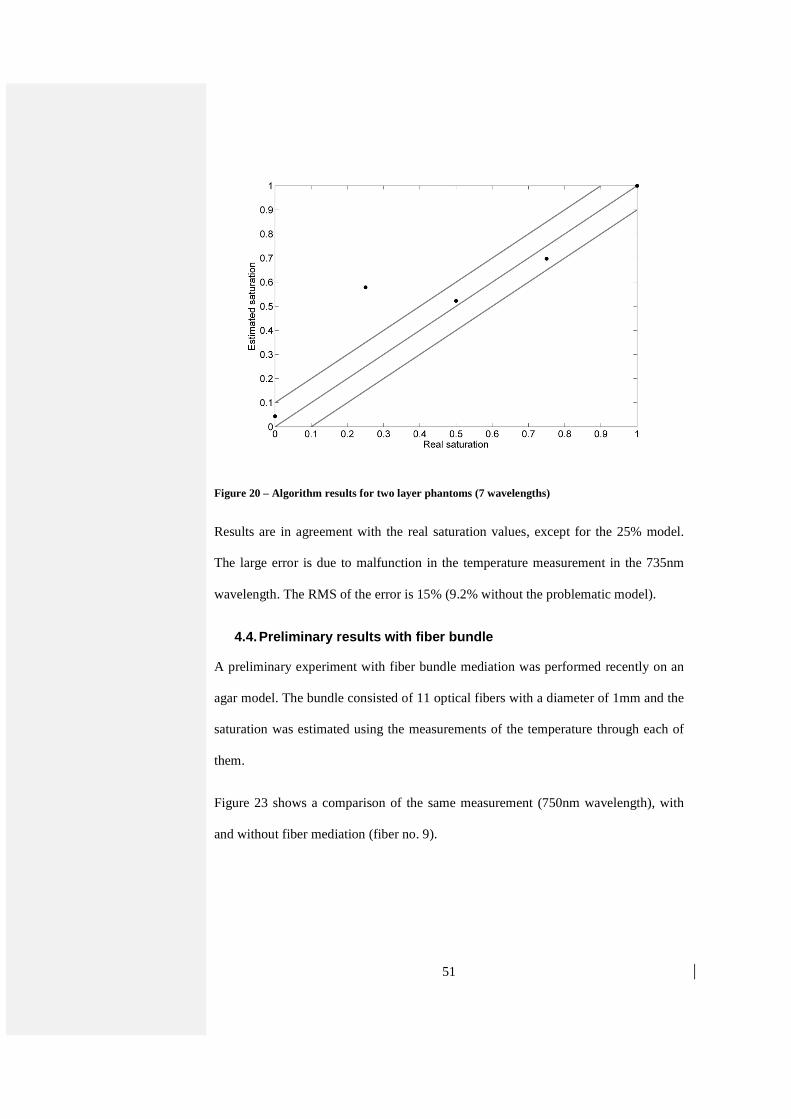
were averaged to achieve to final estimation. The results are shown on Figure 20.
51
Figure 20 – Algorithm results for two layer phantoms (7 wavelengths)
Results are in agreement with the real saturation values, except for the 25% model.
The large error is due to malfunction in the temperature measurement in the 735nm
wavelength. The RMS of the error is 15% (9.2% without the problematic model).
4.4. Preliminary results with fiber bundle
A preliminary experiment with fiber bundle mediation was performed recently on an
agar model. The bundle consisted of 11 optical fibers with a diameter of 1mm and the
saturation was estimated using the measurements of the temperature through each of
them.
Figure 23 shows a comparison of the same measurement (750nm wavelength), with
and without fiber mediation (fiber no. 9).

52
Figure 23 - Optical fiber mediation effect on the temperature increase measurement by the
thermal camera
One can see the apparent noise added by the fiber and the reduction of the signal
(which correlates to a lower temperature increase measured by the camera). The
different initial temperature can result from different room temperature at the time of
measurement.
Although the measured temperature increase is attenuated, the developed algorithm is
indifferent to absolute temperature increase values. The calculated saturation is a
function of relative values at the different wavelengths. Therefore, as long as the
signal-to-noise ratio is sufficiently high, the temperature increase is estimated
correctly and the accuracy of the saturation estimation should not decrease.
The algorithm saturation estimation results for the data obtained from each fiber are
shown in Figure 24.

53
Figure 24 - Saturation estimation results with fiber bundle mediation (right) and the thermal
image of the bundle (left)
The required result is 100% saturation of the Methylene Blue which was used for the
fabrication of the model. The same value was estimated using the method without the
bundle and should be considered as the reference value.
The errors are caused by inaccurate fabrication of the bundle and are expected to be
reduced in following experiments.

54
5. Discussion
The theoretical simulations show that for tissue with small to medium concentrations
of melanin, the RMS of the error is 5%-9%. This is less accurate than available
commercial methods but it is still remarkably good for a preliminary method. In
addition, the results show good feasibility for developing this method to the required
accuracies. This is further emphasized by the fact that these results are achieved
without any calibration and all over the saturation range.
Examining the results for different concentrations of melanin and hemoglobin shows
that the accuracy for 5% and 7.5% melanin is slightly better than for 2.5% of 10%
concentrations. The decrease in accuracy for very low melanin concentration can be
explained by the smaller absorption of the melanin compared to the baseline
absorption, resulting in an intermediate state between the different models. This
problem can be solved by using a more complex model or by choosing a model
according to skin color. This option might not be suitable if the method is meant to be
used without any calibration.
High melanin concentrations cause substantial absorption by the epidermal layer and
therefore a decrease in the energy available to absorb in deeper layer and smaller
absorption by the hemoglobin. The increase in the ratio between the melanin
absorption and the hemoglobin absorption therefore causes masking of the
hemoglobin absorption by that of the melanin and decreases the accuracy of the
algorithm.
Due to the same reason, very low hemoglobin concentration can also be masked by
the melanin and the accuracy is expected to decrease.
55
Obviously, some of the perturbations of the accuracy, seen of the table, are caused by
other inaccuracies such as inaccuracies of the tissue model, errors in the calculations
and errors of the method itself.
Experiments on phantom models show that the method can be easily implemented and
that the algorithm can be adapted to estimate relative concentrations of other
materials. The algorithm gives accurate results as long as the temperature is measured
properly and using the developed noise reduction algorithm.
The number of wavelengths used is a function of the complexity of the model, from 5
in the simple phantom models to 9 in the complex theoretical simulation models.
Further improvements of the method and the model in order to increase accuracy are
not implemented at this stage. In the future, the method will be tested in in-vitro and
in-vivo experiments and improved accordingly.
The nature of the method and the results of the fiber bundle demonstration experiment
(especially considering that this is a first experiment), make it a good candidate for
saturation imaging in internal cavities. For example, it could be used to detect early
stages of colon cancer during a simple colonoscopy. External applications are also
possible, such as detection of cancerous regions in the breast, or any other tumor close
to the surface.
Calibrating the method (for example, in in-vivo experiments) will allow measurement
of the concentrations of the materials and not only relative concentrations, such as
saturation estimation.

56
6. Summary
6.1. Conclusions
A new minimal-invasive method for oxygen saturation measurement was presented.
This method can be used to evaluate the oxygen saturation of a tissue, external or
internal. The method enables imaging of the examined tissue, thus allowing the
detection of hypoxic or anoxic regions, without requiring calibration or knowledge of
the specific structure of the tissue, only of the main absorbers in it. Reliable detection
can improve early cancer diagnosis rates and help adjust cancer treatment.
The theoretical model developed was found useful in developing the experimental
procedures and algorithms. It should be used in the future, with proper adaptations, to
evaluate the method's accuracy for detection of other materials in different tissues.
The experiments performed, combined with the theoretical results show good
accuracy of the method and considerable potential, considering the early stage of
research and the mentioned advantages.
6.2. Future Research
6.2.1. Preparation
Since the final goal of the research is to validate the method in in-vivo experiments,
future experimental plan in the lab should focus on adapting and proving the method
on tissue simulating phantom experiments and later on in-vivo experiments with
increasing complexity.
The research will include an initial study of the relevant tissues structure and
composition. The main focus will be on internal tissues, such as liver and the GI tract,
since the method's main advantage is the possibility of minimal invasive
measurements through an endoscope. In addition, skin tissue should also be studied in

57
order to allow comfortable comparison with existing commercially available non-
invasive methods.
The existing tissue thermal simulation will be modified to simulate the selected
tissues and will be used to examine the effect of possible excitation wavelengths and
material concentrations on the calculated temperature increase of the tissue. This data
will be used to select the illumination source for the excitation and the materials used
in the experiments. Patterns in the temperature dependence on various parameters will
be used to modify the algorithms and adjust them to the new tissue types.
After the selection of the parameters for the experiment, a preliminary evaluation of
the algorithm's accuracy will be performed of the theoretical temperature simulation
under these conditions.
6.2.2. Multi-layered phantoms experiments
Following the theoretical evaluation, multi-layered phantoms, simulating different
tissues and materials will be created and measured. The results of the measurements
will be used to validate the tissue thermal simulation for further future use. The
accuracy of the algorithms will be evaluated using these results and any required
adaptations will be made.
6.2.3. Improvement of experimental apparatus
The described apparatus is used to evaluate the oxygenation only in the center of the
excitation beam. Although single point measurements, like those described, are
valuable, there is great advantage to simultaneously measuring the oxygenation of an
entire tissue region. Such imaging will show abnormal areas relative to their
surroundings and will save precious measurement time.

58
Therefore, the experimental setup will be improved to include imaging abilities of a
large region of the tissue. The only adaptations required are the addition of a scanning
device or splitting of the excitation beam. This can be done using an optical or
mechanical device, which will be planned to fit into an endoscope.
6.2.4. Tissue simulating phantoms
As a final stage of the method's validation before in-vivo experiments, tissue
simulating phantoms simulating the organ's structure and compositions will be
designed, created and measured.
First, the test procedures will be tested on the organ phantoms in order to verify their
suitability to complex structures, with and without the endoscope. These tests will
allow to improve convenient procedures and to detect any problems or limitations.
The method will be then tested on the phantom, initially without anomalous regions,
in order to estimate the method's accuracy in measurement of complex spatial
structures and to further adjust the algorithms, if necessary.
The phantoms will then be measured with relevant absorbers added. For example,
cancerous tumor phantoms will be added in different depths and sizes into the models
in order to evaluate the detection probability dependence on depth, size and other
parameters. The saturation could also be simulated by the insertion of blood phantom
filled tubes. The tubes will simulate blood vessels in the tissue and the saturation will
be changed externally.
These experiments are divided into two main sub-groups: External tissue (skin)
measurements and internal measurements.

59
The measurements on skin tissue phantoms will be used to estimate the accuracy of
the method while compared to other validated existing methods. The selection of skin
as the reference tissue was made due to the existence of invasive and non-invasive
methods and the relative ease of using them.
The results of the internal measurements will be compared to the results of available
reference methods.
In order to fully understand the strengths and limitations of the method before the in-
vivo experiments, the accuracy dependence on various parameters will be measured.
For example, if there is a decrease in the accuracy during low saturation
measurements, the problem should be corrected if possible, or noted for any future
experiment. That way the entire operational range of the method will be evaluated.
The accuracy of the method will be evaluated for each application and tissue type in
order to evaluate the method and improve the algorithm, with the goal of a generic
algorithm, suitable to any tissue type and material with minimal adaptations. This
stage is important for future applications based on the detection of other materials.
The generic algorithm is planned to use minimal, if any, calibration procedures at the
in-vivo experiment, thus reducing the measurement time.
6.2.5. In-vivo experiments
The method will be used to detect tumors in mice. Tumor cells will be injected to
healthy BALB/c mice and tumor growth will be monitored by measuring tumor size.
At various stages of tumor development oxygenation changes will be monitored and
recorded untill tumors reach final stages of growth. The detection rate and accuracy
will be evaluated as a function of tumor size and depth and other relevant properties.
The tests will include measurements of the margins of the tumor and also regions that

60
are tumor free. All oxygenation measurements will also be performed on control, non
tumor induced, matched BALB/c mice. All measurements will be compared to
measurements made by standard reference methods.
The algorithm's accuracy will be evaluated and further adjustments will be made. The
system will then be prepared for further studies on animal and human models.
6.2.6. Clinical trials
Clinical trials are expected to begin by the end of 2009 in Rabin Medical Center as
collaboration with the Oral and Maxillofacial Department.
Background:
Oral cancer consistently ranks as one of the top ten cancers worldwide, with broad
differences in geographic distribution. They represent approximately 5% of cancers in
men and 2% in women. Oral SCC often develops after the age of 50, with a highest
peak in the sixth decade of life. The major risk factor for these neoplasms is chronic
exposure of oral mucosa to tobacco and alcohol. Apart from these, human papilloma
virus (HPV) infection, especially HPV 16 and 18, are found in a variable but small
proportion of oral, and up to 50% of tonsillar and oropharyngeal SCC. It has been
realized for a long time that patients with oral SCC are at risk of second tumors in the
upper aerodigestive tract, reported to occur in 10-35% of cases.
More than 90-95% of oral cancers are SCC or one of its variants. SCC typically
presents as a persistent mass, nodule, or indurate ulcer. The three most common sites
of involvement are tongue, lip and floor of the mouth. They can develop from
precancerous lesions, such as leukoplakia and erythroplakia, or apparently normal
epithelium [46-47].

61
Current diagnosis and prognosis methods:
The current procedure is performing a biopsy and sending the tissues to
histopathological tests. Histological grade correlates poorly with patient outcome and
consequently has limited value for prognostication. Tumor size and nodal status are
the most significant prognostic factors. At the time of diagnosis, the majority of
patients with SCC present advanced disease (stage III-IV), and approximately one
third of them show lymph node metastasis. After curative treatment, about 50% of the
patients suffer recurrences; 80% within 2 years and the remaining within 4 years. The
major cause of death is loco-regional failure.
Detection using photothermal spectroscopy:
The suggested research aims to estimate the method's accuracy in oral cancer
detection and evaluate the correlation between its results and the histopathological test
results. Accurate, early detection can improve prognosis and reduce complications to
the patient.
A portable setup implementing the method will be built, suitable for performing
experiments outside the laboratory. The light source in the portable device will be a
Laser Diode Mount (TCLDM9; Thorlabs) instead of the laser used in the laboratory.
Flexible optical fiber bundles will be used to transfer the illumination to the suspected
lesion and transfer the thermal image back to the camera. Similarly to the procedure
performed in the phantom experiments, the tissue will be illuminated in several
wavelengths and the temperature increase will be measured and calculated as a
function of wavelength.
The measurements will be performed on patients with oral cavity lesions, suspected as
cancerous, in the Oral and Maxillofacial Surgery Department in the Rabin Medical
Center. We suggest measuring the lesions' oxygenation, using the portable device,

62
minutes before the biopsy. The illumination will be used to achieve relatively low
temperature increase (up to a degree) in order to decrease measurement time, which is
expected to be 3-5 minutes. The oxygenation of the lesion and the surrounding
healthy tissue will be calculated. The oxygenation values will be used to estimate the
malignancy of the lesion. The estimation will be compared to the histopathology,
which is the gold standard method.
6.2.7. Fiber bundle mediation
Although the preliminary experiment with the bundle showed satisfying results,
further experiments should be performed in order to fully establish the accuracy as a
function of the fibers used and the construction of the bundle.
The diameter of the fibers used is the main factor in the method's results. Small
diameter fibers will allow extracting images with higher resolution and lower
accuracy, whereas larger diameter fiber will produce grained images with improved
accuracy. The selection of fibers should therefore be derived from the application in
question. For oral cancer detection for example, large diameter fibers should be
selected since the location of the lesion is known and only the comparison with
surroundings is required.
Planned experiments include repeating all phantom measurements with and without
bundle mediation in order to establish the effect of the bundle on the accuracy. After
establishing the described correlation between the fibers and the results, suitable fiber
bundles will be selected for each experimental phase of the research.
6.2.8. Other applications
The generic nature of the method allows it to be used in a variety of applications.
With the proper preparation it could be used to measure any material concentration in

63
the tissue, as long as its absorption spectrum is known and the tissue's optical
properties do not inhibit the detection due to higher absorption or strong scattering.
An example to such application could be NADH monitoring. Evaluating the
concentrations of NADH and NAD+ enzymes is important to the assessment of the
tissue's metabolism level, allowing detection of abnormalities associated with cancer
and other conditions.
Another example is glucose monitoring. Diabetic patients are required to frequently
monitor their blood glucose level by invasive procedures (extracting blood from the
finger). Non invasive monitoring is a widely researched topic due to the notable
advantages it offers. Making the test painless and easy will not only relieve the patient
but will also increase the number of tests performed, from several in a day up to
continuous monitoring. Elevated test frequency will allow better management of the
diabetes, reduce the chance of future complications and can be combined in a closed
loop device with insulin pumps.
Integrating the method with other spectroscopy methods can produce an improved
product suitable for additional applications. For example, the use of the CW
illumination with pulsed radiation can be used to create a method measuring the
spectra of each layer along with its depth and width.

64
7. References
1. Brizel, D.M., Tumor oxygenation predicts for the likelihood of distant metastases in human soft tissue sarcoma. Cancer Research, 1996. 56(5): p. 941-943.
2. Zhang, H.F., et al., Functional photoacoustic microscopy for high-resolution and noninvasive in vivo imaging. Nature Biotechnology, 2006. 24: p. 848-851.
3. Kondepati, V.R., H.M. Heise, and J. Backhaus, Recent applications of near-infrared spectroscopy in cancer diagnosis and therapy. Analytical and Bioanalytical Chemistry, 2008. 390(1): p. 125-139.
4. Milner, T.E., et al., Depth determination of chromophores in human skin by pulsed photothermal radiometry. Applied Optics, 1996. 35(19): p. 3379-3385.
5. Milner, T.E., et al., Depth profiling of laser-heated chromophores in biological tissues by pulsed photothermal radiometry. Journal of the Optical Society of America A, 1995. 12: p. 1479-1488.
6. Jacques, S.L., et al., Pulsed photothermal radiometry of port-wine-stain lesions. Applied Optics, 1993. 32: p. 2439-2446.
7. Smithies, D.J., et al., Accuracy of subsurface temperature distributions computed from pulsed photothermal radiometry. Physics in Medicine and Biology, 1998. 43: p. 2453-2464.
8. Jemal, A., et al., Cancer Statistics, 2008. CA: A Cancer Journal for Clinicians, 2008. 58(2): p. 71-96.
9. Gannot, I., Thermal imaging bundle-A potential tool to enhance minimally invasive medical procedures. Circuits and Devices Magazine, IEEE, 2005. 21(6): p. 28-33.
10. Gopal, V., et al., Coherent hollow-core waveguide bundles for infrared imaging. Optical Engineering, 2004. 43: p. 1195-1199.
11. Vaupel, P., F. Kallinowski, and P. Okunieff, Blood flow, oxygen and nutrient supply, and metabolic microenvironment of human tumors: a review. Cancer Research, 1989. 49(23): p. 6449-6465.
12. Hockel, M., et al. Hypoxia and radiation response in human tumors. Seminars in Radiation Oncology, 1996. 6(1): p. 3-9.
13. Hockel, M. and P. Vaupel, Tumor Hypoxia: Definitions and Current Clinical, Biologic, and Molecular Aspects. jnci, 2001. 93(4): p. 266-276.
14. Brown, J. and W. Wilson, Exploiting tumour hypoxia in cancer treatment. Nature Reviews Cancer, 2004. 4(6): p. 437-447.
15. Bongard, O. and B. Krahenbuhl, Predicting amputation in severe ischaemia. The value of transcutaneous PO2 measurement. Journal of Bone & Joint Surgery, British Volume, 1988. 70(3): p. 465-467.
16. Payette, J., et al., Assessment of Skin Flaps Using Optically Based Methods for Measuring Blood Flow and Oxygenation. Plastic and Reconstructive Surgery, 2005. 115(2): p. 539-546.

65
17. Afromowitz, M., G. Van Liew, and D. Heimbach, Clinical evaluation of burn injuries using an optical reflectance technique. IEEE Transactions on Biomedical Engineering, 1987: p. 114-127.
18. Kallinowski, F., et al., Tumor tissue oxygenation as evaluated by computerized-pO2-histography. International journal of radiation oncology, biology, physics, 1990. 19(4): p. 953-961.
19. Vaupel, P., et al., Oxygenation of human tumors: evaluation of tissue oxygen distribution in breast cancers by computerized O2 tension measurements. Cancer research, 1991. 51(12): p. 3316-3322.
20. Griffiths, J. and S. Robinson, The OxyLite: a fibre-optic oxygen sensor. British Journal of Radiology, 1999. 72(859): p. 627-630.
21. Fenton, B., et al., Cryospectrophotometric determination of tumor intravascular oxyhemoglobin saturations: dependence on vascular geometry and tumor growth. JNCI Cancer Spectrum, 1988. 80(20): p. 1612-1619.
22. Chapman, J., et al., Measuring hypoxia and predicting tumor radioresistance with nuclear medicine assays. Radiotherapy and oncology, 1998. 46(3): p. 229-237.
23. Huh, Y., et al., In vivo magnetic resonance detection of cancer by using multifunctional magnetic nanocrystals. Journal of the American Chemical Society, 2005. 127(35): p. 12387-12391.
24. Jacques, S.L. Oregon Medical Laser Center News. 1998; Available from: http://omlc.ogi.edu/news/jan98/skinoptics.html.
25. Tremper, K., Pulse oximetry. 1989, American College of Chest Physicians. 95: p. 713-715.
26. Pogue, B.W., et al., Quantitative Hemoglobin Tomography with Diffuse Near-Infrared Spectroscopy: Pilot Results in the Breast. Radiology, 2001. 218: p. 261-266.
27. Mayinger, B., et al., Evaluation of in vivo endoscopic autofluorescence spectroscopy in gastric cancer. Gastrointestinal endoscopy, 2004. 59(2): p. 191-198.
28. Maslov, K., et al., Optical-resolution photoacoustic microscopy for in vivo imaging of single capillaries. Optics Letters, 2008. 33(9): p. 929-931.
29. Xu, M. and L. Wang, Photoacoustic imaging in biomedicine. Review of Scientific Instruments, 2006. 77: p. 041101.
30. Nordal, P. and S. Kanstad, Photothermal radiometry. Physica Scripta, 1979. 20: p. 659-662.
31. Long, F., R. Anderson, and T. Deutsch, Pulsed photothermal radiometry for depth profiling of layered media. Applied Physics Letters, 1987. 51: p. 2076-2078.
32. Choi, B., B. Majaron, and J. Nelson, Computational model to evaluate port wine stain depth profiling using pulsed photothermal radiometry. Journal of Biomedical Optics, 2004. 9: p. 299-307.

66
33. Li, B., et al., Performance evaluation of pulsed photothermal profiling of port wine stain in human skin. Review of Scientific Instruments, 2004. 75: p. 2048-2055.
34. Majaron, B., et al., Spectral variation of the infrared absorption coefficient in pulsed photothermal profiling of biological samples. Physics in Medicine and Biology, 2002. 47(11): p. 1929-1946.
35. Zharov, V. and D. Lapotko, Photothermal sensing of nanoscale targets. Review of Scientific Instruments, 2003. 74: p. 785-788.
36. Lapotko, D., et al., Photothermal time-resolved imaging of living cells. Lasers in surgery and medicine, 2002. 31(1): p. 53-63.
37. Zharov, V., E. Galanzha, and V. Tuchin, Photothermal image flow cytometry in vivo. Optics Letters, 2005. 30(6): p. 628-630.
38. Schmitt, J.M., et al., Multilayer model of photon diffusion in skin. Journal of the Optical Society of America A, 1990. 7(11): p. 2141-2153.
39. Van Gemert, M.J.C., et al., Skin optics. Biomedical Engineering, IEEE Transactions on, 1989. 36(12): p. 1146-1154.
40. Meglinski, I.V. and S.J. Matcher, Quantitative assessment of skin layers absorption and skin reflectance spectra simulation in the visible and near-infrared spectral regions. Physiological Measurement, 2002. 23(4): p. 741-753.
41. Jacques, S.L. Oregon Medical Laser Center Website. 1998; Available from: http://omlc.ogi.edu/spectra/.
42. Wang, L., S.L. Jacques, and L. Zheng, MCML - Monte Carlo modeling of light transport in multi-layered tissues. Computer Methods and Programs in Biomedicine, 1995. 47(2): p. 131-146.
43. Wang, L., S.L. Jacques, and L. Zheng, CONV - convolution for responses to a finite diameter photon beam incident on multi-layered tissues. Computer Methods and Programs in Biomedicine, 1997. 54(3): p. 141-150.
44. Moritz, A.R. and F.C. Henriques Jr, Studies of Thermal Injury: II. The Relative Importance of Time and Surface Temperature in the Causation of Cutaneous Burns. The American Journal of Pathology, 1947. 23(5): p. 695-720.
45. Duck, F.A., Physical properties of tissue: a comprehensive reference book. 1990: Academic Press, London San Diego.
46. Allon, D., et al., Carcinoma cuniculatum of the jaw: A rare variant of oral carcinoma. Oral Surgery, Oral Medicine, Oral Pathology, Oral Radiology, & Endodontics, 2002. 94(5): p. 601-608.
47. Allon, D.M., et al., eds. Expression of c-kit gene product (CD-117) in oral squamous cell carcinoma: Clinicopathological correlation. in edit.

67
7. References
1. Brizel, D.M., Tumor oxygenation predicts for the likelihood of distant metastases in human soft tissue sarcoma. Cancer Research, 1996. 56(5): p. 941-943.
2. Zhang, H.F., et al., Functional photoacoustic microscopy for high-resolution and noninvasive in vivo imaging. Nature Biotechnology, 2006. 24: p. 848-851.
3. Kondepati, V.R., H.M. Heise, and J. Backhaus, Recent applications of near-infrared spectroscopy in cancer diagnosis and therapy. Analytical and Bioanalytical Chemistry, 2008. 390(1): p. 125-139.
4. Milner, T.E., et al., Depth determination of chromophores in human skin by pulsed photothermal radiometry. Appl. Opt, 1996. 35(19).
5. Milner, T.E., et al., Depth profiling of laser-heated chromophores in biological tissues by pulsed photothermal radiometry. J. Opt. Soc. Am. A, 1995. 12: p. 1479-1479.
6. Jacques, S.L., et al., Pulsed photothermal radiometry of port-wine-stain lesions. Applied Optics, 1993. 32: p. 2439-2439.
7. Smithies, D.J., et al., Accuracy of subsurface temperature distributions computed from pulsed photothermal radiometry. Phys. Med. Biol., 1998. 43: p. 2453-2464.
8. Jemal, A., et al., Cancer Statistics, 2008. CA: A Cancer Journal for Clinicians, 2008. 58(2): p. 71-96.
9. Gannot, I., Thermal imaging bundle-A potential tool to enhance minimally invasive medical procedures. Circuits and Devices Magazine, IEEE, 2005. 21(6): p. 28-33.
10. Gopal, V., et al., Coherent hollow-core waveguide bundles for infrared imaging. Optical Engineering, 2004. 43: p. 1195-1199.
11. Vaupel, P., F. Kallinowski, and P. Okunieff, Blood flow, oxygen and nutrient supply, and metabolic microenvironment of human tumors: a review. Cancer Research, 1989. 49(23): p. 6449-6465.
12. Hockel, M., et al. Hypoxia and radiation response in human tumors. 1996: Elsevier.
13. Hockel, M. and P. Vaupel, Tumor Hypoxia: Definitions and Current Clinical, Biologic, and Molecular Aspects. jnci, 2001. 93(4): p. 266-276.
14. Brown, J. and W. Wilson, Exploiting tumour hypoxia in cancer treatment. Nature Reviews Cancer, 2004. 4(6): p. 437-447.
15. Bongard, O. and B. Krahenbuhl, Predicting amputation in severe ischaemia. The value of transcutaneous PO2 measurement. Journal of Bone & Joint Surgery, British Volume, 1988. 70(3): p. 465-467.
16. Payette, J., et al., Assessment of Skin Flaps Using Optically Based Methods for Measuring Blood Flow and Oxygenation. Plastic and Reconstructive Surgery, 2005. 115(2): p. 539.
68
17. Afromowitz, M., G. Van Liew, and D. Heimbach, Clinical evaluation of burn injuries using an optical reflectance technique. IEEE Transactions on Biomedical Engineering, 1987: p. 114-127.
18. Kallinowski, F., et al., Tumor tissue oxygenation as evaluated by computerized-pO2-histography. International journal of radiation oncology, biology, physics, 1990. 19(4): p. 953.
19. Vaupel, P., et al., Oxygenation of human tumors: evaluation of tissue oxygen distribution in breast cancers by computerized O2 tension measurements. Cancer research, 1991. 51(12): p. 3316-3322.
20. Griffiths, J. and S. Robinson, The OxyLite: a fibre-optic oxygen sensor. British Journal of Radiology, 1999. 72(859): p. 627.
21. Fenton, B., et al., Cryospectrophotometric determination of tumor intravascular oxyhemoglobin saturations: dependence on vascular geometry and tumor growth. JNCI Cancer Spectrum, 1988. 80(20): p. 1612.
22. Chapman, J., et al., Measuring hypoxia and predicting tumor radioresistance with nuclear medicine assays. Radiotherapy and oncology, 1998. 46(3): p. 229-237.
23. Huh, Y., et al., In vivo magnetic resonance detection of cancer by using multifunctional magnetic nanocrystals. Journal of the American Chemical Society, 2005. 127(35): p. 12387-12391.
24. Jacques, S.L. Oregon Medical Laser Center News. 1998; Available from: http://omlc.ogi.edu/news/jan98/skinoptics.html.
25. Tremper, K., Pulse oximetry. 1989, Am Coll Chest Phys. p. 713-715.
26. Pogue, B.W., et al., Quantitative Hemoglobin Tomography with Diffuse Near-Infrared Spectroscopy: Pilot Results in the Breast. Radiology, 2001. 218: p. 261-266.
27. Mayinger, B., et al., Evaluation of in vivo endoscopic autofluorescence spectroscopy in gastric cancer. Gastrointestinal endoscopy, 2004. 59(2): p. 191-198.
28. Maslov, K., et al., Optical-resolution photoacoustic microscopy for in vivo imaging of single capillaries. Optics Letters, 2008. 33(9): p. 929-931.
29. Xu, M. and L. Wang, Photoacoustic imaging in biomedicine. Review of Scientific Instruments, 2006. 77: p. 041101.
30. Nordal, P. and S. Kanstad, Photothermal radiometry. Physica Scripta, 1979. 20: p. 659-662.
31. Long, F., R. Anderson, and T. Deutsch, Pulsed photothermal radiometry for depth profiling of layered media. Applied Physics Letters, 1987. 51: p. 2076.
32. Choi, B., B. Majaron, and J. Nelson, Computational model to evaluate port wine stain depth profiling using pulsed photothermal radiometry. Journal of Biomedical Optics, 2004. 9: p. 299.
33. Li, B., et al., Performance evaluation of pulsed photothermal profiling of port wine stain in human skin. Review of Scientific Instruments, 2004. 75: p. 2048.
69
34. Majaron, B., et al., Spectral variation of the infrared absorption coefficient in pulsed photothermal profiling of biological samples. Physics in Medicine and Biology, 2002. 47(11): p. 1929-1946.
35. Zharov, V. and D. Lapotko, Photothermal sensing of nanoscale targets. Review of Scientific Instruments, 2003. 74: p. 785.
36. Lapotko, D., et al., Photothermal time-resolved imaging of living cells. Lasers in surgery and medicine, 2002. 31(1).
37. Zharov, V., E. Galanzha, and V. Tuchin, Photothermal image flow cytometry in vivo. Optics Letters, 2005. 30(6): p. 628-630.
38. Schmitt, J.M., et al., Multilayer model of photon diffusion in skin. J. Opt. Soc. Am. A, 1990. 7(11): p. 2141-2153.
39. Van Gemert, M.J.C., et al., Skin optics. Biomedical Engineering, IEEE Transactions on, 1989. 36(12): p. 1146-1154.
40. Meglinski, I.V. and S.J. Matcher, Quantitative assessment of skin layers absorption and skin reflectance spectra simulation in the visible and near-infrared spectral regions. Physiological Measurement, 2002. 23(4): p. 741-753.
41. Jacques, S.L. Oregon Medical Laser Center Website. 1998; Available from: http://omlc.ogi.edu/spectra/.
42. Wang, L., S.L. Jacques, and L. Zheng, MCML - Monte Carlo modeling of light transport in multi-layered tissues. Computer Methods and Programs in Biomedicine, 1995. 47(2): p. 131-146.
43. Wang, L., S.L. Jacques, and L. Zheng, CONV - convolution for responses to a finite diameter photon beam incident on multi-layered tissues. Computer Methods and Programs in Biomedicine, 1997. 54(3): p. 141-150.
44. Moritz, A.R. and F.C. Henriques Jr, Studies of Thermal Injury: II. The Relative Importance of Time and Surface Temperature in the Causation of Cutaneous Burns. The American Journal of Pathology, 1947. 23(5): p. 695.
45. Duck, F.A., Physical properties of tissue: a comprehensive reference book. 1990: Academic Press, London San Diego.
46. Allon, D., et al., Carcinoma cuniculatum of the jaw: A rare variant of oral carcinoma. Oral Surgery, Oral Medicine, Oral Pathology, Oral Radiology, & Endodontics, 2002. 94(5): p. 601.
47. Allon, D.M., et al., eds. Expression of c-kit gene product (CD-117) in oral squamous cell carcinoma: Clinicopathological correlation. in edit.

70
תקציר
, מטרת מחקר זה היא פיתוח שיטת הדמיה בלתי פולשנית למדידת רמת החמצון של רקמות
.חיצוניות ופנימיות
. בתחום הנראה והאינפרא אדום הקרוב, אורכי גל בשיטה זו מועברת קרינה לרקמה במספר
מכיוון שמידת ההתחממות תלויה . הקרינה בכל אורך גל נבלעת ברקמה וגורמת להתחממותה
ניתן להסיק ממדידת שינויי הטמפרטורה במספר אורכי גל את , בהרכב החומרים של הרקמה
ה מבוצעת באמצעות הדמיית שינויי הטמפרטור. ובפרט את רמת החמצון שלה הרכב הרקמה
מצלמה תרמית דרך אלומת סיבים אופטיים קוהרנטית והערכת רמת החמצון מבוצעת באמצעות
כמו עור , מערכת זו מתאימה למדידת החמצון ברקמות חיצוניות. אלגוריתמים מתאימים
עבודה זו עוסקת ביישום השיטה , כשלב ראשון. באמצעות שימוש באנדוסקופ, וברקמות פנימיות
.קמת עור חשופהעל ר
פותח על מנת לסייע , מודל תיאורטי של התחממות הרקמה כתלות במאפייניה ובהארה עליה
אלגוריתם התאמת עקומות ממוחשב מתאים . בפיתוח האלגוריתמים ובפיתוח הליכי הניסויים
, את שינויי הטמפרטורה שנמדדו לערך החמצון המתאים וזאת כמעט ללא ידע מוקדם על הרקמה
המייצגות רקמות בעלות מאפיינים , האלגוריתם נבחן על מספר רב של סימולציות. יולוללא כ
.טובונמצא כי הערכת רמת החמצון הינה בעלת דיוק , שונים
בעלתהדגמים ייצגו רקמה .אגר דגמי על נבדקו והאלגוריתמים השיטה, התיאורטי השלב לאחר
ברקמה ההמוגלובין את לייצג שנועדו משתנים בריכוזים חומרים והכילו שכבות ושתי אחת שכבה
גם בשלב זה התקבלו תוצאות משביעות רצון ופותחו הליכי מדידה שישמשו בניסויים . ביולוגית
.מורכבים יותר בעתיד

71
אביב -אוניברסיטת תל
ש איבי ואלדר פליישמן"הפקולטה להנדסה ע
סליינר- ש זנדמן"בית הספר לתארים מתקדמים ע
ככלי לא סקופיה פוטותרמיתספקטרו
פולשני לגילוי מוקדם של גידול סרטני
רפואית-ביובהנדסה " המוסמך אוניברסיט" חיבור זה הוגש כעבודת גמר לקראת התואר
ידי -על
מיכל טפר
רפואית-להנדסה ביוהעבודה נעשתה במחלקה
גנות ישראל' פרופ הנחיתב
ע"תשתשרי

72
ביבא -אוניברסיטת תל
ש איבי ואלדר פליישמן"הפקולטה להנדסה ע
סליינר- ש זנדמן"בית הספר לתארים מתקדמים ע
ספקטרוסקופיה פוטותרמית ככלי לא
פולשני לגילוי מוקדם של גידול סרטני
רפואית-ביובהנדסה " מוסמך אוניברסיטה"חיבור זה הוגש כעבודת גמר לקראת התואר
ידי -על
מיכל טפר
ע"שתתשרי