michener jk and smolke cd - epoch life science · michener jk and smolke cd ... supernatants were...
TRANSCRIPT

Michener JK and Smolke CD SUPPLEMENTARY INFORMATION Supplementary Figure 1 Decreasing the cell-to-cell variation also decreases the
culture-to-culture variation Supplementary Figure 2 One color fluorescence response histograms Supplementary Figure 3 Screening single cells by FACS is less sensitive than
screening clonal cultures by flow cytometry Supplementary Figure 4 Changing the plasmid copy number does not significantly
affect theophylline accumulation Supplementary Figure 5 Representative HPLC data Supplementary Figure 6 Raw T50 curves Supplementary Figure 7 Plasmid maps Supplementary Table 1 Primers used in this study Supplementary Table 2 Plasmids and strains constructed in this study Supplementary Table 3 Mutations in the BM3 enzyme variants generated in this
study Supplementary Table 4 Summary of functional characterization data for enzyme
variants

0.0
0.1
0.2
0.3
0.4
0.9 1.0 1.1 1.2 1.3Relative Fluorescence
Freq
uenc
y0.00
0.05
0.10
0.15
0.20
0.25
0.9 1.0 1.1 1.2 1.3Relative Fluorescence
Freq
uenc
y
0.00
0.05
0.10
0.15
0.20
0.25
0.9 1.0 1.1 1.2 1.3Relative Fluorescence
Freq
uenc
y
A B C
Supplementary Figure 1 Decreasing the cell-to-cell variation also decreases the culture-to-culture variation. When screening by flow cytometry, screening efficiency is determined by the coefficient of variation (CV) between replicate cultures. Expression noise within a single population affects the precision with which the mean can be determined and therefore the CV. For each of the screening constructs shown in Figure 2 (A: plasmid-GAL, B: plasmid-TEF, C: integrated-TEF), replicate cultures (n=32) were grown in the presence of varying amounts of theophylline and the geometric mean fluorescence of each culture was determined by flow cytometry. The relative fluorescence is the ratio of the geometric mean fluorescence for a single culture relative to the average geometric mean for all 32 uninduced cultures. The histograms show raw geometric means and the curves are fit to a normal distribution. The average CV of the three populations decreases from 5.0% (A) to 3.8% (B) and finally to 2.7% (C).
●0.0 mM Theophylline ●0.13 mM Theophylline ●0.27 mM Theophylline

100 101 102
% o
f Max
100
80
60
40
20
0
GFP/EV100 101 102
% o
f Max
100
80
60
40
20
0
GFP/EV100 101 102
% o
f Max
100
80
60
40
20
0
GFP/EV
● 5 mM theophylline● 1 mM theophylline● 1 mM caffeine● Water
● Inactive enzyme, Water● Inactive enzyme, 1 mM caffeine● yCDM1, Water● yCDM1, 1 mM caffeine
● yCDM6, Water● yCDM6, 1 mM caffeine● yCDM1, Water● yCDM1, 1 mM caffeine
A B C
Supplementary Figure 2 One color fluorescence response histograms. (A) Fluorescence histogram of CSY492 grown in the presence of theophylline, caffeine, or water. The screening strain has a graded response to theophylline and no response to caffeine. (B) Fluorescence histograms of CSY492 containing active (green) and inactive (blue) versions of yCDM1. The fluorescence increases when caffeine is added to cells containing the active enzyme but is unchanged when caffeine is added to cells with the inactive enzyme. (C) Fluorescence histograms of CSY492 containing yCDM1 (green) and yCDM6 (blue). The more active enzyme produces a larger increase in fluorescence upon addition of caffeine.

0.1
1
10
100
1000
0.8 1.0 1.2 1.4 1.6 1.8Relative Fluorescence
Pred
icte
d Fo
ld E
nric
hmen
t
R2 = 0.98A B C
0.0
0.1
0.2
0.3
0.4
0.5
0.9 1.0 1.1 1.2 1.3 1.4 1.5 1.6 1.7 1.8 1.9 2.0Relative Fluoresence
Freq
uenc
y
0.0 mM Theophylline0.2 mM Theophylline0.4 mM Theophylline0.6 mM Theophylline0.8 mM Theophylline1.0 mM Theophylline
0.00.10.20.30.40.50.60.70.80.9
0 20 40 60 80 100 120 140 160Theophylline Accumulation (uM)
Fluo
resc
ence
Cha
nge
High CopyLow Copy
yCDM1
yCDM3
yCDM5
yCDM6
yCDM6
yCDM7
yCDM8
Supplementary Figure 3 Screening single cells by FACS is less sensitive than screening clonal cultures by flow cytometry. (A) When screening clonal cultures by flow cytometry, screening efficiency is determined by the coefficient of variation (CV) between replicate cultures. Replicate cultures of cells (n=10) containing the theophylline biosensor were grown in variable amounts of theophylline and analyzed by flow cytometry. The relative fluorescence is calculated as the ratio of the geometric mean fluorescence of a single culture to the average of the geometric mean fluorescence of all ten uninduced cultures. The histograms show raw geometric means, and the curves are fit to a normal distribution. The sensor has a CV of ~2.1%, allowing accurate discrimination of cultures with mean fluorescence differences of <10%. (B) When screening single cells by FACS, the efficiency is determined by the intrinsic noise within a population distribution relative to the difference in population means. Using our optimized sensor, the variation within a population is relatively constant, so the efficiency is strongly dependent on the ratio of fluorescence between the populations being separated. A switch with a larger dynamic range would improve the sorting efficiency, while additional intrinsic noise would reduce the efficiency. Cells containing the two-color screening system were grown in variable amounts of theophylline and analyzed by two-color flow cytometry. A representative sorting gate captured a small fraction of the uninduced cells (<0.1%) and increasing amounts of the more highly fluorescent populations. The ratio of these two percentages gives the predicted enrichment. The relative fluorescence is the ratio of the geometric mean fluorescence of the sample population to the geometric mean fluorescence of the uninduced control. The curve shown is an exponential fit to the experimental data. Screening single cells by FACS is highly effective when the changes in mean fluorescence are large, but this method cannot efficiently discriminate between small changes in mean fluores-cence. (C) Improved enzymes produce more theophylline, which gives a larger fold activation of the RNA switch and, therefore, a better screening efficiency. Theophylline accumulation and switch activation are plotted for each of the enzymes described in this work. The fluorescence change is the increase in fluorescence of cells containing a given enzyme and grown with 1 mM caffeine relative to the same cells grown in the absence of caffeine ([Fcaf-Fwater]/Fwater). The lines are a guide to the eye.

A B
C
● yCDM6 (High copy)● yCDM6 (Low copy)
mAU
70
60
50
40
30
20
10
0
0.65 0.70 0.75 0.80 0.85 min
Time (hr)0.0
0.4
0.8
1.2
1.6
0 2 4 6 8 10
OD
600 y=0.059e0.302x
R2=0.998
y=0.063e0.383x
R2=0.997
y=0.061e0.406x
R2=0.998D
yCDM5High
yCDM6High
yCDM6Low
yCDM7Low
(-)Control
α-V5α-actin
RelativeExpression
0.9x 1.0x 0.9x 1.0x 0.0x
100 101 102
100
80
60
40
20
0
GFP/EV● yCDM6 (Low Copy), Water● yCDM6 (Low Copy), 1 mM caffeine● yCDM6 (High Copy), Water● yCDM6 (High Copy), 1 mM caffeine
% o
f Max
Supplementary Figure 4 Changing the plasmid copy number does not significantly affect enzymatic activity. (A) A Western blot demonstrates that total enzyme expression does not change as the DNA copy number is decreased. The enzyme contains a C-terminal V5 epitope, and the anti-actin antibody is used as a loading control. The relative expression values are calculated as the ratio of anti-V5 intensity/anti-actin intensity, normalized to yCDM6-High. The blot shown is representative of three independent experiments. (B) Total theophylline production differs by less than 10% between yCDM6-High (green) and yCDM6-Low (blue). Theophylline elutes at 0.70 minutes. (C) Fluorescence response histograms for yCDM6-High (green) and yCDM6-Low (blue). For each cell, the GFP fluorescence is normalized by the electronic volume (EV). Despite the similar levels of theophylline production, the low copy expression system shows a smaller change in fluorescence, presumably indicating lower theophylline per cell. (D) Growth curves for cells containing empty plasmid (black), yCDM6-High (green), yCDM6-Low (blue), or an inactive mutant (Neeli et al., 2005) of yCDM1 (brown). The curves are an exponential fit to the data. High-copy enzyme expression causes a significant decrease in growth rate. Lowering the plasmid copy number relieves ~80% of the growth inhibition. While the cells with the low expression system may produce less theophylline per cell, they grow faster and therefore have more time to make theophylline, resulting in similar total production.
y=0.053e0.300x
R2=0.998
No Enzyme
yCDM6 (High Copy)yCDM6 (Low Copy)
Inactive (High Copy)

mAU
100
80
60
40
20
0
0.60 0.65 0.70 0.75 0.80 0.85 0.90 min
● yCDM1● yCDM3● yCDM5● yCDM6● yCDM7● yCDM8
Theophylline
Paraxanthine
Supplementary Figure 5 Representative HPLC data. Cells containing each enzyme were grown in the presence of 1 mM caffeine. Culture supernatants were analyzed after 24 hours using HPLC analysis. Theophylline elutes at 0.70 minutes and paraxanthine elutes at 0.63 minutes.

0.0
0.2
0.4
0.6
0.8
1.0
1.2
25 30 35 40 45 50 55 60Temperature (oC)
Res
idua
l Act
ivity
yCDM1yCDM3yCDM5yCDM6yCDM7yCDM8
Supplementary Figure 6 Raw T50 curves. Crude E. coli lysate containing each enzyme was incubated for 10 minutes at the indicated temperature and then cooled on ice. 140 µL of enzyme was mixed with 20 µL of 20 mM NADPH and 40 µL of 25 mM caffeine. The residual theophylline production was measured by HPLC and normalized by the activity of lysate incubated at 4 oC. The data were fit to an Arrhenius inactivation curve, and the T50 was calculated as the temperature at which the fit showed 50% residual activity. The error bars show ± one standard deviation, calculated from three technical replicates. Note that these measurements for yCDM5 were an outlier, and replicate measurements did not show a statistically significant difference in T50 between yCDM3 through yCDM8.

pCS21678740 bp
AmpRURA3
yCDM6
ARSH4CEN6
TEFpMB1
ADH1T
EcoRI (2420)
AleI (4558)
Avr II (5696)
Msc I (2718)
Msc I (3434)
pCS21559231 bp
AmpR
URA3yCDM1
TEF2mu
pMB1CYC1 Terminator
EcoRI (445)
AleI (2583)
Msc I (743)
Msc I (1459)
pCS22248404 bp
URA3
EGFP
AmpR
mCherry
YIp-Out
YIp-InL2B8
TEF
TEF
pMB1
ADH1T
CYC1T
NruI (8127)
pCS22236432 bp
URA3
EGFP
AmpRYIp-Out
YIp-InL2B8
TEF
pMB1
ADH1TNruI (6155)
A B
E
DC
pCS21728188 bp
AmpR
LacI
yCDM1
Ptac
f1 ori
pMB1EcoRI (3239)
BamHI (8164)
gcuguca
cc
gg
a
ugug
cu
u uc
cg
gu
cug
au
g a gu
cc
gu
u
gu
cc
au
a cc
ag
ca
ucg
uc u u
ga
ug
c cc
uug
g
ca
ggg
acg
gga
cg
ga
gga
cg
aaa
cagc5’ 3’
10
20
30
40
50
60
70
80
90
F
Supplementary Figure 7 Plasmid maps. (A) pCS2223, the single color integration vector used to construct CSY492. (B) pCS2224, the dual color integration vector used to construct CSY820. (C) pCS2172, the E. coli expression vector with yCDM1, used for T50 measurements. (D) pCS2155, the high copy yeast expression vector with yCDM1. (E) pCS2167, the low copy yeast expression vector with yCDM6. (F) The sequence and predicted structure of L2B8 (adapted from Win and Smolke, 2007).

Supplementary Table 1: Primers used in this study
Primer Name Primer Sequence
BM3-FromWori-FWD 5’-TATAGAATTCGATATCAAGCTTGGAGATCTAAAAGAA
AACAATGACAATTAAAGAAATGCCTCAG-3’
BM3-FromWori-REV 5’-CTATGCGGCCGCTCACCCAGCCCACACGTCTTTTG-3’
TEF-FWD 5’-ACTTCTTGCTCATTAGAAAGAAAGC-3’
yCDM-CEN-REV 5’-TATACCTAGGCTTCAATGGTGGTGGTGATGG-3’
yCDM-ToWori-FWD 5’-AATTGGATCCATCGATGCTTAGGAGGTCATATGTCTA
TCAAAGAAATGCCAC-3’
yCDM-ToWori-REV 5’-TAATGAATTCTCAATGGTGGTGGTGATGGTG-3’
yMutF 5’-TCTTGCTCATTAGAAAGAAAGCATAGCAATCTAATC
TAAGTTTTAATTAC-3’
yMutR 5’-AATCTAGCAGTAACTCTGTTGACGATACCTTCGTAGT
TTCTTGGAATAAC-3’
30R 5’-CTTAAAGATTTCACCCAATTCGTCAGCAATTTTCATC-3’
30F 5’-GATGAAAATTGCTGACGAATTGGGTGAAATCTTTAAG-3’
60R 5’-CAAGTTCTTGTCGAATCTAGATTCATCACAAGCTTCC-3’
60F 5’-GGAAGCTTGTGATGAATCTAGATTCGACAAGAACTTG-3’
61R 5’-CAAGTTCTTGTCGAATCTAGATTCATCACAAGC-3’
61F 5’-GCTTGTGATGAATCTAGATTCGACAAGAACTTG-3’
85R 5’-CAGTTCTTTTCGTGGGTCCAGGAAGTGGCCAAACCG-3’
85F 5’-CGGTTTGGCCACTTCCTGGACCCACGAAAAGAACTG-3’
216R 5’-GGAGGCCTTTCTGTCAGCGATGATCTTGTCAAC-3’
216F 5’-GTTGACAAGATCATCGCTGACAGAAAGGCCTCC-3’
329R 5’-GTGTCTTCCTTAGCGTACAAAGAGAACCATGG-3’
329F 5’-CCATGGTTCTCTTTGTACGCTAAGGAAGACAC-3’
341R 5’-CACCCTTTTCCAATGGGTATTCACCACCCAAG-3’
341F 5’-CTTGGGTGGTGAATACCCATTGGAAAAGGGTG-3’
396R 5’-GCGAATTGTTGACCGATACAGGCTCTTTGACCG-3’
396F 5’-CGGTCAAAGAGCCTGTATCGGTCAACAATTCGC-3’

481R 5’-CCATGTTAGAACCGTACAAAACCAACAATG-3’
481F 5’-CATTGTTGGTTTTGTACGGTTCTAACATGG-3’
535R 5’-GCGTTATCTGCTGGATGACCGTTGTAGG-3’
535F 5’-CCTACAACGGTCATCCAGCAGATAACGC-3’
570R 5’-CCCAGTTTTTATCACCA-3’
570F 5’-TGGTGATAAAAACTGGG-3’
586R 5’-CACCCTTAGCAGCCAAAGTTTCGTC-3’
586F 5’-GACGAAACTTTGGCTGCTAAGGGTG-3’
663R 5’-CAATTCCTTGGAGGCAACGACGTTGGTAGAG-3’
663F 5’-CTCTACCAACGTCGTTGCCTCCAAGGAATTG-3’
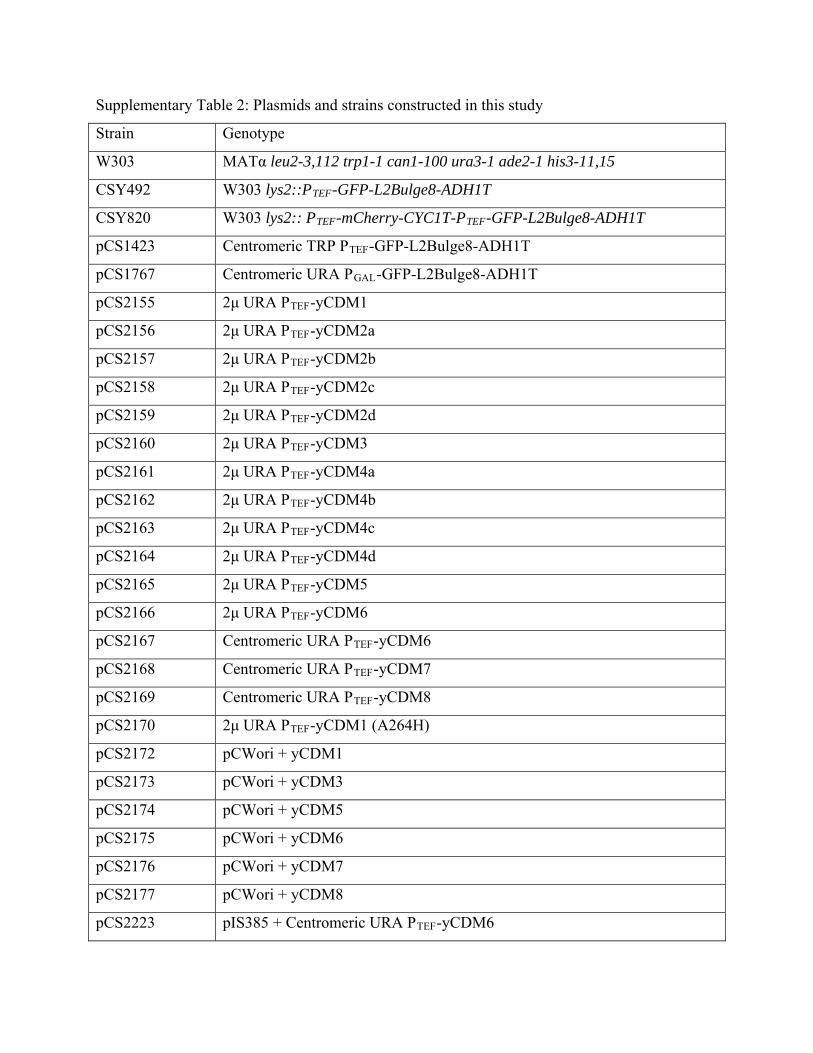
Supplementary Table 2: Plasmids and strains constructed in this study
Strain Genotype
W303 MATα leu2-3,112 trp1-1 can1-100 ura3-1 ade2-1 his3-11,15
CSY492 W303 lys2::PTEF-GFP-L2Bulge8-ADH1T
CSY820 W303 lys2:: PTEF-mCherry-CYC1T-PTEF-GFP-L2Bulge8-ADH1T
pCS1423 Centromeric TRP PTEF-GFP-L2Bulge8-ADH1T
pCS1767 Centromeric URA PGAL-GFP-L2Bulge8-ADH1T
pCS2155 2μ URA PTEF-yCDM1
pCS2156 2μ URA PTEF-yCDM2a
pCS2157 2μ URA PTEF-yCDM2b
pCS2158 2μ URA PTEF-yCDM2c
pCS2159 2μ URA PTEF-yCDM2d
pCS2160 2μ URA PTEF-yCDM3
pCS2161 2μ URA PTEF-yCDM4a
pCS2162 2μ URA PTEF-yCDM4b
pCS2163 2μ URA PTEF-yCDM4c
pCS2164 2μ URA PTEF-yCDM4d
pCS2165 2μ URA PTEF-yCDM5
pCS2166 2μ URA PTEF-yCDM6
pCS2167 Centromeric URA PTEF-yCDM6
pCS2168 Centromeric URA PTEF-yCDM7
pCS2169 Centromeric URA PTEF-yCDM8
pCS2170 2μ URA PTEF-yCDM1 (A264H)
pCS2172 pCWori + yCDM1
pCS2173 pCWori + yCDM3
pCS2174 pCWori + yCDM5
pCS2175 pCWori + yCDM6
pCS2176 pCWori + yCDM7
pCS2177 pCWori + yCDM8
pCS2223 pIS385 + Centromeric URA PTEF-yCDM6

pCS2224 pIS385 + PTEF-mCherry-CYC1T-PTEF-GFP-L2Bulge8-ADH1T
CSY821 CSY492+pCS2155
CSY822 CSY492+pCS2160
CSY823 CSY492+pCS2165
CSY824 CSY492+pCS2166
CSY825 CSY492+pCS2167
CSY826 CSY492+pCS2168
CSY827 CSY492+pCS2169
CSY828 CSY492+pCS2170
CSY829 CSY492+pCS2171
CSY830 CSY492+pCS4 (empty centromeric plasmid)
CSY831 CSY492+pCS31 (empty 2μ plasmid)
CSY845 W303+pCS1767
CSY846 W303+pCS1423

Supplementary Table 3: Mutations in the BM3 enzyme variants generated in this study
Enzyme Mutations
yCDM1 A74W, V78I, A82L, F87A, M185V, L188W, A328F, A330W
yCDM2a yCDM1 + I58T, P461L, A575V
yCDM2b yCDM1 + N522S, C569Y
yCDM2c yCDM1 + T22R, D194N, Q387R, A603T
yCDM2d yCDM1 + S72F, P301L, G457D
yCDM3 yCDM1 + S72F, A603T
yCDM4a yCDM3 + M354L, T576R, Q673K
yCDM4b yCDM3 + F72I, T339I
yCDM4c yCDM3 + R47S
yCDM4d yCDM3 + Q27H, G660D
yCDM5 yCDM3 + Q27H, R47S, F72I
yCDM6 yCDM5 + E435G
yCDM7 yCDM6 + I174V
yCDM8 yCDM7+A87S

Supplementary Table 4: Summary of functional characterization data for enzyme variants
Enzyme Relative
vmax, app/KM,
app
KM, app (mM) T50 (°C) Selectivity
yCDM1 1.0 1.5 ±0.1 47.0 ± 0.6 10.3 ± 0.5
yCDM3 3.9 ±0.4 1.1 ±0.1 42.9 ± 0.9 14 ± 1
yCDM5 12.2 ±1.0 0.75 ±0.10 41.5 ± 1.3 23 ± 3
yCDM6 22.1 ±1.6 0.59 ±0.01 42.8 ± 1.0 100 ±25
yCDM7 26.6 ±3.1 0.74 ±0.02 42.1 ± 1.3 175 ± 4
yCDM8 33.0 ±4.2 0.69 ±0.04 43.1 ± 0.7 230 ±20