michigan aquaculture and commercial fisheries issues
TRANSCRIPT

MICHIGAN AQUACULTURE AND COMMERCIAL
FISHERIES ISSUES
Ron KinnunenMichigan Sea Grant College Program

Michigan capable of $1 billion
from aquaculture
• Flow-through
• RAS
• Net-pens

US Trends
US Seafood Consumption
Largest ever recorded
US Seafood Trade

• Catfish production dropped from 608 million lbs in 2005 to 301 million lbs 2014 due to global competition
• Regulations restricting expansion
• Indoor recirculating aquaculture system (RAS) failures and high risk
What is Causing US to Fall Behind in Aquaculture?


0 1 2 3 4
0 20 40 60
1998
2005
2013
Value ($ million)
# Farms
Farms
Value
15 year track recordSource: USDA Aquaculture Census
Michigan Aquaculture

Somewhere in Ontario waters of Lake Huron

20,200 ft

North Wind Fisheries
Manitoulin Island,
Ontario

Meijer’s - Petoskey, MI 2017
Meijer - Lansing, MI 2014

Approximate
Scale

• 2 proposals for commercial net-pen aquaculture operations submitted to State of Michigan Quality of Life Group (QOL – all state agencies)
• At least one offered $2 million for research, monitoring, and an adaptive management framework
December 2014

“We’re not against
aquaculture, just
this particular kind
of aquaculture…
We already know
how to do
aquaculture in
Michigan”
“Recirculating
aquaculture… is already
being implemented in
Michigan, raise mass
amounts of fish… a
practice.. well suited to
vacant warehouses ”
Summer 2015

Fisheries and Oceans Canada 2015 Study
• Freshwater Cage Aquaculture: Ecosystems Impacts from Dissolved and Particulate Waste Phosphorus
• Operations are contributing about 5 % of the annual total phosphorus loads to the North Channel
• Phosphorus additions to the environment from net pen aquaculture operations under the current level of fish production can generally be characterized as “low.”

Fisheries and Oceans Canada 2015 Study
• Offshore phosphorus loading is of less concern and higher phosphorus loads may be considered advisable as a means to help mitigate concerns regarding low levels of forage fish and the poor condition of sport and commercial fish species.
September 2015
SB 526 introduced (with committee hearings)
• Would have prohibited all aquaculture operations whose discharges
are hydraulically connected to the Great Lakes
Introduced Legislation
“Concentrated fish poo is just not Pure
Michigan,”
“A typical 200,000 fish operation creates as
much waste as a city of 65,000 people, which
would make the Great Lakes a giant toilet
bowl.”

Fish Waste
Humans Fish Human: Fish
Number 65,000 200,000
Fecal (kg/yr) 3,036,800 144,000 21.1
Phosphorus (kg/yr) 11,863 2,400 4.9
E coli (Kg/yr) 24 0 na

Lake Huron charter boat harvests 1990-2015
0
2,000
4,000
6,000
8,000
10,000
12,000
14,000
16,000
19
90
19
92
19
94
19
96
19
98
20
00
20
02
20
04
20
06
20
08
20
10
20
12
20
14
Nu
mb
er H
arve
sted
Chinook
Coho
Lake Trout
Steelhead

• Phosphorus shunt cycle
Can. J. Fish. Aquat. Sci. 61: 1285–1293 (2004)

The HACCP Approach to Prevent the Spread of Aquatic Invasive Species by Aquaculture and Baitfish Operations

AIS-HACCP
Training Materials
Supporting
training video
(22 min)
CD with
resources
Curriculum

• Viral Hemorrhagic Septicemia – Rhabdovirus
• Four known isolates
– 3 European
– 1 North American
• Causes large scale hemorrhaging in internal
organs and osmotic regulation failure
• Large scale mortalities seen
– In rainbow trout and turbot in Europe
– In Pacific herring in Puget Sound, WA
• Not a human pathogen
VHSV

Biosecurity Plans
• No “one-size-fits-all” solution– Varies with type of operation,
species, life stage reared
• Range– Simple and quickly
implemented• Foot dips; disinfection; signs
– Other economic investmentor effort• Dedicated quarantine equipment
or facilities
• Cost-Benefit

Ecological Changes Related to Aquatic Invasive Species

Affects on Commercial Fishing Gear

Affects on Commercial Fishing Gear
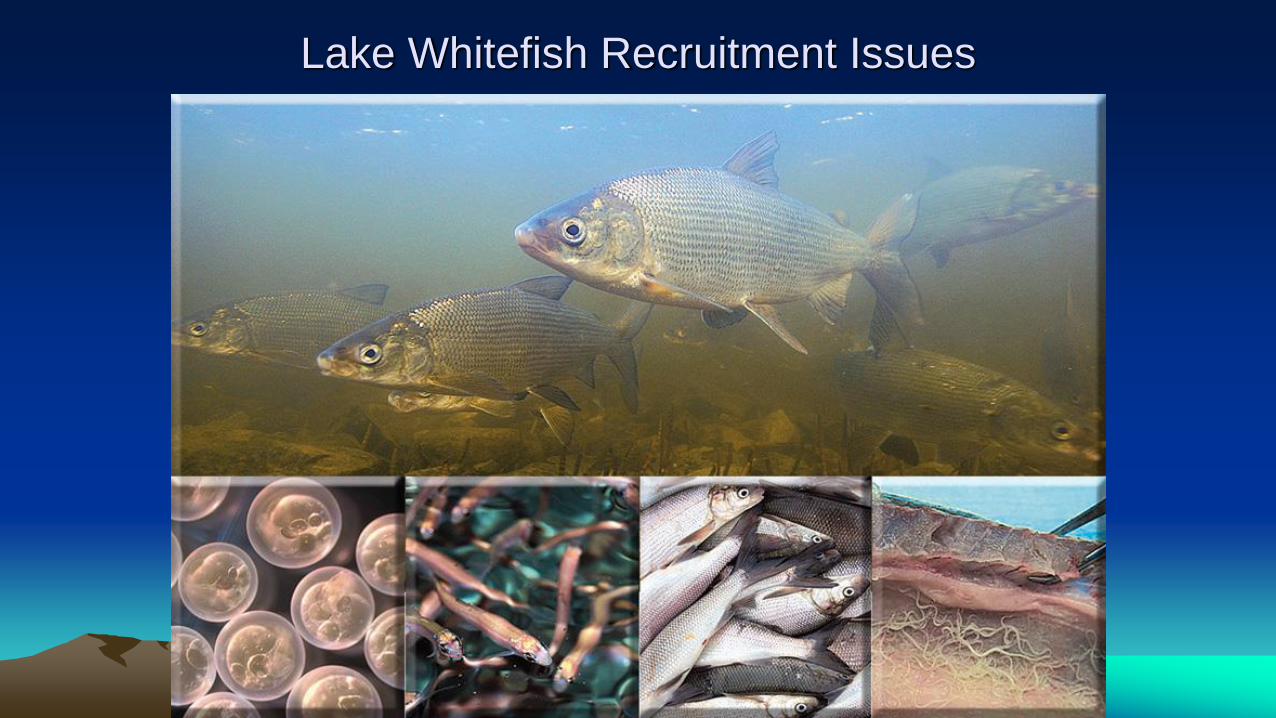
Lake Whitefish Recruitment Issues

Great Lakes Whitefish
• Important fishery
• Reduced growth and condition
• Declines in Diporeia
• Energy-rich prey source
• High in HUFA levels
• Transfer of essential FA
• Switch to Dreissena
• Low in essential FA
• Population health

Lake Whitefish Management Overview
1836 Treaty Waters
Shared units Non-shared units
Lenart 2018

Population Models and the
Management Process
• Fishery monitoring
– Age and size composition
– Effort and Yield
• Data Time Series
– Begins in mid 1980s
– LWF data thru year 2016
used to establish 2018
harvest limits
Historical data
Data from most recent
year
Current Population Status
Population Projected
Forward
Apply
Rules
MSC Harvest
Recommendation
Lenart 2018

Model Outputs
• Unit-specific estimates
– Abundance
• By age and year
– Biomass*
• Spawning and total by
year
– Mortality*
• By age and year
*Management targets
Lenart 2018

Lenart 2018

Lenart 2018

• Not including the
“mortality” trend, only 3
of the 33 individual
scores for lakes MI and
HU are positive
Status of Stocks Summary- Trends
Lenart 2018

Michigan Commercial Fishing
Statute


•

What’s Next???
• 2020 Consent Decree

Questions?