michigan’s oil and gas fields, 1975€™s oil and gas fields, 1975 ... is under the management of...
TRANSCRIPT

MICHIGAN’S OIL AND GAS FIELDS, 1975
Contents Acknowledgements ....................................................... 1 Introduction.................................................................... 2
PART I GENERAL STATISTICAL DATA ..................................... 3
Oil and Gas Permits ...................................................... 3 Permits Terminated in 1975 .......................................... 3 Directionally Drilled Holes, 1975 ................................... 4 Permits for Service Wells. ............................................. 4 Oil and Gas Hearings. ................................................... 4 Well Completions........................................................... 4 Well Completions by Majors and Independents in 1975............................................................................... 5 Well Casing Used in 1975 ............................................. 6 Geology Division Field Offices ...................................... 6 Oil and Gas Districts Map.............................................. 7 Drilled Footage. ............................................................. 7 Oil and Gas Production ................................................. 7 Oil and Gas Production by County ................................ 8 Condensate Production ................................................. 8 Special Orders: No Flare, Spacing and Proration, Explanation.................................................................... 9 Oil and Gas Valuation.................................................... 9 Oil and Gas Imports and Exports .................................. 9
New Field and Pool Discoveries ....................................9 Analysis of Discovery Wells by Geologic System........10 Drilling Objectives ........................................................10 State Oil and Gas Revenues........................................10 Well Records and Oil and Gas Maps...........................11
PART 2 OIL AND GAS FIELDS ...................................................11
Part 2, Oil and Gas Fields, Explanation .......................11 PART 3 CUMULATIVE RECORDS ..............................................12
Part 3, Cumulative Records, Explanation ....................12
ACKNOWLEDGEMENTS The Geological Survey Division's name, in conformance with Department-wide reorganization not yet completed, was officially changed to Geology Division during 1976. The Division's Oil and Gas Section consists of a Regulatory Control Unit, a Production-Proration Unit, and a Petroleum Geology Unit. A Cartographic sub-Unit is under the management of the Petroleum Geology Unit. Field operations are handled by personnel assigned to field offices within DNR Regions II and III. A Regional Geologist, under the supervision of the Regional Director, guides the overall activities of the several field offices within his region. Field offices are located at Plainwell, Cadillac, Grayling, Gaylord, Mt. Pleasant, Imlay City, and Lansing. Field activities are mainly those associated with the responsibilities of the Regulatory Control and Production-Proration Units, but do include the gathering of certain year-end oil-and-gas field statistics used to a limited extent in this report.
The compilation and assembly of various oil and gas field data into a yearly report is a major responsibility of the Petroleum Geology Unit. Certain data collected by field office personnel are contributed to this report by Unit supervisors who are under the general supervision of R. M. Acker, Assistant State Geologist and Chief of the Oil and Gas Section. Unit supervisors who provided specific information are:
V. F. Sargent, Supervisor, and S. L. Alguire, Field Coordinator, Regulatory Control Unit. Contribution: All data in columns under the headings "Number of Oil and Gas Wells" and "Brine Production" on Tables 2, 3, and 4.
James S. Lorenz, Supervisor, Production-Proration Unit. Contribution: All Michigan oil and gas production data, oil and gas valuation figures, import and export figures, LPG and condensate figures, secondary recovery projects (Table 5), and refineries.
G. D. Ells, Supervisor, and B. L. Champion and staff, Petroleum Geology Unit. All general drilling statistics and well completion data, discovery well and deep test data, cumulative records, and all other summary information not specifically provided by other Unit supervisors or by other agencies. Maintenance and compilation of statistics, assembly and manuscript
Annual Statistical Summary 24 -- Text and Explanations– Page 1 of 14

Annual Statistical Summary 24 -- Text and Explanations– Page 2 of 14
preparation by staff members of the Petroleum Geology Unit: G. D. Ells, Beverly L. Champion, D. M. Bricker, R. C. Elowski and Margaret Schineman.
The compilers also acknowledge the assistance of Gas Section personnel, Public Utilities Division, Department of Commerce, in providing figures on natural gas imports via interstate pipelines, and the Lands Division, Department of Natural Resources, in providing figures for state revenue derived from various oil and gas transactions.
Michigan oil and gas production figures maintained by the Production-Proration Unit are compiled by the Unit from records obtained from the Michigan Department of Treasury and from records filed by producers and purchasers. All hydrocarbon production figures cited herein are subject to correction as warranted.
Compilers: G. D. Ells B. L. Champion D. M. Bricker R. C. Elowski
Lansing, Michigan November, 1976
INTRODUCTION Oil and natural gas are two of Michigan's important mineral resources. Now into the sixth decade as an important oil and gas province, Michigan now ranks about 16th in oil production. This is mainly the result of the present cycle of successful exploration activity which began in 1969. This new cycle of activity, marked by an upward turn in annual oil and gas production, is linked primarily to deeper Niagaran reef discoveries in the northern and southern parts of the basin. The numerous new Niagaran reef reservoirs discovered the past few years have resulted in new production records being set.
The combined value of Michigan produced crude oil and natural gas was calculated to be $327,455,528 in 1975 as compared with a combined value of a little over $189,900,000 in 1974. In addition to the value of these natural resources, many millions of dollars were no doubt spent in lease and royalty payments, exploration and development drilling, geophysical surveys, and the many auxiliary activities and services connected with the extraction of these hydrocarbon resources during 1975. It is clear that oil and gas exploration and development is a major state industry and contributes substantially each year to Michigan's economy. Further, most of Michigan's oil and gas is processed and used within the borders of the state and thus directly contributes to energy needs.
To help foster the development of Michigan's hydrocarbon resources, statistical and other useful data have been maintained and published for many years. This issue of the oil and gas field statistical summary brings together information on various facets of oil-and-gas industry activities during 1975. Certain indices
which show the trend of activities from year to year are shown in chart form along with figures for prior years. Other charts show cumulative figures and other information of an historical nature, useful in oil and gas field evaluation.
As in the past, certain figures for the number of exploratory, development and service wells drilled and completed, the number of new fields and pools discovered, production figures, and so forth, may differ from those reported for 1975 by regional or national trade journals or by industry reporting services. The differences in the figures are generally minor and result from methods of gathering and reporting well data, determining cutoff dates for reporting statistics on a yearly basis, and the necessity of making estimates and projections of data for some types of reports.
Statistical data on Michigan oil and gas activities are also published by Oil and Gas News, Mt. Pleasant, Michigan; Petroleum Information, Incorporated, Denver, Colorado; American Petroleum Institute, Washington, D.C.; American Association of Petroleum Geologists, Tulsa, Oklahoma; Interstate Oil Compact Commission, Oklahoma City, Oklahoma; World Oil, Houston, Texas; and Oil and Gas Journal, Tulsa, Oklahoma. The differences in figures which may occur in these publications from time-to-time are almost always caused by factors stated in the preceding paragraph.
Certain well completion data are supplied to the American Petroleum Institute (API) and the American Association of Petroleum Geologists (AAPG) on a regular basis. API publishes the data in monthly and quarterly reports. Year-end printouts of the data are made available to authors of the AAPG yearly Development Papers and to others. Reports citing preliminary oil and gas statistics and production figures are also prepared for the Interstate Oil Compact Commission (IOCC). Oil and gas production figures, generally preliminary and subject to correction, are supplied by request to the United States Bureau of Mines for publication in their minerals yearbook. Other organizations mentioned in the previous paragraph publish oil and gas statistics derived from other sources, though some of the information is obtained from preliminary reports published by state agencies.
The information contained in this and previous issues of the oil and gas summary have been treated as uniformly as is possible from year to year. The data reflect as accurately as possible the actual figures and other information that should be credited to the year in review. The kinds of data found herein are mainly derived from records kept by the Oil and Gas Section, Geology Division, Department of Natural Resources. None of the data is derived from outside sources such as the aforementioned publications.
This publication is essentially divided into three parts. The first summarizes significant statistics on oil and gas field activities for 1975 and includes other related records kept by the Oil and Gas Section. Part 2 contains

specific information on Michigan's oil and gas fields, gas storage fields, and other related subjects. Part 3 contains cumulative records of import to the oil and gas industry. Data for 1975 have been included in these cumulative records.
PART I 1975 STATISTICAL DATA
* * * OIL AND GAS PERMITS * * * Oil and gas drilling permits issued under Act 61, P.A. of 1939, as amended, during 1975 began with permit number 30116 and ended with permit number 30769. The total number of permits issued during 1975 was 653 as compared with 503 in 1974. The initial classification of wells to be drilled under these permits was as follows:
*Includes 4 brine disposal wells.
The distribution of oil and gas drilling permits according to districts (See oil and gas districts map) through a five-year period, including 1975, is as follows:
*Includes terminated permits. Permits issued under Act 61, P.A. of 1939, as amended, are terminated six months after date of issue if actual drilling operations have not begun.
Permits to drill wells for oil field brine or waste disposal are no longer issued under a separate permit numbering system (e.g. BDW 156). Such permits are now issued under the regular permit numbering system. Deepening permits were issued for 61 wells during 1975 as compared with 45 the previous year. Deepening permits issued in 1975 began with number 1757 and ended with number 1818.
The number of terminated permits and new permits for previously drilled wells or permitted but undrilled locations has increased considerably the past few years. Michigan's oil and gas permit system began in 1927 with the issuance of permit number 1, and the permit numbers have been issued in numerically consecutive order since then. Wells which have been drilled, plugged, or otherwise abandoned have frequently been reopened and reworked under a new permit number. Several hundred such cases probably exist, most in connection with wells drilled years ago in gas storage
reservoirs. But in recent years, many well locations for which permits were issued but subsequently terminated have also been re-permitted and assigned new permit numbers, often to a different operator or company. Because well data, including permit numbers, are now being incorporated into computerized data systems by various companies and some government agencies, multiple permit numbers for the same well location may lead to various problems such as well identification and location. Therefore an attempt is being made to keep a published account of permit numbers which may be possible sources of conflict in well identification. Permit numbers issued for wells drilled under previous permits, or new permit numbers issued for terminated permits, were cited and listed for the first time in Annual Statistical Summary 18, 1973. Permit numbers issued in 1971, 1972, 1973 and subsequently terminated are listed in Part 3 as are new permit numbers for a previously drilled well or for a previously terminated permit. Permits issued in 1974 and terminated in 1974 or 1975, or permits issued in 1975 and terminated in 1975 are shown below.
[Permits Terminated in 1975]
Directionally drilled holes. Since 1972, environmental considerations and economics have necessitated the drilling of a large number of directional holes to help locate Niagaran reefs. Many of these holes involve using the upper part of a previously drilled hole which was plugged-back to an appropriate depth after being completed as a dry hole. These directionally drilled holes fall in three main categories: 1) a single directional hole completed as a producer or a dry hole; 2) cases where two or more directional holes have been drilled to bottom-hole targets from the same surface location by using the same upper part of the hole; 3) cases where one or more directional holes have been deviated to new bottom-hole targets after the original vertically drilled test failed to encounter reefing. Only one producer, of course, is allowed per well bore, regardless of the number of holes directionally drilled from the same well bore.
Each new directional hole, even though drilled from the same surface location and using the upper part of a previously drilled hole, is treated as a separate test and is assigned its own unique permit number. Each
Annual Statistical Summary 24 -- Text and Explanations– Page 3 of 14
additional hole drilled from the same surface location retains the same well name and number as the original hole, except that the suffix "A", "B", "C", etc., is added to the well number. For example: Shell-U.S. Steel #1-12, permit 30364 (1st hole, drilled vertically); Shell-U.S. Steel #1-12A, permit 30476 (2nd hole, drilled directionally from same location and upper part of hole as permit 30364); Shell-U.S. Steel #1-12B, permit 30496 (3rd hole, drilled directionally from same location and upper part of hole as permit 30364). In some instances, permits for directional holes were terminated and then subsequently repermitted under a new number. An attempt has been made to record and publish permit numbers for directionally drilled tests for the benefit of those persons who may find the information useful in computer-well data systems. Permit numbers issued for directional holes from 1972 through 1974, and directional holes with two or more permit numbers are listed in Part 3. Permits issued in 1975 for directional holes are as follows:
[Directionally Drilled Holes, 1975]
Service well permits. The fluctuation in the number of permits issued to drill gas storage wells and other service well types over a five-year period is as follows:
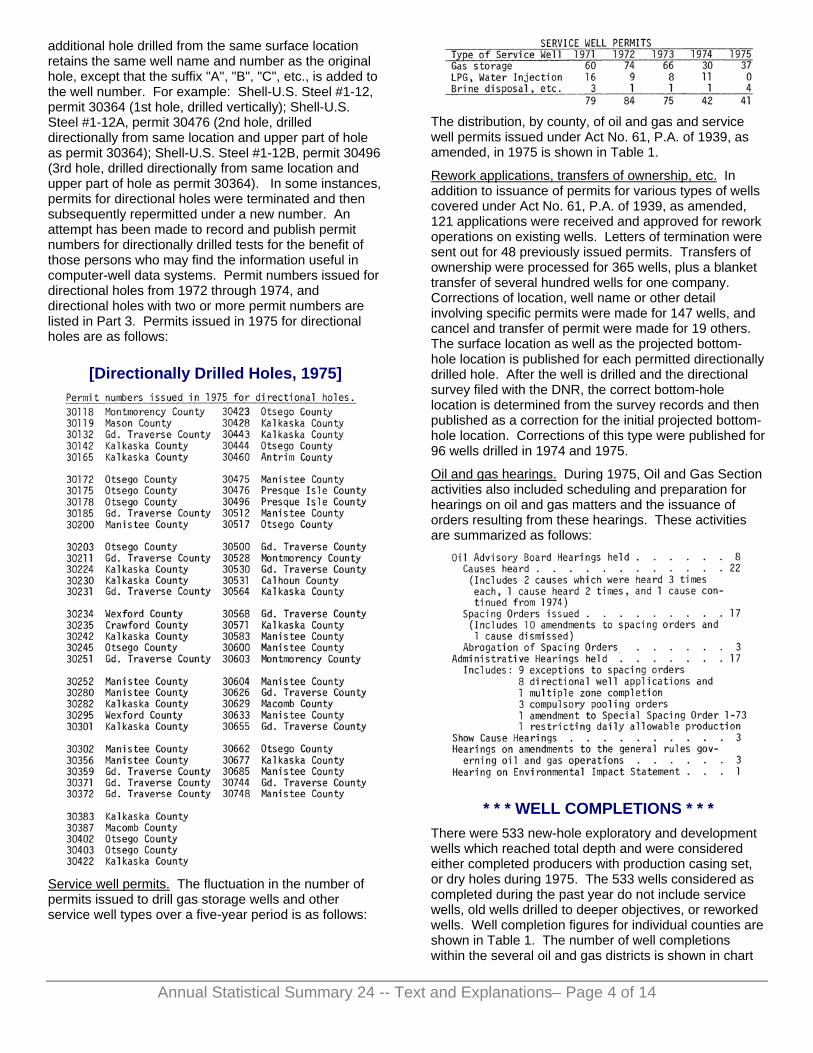
The distribution, by county, of oil and gas and service well permits issued under Act No. 61, P.A. of 1939, as amended, in 1975 is shown in Table 1.
Rework applications, transfers of ownership, etc. In addition to issuance of permits for various types of wells covered under Act No. 61, P.A. of 1939, as amended, 121 applications were received and approved for rework operations on existing wells. Letters of termination were sent out for 48 previously issued permits. Transfers of ownership were processed for 365 wells, plus a blanket transfer of several hundred wells for one company. Corrections of location, well name or other detail involving specific permits were made for 147 wells, and cancel and transfer of permit were made for 19 others. The surface location as well as the projected bottom-hole location is published for each permitted directionally drilled hole. After the well is drilled and the directional survey filed with the DNR, the correct bottom-hole location is determined from the survey records and then published as a correction for the initial projected bottom-hole location. Corrections of this type were published for 96 wells drilled in 1974 and 1975.
Oil and gas hearings. During 1975, Oil and Gas Section activities also included scheduling and preparation for hearings on oil and gas matters and the issuance of orders resulting from these hearings. These activities are summarized as follows:
* * * WELL COMPLETIONS * * * There were 533 new-hole exploratory and development wells which reached total depth and were considered either completed producers with production casing set, or dry holes during 1975. The 533 wells considered as completed during the past year do not include service wells, old wells drilled to deeper objectives, or reworked wells. Well completion figures for individual counties are shown in Table 1. The number of well completions within the several oil and gas districts is shown in chart
Annual Statistical Summary 24 -- Text and Explanations– Page 4 of 14

form. The fluctuation in the number of new-hole completions and the resulting number of oil, gas, or dry holes over a five-year period is as follows:
*See footnote for NEW WELL COMPLETIONS BY DISTRICT
There were 38 new-hole service well completions in 1975. All were drilled in gas storage reservoirs and completed as gas storage facility wells. The figure does not include reworked wells or old wells converted to facility wells. The fluctuation in the number of service well completions over a five-year period is as follows:
As mentioned earlier, certain completion data for exploratory, development and other types of wells are supplied to the American Petroleum Institute (API) and the American Association of Petroleum Geologists (AAPG). Monthly and quarterly printouts of the data, essentially supplied to API on a weekly basis, are sent back by API for verification or any corrections that need to be made. A final, year-end printout is also made available by API. Statistical data published for Michigan by API are correct according to the information submitted and approved at the time. However, the year-end figures published by API sometimes differ from those published later in the year by the Geology Division (formerly Geological Survey Division). The differences in figures are primarily due to API rules establishing a definite cut-off date for reporting or handling statistics on a yearly basis. The Oil and Gas Section of the Geology Division works directly with all phases of Michigan's oil and gas drilling activities and is not bound to a specific cutoff date for statistical reporting or maintenance of a suspense file of uncompleted wells. Thus, the Division's total year-end completion figures reflect more accurately the number of completed wells that should be credited to the year in review. Other factors which may result in differences in figures in some categories of completions are internal decisions of the Oil and Gas Section and decisions stemming from public hearings on oil and gas matters. For example, a well originally classified as a development well, and reported as such to API, may later be designated as the discovery well for a new pool or field, or a gas well might be declared an oil well completion. Frequently, the changes in well status or classification cannot be readily passed on to API so that their records can be updated prior to publication of their statistics. The discrepancies in final year-end figures are almost without exception related to Niagaran reef
exploration and development which has been the mainstay of Michigan drilling activities the past few years.
Michigan drilling statistics published by API and derived from data furnished by the Geology Division (G.D.) are shown below, along with figures for the same categories published herein as final year-end figures. API figures have been extracted from the Quarterly Review of Drilling Statistics for the United States, Fourth Quarter, 1975, Annual Summary, 1975, American Petroleum Institute, Vol. IX, No. 4, April 1976, Tables I, II, III, and V, pp. 14-22.
*API does not require information on wells drilled for gas storage. The Geology Division considers gas storage wells as a class of Service Well. 37 of the 38 Service Wells cited were gas storage facility wells.
*From Table V. **See footnotes for NEW WELL COMPLETIONS BY DISTRICT, 1975.
Major and independent company well completions. Requests are frequently made for statistics on major oil company drilling activities in Michigan. Although there appears to be no single definition of what constitutes a major company, the following companies are frequently cited as belonging in that category: Atlantic-Richfield, Cities Service, Continental Oil Company, Exxon, Getty Oil Company, Gulf Oil Company, Marathon Oil Company, Mobil Oil Corporation, Phillips Petroleum Company, Shell Oil Company, Standard Oil of California, Standard Oil of Indiana, Standard Oil of Ohio5 Sun Oil Company, Texaco, Inc., and Union Oil Company of California. The preceding list is not official nor necessarily complete. A number of these companies have oil and gas interests in Michigan and some of them drilled wells in the state during 1975. The forthcoming figures, cited for major companies who drilled wells in Michigan in 1975, do not include wells drilled by independents but partially supported by dry-hole money, acreage contribution, or some other significant assistance from a major oil company. Independent companies, who have drilled most of Michigan's wells, are too numerous to cite individually. The number of well completions by independents are shown for comparative purposes. All figures cited for majors and
Annual Statistical Summary 24 -- Text and Explanations– Page 5 of 14

independents were derived from inspection of names appearing on completion records.
*Includes GS-OBS, LPG, WI, BDW wells. (1)Does not include two 1974 dry holes reworked as oil discoveries in 1975. (2)Does not include two 1974 and older dry holes reworked as gas discoveries in 1975,
Total: Exploratory Wells 283; Development Wells 250; Service Wells 38.
Exploratory Wells drilled by Majors 54%. Exploratory Wells drilled by Independents 46%.
Exploratory Discoveries made by Majors 81%. Exploratory Discoveries made by Independents 19%
Development Wells drilled by Majors 55%. Development Wells drilled by Independents 45%.
Producing Development Wells drilled by Majors 61% Producing Development Wells drilled by Independents 39%.
Discovery to Exploratory Dry Hole ratio - Majors 1:1.7; Independents 1:9.1.
Well casing used in 1975 well completions. Periodically, inquiries are made concerning the amount of casing (pipe) used in drilling wells during a given year. While the number of casing strings and the amount and size of casings used in each well drilled in Michigan is known, compilations of casing data have not heretofore been made. Virtually all oil and gas tests are rotary drilled and require the setting of surface pipe and an intermediate casing string. A conductor pipe is set on many holes and all require a string of production casing if they are to be completed as some type of well other than a dry hole. Pipe size ranges and amounts have been determined from records of wells completed during 1975. For convenience, casing tallies have been related to a range of casing sizes as shown in the following chart.
(1) Total footage: 2,562,548 (2) Total miles: 485.3 (3) Total tonnage: 43,333 based on an average weight for all sizes of 46# per foot.
(1) Includes one gas well discovery resulting from reopening and completion of a dry hole credited to 1974 or a prior year. (2) Includes one oil well discovery resulting from reopening and completion of a dry hole credited to 1974 or a prior year. *Exclusion of (1) and (2) above results in 283 new-hole exploratory wells (New-Field Wildcats), 250 new-hole development wells, and 38 service wells.
GEOLOGY DIVISION FIELD OFFICES DNR REGION II FIELD OFFICES Gaylord (Otsego County) Grayling (Crawford County) Cadillac (Wexford County) Mt. Pleasant (Isabella County)
DNR REGION III FIELD OFFICES Lansing (Ingham County) Plainwell (Allegan County) Imlay City (Lapeer County)
Dots show the general location of field offices within the several districts. These districts are arranged for administrative and regulatory purposes. Though frequently called oil-and-gas districts, they should not be confused with those shown below which have been in use for many years in presenting statistical data.
Annual Statistical Summary 24 -- Text and Explanations– Page 6 of 14

[Oil and Gas Districts Map]
Drilled footage. The average depth, statewide, of exploratory wells drilled in 1975 was 4,937 feet compared with 5,166 feet in 1974. Development well depths averaged nearly 5,000 feet as compared with 5,053 feet in 1974. Service wells drilled in 1975 averaged about 1,893 feet as compared with 2,808 feet in 1974. Drilled footage figures and average well depths for specific counties are shown in Table 1. Average depths for wells drilled in these counties can be figured from the data shown in Table 1.
Total drilled footage figures from Geology Division records for 1975 and several prior years are as follows:
*Corrected figure: shown as 554,968 in 1972, 1973, 1974 issues.
Drilled footage figures for individual wells are included in the well completion data provided the American Petroleum Institute. Total drilled footage is published as part of their quarterly and annual summary. Drilled footage figures extracted from the aforementioned 1975 API Annual Summary are as follows:
The difference in total drilled footage figures (59,307 Exploratory and 33,172 Development) as reported by API and by the Geology Division are related to factors previously mentioned. API footage figures are correct on the basis of reporting-year criteria.
* * * 1975 OIL AND GAS PRODUCTION * * * Oil and gas production figures are derived from Michigan Department of Treasury tax records and records submitted to the Production-Proration Unit, Oil and Gas Section, Geology Division, Department of Natural Resources. Treasury Department records, forwarded to the Production-Proration Unit, are mainly concerned with and related to gross production figures needed to calculate revenues. These data are supported by records and reports required to be filed with the Geology Division by producing companies and purchasers. Delays in reporting production figures, methods of reporting used by producers and purchasers in handling crude oil and stable condensate from gas wells, frequent errors in the records, all result in a continuous correction and refinement of production figures. Consequently all monthly, year-end, or other production figures are subject to corrections as warranted. In Annual Statistical Summary 22, errors occurred in some of the production figures cited for the various formations for the year 1974. These were in turn reflected in the cumulative figures for gas and oil as shown on other charts. Corrections have been made at appropriate places in this issue.
Oil and gas production continued to increase statewide mainly because of continued development of the Niagaran reef belt extending from western Mason County northeasterly through Manistee County, northwestern Wexford County, Grand Traverse and Kalkaska counties, southeastern Antrim County, Otsego County, and into northwestern Montmorency County. New discoveries in Presque Isle County in 1976, but not cited or figured in this issue, have extended the trend almost to the shore of Lake Huron. The spread of these reef fields across northern Southern Peninsula counties is shown on the map accompanying Table 2.
Annual Statistical Summary 24 -- Text and Explanations– Page 7 of 14

OIL AND GAS PRODUCTION BY COUNTY IN 1975
* * * NATURAL GAS LIQUIDS * * * The amount of liquids produced from gas-condensate reservoirs associated with western and northern Michigan reef traps continues to increase. These liquids (stabilized condensates) produced from wells classified as gas wells are included in the yearly oil production totals cited in various tabulations in this publication. Wells officially determined to be gas wells are assigned to the Public Service Commission for well connection permits and determination and jurisdiction of gas production allowables. Under Public Service Commission jurisdiction, there is no restriction on the amount of liquids produced along with the gas. Gas plants operated by Shell Oil Company and by Amoco Production Company in Kalkaska County strip natural gas liquids from the gas. The liquids are then sold to another company through the Shell pipeline that terminates at Marysville, Michigan.
An attempt has been made to maintain records of condensate production from the northern reef trend reservoirs discovered since 1969. Production-Proration Unit records show the following figures for liquids classified as condensate:
CONDENSATE PRODUCTION
Gas plant operations are summarized in table form elsewhere herein. It should be noted that the LPG recovery figures for the Shell and Amoco plants in Kalkaska County include stabilized condensate as well as LPG's.
A no-flare order, enacted as a conservation measure, prohibits the flaring of oil-well gas and requires Salina-Niagaran oil wells in specified counties to be shut in until a market connection is achieved for the sale of the gas or an exception to the order is granted. Consequently, Special Order No. 3-71, amended, in effect since late 1971, tends to temporarily curtail production from Salina-Niagaran oil wells until such time as gas-gathering pipelines are laid and connections made.
Another order, Special Order No. 1-73, deals with spacing and proration of Salina-Niagaran wells in specific counties. This order established basic 80-acre drilling units (either stand-up or lay-down units) for Salina-Niagaran oil and/or gas wells and statewide proration from Salina-Niagaran oil reservoirs in the specified counties or parts of counties covered by the order. The area covered by the no-flare order and by the spacing-proration order are shown on the inset map along with information on the drilling unit, well spacing, and basic oil-gas allowables. These prudent and
Annual Statistical Summary 24 -- Text and Explanations– Page 8 of 14

justifiable conservation measures effectively prevent waste of millions of cubic feet of valuable and much needed gas that might have been flared in past years, and these measures should ultimately result in more efficient drainage of reef reservoirs and a greater recovery of the liquid hydrocarbons.
[Special Orders: No Flare, Spacing and Proration, Explanation]
* * * OIL AND GAS VALUATION * * * Records maintained by the Production-Proration Unit indicate the average price paid at the wellhead in 1975 for Michigan crude, including condensate, was $10.74 per barrel compared with $8.56 per barrel in 1974. The gross value of these products amounted to $262,351,653 as compared with $154,746,373 in 1974. The value of Michigan produced natural gas continued to rise in 1975. The average price of gas sold at the wellhead was $.634 per Mcf as compared with $.50 per Mcf in 1974. The gross value of this product amounted to $65,103,875 in 1975 as compared with $35,181,955 in 1974.
* * * OIL AND GAS IMPORTS AND EXPORTS * * *
Total imports to Michigan refineries of U.S. domestic and Canadian crude oil amounted to 37,599,514 barrels in 1975, a decline from the 42,099,556 barrels imported during 1974. Imports of U.S. domestic crude to Michigan refineries via pipeline from western and mid-western states increased from 14,781,592 barrels in 1974 to 15,321,840 barrels in 1975. Imports of Canadian crude via pipeline from western Canada oil fields continued to decline. Canadian imports amounted to 27,317,964 barrels in 1974 but declined to 22,277,674 barrels in 1975. The trend of U.S. domestic and Canadian imports to Michigan refineries from 1962 through 1975 is shown graphically. Imports by month during 1975 are as follows:
The bulk of Michigan produced crude goes to Michigan refineries but some is exported. The amount exported and credited to out-of-state terminals increased from 2,766,486 barrels in 1974 to 6,899,744 barrels in 1975. Records kept by the Production-Proration Unit show the following exports, by month, of Michigan produced crude:
Natural gas imports to Michigan markets and gas storage fields in 1975 via interstate pipelines, primarily from Texas, Louisiana, Oklahoma and Kansas fields, amounted to 840,412,900 Mcf, a slight decrease under the 851,903,391 Mcf imported in 1974. Compilations by the Gas Section, Michigan Public Service Commission, show the following imports, by month, during 1975:
* * * NEW FIELD AND POOL DISCOVERIES * * *
Silurian reefs were again the main type of oil-and-gas trap found in 1975 and all appeared to have been located by seismic methods. Most were found along the northern reef trend extending from Mason County in the Western District northeasterly through part of the Northern District. Others were found in the southern part of the basin in the Calhoun-Eaton-Ingham County area,
Annual Statistical Summary 24 -- Text and Explanations– Page 9 of 14

and in the Macomb-St. Clair County part of the Southeastern District.
All the new discoveries are tentatively classified as Class E pools having possible oil and gas recoveries as defined by the Committee of Statistics of Drilling, American Association of Petroleum Geologists. These classes, shown below, are used to give some estimate or measure of reserves found by a discovery well.
Class A - Over 50 million barrels oil or 300 BCF gas Class B - 25-50 million barrels oil or 150-300 BCF gas Class C - 10-25 million barrels oil or 60-150 BCF gas Class D - 1-10 million barrels oil or 6-60 BCF gas Class E - 1 million barrels or less oil, or less than 6 BCF gas Class F - Abandoned as non-profitable
Michigan wells are initially classified as near as possible according to guidelines established by AAPG and API (AAPG Bulletin, Vol. 58/8, August 1974, pp. 1501-1503). Classifications such as exploratory, development, and the various types of service wells, are made after inspection of appropriate oil and gas maps and noting the location of the test in reference to established fields, dry holes, etc. Gas storage facility wells, water injection wells and other types of service wells are generally designated as such by the operator. The Lahee classification system for designating exploratory or development wells is particularly adaptable to structural traps but does not adapt to all situations involving small reefs such as are found in Michigan. Because of the apparent small area! extent of most reefs as shown by seismic anomalies and the close proximity of one reef to another, especially in the northern and southern reef belts, it has become increasing difficult to classify with certainty all new well locations as exploratory or development.
Discovery wells credited to 1975 are shown on the forthcoming list. The list may show a few wells that were reclassified during 1976. Reservoir performance may show that a well previously classified as a development well should actually be considered as being in a separate reservoir or pool. Likewise, a so-called discovery well may actually turn out to be a development well to a nearby reef reservoir. Also, a discovery well may be completed as an oil well but at sometime later be reclassified as a gas well and, conversely, a gas well may later be reclassified as an oil well. Changes in classification may be the result of action by the regulating agency after enough data has been
accumulated on the well or wells, or may result from new data presented at public hearings and the decision of the Supervisor of Wells after thorough consideration of the new data.
An analysis of 1975 discovery wells according to geologic system and an analysis drilling objectives penetrated at total depth by wells completed in 1975 follows.
ANALYSIS OF 1975 DISCOVERY WELLS BY GEOLOGIC SYSTEM
*Most reefs also have associated Salina A-1 oil or gas pays. **This well was a dual discovery in both the Salina E Zone and the Niagaran.
DRILLING OBJECTIVES IN MICHIGAN
* * * STATE OIL AND GAS REVENUE * * * Total State revenues credited to 1975 and derived from royalty, rental, bonus from lease sales, and application-assignment fees amounted to $11,452,377.97. This figure is derived from these components:
Annual Statistical Summary 24 -- Text and Explanations– Page 10 of 14

Oil and gas revenue figures according to year and source are found in Part 3.
* * * WELL RECORDS AND OIL AND GAS MAPS * * *
OIL AND GAS WELL RECORDS. Descriptive geological logs and drillers logs are available for over 31,200 tests, including exploratory, development, facility and other types of wells. Individual well records may be purchased at a nominal cost from the Geology Division. Electric or radiation logs of any type are not available for distribution or sale.
OIL AND GAS FIELD MAPS. Blueprint copies of oil and gas field maps are available for every county in the Southern Peninsula. The maps show locations of oil and gas tests but do not show geological data or structural contour lines. County map scales are 1" = 1 mile. Blueprint field maps are available for many oil and gas fields. These maps show well locations, well permit numbers, operators and lease names. They do not show geological data or structural contour lines. Field map scales are mainly 4" = 1 mile. All manuscript maps or tracings from which blueprint copies are made are posted on a regular basis. An oil and gas field maps list may be obtained from the Geology Division upon request.
PART 2
EXPLANATION Part 2 brings together general information on Michigan's oil and gas fields, gas storage reservoirs, LPG storage facilities, gas plant operations, refinery facilities and other items.
TABLES 2, 3 and 4 list Michigan's oil and gas fields and gas storage reservoirs. The symbol on the left margin of the table indicates the official classification of fields and pools at the end of the year. Classifications may be changed as warranted. Official field names are listed alphabetically in the first column and the producing pool, or pools, are shown under the heading Producing Formation or Pool. Most fields consist of one pool with oil or gas production coming from a single reservoir within a formation. Some fields have two or more
separate pools, each producing from a different formation or stratigraphic interval and at a different depth. Most multi-pool fields are associated with a common structural feature. Salina-Niagaran reef oil or gas accumulations are mostly single-pool fields. Some, however, have several separate reef reservoirs designated as Pool A, Pool B and so on. Most have been so designated by administrative action following public hearings. Also, a few of the listed fields actually consist of two or more hydrocarbon accumulations which for administrative purposes have been consolidated under one field name.
Location of fields according to township, range and sections are found at the bottom of the field block. The listed sections are those which have, or have had, producing wells assigned to the field or pool. The geographic location of fields and pools can be found by township and range on the center-spread oil and gas field map. Due to space limitations, all field names are not shown on the map.
The Pay Zone part of the table generally refers to data for the discovery well for the field or pool. The Indicated pay thickness relates to the amount of pay opened or perforated in the discovery well and does not necessarily indicate total net or gross pay for the reservoir.
The Deepest Formation or Pool Tested column indicates the stratigraphically oldest formation penetrated and the deepest total depth reached beneath the field area. Data in these columns are updated periodically.
The Number of Wells column indicates the number of successful field wells drilled in the field to the end of the specified year, the number completed as producing wells during the specified year, the number abandoned during the year and the number of active wells at the end of the specified year.
The Drilled Acres column indicates the total number of acres assigned to the field or pool according to individual well drilling units assigned to each producing well completed in the field or pool. Except as provided by special orders covering drilling units, rules promulgated under Act No. 61, P.A. of 1939, as amended, call for a minimum 40-acre unit consisting of a governmental quarter-quarter section of land. Special Order No. 1-73 calls for basic 80-acre drilling units for Salina-Niagaran or deeper tests in specified areas of the state. These 80-acre units are formed by two governmental quarter-quarter sections of land having a common boundary of approximately 1320 feet. In past years drilling units have been 10, 20 or 40 acres for oil wells. A field may have had a 10 or 20-acre drilling unit for one pool and a 40-acre unit for a deeper formation pool. During the development of a field or pool the drilling unit size may change. Subsequent wells are assigned acreage values in accordance with the new unit size. Gas well units, especially for Michigan Stray Sandstone reservoirs, have generally been 160-acre units. Other sizes currently in use for gas wells are 40, 80, 320 and 640-acre units, or a unit size based on seismic and res-servoir data. Reef
Annual Statistical Summary 24 -- Text and Explanations– Page 11 of 14

Annual Statistical Summary 24 -- Text and Explanations– Page 12 of 14
reservoirs, especially in the northern reef trend, have been assigned 80, 160, 640, or a unit based on seismic data. Changes in drilling units, off-pattern wells, etc., complicate the maintenance of accurate figures during the lifetime of a given field or pool.
Recovery Per Acre Drilled figures for oil pools are derived by dividing the cumulative production figure by the drilled acres figure.
Gas Fields, Gas-Condensate Fields. Some fields are listed as "shut-in" and show no production figures. In the case of Niagaran reef fields classified as gas-condensate reservoirs, virtually all those listed as shut-in at the end of 1975 were waiting pipeline construction or gas-handling facilities. Others, mainly small dry-gas reservoirs in shallower formations, are listed as shut-in because of slow field development, small reserves or lack of marketing facilities. Other fields, not considered to have commerical-size gas accumulations, produce small quantities of unmetered gas which is used for domestic purposes and in some cases, lease fuel.
GAS STORAGE RESERVOIRS. Most gas storage reservoirs were originally classified as gas fields or pools. Upon depletion or near depletion of native gas they were converted to storage reservoirs. The producing sections listed on gas storage reservoir tables do not necessarily relate to current gas storage area or boundaries. The sections or parts of sections listed are those which contained at least one producible oil or gas well assigned to the field or pool prior to conversion to gas storage operations. Further, the listed sections do not necessarily relate to potential or future gas storage area or boundary. The table listing undeveloped gas storage reservoirs has been discontinued beginning with this issue.
LPG STORAGE. Surface and underground storage facilities for liquified petroleum gas.
OIL WELL GAS. This is casinghead gas produced incidental to the production of oil from pools or fields generally classified as oil accumulations.
NATURAL GAS LIQUIDS (CONDENSATE). Natural gas liquids are those portions of reservoir gas which are liquified at the surface in lease separators, field facilities, or gas processing plants. These liquids include but are not limited to: ethane, propane, butanes, pentanes, natural gasoline and condensate. On Tables 2 and 3 of this report, condensates from Michigan gas-condensate fields are shown under the oil production column.
WELL SAMPLE SETS. Well cuttings for over 9,000 wells are available for inspection at the Geology Division, formerly Geological Survey Division, Lansing, Michigan. Samples are contained in glass vials arranged in open trays. In addition, several thousand shallow geological test samples are also available for inspection. The Division does not maintain a core collection. Other sample and core repositories, not connected with the Division, are located at:
Subsurface Laboratory, Department of Geology, The University of Michigan, Ann Arbor, Michigan.
Department of Geology, Wayne State University, Detroit, Michigan.
Department of Geology, Western Michigan University, Kalamazoo, Michigan.
Department of Geology, Michigan State University, East Lansing, Michigan.
Department of Geology, Central Michigan University, Mt. Pleasant, Michigan.
PART 3
CUMULATIVE RECORDS EXPLANATION
PART 3 contains cumulative statistics principally of oil and gas production, well completions, and oil field brine production and disposal from 1925 through the most recent year-end compilations.
OIL AND GAS PRODUCTION TABLES. Oil and gas production figures for individual years prior to 1960 can be found in issues of "Summary of Operations, Oil and Gas Fields" for 1962 and prior years, and in "Michigan's Oil and Gas Fields" 1963 to present. The tables show the year of the first recorded production from a particular formation, and the yearly and cumulative production totals from 1925 through the most recent year-end compilations. Cumulative oil and gas production by county is shown on a separate table. Refer to Part 1 for county production figures for the past year, and prior issues for previous years.
CUMULATIVE WELL COMPLETIONS. These tables show the cumulative number of yearly completions in a county. Well density figures include field development wells, exploratory wells, and service wells of all types.
DRILLING PERMITS, WELL COMPLETIONS, FIELDS DISCOVERED. These tables show the number of drilling permits issued by year from 1927 through the most recent year-end compilations. Initial classification of well completions by year, the number of new fields or pools discovered, and the number of producible oil or gas wells on a yearly basis are all shown on the same table.
BRINE PRODUCTION AND DISPOSAL. Oil field brine production records other than for individual fields were discontinued in 1968. These tables listed the reported amount of produced brine and the method of disposal from 1937 up to 1967. Most oil field brine is still returned to subsurface formations. Small quantities are used for dust control or ice and snow removal on county roads in local areas. A small amount of brine is also disposed of in burning pits.
SERVICE WELLS. Service wells as listed in this publication are those wells which were drilled to serve some purpose other than the initial production of oil or
gas. Oil or gas wells are sometimes converted to salt water disposal, observation, or facility wells in gas storage or pressure maintenance projects. There are several types of service wells:
LPG Wells. These are wells drilled for underground storage of liquified petroleum gas. In Michigan, these storage reservoirs are in man-made cavities in salt beds. The cavities have been made by dissolving the salt with water and then pumping out the brine.
Gas Storage Wells. These are wells drilled in gas storage reservoirs. They are frequently referred to as facility wells, and are generally used to inject gas into or extract gas from the reservoir. Certain facility wells may sometime in the history of the field be used as salt water disposal wells or observation wells.
Observation Wells. Most observation wells are related to gas storage projects. They are used to observe underground movement of gas, brines and other fluids, or to observe pressures.
Brine Disposal Wells. These wells are used in the disposal of oil and gas field brines back into some suitable subsurface formation. Brine disposal well permits are issued for these wells.
Injection and Pressure Maintenance Wells. These are wells used in secondary recovery, or pressure maintenance projects. They may be new wells drilled specifically for injection or pressure maintenance, or they may be converted oil or gas wells; their status can change from time to time.
Oil or gas wells are sometimes converted to salt water disposal, observation, facility wells in gas storage reservoirs, or water injection wells used in secondary recovery or pressure maintenance projects. The types of service wells listed under "Classification of Well Completions" do not include oil or gas wells converted to service wells.
STATE OF MICHIGAN
William G. Milliken, Governor
DEPARTMENT OF NATURAL RESOURCES Howard A. Tanner
Director and Supervisor of Wells
GEOLOGY DIVISION Arthur E. Slaughter
State Geologist and Assistant Supervisor of Wells
NATURAL RESOURCES COMMISSION
Harry H. Whiteley, Chairman Rogers City
E. M. Laitala, Hancock Dean Pridgeon, Montgomery Hilary F. Snell, Grand Rapids
(Mrs.) Joan L. Wolfe, Belmont Carl T. Johnson, Cadillac Charles G. Younglove, Allen
Park
Charles J. Guenther, Executive Assistant
OIL AND GAS ADVISORY BOARD
Vance W. Orr, Chairman, McClure Oil Co.
K. P. Wood, Vice Chairman, Independent Producer
C. John Miller, Miller Brothers William J. H. Wilde, General
Public
G. D. Simon, Patrick Petroleum Co.
J. A. Vary, Michigan Consolidated Gas Co.
Claude J. Osbourne, Shell Oil Co.
(Mrs.) C. R. Williams, General Public
James S. Lorenz, Department of Natural Resources, Secretary
Published by Authority of State of Michigan CL '48 s.321.6
Any part of this publication may be quoted or reprinted with appropriate credit
Available from Publications Room, Department of Natural Resources Box 30028, Lansing, Michigan 48909
Annual Statistical Summary 24 -- Text and Explanations– Page 13 of 14

Annual Statistical Summary 24 -- Text and Explanations– Page 14 of 14