micro level study of accidents from pantha chock to
TRANSCRIPT

© 2018 JETIR October 2018, Volume 5, Issue 10 www.jetir.org (ISSN-2349-5162)
JETIR1810743 Journal of Emerging Technologies and Innovative Research (JETIR) www.jetir.org 317
MICRO LEVEL STUDY OF ACCIDENTS FROM
PANTHA CHOCK TO SINGHPORA PATTAN.
Aadil Rashid Peerzada1,Asief Ahad2, Awais Nazir Malik 3 , Aman Bathla4 1M. Tech Scholar, Geeta Engineering College, Naultha, Panipat, 2M. Tech Scholar, Geeta Engineering College, Naultha, Panipat,
3,4Assistant Professor Civil Engineering Department, Geeta Engineering College, Naultha, Panipat
Key words: Road Accidents, Crash Patterns, Block Cracking, Hungry Surface, Potholes, Loss of Aggregates, Stripping Reflection,
Cracking Ravelling ,Frost Heaving, Los Angles Abrasion Test, penetration test, ,vertical and horizontal alignment , sight distance, driver
characteristics.
ABSTRACT
Road networks are the life line for the movement of
people and freight and play an important role in the
development of a region but road accidents cause heavy
burden on financial and social setup of an economy.
According to a WHO report, Road Accidents will become
the fifth leading cause of death by 2030. Despite lot of
effort from various agencies in curbing traffic accidents,
they are on the rise in developed country in general and
developing countries in particular. The locations in a road
stretch where higher numbers of road accidents occur are
called Black Spots.
Accidents in the present era are contributing to
major deaths worldwide due to increase in vehicular
density.it has been estimated that every 1.37 lakh people
die, 3 lakh lose their limbs and 4 lakh people get injured in
road accidents in India. Our country incurs a loss of 55,000
crore each year due to road accidents.
Now Government of India has declared the current
decade as the decade of innovation for inclusive growth
and the U.N. has declared this decade as the “Decade of
Action for Road Safety 2011-2020”. The focus is now
being shifted on the people and services for inclusive
growth and the road safety. Globally, road crashes result in
fatalities of 1.3 million a year and India alone accounts for
11 per cent of the global road crashes. In the year 2013,
we had about half a million road accidents resulting in
137,572 fatalities and 4, 90,000 serious injuries. This
means one fatality on our roads every four minutes. The
total socio-economic loss due to road accidents is
estimated at 4 per cent of Gross Domestic Product (GDP).
INTRODUCTION
General:
The no of vehicle is India is shown in table 1. This data s
how that total no of vehicles increased from 37 million in 19
97 to 73 million in 2004, This represents average increase of
11% of motorised two wheelers and cars and 7% for trucks
and buses, However all of the vehicles remain in official rec
ords but only 60 to 70% of them ply on roads. Table 2 show
s the sales figure in 1997 and 2007, it also shows the annual
increase of 10-12% per year
Table 3 shows the no of road traffic fatalities
and the population of India from1997 to 2007.The no of
fatalities increased at an avg rate of 4% per year from 1997-
2003 and the rate has increased 8% per year since then, The
no of fatalities per year remained 79-83 in period 1997-2003
and has since increased to 101.Traffic fatalities per million
population has been taken as an indicator of the health
burden of road traffic crashes on society at the city ,
regional, or national level ,at the individual level risk injury
per trip is a consequence and the no of trips in proportional
to population ,Therefore traffic fatalities per unit population
can be taken as rough indicator of risk faced by individuals
,The risk of being involved in fatal road traffic crash
obviously been increasing for Indians over the past few
years .while some of this increase can be attributed to
increase in motor vehicle per capita in India ,However

© 2018 JETIR October 2018, Volume 5, Issue 10 www.jetir.org (ISSN-2349-5162)
JETIR1810743 Journal of Emerging Technologies and Innovative Research (JETIR) www.jetir.org 318
increasing vehicle ownership need not result in increased
fatality rates if adequate safety measures are implemented.
Accident Situation in India: It is estimated that in the
U.S.A, about 44000 persons are killed and 3 million injured
every year. This figure is alarming. The accident situation is
more serious in India because of the rapid growth of motor
vehicles in the past few years and inadequacy of many of
our roads and street to cope up with this traffic. The mixed
traffic conditions prevailing on the roads in India make the
matters much worse.
Table 1: Road Accidents in India, 1970-2001
(Source LR Kadyali)
Year Road
accidents
Persons
Killed
Persons
Injured
1 2 3 4
1970 114.1 14.5 70.1
1971 120.2 15.0 70.7
1972 122.3 16.1 76.4
1973 121.6 17.6 79.3
1974 114.3 17.3 76.7
1975 116.8 16.9 77.0
1976 124.7 17.8 82.5
1977 135.4 20.1 95.6
1978 146.3 21.8 99.5
1979 144.4 22.6 102.9
1980 153.2 24.6 109.1
1981 161.2 28.4 114.0
1982 166.2 30.7 126.0
1983 177.0 32.8 134.1
1984 195.0 35.1 156.2
1985 207.0 39.2 163.4
1986 215.5 40.0 176.4
1987 234.0 44.4 189.0
1988 246.7 46.6 214.8
1989 270.0 50.7 229.7
1990 282.6 54.1 244.1
1991 293.4 56.4 255.0
1992 260.3 57.2 267.2
1993 280.1 60.7 287.8
1994 320.4 64.0 311.5
1995 348.9 70.6 323.2
1996 371.2 7406 369.5
1997 373.7 77.0 378.4
1998 385.0 79.9 390.7
1999 386.4 82.0 375.0
2000 391.4 78.9 399.3
2001 405.6 80.9 405.2
2002 407.5 84.7 408.7
2003 406.7 86.0 435.1
2004 429.9 92.6 464.5
2005 439.2 94.9 465.2
Table 2: Motor Vehicle Registration in India
*Motorised two wheelers
**Other including tractors, trailers, three wheelers and misc
ellaneous vehicles
***Numbers in parentheses represent row percentage
Table 3: Vehicle Sales in India
Year MTW
*
Cars/
Jeeps
Tru
cks
Buse
s
Othe
rs**
Total
1997 25,729
(69)**
4,672(
13)
2,34
3(6)
484(
1.1)
4,104
(11)
37,332
(100)
2004 51,922
(71)
9,451(
13)
3749
(5)
768(
1.3)
6,828
(09)
72,718
(100)
Growth
per Yea
r (%)
10.6 10.6 6.9 6.8 7.5 10.0

© 2018 JETIR October 2018, Volume 5, Issue 10 www.jetir.org (ISSN-2349-5162)
JETIR1810743 Journal of Emerging Technologies and Innovative Research (JETIR) www.jetir.org 319
Table 4: Road Traffic Fatalities in India
1. Crash Patterns:
Details of traffic crashes are under different crash patterns,
while the official road traffic fatality data may be close to ac
tual number, the injury data are gross estimates .In this repor
t only fatality data are used for analysis as non –fatal data m
ay suffer from many biases.
2. Road User Category:
Official road traffic crash data do not include fatalities by ro
ad user category in India. Such data are only available from
a few cities and research studies done on selected location
s on rural highways .Table 4 shows traffic fatalities by categ
ory of users in Delhi and selected locations on national high
ways. These data show that car occupants were a small prop
ortion of the total fatalities, 3% in Delhi and 15% on rural hi
ghways. Vulnerable road users (pedestrians, bicyclists, and
motorized two-wheeler riders) accounted for 84% deaths in
Delhi and 67% on highways. This pattern is very different fr
om that obtained in all high-income countries. At present vu
lnerable users may likely remain the dominant mode for nex
t few decades. The fatalities can be controlled in coming yea
rs if road safety policies put a special focus on the safety of
vulnerable road users.
Table 5: Traffic fatalities by category of road user in Delhi a
nd Selected locations on National highways
Type of road user Delhi (20
01-2005)
Highways (1
999)
Truck 2 14
Bus 5 3
Car 3 15
Three-Wheeled Scoo
ter
3 -
Motorized two-wheel
er
21 24
Human and animal
powered vehicles
3 1
Pedestrian 53 32
Total 100 100
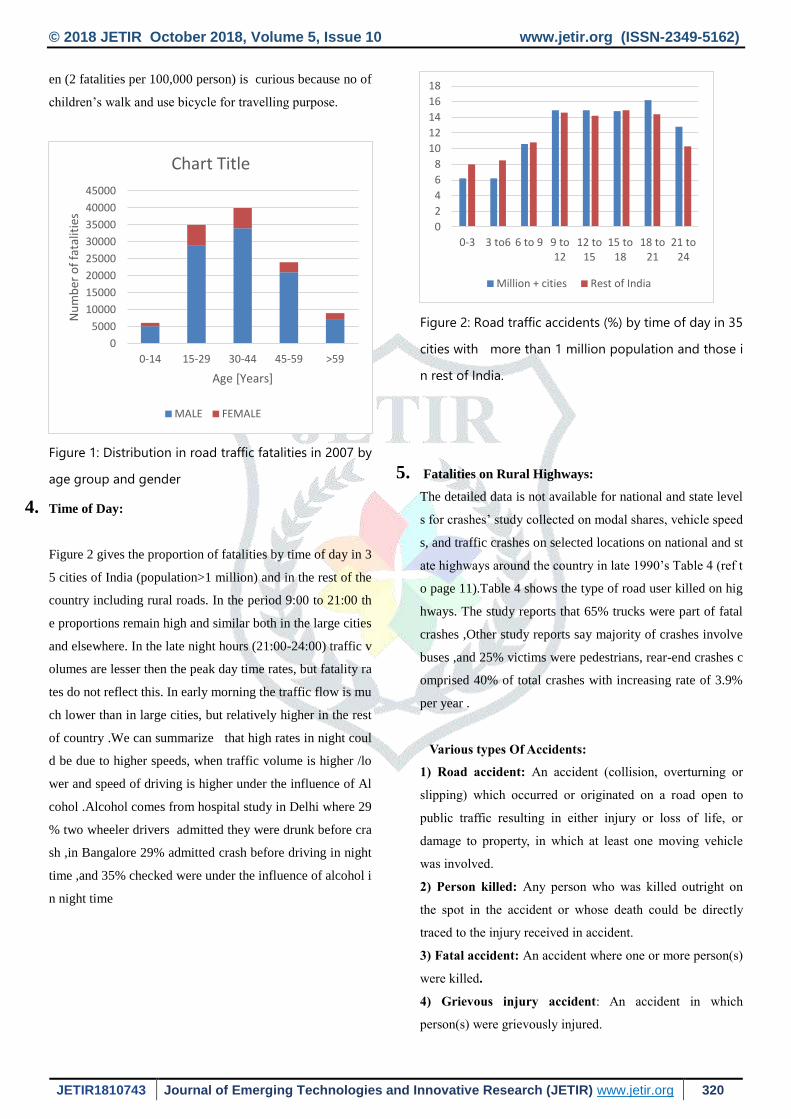
3. Age and Gender:
Figure 1 shows the distribution in road traffic fatalities in 20
07 by age group and gender. In 2007, 15% victims were fem
ales. This is because of low exposure and representation of
women on roads. Children and 14 years and younger compr
omise only 6% of the fatalities, though their share in the pop
ulation is 32%.The fatalities in the age groups 15-29 and gre
ater than 60 years is similar to their representation in the pop
ulation, but the middle aged groups 30-44 and 45-59 are ove
r represented by about 70%.The low representation of childr
Year Fatalities Population(m
illion)
Fatalities/millio
n persons
1997 77,000 995 81
1998 79,900 971 82
1999 82,000 987 83
2000 78,900 1,002 79
2001 80,900 1,027 79
2002 84,059 1,051 80
2003 84,430 1,068 79
2004 91,376 1,086 84
2005 98,254 1,103 89
2006 105,725 1,120 94
2007 114,590 1,136 101
Year Motorise
d two-wh
eeler
Three
wheele
rs
Cars Com
merci
al vehi
cles
Total
1997 2,885,004
(79)
216,72
9
396,
450
169,93
7
3,668,
120
2007 7,416,191
(78)
380,66
3
1,27
3,89
3
479,59
3
9,550,
340
Grow
th/
Year
(%)
10 6 12 11 10
© 2018 JETIR October 2018, Volume 5, Issue 10 www.jetir.org (ISSN-2349-5162)
JETIR1810743 Journal of Emerging Technologies and Innovative Research (JETIR) www.jetir.org 320
en (2 fatalities per 100,000 person) is curious because no of
children’s walk and use bicycle for travelling purpose.
Figure 1: Distribution in road traffic fatalities in 2007 by
age group and gender
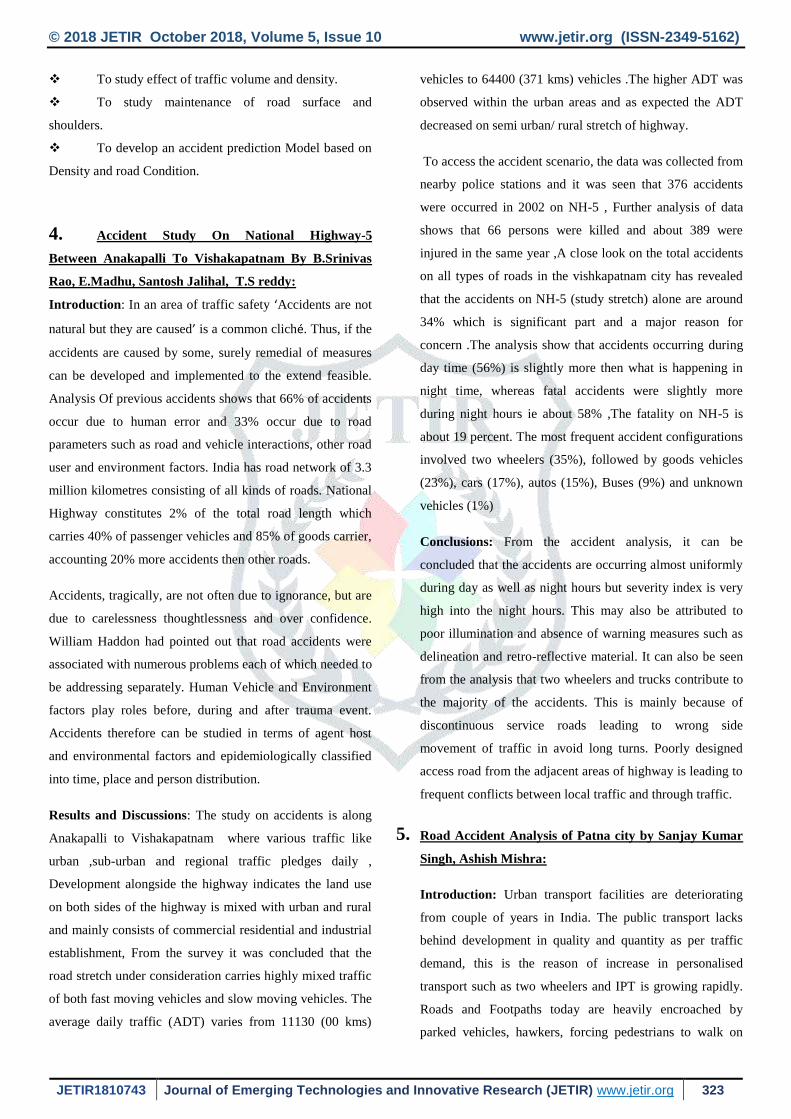
4. Time of Day:
Figure 2 gives the proportion of fatalities by time of day in 3
5 cities of India (population>1 million) and in the rest of the
country including rural roads. In the period 9:00 to 21:00 th
e proportions remain high and similar both in the large cities
and elsewhere. In the late night hours (21:00-24:00) traffic v
olumes are lesser then the peak day time rates, but fatality ra
tes do not reflect this. In early morning the traffic flow is mu
ch lower than in large cities, but relatively higher in the rest
of country .We can summarize that high rates in night coul
d be due to higher speeds, when traffic volume is higher /lo
wer and speed of driving is higher under the influence of Al
cohol .Alcohol comes from hospital study in Delhi where 29
% two wheeler drivers admitted they were drunk before cra
sh ,in Bangalore 29% admitted crash before driving in night
time ,and 35% checked were under the influence of alcohol i
n night time
Figure 2: Road traffic accidents (%) by time of day in 35
cities with more than 1 million population and those i
n rest of India.
5. Fatalities on Rural Highways:
The detailed data is not available for national and state level
s for crashes’ study collected on modal shares, vehicle speed
s, and traffic crashes on selected locations on national and st
ate highways around the country in late 1990’s Table 4 (ref t
o page 11).Table 4 shows the type of road user killed on hig
hways. The study reports that 65% trucks were part of fatal
crashes ,Other study reports say majority of crashes involve
buses ,and 25% victims were pedestrians, rear-end crashes c
omprised 40% of total crashes with increasing rate of 3.9%
per year .
Various types Of Accidents:
1) Road accident: An accident (collision, overturning or
slipping) which occurred or originated on a road open to
public traffic resulting in either injury or loss of life, or
damage to property, in which at least one moving vehicle
was involved.
2) Person killed: Any person who was killed outright on
the spot in the accident or whose death could be directly
traced to the injury received in accident.
3) Fatal accident: An accident where one or more person(s)
were killed.
4) Grievous injury accident: An accident in which
person(s) were grievously injured.
0
5000
10000
15000
20000
25000
30000
35000
40000
45000
0-14 15-29 30-44 45-59 >59
Nu
mb
er o
f fa
talit
ies
Age [Years]
Chart Title
MALE FEMALE
0
2
4
6
8
10
12
14
16
18
0-3 3 to6 6 to 9 9 to12
12 to15
15 to18
18 to21
21 to24
Million + cities Rest of India

© 2018 JETIR October 2018, Volume 5, Issue 10 www.jetir.org (ISSN-2349-5162)
JETIR1810743 Journal of Emerging Technologies and Innovative Research (JETIR) www.jetir.org 321
Types of Collision:
Figure 3: Types of collision
LITERATURE REVEIW:
1. Accident Data Analysis To Develop Target
Groups For Countermeasures, By Max Cameron,
Monash University Accident Research Centre:
Introduction: An important issue which emerged during
the development of the 1991 Road Safety Strategy for
Victoria was the need for new and better definitions of
target groups for countermeasures. Research to define new
targets has not kept up with the rapid implementation of
countermeasures. This Report describes a major project
which aimed to further develop methods of identifying
target groups, and to demonstrate those methods by
application to a number of key road safety problems.
The general objective was to rectify the road accident
problem using mass accident data to find groups of road
users, vehicles and road segments which would be suitable
targets for countermeasures.
Methods: Mass accident data needs to be analysed to find
target groups for countermeasures in a way which
maximizes the chances that the countermeasure will be cost
effective. The study has developed general principles for
analysis which meet this aim. These have led to four
specific methods of mass data analysis, depending on the
nature of the road trauma problem being addressed in the
search for countermeasure target groups, namely
High Risk Groups (groups with high rates of
accident involvement per opportunity to be involved)
High Severity Groups (groups with high rates of
severe injury per accident involvement)
Accident Involvement Clusters( Groups involved
in accidents who are homogenous on a number of factors
relevant to countermeasure design and as large as possible)
Severe Injury Clusters (groups associated with
severe injury who are homogenous on a number of factors
relevant to injury countermeasures design and as large as
possible).
2. Examining Determinants of accident/Injury
Rates: A Micro Level Study In Automobile Industry, by
Hendre Rajesh war Wamanrao:

© 2018 JETIR October 2018, Volume 5, Issue 10 www.jetir.org (ISSN-2349-5162)
JETIR1810743 Journal of Emerging Technologies and Innovative Research (JETIR) www.jetir.org 322
Introduction: This Research examines contribution of
determinants arrived from duties of various stakeholders and
literature review in predicting accidents/injuries. There has
been fundamental shift in safety management research
carried out in many countries and across diverse industries,
which aims to measure the impact of additional dimensions
on occupational safety. The traditional approach focuses of
the technical aspects of engineering system and processes.
Many researches in the safety management conclude that
80% accidents and injuries are attributed to unsafe human
factor and remaining 20% to the technological factors and
working conditions. National policy of Labour recommends
conducting the researches in the field of safety, health and
environment at workplace based on social and psychological
factors which will help in establishing standards.
Methodology: This study is conducted in 28 of five
automobile companies situated in and around Pimpri-
Chinchwad Industrial Area, Pune, and Maharashtra. Total
223 Supervisors ‘and 171 Managers’ options are taken on
the 5 point Likert scale to determine implementation level of
HR practices. Similarly Awareness level is derived using
responses of workers (1331 Nos. 6.5% of population) based
on questions relating to above mentioned variables. FSI is
calculated by combining three years FSI rates assigning
60%, 30% and 10% weight age to the most recent year. The
hypothesis of the study is stated below.
H1: The higher level of implementation of HR practices will
reduce accidents/injuries.
H2: Higher number of safety personal per 1000 employees
will reduce accident / injuries.
H3: Higher the derived Awareness Level lower will be
accidents/injuries.
H4: Accident/injury rate is negatively and significantly
associated with Number of operators working in a shop.
Suggestions: As higher level of HR practices, number of
safety personnel and higher awareness level are major
causes in reducing accident/injury rates, employers and top
management should maintain those at higher level. The
continuous improvement with the participation of operators
will reduce the accident/injury rates.
3. Accident Analysis and Modelling on NH-55
(India) by A.N Dehury, A.K. Patnaik, A.K Das,
U.Chattraj,P Bhuyan, M. Panada:
Introduction: A very important problem in our society is
Road Safety. Every Year almost 1.2 million people are
killed and between 20 to 50 million are injured in road
accidents. If current trends continue road traffic accidents
are predicted to be third leading contributor to the global
injury rate in 2020, India had earned the distinction of
having more number of fatalities due to road accidents in
the world. Road safety is emerging a major social concern
around the world especially in India.
Results and Discussions: The study area here is divided
into equal stretches each measuring 5km length, The
accident was collected and plotted in Ms Excel of last ten
years, The annual variation of all the accident stretches were
plotted and correlated with each other , Monthly variations
and hourly variations were plotted and showed that more
accidents occur during peak hour traffic from 8pm to 9pm
reason is Truck over speeding also drink and drive cases are
most there ,Marijuana is also one more factor of that which
increases reaction time and loss of control occurs,
Overloading of vehicles results in uncontrolled driving
resulting accidents, The vehicles involving in Fatalities are
mostly truck drivers that is 6 percent, followed by 20
percent unknown drivers, 7 percent by motor cycles, 5
percent by car and jeep, 3 percent by bus buses (consume
alcohol and drugs for long journey resulting increase in
reaction time and loss of control).
Causes of accidents:
Vehicle
Driver
Road Environment
Need and Objectives of Study:
To study annually monthly and hourly variation of
accidents
© 2018 JETIR October 2018, Volume 5, Issue 10 www.jetir.org (ISSN-2349-5162)
JETIR1810743 Journal of Emerging Technologies and Innovative Research (JETIR) www.jetir.org 323
To study effect of traffic volume and density.
To study maintenance of road surface and
shoulders.
To develop an accident prediction Model based on
Density and road Condition.
4. Accident Study On National Highway-5
Between Anakapalli To Vishakapatnam By B.Srinivas
Rao, E.Madhu, Santosh Jalihal, T.S reddy:
Introduction: In an area of traffic safety ‘Accidents are not
natural but they are caused’ is a common cliché. Thus, if the
accidents are caused by some, surely remedial of measures
can be developed and implemented to the extend feasible.
Analysis Of previous accidents shows that 66% of accidents
occur due to human error and 33% occur due to road
parameters such as road and vehicle interactions, other road
user and environment factors. India has road network of 3.3
million kilometres consisting of all kinds of roads. National
Highway constitutes 2% of the total road length which
carries 40% of passenger vehicles and 85% of goods carrier,
accounting 20% more accidents then other roads.
Accidents, tragically, are not often due to ignorance, but are
due to carelessness thoughtlessness and over confidence.
William Haddon had pointed out that road accidents were
associated with numerous problems each of which needed to
be addressing separately. Human Vehicle and Environment
factors play roles before, during and after trauma event.
Accidents therefore can be studied in terms of agent host
and environmental factors and epidemiologically classified
into time, place and person distribution.
Results and Discussions: The study on accidents is along
Anakapalli to Vishakapatnam where various traffic like
urban ,sub-urban and regional traffic pledges daily ,
Development alongside the highway indicates the land use
on both sides of the highway is mixed with urban and rural
and mainly consists of commercial residential and industrial
establishment, From the survey it was concluded that the
road stretch under consideration carries highly mixed traffic
of both fast moving vehicles and slow moving vehicles. The
average daily traffic (ADT) varies from 11130 (00 kms)
vehicles to 64400 (371 kms) vehicles .The higher ADT was
observed within the urban areas and as expected the ADT
decreased on semi urban/ rural stretch of highway.
To access the accident scenario, the data was collected from
nearby police stations and it was seen that 376 accidents
were occurred in 2002 on NH-5 , Further analysis of data
shows that 66 persons were killed and about 389 were
injured in the same year ,A close look on the total accidents
on all types of roads in the vishkapatnam city has revealed
that the accidents on NH-5 (study stretch) alone are around
34% which is significant part and a major reason for
concern .The analysis show that accidents occurring during
day time (56%) is slightly more then what is happening in
night time, whereas fatal accidents were slightly more
during night hours ie about 58% ,The fatality on NH-5 is
about 19 percent. The most frequent accident configurations
involved two wheelers (35%), followed by goods vehicles
(23%), cars (17%), autos (15%), Buses (9%) and unknown
vehicles (1%)
Conclusions: From the accident analysis, it can be
concluded that the accidents are occurring almost uniformly
during day as well as night hours but severity index is very
high into the night hours. This may also be attributed to
poor illumination and absence of warning measures such as
delineation and retro-reflective material. It can also be seen
from the analysis that two wheelers and trucks contribute to
the majority of the accidents. This is mainly because of
discontinuous service roads leading to wrong side
movement of traffic in avoid long turns. Poorly designed
access road from the adjacent areas of highway is leading to
frequent conflicts between local traffic and through traffic.
5. Road Accident Analysis of Patna city by Sanjay Kumar
Singh, Ashish Mishra:
Introduction: Urban transport facilities are deteriorating
from couple of years in India. The public transport lacks
behind development in quality and quantity as per traffic
demand, this is the reason of increase in personalised
transport such as two wheelers and IPT is growing rapidly.
Roads and Footpaths today are heavily encroached by
parked vehicles, hawkers, forcing pedestrians to walk on

© 2018 JETIR October 2018, Volume 5, Issue 10 www.jetir.org (ISSN-2349-5162)
JETIR1810743 Journal of Emerging Technologies and Innovative Research (JETIR) www.jetir.org 324
road resulting their life in risk of accident ,besides this the
roads of Indian cities are substandard ,lane marking and
traffic signs are usually missing, and intersections often
require geometric corrections.
As you would expect one of India’s poorest and densely
populated city Bihar’s capital Patna, is noisy, crowded,
polluted, and typically chaotic. The existing Road Network
in city is inadequate. Functionally the roads do not have and
hierarchy as individual road changes its characteristics after
a short distance. A t present around 4.6 percent of the total
development area is devoted to roads which are much below
the desired level; Moreover Vehicle population Growth is
quite high, with just 4384 registered vehicles in 1981 to
294164 in 2001, and increase around 67 fold in a time span
of two- decades. Further the lack of effective mass transport
system has given rise in tremendous increase in IPT Models
and Personalised Vehicles.
Results and Discussions : Many developing countries
including India have a serious road accident problem.
Fatality rates (defined as, road accident deaths per 10,000
vehicles) are quite high in comparison to developed
countries. The road accidents in India from 1991 to 1998
have increased at a rate of 4.4percent per annum while the
population of the country has increased by 1.92 percent per
year , The study reveals that trucks and buses are
responsible for highest number of accidental deaths,25.7 and
17 percent causalities happened due to trucks and buses,
respectively.
Discussing some Accident Issues of our country, let’s move
to Patna. The existing Circular pattern road is of linear type.
At present 4.6% of the total developed area is devoted to
roads which are much below the minimum requirement for a
city. From the year 1996 to 200, total number of accidents
has decreased from 281 to 241 mainly due to reduction in
non-fatal accidents. There were 202 non-fatal accidents
during 1996 which has gone down to 133 in 2000, a
reduction of around 34% has been observed, In a
quantitative terms , total number of fatal accidents has
increased by around 37% in the span of just four years, from
79 in 1996 to 108 in 2000. The accident severity index
shows that persons killed per 100 accidents have increased
over the years from 29 in 1996 to 45 in 2000; it seems to be
lack in quality medical facilities of city. The fatality rate of
Patna per 10,000 vehicles shows that there is increase on
3.59 in 1996 to 3.85 in 2000. Its noted fatality rate of Patna
is well below the fatality rate on India, because of density of
slow moving vehicles which reduces the average speed of
vehicles and severity of accident a well.
Conclusion : The problem of deaths and injuries as a result
of road accidents in Indian cities is serious enough to
demand attention of respective administrative authorities.
Apart from the humanitarian aspects of reducing road deaths
and injuries, a strong case can be made of reducing road
crash deaths and economic grounds alone. It is estimated
that the total economic loss due to road accidents is of the
order of Rs. 60 billion each year in India.
Patna is also suffering from the problem of deaths
and injuries on its roads. The total number of fatal accidents
as well as related fatality in the city is increasing over the
years. Persons killed per 100 accidents are alarmingly high
as 45 during the year 2000. Although fatality rate is low in
Patna, fatality risks are higher than Indian average.
Pedestrian deaths as a percentage of all road fatalities are
extremely high in the city. During the recent years, they
constitute more than 90% of all road fatalities.

© 2018 JETIR October 2018, Volume 5, Issue 10 www.jetir.org (ISSN-2349-5162)
JETIR1810743 Journal of Emerging Technologies and Innovative Research (JETIR) www.jetir.org 325
Analysis of Accident Data:
i. Accident Rate per Kilometre: On this basis the total accident
hazard is expressed as the number of accidents of all types p
er km of each highway and street classification.
R = A/L
Where,
R = total accident rate per km for one year
A = total number of accident occurring in one year
L = length of control section in kms only)
ii. Accident involvement Rate: It is expressed as numbers of dr
ivers of vehicles with certain characteristics who were invol
ved in accidents per 100 million vehicle-kms of travel
R = N x 100,000,000 /V
Where,
R = accident involvement per 100 million vehicle-kms
N = total number of drivers of vehicles involved in accident
s during the
Period of investigation
V = vehicle-kms of travel on road section during the period
of investigation
iii. Death rate based on population: The traffic hazard to life in
a community is expressed as the number of traffic fatalities
per 100,000 populations. This rate reflects the accident expo
sure for entire area.
R = B x 100,000 / P
Where,
R = death rate per 100,000 population
B = total number of traffic death in one year
P = Population of area
iv. Death rate based on registration: The traffic hazard to life in
a community can also be expressed as the number of traffic
fatalities per 10,000 vehicles registered. This rate reflects th
e accident exposure for entire area and is similar to death rat
e based on population.
R = B x 10,000 / M
Where,
R = death rate per 10,000 vehicles registered
B = total number of traffic death in one year
M = Number of motor vehicles registered in the area
Causes of Road Accidents:
Road Users: Excessive speed and rash driving, violation of
traffic rules, failure to perceive traffic situation or sign or sig
nal in adequate time, carelessness, fatigue, alcohol, sleep etc
.
Vehicle: Defects such as failure of brakes, steering system, t
yre burst, lighting system.
Road Condition: Skidding road surface, pot holes, ruts.
Road design: Defective geometric design like inadequate si
ght distance, inadequate width of shoulders, improper curve
design, improper traffic control devices and improper lightin
g,.
Environmental factors: Unfavourable weather conditions l
ike mist, snow, smoke and heavy rainfall which restrict nor
mal visibility and makes driving unsafe.
Other causes: Improper location of advertisement boards, g
ate of level crossing not closed when required etc.
METHODOLOGY:
1.1. ROAD AND ITS EFFECTS ON ACCIDENTS
I. I . Pavement Surface:
Accidents are most common in this time of era due to rapid
increase of traffic and the carriageways are not indeed meet
the demands of this heavy traffic, Keeping the view of all
aspects, The study of Accidents are carried out on the
Stretch from (Pantha Chowk to Singhpora Pattan on NH1A), further
starting our work we are going to first focus on the
Pavement and study the defects and testing the material
Used in this pavement, Following below mentioned defects
were found and analysed ,further the Results and
Discussions were done on this for future better of road.
a) Alligator Cracking or Fatigue Cracking
b) Block Cracking
c) Hungry Surface
d) Formation of Corrugations
e) Depressions
f) Fatty surface or Bleeding
g) Formation of Potholes
h) Loss of Aggregates
i) Stripping
j) Reflection Cracking
k) Ravelling
l) Frost Heaving

© 2018 JETIR October 2018, Volume 5, Issue 10 www.jetir.org (ISSN-2349-5162)
JETIR1810743 Journal of Emerging Technologies and Innovative Research (JETIR) www.jetir.org 326
m) Longitudinal Cracking
RESULTS AND DICSCUSSION
1 Aggregate Crushing Value Test:
Total weight of the sample (A) taken= 4.1kg
Weight of the sample (B) passing through 2.36 mm sieve
after application of load=0.50kg
The Aggregate Crushing Value =B/A × 100
=0.50/4.1 × 100
=0.12
DISCUSSION
BIS and IRC have certified that the crushing value of
aggregates to be used in cement concrete pavement should
not exceed 30%. The standard size aggregates to be used
crushing strength test is the fraction passing through 12.5
mm sieve and retained on 10 mm sieve. When aggregates
having size larger than 12.5 mm are used, it will give higher
crushing strength value and use of aggregates having size
less than 10 mm will give low aggregate crushing value.
2 Penetration Test:
The difference between initial and final penetration reading
is taken as penetration value. The mean value of not less
than three consistent penetration measures is reported as
penetration value.
Bitumen S
ample
Initial Rea
ding
Final Rea
ding
Penetratio
n (mm)
Test 1 210 272 62
Test 2 272 340 68
Test 3 340 404 64
Mean 65
DISCUSSION
It is concluded that penetration value is influenced by
various factors such as:
Temperature at which sample is poured
Size of the penetration needle
Weight to be placed on the needle
Temperature at which test is to be performed
Period of cooling the sample
If the temperature at which test is being performed is higher
than 25*C, the penetration value obtained will be much
higher. If the weight of needle assembly is higher than the
specified value of 100g, then the penetration value so
obtained will be higher. Higher pouring temperature may
cause hardening of bitumen and lead to lower penetration
value. The duration of releasing penetration needle should
be equal to 5 seconds.
2. Los Angles Abrasion Test:
Weight of aggregate sample taken (W1) = 2.5kg
Weight of aggregate sample retained (W2) = 1.60kg
Weight of aggregates passing through 1.70 mm IS sieve
=W1-W2
=0.9kg
Los Angeles Abrasion Value = (W1-W2)/W1 × 100
=0.9/2.5 × 100
=36%
DISCUSSION
The aggregates needed to be used in surface course of
WBM roads should have maximum 40% Los Angeles
Abrasion value. This test is used to identify the quality of
aggregates to be used in construction of a particular
pavement. It is a suitable test to check the hardness of
aggregates. This is the test where resistance to abrasive
action and impact can be determined simultaneously, due to
presence of abrasive charge.
3. Usual Causes Of Pavement Failure:
Defective materials used in construction of pavement
Poor quality control and in-appropriate method of
construction

© 2018 JETIR October 2018, Volume 5, Issue 10 www.jetir.org (ISSN-2349-5162)
JETIR1810743 Journal of Emerging Technologies and Innovative Research (JETIR) www.jetir.org 327
Stagnation of water in subgrade due to inadequate drainage
conditions
Rapid increase of traffic volume in excess of design
capacity
Settlement of foundation of the embankment of the fill
material
Environmental factors including heavy rainfall, soil erosion,
high ground water table, frost action etc
Future Scope and Recommendation:
A distressed pavement requires maintenance when failures
are severe. Maintenance measures constitute fresh material
installation over the pavement to rectify the existing
problem. When a pavement is properly designed keeping in
consideration future distresses that may occur due to various
reasons, the life cycle cost of pavement reduces and it
behaves well during its service life, The wear tear of the
vehicles will be decreased which results in safe vehicle
movement and the pavement surface will be so good that
uneven pot holes ,longitudinal cracks and many more
defects results in sudden braking application , tilting of
speedy vehicles, causing mishaps on roads and results in
Fatal and Non- Fatal Accidents.
Possible surface maintenance measures for some pavement
failures are as under:
Block cracking: Application of new bituminous coat
Corrugation : Scarification of elevated part by use of
mechanical blades and rolling
Depression : To apply profile corrective course
Hungry surface : Application of slurry seal or fog seal
Loss of aggregates : Application of seal coat, surface
dressing or fog coat
Pot hole : Patching or partial re-construction when pot holes
are severe
Rutting : Milling of protruded portion and profile corrective
course laying
Stripping : Replace the affected part with new one i.e. fresh
mix
II. Sight Distance:
The safe and efficient of vehicles on roads depends, among
other factor on the road length on which an obstruction, if
any, becomes visible to driver in the direction of travel. In
other words feasibility to see ahead or the visibility is very
important for safe vehicle operation on highway.
Sight distance required by drivers applies to both geometric
design of highways and fro traffic control.
Three sight distance situations are considered in design:
a) Stopping or absolute minimum sight distance.
b) Safe overtaking and passing sight distance.
c) Safe sight distance for entering into uncontrolled
intersections.
The standards should satisfy the following three
conditions:
i. Driver travelling in the design speed has sufficient sight
distance or length of road visible ahead to stop a vehicle, in
case of any obstruction on the road ahead without any
collision.
ii. Driver travelling at the design speed should be able to safely
overtake, at reasonable intervals, the slower vehicles
without causing obstructions or hazard to traffic of opposite
side.
Driver entering an uncontrolled intersection has sufficient
visibility to enable him to take control of his vehicle and to
avoid collision with another vehicle.
The sight distance on road to a driver depends at any
instance depends upon:
1. Features of the road ahead
2. Height of drivers eye above the road surface
3. Height of the object above the road surface.
The distance within which a motor vehicle can be
stopped depends upon the factors listed below:
1. Total reaction time of driver
2. Speed of Vehicle
3. Efficiency of brakes
4. Frictional resistance between the rod and the tyres and
5. Gradient of the road ,if any
© 2018 JETIR October 2018, Volume 5, Issue 10 www.jetir.org (ISSN-2349-5162)
JETIR1810743 Journal of Emerging Technologies and Innovative Research (JETIR) www.jetir.org 328
III. Vertical Alignment:
The vertical Alignment should be designed with a provision
of suitable shock-proof vertical curves. The vertical curves
should be made to blend homogenously with the horizontal
curves. It is good practice to make a vertical curve to be
fully contained with the horizontal curve.
Since my case study is between Pantha Chowk to
Singhpora Pattan there are no such curves where the
alignment needs to be at its perfection , But the curves
which are there are perfectly aligned and there is no
accidents because of this very cause, So this case of study
can be neglected for the cause of accidents on this stretch .
IV .Superelevtion:
In order to counteract the effect of centrifugal force and to
reduce the tendency of the vehicle to overturn or skid, the
outer edge is raised with respect to the inner edge, thus
providing a transverse slope throughout the length of
horizontal curve. For a Vehicle to negotiate any curve at the
desired speed, the road should have adequate
superelevation. Deficiency in super elevation can cause
serious effects.
The road from Pantha Chowk to Singhpora Pattan is
plain terrain with no long curves ,Therefor superelevation
can be neglected here for a cause of accidents, But at some
places the superelevation is give ,like near HMT Shaltang
there is a superelevation ,but the design of that
superelevation is totally satisfactory as per the information
given by SOMA authorities for design speed of 90 kmph for
Cars and 60 kmph heavy duty vehicles , So there is no
concern of superelevation on this stretch of NH1A for
cause of accidents .
V. Narrow Bridges and Culverts:
Narrow Bridges and culverts can cause serious accidents,
especially when the roadway is wide. Widening of such
narrow structure should be undertaken if accidents are
frequently caused at the location. Posting proper warning
signs can also save ugly accidents
Since we are discussing about the narrow bridges and
culverts ,Yes this is the cause of accident on this Stretch ,
there are many culverts on this highway where no warning
signs are provided for information ,there is a narrow bridge
after crossing HMT where most of the accidents happens
,But thankfully government is working on that right now ,its
is prone accident area, So I suggest that the culverts or we
can say under passes should be provided with warning signs
,So that coming vehicles can reduce their speed ,further
collisions can be minimized.
1.2. VEHICLE AND ITS EFFECT ON ACCIDENTS
I. I. Braking System:
Brakes are needed to bring the vehicles to stop whenever a
driver comprehends immediate danger. A good braking
system should achieve the objective without resulting in the
driver’s loss of directional control of the vehicle. The
interaction between the tyre and the road surface governs
largely the ultimate braking performance of vehicles,
although factors such as the braking system itself are
significant. A detailed treatment of the subject of the
interaction between the tyre and the road surface is given
under section of Skidding.
II. II. Vehicle Lighting System:
The lighting system of vehicles consist of headlights,
(driving main beam or a dipper beam), side lamps, parking
lights, rear lights, direction indicators and stop lamps. An
efficient and reliable system of lighting the vehicle is
desirable for averting accidents.
The headlights should perform two functions: to provide a
main beam for enabling the driver to see the road ahead for
sufficiently long distance and to provide a dipper beam
which must avoid glare to the opposing traffic, while at the
same time providing sufficient visibility to the driver. Glare
is a serious problem when two vehicles approach each other
and can blind the drivers vision. It should be avoided by
© 2018 JETIR October 2018, Volume 5, Issue 10 www.jetir.org (ISSN-2349-5162)
JETIR1810743 Journal of Emerging Technologies and Innovative Research (JETIR) www.jetir.org 329
properly designing the dipper beam. Polarized headlights
offer interesting break- through in this regard.
Rear lamps give indication to the driver flowing a vehicle
about the presence of a vehicle in front him. There efficient
design and functioning can avert front to rear collisions
Direction indicators give adequate notice of the intensions
of the driver to turn or to stop. The usual type of direction
indicators are the flashing type. The position, type and color
of the indicators should be such as to visible to the flowing
drivers easily. The direction indicators are usually amber in
color, and preferably they should be mounted at the side of
the vehicle approximately at the level of the driver’s eye.
Semaphore arms may not be fully suitable to large vehicles,
and in such cases extra amber lights may be installed at the
rear.
III. Vehicle Body and its features:
In the design of motor vehicles for safe driving, an aspect
which has been receiving increasing attention is the features
and dimensions of the vehicle body. Extensive work has
been done in regard by Howards school of public health.
Factors that need to be considered are:
a) The shape of the dimensions of the driver’s seat.
b) Arrangement of dials on the dashboard.
c) Positioning of controls in relation to the driver’s seat.
d) Visibility of the driver from the seat.
e) Noise levels in the vehicle.
f) Concentration of carbon monoxide inside the vehicle.
IV. Tyres:
Tyres are an important aspect of vehicle design from the
point of view of safety. The performance of tyres relative to
puncture, blow outs, vulnerability, to damage by sharp
objects, braking and road surface characteristics are areas
where considerable research has taken place. Skidding is a
phenomenon which is governed by interaction of the tyre,
brakes, road surface, speed and the wetness of road surface.
Because of its extreme importance in traffic accident
prevention, thus aspect is treated in greater deal elsewhere.
V. Vehicle Inspection and Maintenance:
Frequent Inspection of vehicles and testing them is an
important requirement. Such periodic tests identify the mall
functioning of the important parts and facilitate easy
maintenance. This assumes added significance in India
where old vehicles are used to there maximum and their life
is made to stretch to the last. Most important items that need
periodic inspection are the brakes, lightening system and
Steering Mechanism. Additional features that could form
part of routine inspection could be the tyres, Suspension
system and the windscreen. Legislative enforcement of an
effective inspection system will be yield good results in
safely. Some countries have made compulsory for testing
the vehicle periodically, U.K being one of them. Some
states in USA has also provision for compulsory periodic
testing. The Motor Vehicles Act in INDIA contains
provision for the states to enact rules to require [periodical
testing and inspection of vehicles.
1.3. DRIVER AND ITS EFFECT ON ACCIDENTS
I. I. Driver:
The driver is the key factor in most of the accidents. He is
the human element in charge of the machine. He drives it,
steers it, accelerate it, decelerate it, brakes it and stop it. As
such a study of drivers behavior offer a very deep insight in
the cause of accidents and provides a valuable guidance for
avoidance of accidents.
II.
II. Driver judgment, Skill and Emotional Behavior:
When a driver perceives a danger, he immediately reacts to
it. The time it takes to comprehend the danger depends upon
his individual mental makeup and is called perception time.
Once the information is fed to him, Sometime must elapse
before he can react to the stimulus. This time is called its
reaction, the perception time and reaction time vary from
driver to driver.
III. Age of Drivers:

© 2018 JETIR October 2018, Volume 5, Issue 10 www.jetir.org (ISSN-2349-5162)
JETIR1810743 Journal of Emerging Technologies and Innovative Research (JETIR) www.jetir.org 330
It is generally Observed that young drivers cause more
accidents than that would be caused by mature diverse with
considerable driving experience. Similarly, Old drivers also
seem to cause more accident than middle aged driver. The
minimum accident are caused by middle aged group, say
40-50 years, while inexperience is cause of higher accident
rates amongst the younger age group, physical illness leads
to higher accident amongst to old age group.
IV. Sex of the Drivers:
It is generally seen that males have more accident and
conviction than females, but when miles driven are taken
into account this difference essentially disappears.
V. Marital Status:
Generally speaking, married persons (both male and female)
have been observed to be better drivers.
VI. Alcohol and Drugs and the Drivers:
A subject of research on road safety that has received a large
measure of attention and rightly so is the effect of alcohol
and drugs on the driving capability. The judgment and scale
of the driver can be exercised only so long as he is sensory
faculties are functioning unimpaired. Alcohol and drugs are
known to be positively dangerous in this respect.
Blood Alcohol Concentration and Accident Risk
Blood Alcohol concentrat
ion
Accident Risk
0-20 mg/100 ml In some subjects there is d
eterioration in the special
skills resembling driving.
20-40 mg/100 ml Progressive deterioration i
n a special skill is noticed.
40-50 mg/100 ml Significant increase in acc
ident involvement is notic
ed as the blood alcohol lev
el approaches and passes
50 mg/100 ml.
50-80 mg/ 100 ml Overall accident risk incre
ases rapidly. At a concentr
ation of 80 mg/ 100 ml, Al
cohol emerges as the domi
nant factor in accident.
Greater than 80 mg/ 100
ml
The accident probability o
f drivers at a blood alcoho
l concentration of 100 mg/
100 ml is 6 or 7 times that
of drivers with less than 1
0 mg/ 100 ml
Uses of Accident Data:
Engineering Uses:
Determining the adequacy, size, shape and visibility.
In determining justification for traffic control device
Planning pedestrian and safety features.
Determining speed zoning and speed control.
Precaution regarding parking
Safe and efficient lighting
Redesigning intersection
Improving horizontal and vertical alignment
Deficiency of rite of way.
Enforcement uses:
Directing enforcement effort
Controlling pedestrian behavior
Safe and efficient operation of traffic control device
Enforcing vehicle inspection measure
Parking regulation
Administrative and policy issue:
Initiating and administering traffic safety program
Evaluating the success of traffic safety program.
Determining accident cost.
Amending the legislative measure.
Educational Uses:
Planning and organizing school safety school educational
program.
© 2018 JETIR October 2018, Volume 5, Issue 10 www.jetir.org (ISSN-2349-5162)
JETIR1810743 Journal of Emerging Technologies and Innovative Research (JETIR) www.jetir.org 331
Planning and organizing driver safety education al program.
Uses for motor vehicle administrator:
Reviewing the procedures for licensing driver.
Reviewing the procedures for registration and licensing of
vehicles.
Requirement of Accident Data:
If the accident records are to be used, they should
be accurate, comprehensive.
Accident must be reported on a standard form so
that uniform procedure is followed.
The term describing accident must be accurately
defined
The facility of being analyzed by a computer, the
data should be coded properly.
REFRENCES
1. Dr. L.R. Kadyali, “Principles & practices of
Highway Engineering”, Khanna Publishers
Delhi-6,sixth Edition, pp. 100-166
2. Dr S.K.Khanna,Dr C.E.G Justo,Dr. A. Veeraragavan
“Highway Engineering” ,Nem Chand & Bros.,
Roorkee 247 667,India.
3. www.morth.nic.in
4. www.irc.nic.in
5. www.en.wikipedia.org/wiki/Accident_blackspot
www.civil.iitb.ac.in/tvm/1111_nptel/582_Accident/plain/pla
in.html
6. Accident Data Analysis To Develop Target Groups For
Countermeasures, By Max Cameron, Monash University
Accident Research Centre:
7. Examining Determinants of accident/Injury Rates: A
Micro Level Study In Automobile Industry, by Hendre
Rajesh war Wamanrao:
8. Accident Analysis and Modelling on NH-55 (India) by
A.N Dehury, A.K. Patnaik, A.K Das, U.Chattraj,P Bhuyan,
M. Panada:
9 .Accident Study On National Highway-5 Between
Anakapalli To Vishakapatnam By B.Srinivas Rao,
E.Madhu, Santosh Jalihal, T.S reddy:
10 .Road Accident Analysis of Patna city by Sanjay Kumar
Singh, Ashish Mishra: