microbial metabolism ch 5 metabolism is the sum of the chemical reactions in an organism. catabolism...
TRANSCRIPT

Microbial MetabolismCh 5
• Metabolism is the sum of the chemical reactions in an organism.
• Catabolism is the energy-releasing processes.
• Anabolism is the energy-using processes. (typically building something)

• Catabolism provides the building blocks and energy for anabolism.
Microbial Metabolism
Figure 5.1

• Are metabolic pathways that have both catabolic and anabolic functions.– This is basically all of life
Amphibolic pathways
Figure 5.32.1

Amphibolic pathways
Figure 5.32.2

• A metabolic pathway is a sequence of enzymatically catalyzed chemical reactions in a cell.
• A primary metabolic pathway are the reactions that do the basic work of the cell. Get food and grow
• Metabolic pathways are determined by enzymes.
• Enzymes are encoded by genes.
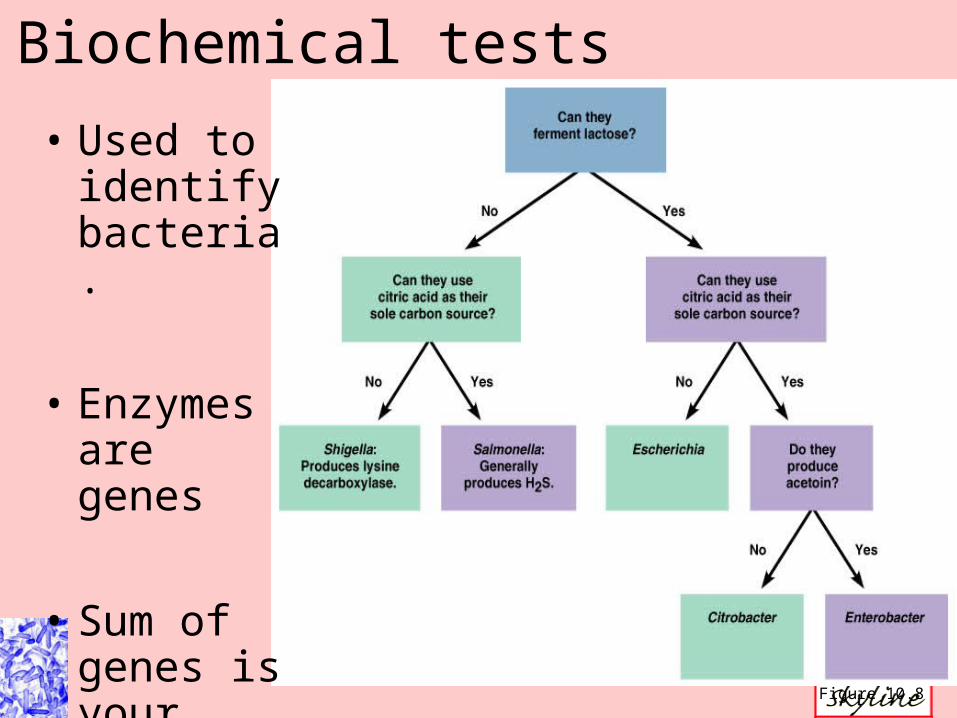
Biochemical tests
Figure 10.8
• Used to identify bacteria.
• Enzymes are genes
• Sum of genes is your organism

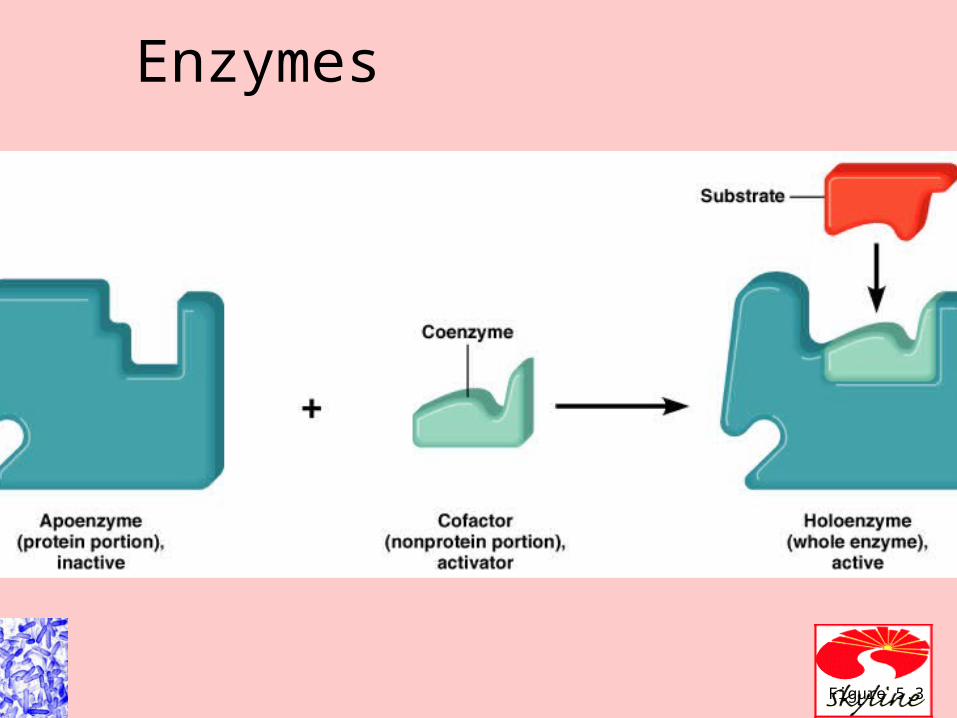
Enzymes
Figure 5.2

• Biological catalysts– Specific for a chemical reaction; not used up in
that reaction
• Apoenzyme: protein
• Cofactor: Nonprotein component– Coenzyme: Organic cofactor
• Holoenzyme: Apoenzyme + cofactor
Enzymes
Enzymes
Figure 5.3

• NAD+
• NADP+
• FAD
• Coenzyme A
• Biotin
• Folic acid
• Many of the vitamins
Important Coenzymes

• The turnover number is generally 1-10,000 molecules per second.
Enzymes
Figure 5.4

• Enzymes can be denatured by temperature and pH
Factors Influencing Enzyme Activity
Figure 5.6

• Temperature
Factors Influencing Enzyme Activity
Figure 5.5a

• pH
Factors Influencing Enzyme Activity
Figure 5.5b

• Substrate concentration
Factors Influencing Enzyme Activity
Figure 5.5c

• Competitive inhibition
Factors Influencing Enzyme Activity
Figure 5.7a, b

Factors Influencing Enzyme Activity
Sulfa inhibits the enzyme that uses PABA for synthesis of folic acid

• Noncompetitive inhibition
Factors Influencing Enzyme Activity
Figure 5.7a, c

• Feedback inhibition
Figure 5.8

• ATP is generated by the phosphorylation of ADP.
The Generation of ATP

• Substrate-level phosphorylation is the transfer of a high-energy PO4
- to ADP.
The Generation of ATP

• Energy released from the transfer of electrons (oxidation) of one compound to another (reduction) is used to generate ATP by chemiosmosis.
The Generation of ATP

Metabolic Pathways

• The breakdown of carbohydrates to release energy– Glycolysis– Krebs cycle– Electron transport chain
Carbohydrate Catabolism

• The oxidation of glucose to pyruvic acid, produces ATP and NADH.
Glycolysis

• 2 ATPs are used
• Glucose is split to form 2 Glyceraldehyde-3-phosphate
Preparatory Stage
Figure 5.12.1
PreparatoryStage
Glucose
Glucose6-phosphate
Fructose6-phosphate
Fructose1,6-diphosphate
Dihydroxyacetonephosphate (DHAP)
Glyceraldehyde3-phosphate(GP)
1
2
3
4
5

• 2 Glucose-3-phosphate oxidized to 2 Pyruvic acid
• 4 ATP produced
• 2 NADH produced
Energy-Conserving Stage
Figure 5.12.2
1,3-diphosphoglyceric acid
3-phosphoglyceric acid
2-phosphoglyceric acid
Phosphoenolpyruvic acid(PEP)
6
7
8
9
10
Pyruvic acid

• Glucose + 2 ATP + 2 ADP + 2 PO4– + 2
NAD+ 2 pyruvic acid + 4 ATP + 2 NADH + 2H+
Glycolysis

• Pentose phosphate pathway:– Uses pentoses and NADPH– Operates with glycolysis– Use and production of 5 carbon sugars (na)– Bacillus subtilis, E. coli, Enterococcus faecalis
• Entner-Doudoroff pathway: – Produces NADPH and ATP– Does not involve glycolysis– Pseudomonas, Rhizobium, Agrobacterium
Alternatives to Glycolysis

• Oxidation of molecules liberates electrons for an electron transport chain
• ATP generated by oxidative phosphorylation
Cellular Respiration

• Pyruvic acid (from glycolysis) is oxidized and decarboyxlated
Intermediate Step
Figure 5.13.1

• Oxidation of acetyl CoA produces NADH and FADH2
Krebs Cycle

Krebs Cycle
Figure 5.13.2

• A series of carrier molecules that are, in turn, oxidized and reduced as electrons are passed down the chain.
• Energy released can be used to produce ATP by chemiosmosis.
The Electron Transport Chain

Chemiosmosis
Figure 5.15

Electron transport and Chemiosmosis
Figure 5.16.2

Figure 5.14

• Aerobic respiration: The final electron acceptor in the electron transport chain is molecular oxygen (O2).
• Anaerobic respiration: The final electron acceptor in the electron transport chain is not O2. Yields less energy than aerobic respiration because only part of the Krebs cycles operations under anaerobic conditions.
Respiration

Anaerobic respiration
Electron acceptor Products
NO3– NO2
–, N2 + H2O
SO4– H2S + H2O
CO32 – CH4 + H2O

• Energy produced from complete oxidation of 1 glucose using aerobic respiration
Pathway ATP produced
NADH produce
d
FADH2 produce
d
Glycolysis 2 2 0
Intermediate step 0 2
Krebs cycle 2 6 2
Total 4 10 2

• ATP produced from complete oxidation of 1 glucose using aerobic respiration
• 36 ATPs are produced in eukaryotes.
Pathway
By substrate-level
phosphorylation
By oxidative phosphorylation
From NADH
From FADH
Glycolysis 2 6 0Intermediate step 0 6
Krebs cycle 2 18 4Total 4 30 4
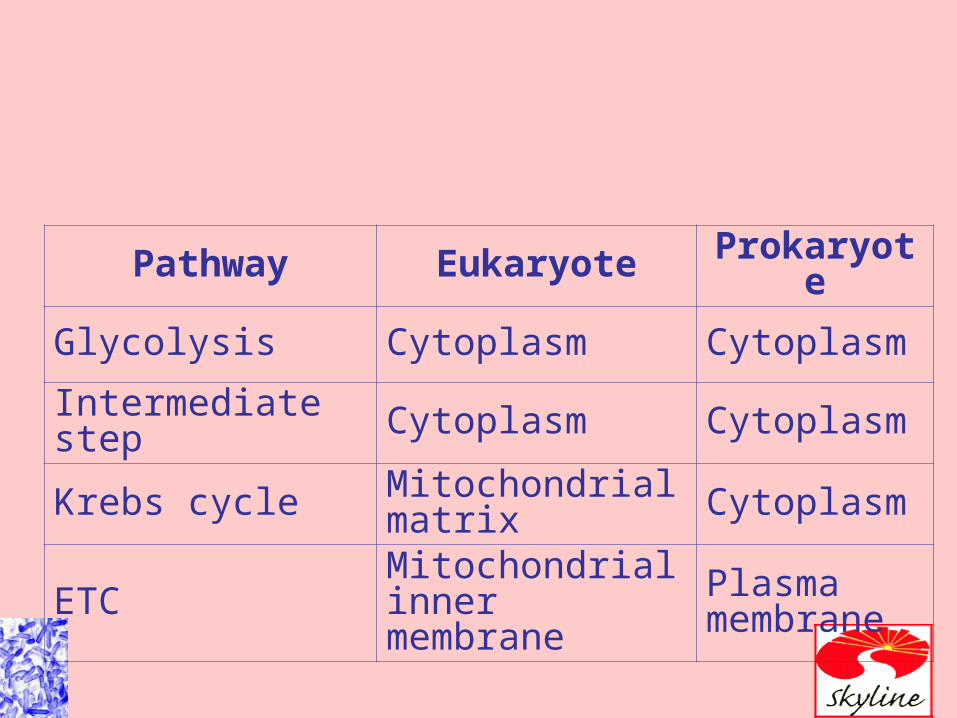
Pathway Eukaryote Prokaryote
Glycolysis Cytoplasm Cytoplasm
Intermediate step Cytoplasm Cytoplasm
Krebs cycle Mitochondrial matrix Cytoplasm
ETC Mitochondrial inner membrane
Plasma membrane

• Releases energy from oxidation of organic molecules
• Does not require oxygen
• Does not use the Krebs cycle or ETC
• Uses an organic molecule as the final electron acceptor
Fermentation

Fermentation
Figure 5.18b

• Alcohol fermentation. Produces ethyl alcohol + CO2
• Lactic acid fermentation. Produces lactic acid.– Homolactic fermentation. Produces lactic acid
only.– Heterolactic fermentation. Produces lactic
acid and other compounds.
Fermentation

Fermentation
Figure 5.19

Fermentation
Figure 5.23
Production of acid and gas

Lipid Catabolism
Figure 5.20

Protein Catabolism
Protein Amino acidsExtracellular proteases
Krebs cycleDeamination, decarboxylation, dehydrogenation
Organic acid

Biochemical tests
Figure 10.8
• Used to identify bacteria.

• Halobacterium uses bacteriorhodopsin, not chlorophyll, to generate electrons for a chemiosmotic proton pump.

Chemotrophs• Use energy from chemicals.
– Chemoheterotroph
• Energy is used in anabolism.
Glucose
Pyruvic acid
NAD+
NADH
ETC
ADP + P ATP

Chemotrophs• Use energy from chemicals.
– Chemoautotroph, Thiobacillus ferroxidans
• Energy used in the Calvin-Benson cycle to fix CO2.
2Fe2+
2Fe3+
NAD+
NADH
ETC
ADP + P ATP
2 H+

Metabolic Diversity Among Organisms
Nutritional type Energy source
Carbon source Example
Photoautotroph Light CO2Oxygenic: Cyanobacteria plants.Anoxygenic: Green, purple bacteria.
Photoheterotroph Light Organic compounds
Green, purple nonsulfur bacteria.
Chemoautotroph Chemical CO Iron-oxidizing bacteria.
Chemoheterotroph Chemical Organic compounds
Fermentative bacteria.Animals, protozoa, fungi, bacteria.
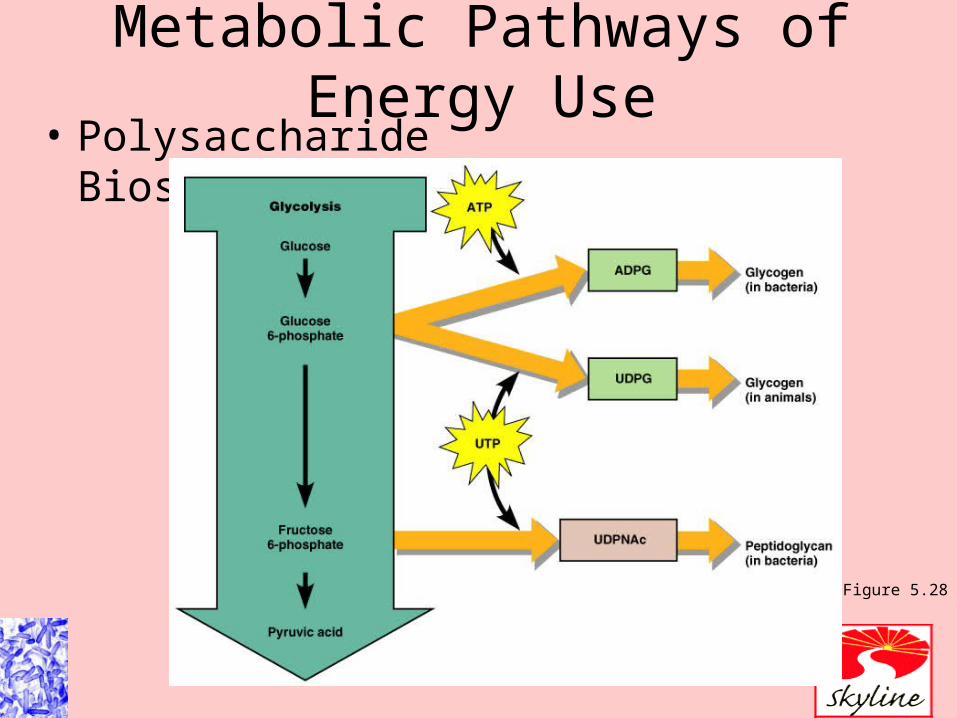
• Polysaccharide Biosynthesis
Metabolic Pathways of Energy Use
Figure 5.28
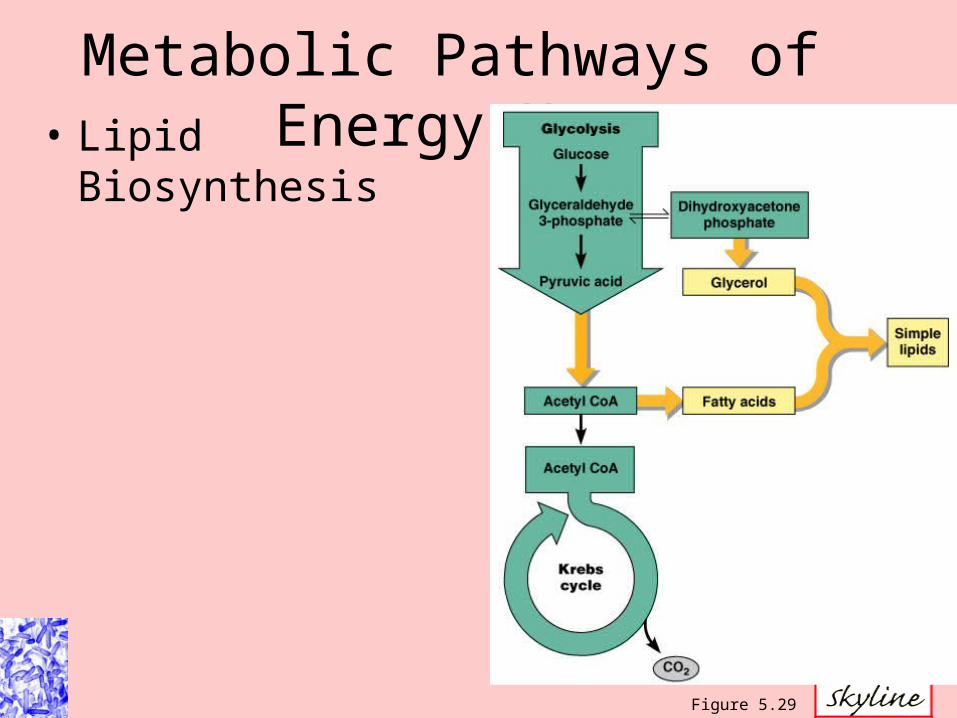
• Lipid Biosynthesis
Metabolic Pathways of Energy Use
Figure 5.29

• Amino Acid and Protein Biosynthesis
Metabolic Pathways of Energy Use
Figure 5.30a

Metabolic Pathways of Energy Use
Figure 5.30b
•Amino Acid and Protein Biosynthesis

• Purine and Pyrimidine Biosynthesis
Metabolic Pathways of Energy Use
Figure 5.31

• Are metabolic pathways that have both catabolic and anabolic functions.
Amphibolic pathways
Figure 5.32.1

Amphibolic pathways
Figure 5.32.2