microfluidic methods to study emulsion formation
TRANSCRIPT

Propositions
1. Convective mass transfer in microfluidic devices is essential to predict phenomena occurring during large scale emulsification. (this thesis)
2. To control emulsification processes, droplet formation and coalescence need to be decoupled. (this thesis)
3. High speed movies need to be accompanied by frame rates, as microscopic pictures are by scale bars.
4. The effect of food hypes is hyped.
5. Referenda obstruct democracy.
6. In the public debate opinions beat facts.
Propositions belonging to the thesis, entitled
‘Microfluidic methods to study emulsion formation’
Kelly Muijlwijk Wageningen, 1 June 2017

Microfluidic methods to study
emulsion formation
Kelly Muijlwijk

Thesis committee
Promotor
Prof. Dr C.G.P.H. Schroën
Personal chair at the Laboratory of Food Process Engineering
Wageningen University & Research
Co-promotor
Dr C.C. Berton-Carabin
Assistant professor, Laboratory of Food Process Engineering
Wageningen University & Research
Other members
Prof. Dr J. van der Gucht, Wageningen University & Research
Dr K. Loubière, Laboratoire de Génie Chimique de Toulouse, France
Prof. Dr M. Rayner, Lund University, Sweden
Dr R. Miller, Max Planck Institute of Colloids and Interfaces, Potsdam, Germany
This research was conducted under the auspices of the Graduate School VLAG (Advanced studies in Food Technology, Agrobiotechnology, Nutrition and Health Sciences)

Microfluidic methods to study emulsion formation
Kelly Muijlwijk
Thesis
submitted in fulfilment of the requirements for the degree of doctor
at Wageningen University
by the authority of the Rector Magnificus,
Prof. Dr A.P.J. Mol,
in the presence of the
Thesis Committee appointed by the Academic Board
to be defended in public
on Thursday 1 June 2017
at 11 a.m. in the Aula.

Kelly Muijlwijk
Microfluidic methods to study emulsion formation,
170 pages.
PhD thesis, Wageningen University, Wageningen, the Netherlands (2017)
With references, with summaries in Dutch and English
ISBN: 978-94-6343-071-5
DOI: 10.18174/403476

Contents 1. Introduction and thesis outline 7
2. Cross-flow microfluidic emulsification from a food perspective 21
3. Interfacial tension measured at high expansion rates and within milliseconds
using microfluidics
55
4. Convective mass transport dominates surfactant adsorption in a microfluidic
Y-junction
77
5. Dynamic fluid interface formation in microfluidics: effect of emulsifier
structure and oil viscosity
91
6. Coalescence of protein-stabilised emulsions studied with microfluidics 107
7. General discussion 127
References 139
Summary/Samenvatting 155
Dankwoord 163
About the author 165
Publications 167
Training activities 169


1 1. Introduction and thesis outline

Chapter 1
8
1.1. Emulsions Emulsions consist of two immiscible liquids of which one is dispersed in the other as
droplets, for example oil-in-water or water-in-oil. Emulsions find their application in many
industrial products from the fields of food, personal care, agrochemicals, pharmaceuticals,
paint, and natural oil (Tadros 2005). In food, emulsions are naturally present (e.g., raw
milk), or they are purposely manufactured (e.g., cream liqueurs, yoghurt, cheese, and ice-
cream) to structure products by interactions between emulsion droplets and/or with other
ingredients (Friberg & Larsson 2004).
Various phenomena may lead to the physical destabilisation of emulsions: creaming,
sedimentation, flocculation, phase inversion, and coalescence, and these mechanisms
depend amongst others on droplet size, size distribution, amount and type of emulsifier,
mutual solubility of the two phases, and agitation (Tadros 2005). Coalescence, which is the
focus of this thesis, results from the high surface free energy of the emulsion (∆G), which is
energetically unfavourable and hence a driver for reduction of the total interfacial area (∆A)
(Equation 1.1) (Friberg & Larsson 2004).
Δ𝐺𝐺 = 𝛾𝛾Δ𝐴𝐴 1.1
where γ denotes interfacial tension, and ∆G is almost always positive, meaning that
emulsions tend to physically destabilize and go back to their demixed state.
For droplets to coalesce, the interfacial film between the droplets needs to drain to a certain
thickness (Chan et al. 2011), for which the droplet contact time needs to exceed the film
drainage time. Film drainage is induced by the capillary pressure (due to the pressure
difference between the dispersed and continuous phase), and can be slowed down or
prevented by the disjoining pressure (which results from van der Waals, steric and
electrostatic interactions between film surfaces) (Stubenrauch & Von Klitzing 2003), and
droplet contact time depends on the flow conditions of the continuous phase (Chesters
1991). When contact time exceeds film drainage time, the film between droplets may
rupture resulting in droplet coalescence, which is delayed or suppressed by increasing the
continuous phase viscosity or surface elasticity (Friberg & Larsson 2004).
Introduction and thesis outline
9
To stabilise emulsions against coalescence, emulsifiers are used because they lower the
interfacial tension and thus the Gibbs free energy (Equation 1.1), and some of them also
provide steric or electrostatic repulsion or increase the surface elasticity (Friberg & Larsson
2004). Emulsifiers mostly consist of hydrophilic and hydrophobic groups, which allows
them to spontaneously adsorb to an oil-water interface (McClements 2005). Food
emulsifiers can be biobased (e.g., proteins, phospholipids, and lecithin) or synthetically
produced (e.g., mono- and diglycerides and their derivatives, polysorbates, and sucrose
esters) (Hasenhuettl & Hartel 2008), and most of them do not consist of pure components.
Although the list of food-grade emulsifiers is long, their action in emulsions is mostly
poorly understood, and the design of emulsions is still driven by trial and error
investigations. Through the devices presented in this thesis we contribute to mechanistic
understanding of emulsifier action during formation and coalescence of droplets.
1.2. Emulsion production During emulsification three stages take place: droplet deformation, break-up, and
coalescence (Lucassen-Reynders & Kuijpers 1992). Droplet deformation and break-up can
result from shear forces that mostly act parallel, and inertial forces that mostly act
perpendicular to the droplet (Walstra 2003). Coalescence may occur immediately after
droplet formation or at a later stage during processing or storage, and in this thesis we focus
on immediate coalescence. In general, for emulsion formulation the emulsification device
and its characteristics (i.e., droplet break-up forces, energy usage, and throughput) are
considered together with the product and ingredient characteristics (i.e, droplet size,
viscosity of both liquids and the final emulsion, dispersed phase fraction, shear and
temperature sensitivity of emulsifiers) (Schultz et al. 2004), although not that many design
rules are available.
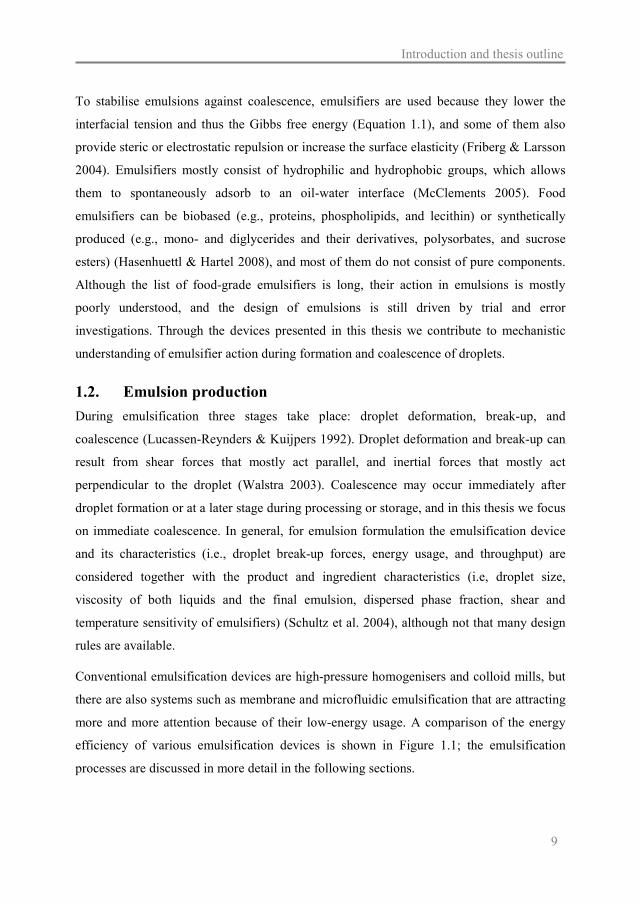
Conventional emulsification devices are high-pressure homogenisers and colloid mills, but
there are also systems such as membrane and microfluidic emulsification that are attracting
more and more attention because of their low-energy usage. A comparison of the energy
efficiency of various emulsification devices is shown in Figure 1.1; the emulsification
processes are discussed in more detail in the following sections.

Chapter 1
10
Figure 1.1. Energy efficiency of various emulsification devices: high pressure homogeniser (30% oil) (standard nozzle (○), microfluidizer nozzle (□), jet nozzle (◊), and orifice nozzle (Δ) (Stang et al. 2001)), colloid mill (30% oil) (—) (Karbstein & Schubert 1995), membrane emulsification (direct (20% oil (▲) and 50% oil (●) (Lambrich & Schubert 2005)) and pre-mix emulsification (5% oil) (♦) (van der Zwan et al. 2008)), and spontaneous microfluidics (grooved microchannel (x), straight-through microchannel (+), and edge-based droplet generation device (*) (30% oil) (Maan et al. 2011)).
1.2.1. High-pressure homogeniser
In a high-pressure homogeniser, a high pressure pump pushes the coarse pre-mix emulsion
through a nozzle after which it decompresses (Figure 1.2A), and during this process
typically up to 95% of the energy is dissipated as heat (McClements 2005). Different
nozzles may be used; the standard and microfluidizer nozzle generate droplets through
turbulent flow, and the jet and orifice nozzle operate in the laminar regime using shear to
form small droplets (Stang et al. 2001). The residence time of droplets in the dispersing
zone is typically 0.1-30 ms (Schultz et al. 2004), and droplet contact time in this zone is too
short for coalescence to occur. At this stage of the process, the droplet size is determined by
droplet formation only; however coalescence can occur further downstream in the
homogeniser when contact time is longer, and therewith determine droplet size (Håkansson
et al. 2009; Karbstein & Schubert 1995). When droplets leave the homogeniser, energy
available for droplet collision decreases and thus coalescence rate decreases as well (Mohan
0
1
10
100
1.E+02 1.E+04 1.E+06 1.E+08
Dro
plet
dia
met
er (μ
m)
Energy usage (J m-3)
High-pressure homogeniser
Membrane emulsification
Spontaneous microfluidics
Colloid mill

Introduction and thesis outline
11
& Narsimhan 1997). In the food industry, high pressure homogenisers are mostly used for
low viscous liquids, such as milk and cream (Rayner & Dejmek 2015).
1.2.2. Colloid mill
A colloid mill consists of a rotor and stator with a conical gap (Figure 1.2B), of which the
surface is smooth or structured (Rayner & Dejmek 2015). Droplet formation results from
laminar viscous, turbulent viscous, or turbulent inertial flow (Urban et al. 2006), and
compared to the high-pressure homogeniser, the residence time in the dispersing zone is
much longer (~0.1-1 s) (Schultz et al. 2004). Emulsions with higher viscosity can be
processed (Maindarkar et al. 2014), but the resulting droplet size is larger. Typical products
are mayonnaise-type emulsions that have a high dispersed phase fraction and are partly
stabilised with proteins (Rayner & Dejmek 2015).
1.2.3. Membrane emulsification
During direct membrane emulsification, the dispersed phase is pushed through a membrane
with micro-pores (Figure 1.2C), and shear is used to detach the droplets, either through a
cross-flowing continuous phase, membrane rotation, or membrane vibration (Vladisavljevic
et al. 2012). Applied shear is considerably lower than in a high pressure homogeniser or a
colloid mill (Schröder et al. 1998), which improves energy efficiency (Figure 1.1) and
decreases coalescence (Lee et al. 2013). Droplet formation can take as little as 15 ms (van
der Graaf et al. 2004), and the process is mostly used for products with a low dispersed
phase fraction. It is good to mention that monodisperse emulsions can be produced, and that
this process is suitable for heat or shear sensitive ingredients, unlike the first two processes
(Gijsbertsen-Abrahamse et al. 2004).
An alternative for direct membrane emulsification is pre-mix membrane emulsification,
during which a coarse emulsion is pushed through a membrane to break it up into smaller
droplets (Figure 1.2D) (Lambrich & Schubert 2005). This process can be carried out at a
higher flux compared to direct membrane emulsification and generates smaller droplets, but
they are less uniform in size, which can be improved by repeated passage through the
membrane. Since the entire emulsion is pushed through the membrane, this process is more

Chapter 1
12
susceptible to fouling than direct emulsification (Vladisavljević & Williams 2005; Nazir et
al. 2010). Alternatively, metal sieves with straight-through pores and packed beds of glass
beads have been suggested, which are easier to clean and have a higher flux (Nazir et al.
2011; Nazir, Boom, et al. 2013). The residence time in the dispersing zone for a single pass
is around 8 μs for the metal sieve (Nazir, Schroën, et al. 2013) and around 0.01-0.3 s for the
packed bed system (Nazir, Boom, et al. 2013), but repeated homogenisation cycles increase
this time accordingly.
1.2.4. Microfluidic emulsification
In microfluidic emulsification two mechanisms may be used: spontaneous (Figure 1.2E)
and shear-based (Figure 1.2F) droplet formation. In the former, Laplace pressure
differences determine the droplet size (Maan et al. 2011), and this mechanism is used in
straight-through and grooved microchannels, and edge-based droplet generation devices
(Vladisavljevic et al. 2012). In the latter, droplet formation results from the shear exerted by
the continuous phase flow (Vladisavljevic et al. 2012), as was the case in shear-based
membrane emulsification. Droplet formation times range from 0.03-0.3 s for spontaneous
devices (Kobayashi et al. 2008) to ~1 ms for shear-based systems (Nisisako & Torii 2008).
With both mechanisms, highly monodisperse droplets can be formed, shear and temperature
sensitive ingredients can be used, and spontaneous devices are claimed to be very energy
efficient (Schroën et al. 2015). Various authors have attempted to up-scale these systems
via parallelisation (Sahin 2016; Kobayashi et al. 2010; Nisisako et al. 2012), but the scale
that is reached is not sufficient to warrant large-scale application in industry (i.e., tonnes per
hour) at this moment. It is expected that these techniques at their current level of
development may be used for the production of high-added value products that require
monodisperse emulsions.
From the description of the emulsification devices it is clear that they all have their own
pros and cons, and levels of maturity. What they all do have in common is that droplet
formation takes place at very short time-scales, and to design these processes also
observation methods suited for this purpose need to be developed, since they are not readily
available.

Introduction and thesis outline
13
Figure 1.2. Schematic impression of various emulsification devices: A) homogeniser, B) colloid mill, C) direct membrane emulsification, D) pre-mix membrane emulsification, E) spontaneous microfluidic device (side view), and F) a shear-based microfluidic device (top view).
1.3. Control of droplet size In general, droplet size determines emulsion shelf life and sensory attributes such as
appearance, texture, and flavour, and it is therefore important to control this parameter
(McClements 2005). Examples of common food emulsions and their typical droplet size
and fat content are given in Table 1.1. To make these products and to keep them stable,
emulsifiers are added (Stang et al. 1994), but at the time-scales encountered during
emulsification, emulsifier adsorption and coalescence are very poorly understood, if at all.
In order to break through this vicious circle, tools need to be developed to assess these
time-scales, and derive scaling relations for emulsion product design.

Chapter 1
14
Table 1.1. Characteristics of common food emulsions (McClements 2005).
Product Droplet diameter (μm) Fat content (wt. %)
Milk 0.4 0.5-3.3
Fruit drinks < 0.3 < 0.1
Pourable dressings 10-40 30-45
Mayonnaise 1-40 75-84
When emulsifier adsorption at the oil-water interface is fast, as is the case for low
molecular weight surfactants, the interface may be stabilised before droplet collision and
therewith preventing coalescence, whereas interface stabilisation with proteins is slower
and thus may result in more coalescence (Figure 1.3) (Karbstein & Schubert 1995). To
improve emulsification, the emulsification process mechanism need to be understood as
function of the emulsifier adsorption rate at the oil-water interface. This implies that the
effect of emulsifier coverage on droplet formation and coalescence stability need to be
measured individually at the appropriate time-scales occurring during the emulsification
process. Unfortunately, the tools for this have not been developed yet; coalescence is
mostly estimated from the droplet size distribution in the eventually obtained emulsion,
which does not allow decoupling of droplet formation and coalescence (Håkansson 2015).
Figure 1.3. Emulsion droplet formation and emulsifier adsorption scenarios. Adapted from Karbstein and Schubert (1995).

Introduction and thesis outline
15
1.4. Using microfluidics to understand emulsification Microfluidics have been used to gain better understanding of droplet formation during pre-
mix and direct membrane emulsification (van der Zwan et al. 2006; van der Graaf et al.
2005; Schroën et al. 2016), and have the potential to predict emulsifier adsorption and
emulsion stability during emulsification. Such measurements may be complex due to the
extremely short time-scales related to droplet formation, collision, and emulsifier
adsorption, but in principle they can be used to evaluate various process conditions and
ingredient formulations. The time for droplet formation in industrial emulsification
processes is typically in the sub-millisecond to second time-scale, and this is a time-scale
that is achievable in microfluidics. In this thesis, various microfluidic methods are
developed and discussed that describe specific parts of the emulsification process for a wide
range of process conditions, and product ingredients.
1.4.1. Emulsifier adsorption
When emulsifiers adsorb, they position at the oil-water interface with the more hydrophobic
parts in contact with the oil phase and the more hydrophilic parts in the aqueous phase,
therewith reducing oil-water contact and through that the interfacial tension (McClements
2005). Adsorption of surfactants, which have a distinct hydrophobic and hydrophilic group,
is different from proteins, which have multiple groups that can have limited interface
orientation flexibility because of intramolecular bonds that prevent full unfolding at the
interface (McClements 2005). As mentioned, interfacial tension is a measure to quantify
emulsifier adsorption, but to have predictive value for large-scale processes it would need
to be known at the appropriate time-scales and under conditions that are dominated by
convective emulsifier transport (Stang et al. 1994). However, in standard tensiometric
devices such as the pendant drop tensiometer, surfactant adsorption is dominated by
diffusion, and measurements can be done at time-scales that are in the order of seconds. To
bridge this gap, microfluidic methods can be used.
Microfluidic methods for interfacial tension measurements can be based on droplet size,
pressure drop, or droplet deformability. In the first type, droplet formation and thus droplet
size depends on the balance between the shear exerted by the continuous phase and the

Chapter 1
16
interfacial tension that keeps the droplet attached to the to-be-dispersed phase. With this
relation, interfacial tension at the moment of droplet formation was determined from the
droplet size. For the measurements Steegmans et al. (2009) used a cross-flow Y-junction
(Figure 1.4A), Wang et al. (2009) a cross-flow T-junction (Figure 1.4B), and Xu et al.
(2012) a coaxial device (Figure 1.4C). Interfacial tension at the highest pressure drop was
measured by Wang et al. (2014) (Figure 1.4D) based on the relation of pressure drop and
radius of the growing droplet with the Laplace pressure inside the droplet, from which the
interfacial tension was calculated. Brosseau et al. (2014) directed droplets through multiple
expansion chambers where droplet deformation was recorded (Figure 1.4E), and the
evolution of interfacial tension was measured based on the relation between droplet
deformation and droplet velocity, interfacial tension, and droplet radius. An overview of
droplet sizes and time-scales in these measurements is given in Table 1.2.
Figure 1.4. Microscopic images during or after interfacial tension measurement based on: droplet size (A) (Steegmans, Warmerdam, et al. 2009), (B) (Wang, Lu, Xu & Luo 2009), and (C) (Xu et al. 2012); pressure drop (D) (Wang et al. 2014); and droplet deformation (E) (Brosseau et al. 2014).
Table 1.2. Overview of microfluidic tensiometric methods.
Reference Method Droplet diameter (μm) Time-scale (ms)a
Steegmans et al. (2009) Size 8-13 0.5-10
Wang et al. (2009) Size 160-270 20-70
Xu et al. (2012) Size 10-180 1-130
Wang et al. (2014) Pressure drop 400-800 10-8000
Brosseau et al. (2014) Deformability 90-120 10-2000 a time between start of droplet formation and the measurement
With the method of Steegmans et al. (2009), the smallest droplets and time-scales can be
assessed, possibly under conditions that are not dominated by diffusion (Wang, Lu, Xu &
Luo 2009; Brosseau et al. 2014; Wang et al. 2016), which are both relevant for large-scale

Introduction and thesis outline
17
processes. However, these effects need to be quantified; therefore, this is made the focal
point of this thesis.
1.4.2. Coalescence stability
Microfluidics can also be used to perform coalescence measurements separately from
droplet formation in flowing systems. Baret et al. (2009) used a flow focusing nozzle to
produce water-in-oil droplets, followed by a channel of various lengths where surfactants
can adsorb to the interface, after which the droplets enter the wider coalescence channel
(Figure 1.5A). Krebs and co-workers (2012a; 2012b; 2013) used a T-junction to produce
oil-in-water droplets followed by a coalescence channel (Figure 1.5B), and they obtained
film drainage profiles and coalescence times by tracking droplets during collision and
coalescence. In line with this, Fu et al. (2015) investigated bubble coalescence with a cross-
junction flow focusing device in combination with a funnel shaped coalescence channel
(Figure 1.5C). The system developed by Krebs et al. (2012a; 2012b; 2013) was used to
measure coalescence of oil-in-water emulsions, and because these are most abundant in
food, this method is used in this thesis.
Figure 1.5. Overview of microfluidic devices to study coalescence used by Baret et al. (2009) (A), Krebs et al. (2012a; 2013) (B), and Fu et al. (2015) (C).

Chapter 1
18
1.5. Research aim and thesis outline The objective of this work is to use microfluidic methods to study emulsion formation and
stability under conditions that are relevant for industrial emulsification processes. The Y-
junction approach of Steegmans et al. (2009) is used as a starting point to measure
interfacial tension, and with the coalescence channel of Krebs et al. (2012b) emulsion
stability to coalescence is elucidated. The starting point for the investigations are model
systems that are extended to food-grade components, and their use is put in a wider
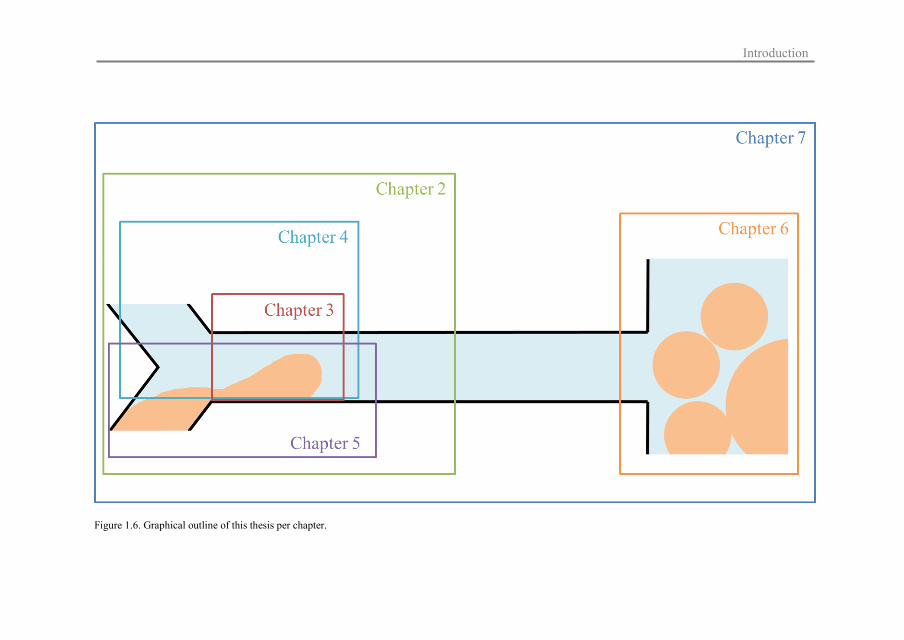
perspective in the general discussion. The thesis outline is described per chapter below and
a graphical representation is given in Figure 1.6.
Chapter 2 provides a review of existing literature on cross-flow microfluidic
emulsification. The mechanisms of emulsion production are discussed and an overview is
provided on how microfluidic design, shear forces, and interfacial tension forces affect this
process leading to various effects on droplet size, and this is the basis for the investigated
microfluidic methods.
Chapter 3 presents the microfluidic Y-junction that is used for interfacial tension
measurements of a model system. The obtained values are compared with data from a drop
tensiometer (a conventional, static, and supra-second time-scale device).
In Chapter 4, the effect of continuous phase viscosity and velocity on the interfacial
tension in the same microfluidic Y-junction is determined. Through these results, more
insight is gained in the mass transfer conditions during Y-junction emulsification, including
those for surfactants in the dispersed phase.
Chapter 5 explores the adsorption behaviour of different food-grade surfactants (Tween 20
and Span 20; water- and oil-soluble, respectively) with different dispersed phases (decane
and hexadecane) in the Y-junction.
Chapter 6 focusses on the use of the coalescence channel to measure the coalescence
stability of emulsions stabilised with proteins (β-lactoglobulin, whey protein isolate and
oxidised whey protein isolate) at various concentrations, pH values, and adsorption times.
The general discussion in Chapter 7 provides an overview of the main results of the
microfluidic research and the implications for industrial emulsification processes.
Introduction
Figure 1.6. Graphical outline of this thesis per chapter.


This chapter has been published as Muijlwijk, K.; Berton-Carabin, C.; Schroën, K., Cross-
flow microfluidic emulsification from a food perspective, Trends in Food Science &
Technology, 49, 51-63, 2016
2 2. Cross-flow microfluidic
emulsification from a food
perspective

Chapter 2
22
2.1. Abstract Background: The use of microfluidics is a relatively new route to produce emulsions.
Advantages of this method include high energy efficiency, high droplet monodispersity,
and potential use for the production of high added-value and fragile products. However, the
current productivity is still rather low compared to what would be needed in an industrial
setting.
Scope and approach: In this review we discuss the mechanisms of emulsion droplet
formation in cross-flow microfluidics, and how microfluidic design, shear forces and
interfacial tension forces influence droplet formation. These combined insights will be used
to discuss the potential of cross-flow microfluidics for the production of food emulsions.
Key findings and conclusions: In order to make emulsions at large scale, the current devices
need to be parallelised even more than shown in the successful examples known from
literature. Besides, the behaviour of ingredients used in emulsion formulation need to be
tested in greater detail; for example the effect of interfacial tension is captured in scaling
relations, but dynamic interfacial tension behaviour not. For this, also microfluidic
analytical tools have been suggested and the first positive results were obtained. As soon as
these two requirements are met, microfluidics becomes a promising option for the
production of high added-value emulsion food products.

Review cross-flow microfluidics
23
2.2. Introduction Emulsions consist of a dispersion of one liquid into another in the form of droplets, both
liquids being immiscible, for example oil and water. Because of the molecular
incompatibility between both liquids, such a dispersion requires energy (∆G), of which the
amount depends directly on the area of the liquid-liquid interface (∆A) and on the
interfacial tension between both liquids (γ) (Equation 2.1).
Δ𝐺𝐺 = 𝛾𝛾Δ𝐴𝐴 2.1
During emulsification, a large interfacial area is rapidly created; for example, 1 litre of
droplets with a diameter of 1 µm corresponds to 6000 m2 droplet surface area. Accordingly,
the free energy of the system increases (Equation 2.1), which favours coalescence. Surface-
active ingredients (i.e., surfactants or biopolymers) have an amphiphilic character, and
adsorb at the oil-water interface, which lowers the interfacial tension and the corresponding
free energy of the system. Droplets are only protected against coalescence when the
interface is sufficiently covered with surface-active molecules. Insufficient adsorption
together with turbulence in the emulsification system (hence, higher probability of collision
between droplets) leads to rapid coalescence after droplet formation, resulting in a
polydisperse emulsion (Jafari et al. 2008). This is typically the case in high-pressure
homogenisers and rotor-stator systems that are used in industry (Schultz et al. 2004; Urban
et al. 2006) and this can also lead to instability of the emulsions. In these traditional
processes, high shear stresses are applied to disrupt the dispersed phase, but these processes
are very energy inefficient because of the high energy dissipation. Generally, only 1-5 % of
the energy is used for emulsification itself, the rest is dissipated as heat, which additionally
may cause damage to the product (McClements 2005; van Dijke et al. 2010).
To characterise the droplet size distribution, the coefficient of variation (CV) is often used,
which is the standard deviation divided by the mean droplet size; monodisperse emulsions
have a CV below 25%, whereas emulsions with a CV above 25% are regarded as
polydisperse (Maan et al. 2011). With conventional emulsification systems polydisperse
emulsions are obtained with a CV of around 40% (Maan et al. 2011). Alternatives to the
traditional emulsification techniques are membrane, microchannel and microfluidic

Chapter 2
24
emulsification (Vladisavljevic et al. 2012), that are known to prepare emulsions that are
much more monodisperse.
In literature, various arguments have been used to substantiate why monodisperse
emulsions should be preferred: less emulsifier is needed for stabilisation and there is less
lipid oxidation, there is no Ostwald ripening, less creaming and sedimentation, there is an
effect on sensory perception, and it allows precise control of capsule loading level. The first
argument depends on the actual size distribution; small droplets present in polydisperse
emulsions have a large interfacial area, they therefore need a great amount of emulsifier for
stabilisation and are more prone to lipid oxidation (Berton-Carabin et al. 2014). Ostwald
ripening is not expected to be of great influence on emulsion stability since the diffusivity
of the oil into the water phase is not expected to be that high, depending on the
composition. It can be an issue, however, when the oil phase contains flavours or alcohol
because the oil is now more water-soluble (McClements 2005). Gravitational separation,
such as creaming or sedimentation, is influenced by the droplet size and is reduced in
monodisperse emulsions with a small droplet size; in a polydisperse emulsion, larger
droplets will cream and collide with smaller droplets and, when aggregates are formed as a
result, creaming is further enhanced (McClements 2005). The effect of droplet size on
sensory preference has been shown, albeit on emulsions that were not really monodisperse
(Goudédranche et al. 2000); still this indicates that there is a need for tighter control on
droplet size. These are all reasons to prefer monodisperse emulsions, but the truth of the
matter is that nobody has been able to make these emulsions at sufficiently large scale so
they could truly be tested. A derived field in which droplet size distribution is of great
importance is encapsulation. It has been shown that the effect of cancer medication
incorporated in emulsion droplets in animals and humans very strongly depends on the size
of the droplets (Higashi et al. 1999). Basically, the droplet size determines in which organ
the droplet is captured, and that co-determines the efficiency of the treatment. It could be
expected that similar effects play a role in digestion of foods that contain capsules that
should deliver a certain load at a specific location in the body (Zuidam & Nedović 2010).
To make monodisperse emulsions, a frequently used approach is to directly disperse the to-
be-dispersed phase into the continuous phase. In direct membrane emulsification, the to-be-

Review cross-flow microfluidics
25
dispersed phase is pushed through membrane pores into the continuous phase, and droplets
are sheared off by the continuous phase that flows over the membrane. The applied shear is
primarily used to make the droplet, and the shear is lower than in traditional methods,
which makes it more energy efficient. Alternatively, also premix membrane emulsification
may be used, as recently reviewed by Nazir and co-workers (2010), but that topic is
considered outside the scope of the current paper. The use of membranes for emulsification
in food applications was reviewed by Charcosset et al. (2004). Their main conclusion was
that the membranes should be optimised (higher flux, uniform pore size and low pore
density; all three criteria need to be met simultaneously) before the technique is suitable for
industrial applications, which is in agreement with an earlier review by Gijsbertsen-
Abrahamse and co-workers (2004).
As in membrane emulsification, droplet formation in microfluidic devices is based on the
shear of the continuous phase, that can be either in cross-flow direction, for example in T-
and Y-junction microfluidic devices, or in co-axial direction, as in flow focusing devices
(Anna et al. 2003; Cramer et al. 2004; Garstecki 2010; Vladisavljević et al. 2010).
Alternatively, the so-called microchannel emulsification is based on spontaneous droplet
formation as a result of Laplace pressure differences. Examples of such devices are
straight-through microchannels, grooved microchannels or the edge-based droplet
generation (EDGE) system, which were all recently reviewed for food applications by
Maan et al. (2011). Droplet formation takes place in the absence of shear; therefore, the
energy efficiency of such devices is high, especially compared to conventional
emulsification methods (Maan et al. 2011), and this difference can be orders of magnitude.
Besides, the produced emulsions are rather monodisperse, with CV’s as low as ~ 5% (Maan
et al. 2011; Nisisako & Torii 2008).
Microfluidic emulsification devices can be used, amongst others, as micro-reactors, as
reviewed by Atalay et al. (2011), or as production devices for simple or multiple emulsions,
foams, capsules and micro- and nanoparticles (Capretto et al. 2013; Charcosset 2009; Engl
et al. 2008; Mazzitelli et al. 2013; Nisisako et al. 2005; Skurtys & Aguilera 2008; van
Swaay & DeMello 2013; Vladisavljevic et al. 2012; Vladisavljević et al. 2013; J. T. Wang
et al. 2011; Zhao 2013). Such multiphase colloidal systems are abundantly present in food
Chapter 2
26
products, naturally or induced by processing. Oil-in-water (O/W) emulsion droplets are for
example present in mayonnaise, milk and soups. Multiple emulsions, such as water-in-oil-
in-water (W/O/W) emulsions, are used to make a ‘light’ variant of these products as water
replaces part of the fat phase, and can also be used to encapsulate components (Jiménez-
Colmenero 2013; Muschiolik 2007). Also air-in-oil-in-water (A/O/W) emulsions are
suitable for this purpose (Brun et al. 2015). Examples of water-in-oil (W/O) emulsions are
margarine and butter. Foams and other aerated products such as ice cream and some
chocolates contain air-in-water or air-in-oil bubbles. Micro- and nanoparticles are present in
foods as structural elements and in capsules, and may be used to stabilise so-called
Pickering emulsions (Berton-Carabin & Schroën 2015; Dickinson 2010; Dickinson 2012).
In this paper we will primarily focus on the formation of O/W and W/O emulsions in
microfluidics, although most available information is on O/W emulsions. As the production
of particles and microgels is often done through solidification of emulsion droplets, our
review can also be used to describe the early stages of their preparation; the solidification
process as such is considered outside the scope of the present article but more information
on this can be found in a recent review on the production of food structures using
microfluidics (Ushikubo et al. 2014). Examples related to foams and bubbles will also be
discussed when relevant to the described concepts; more information about bubble and
foam formation in microfluidics can be found in another recent review (Huerre et al. 2014).
The main focus of this review is the use of cross-flow microfluidics for the production of
food emulsions; droplet formation in microfluidic devices is discussed, starting from
formation mechanisms in different regimes, followed by the influence of the microfluidic
design (chip material and channel dimensions), process conditions (flow rate and viscosity
of fluids) and ingredients as reflected in interfacial forces (interfacial tension, fluid
elasticity and contact angle). An overview of all the reported parameters and the resulting
droplet diameter (D) and dimensionless volume (Vd) used in this review can be found in the
Appendix (Table A2.1). The potential of microfluidics for producing food emulsions will
be discussed in the last section of this review.

Review cross-flow microfluidics
27
2.3. Emulsification in cross-flow microfluidic devices
2.3.1. Mechanisms of droplet formation and break-up
The flow behaviour of fluids can be described by various dimensionless numbers. These
numbers compare the relative importance of different physical properties; the viscous and
interfacial forces are compared in the capillary number (Ca) (Equation 2.2), the inertial and
viscous forces in the Reynolds number, the inertial and surface forces in the Weber number,
and the gravitational and surface forces in the Bond number. Because the characteristic
dimensions of microfluidic devices are small, the Reynolds, Weber and Bond numbers are
also very small, and inertial and gravitational forces can be neglected (possibly with the
exception of high flow rates). Hence, the dominant forces for emulsion formation are the
viscous and interfacial forces, which are combined in the capillary number (Atencia &
Beebe 2005; Baroud et al. 2010; Christopher et al. 2008; Gu et al. 2011):
where ηc is the viscosity of the continuous phase, νc the velocity of the continuous phase,
and γ the interfacial tension between both liquids.
Forces involved in droplet break-up are the shear stress of the continuous phase on the
emerging droplet, the interfacial tension force associated with the Laplace pressure
difference over the droplet interface, and the pressure force from (partial) blockage of the
post-junction channel by the emerging droplet (Christopher et al. 2008; Garstecki et al.
2006). Detachment is a result of a misbalance between the interfacial tension force, which
keeps the droplet attached to the to-be-dispersed phase, and the shear and pressure forces
which, depending on the droplet formation mechanism, enhance detachment. Droplet
formation starts with emergence of the droplet into the main channel, followed by an
increase in shear force that pushes the droplet downstream, which results in thinning of the
neck. When the neck becomes smaller than the channel depth, the interfacial tension force
can no longer stabilise the neck and the droplet detaches (Garstecki et al. 2006; van der
Graaf et al. 2005). Droplet emergence and detachment can occur in three regimes, namely,
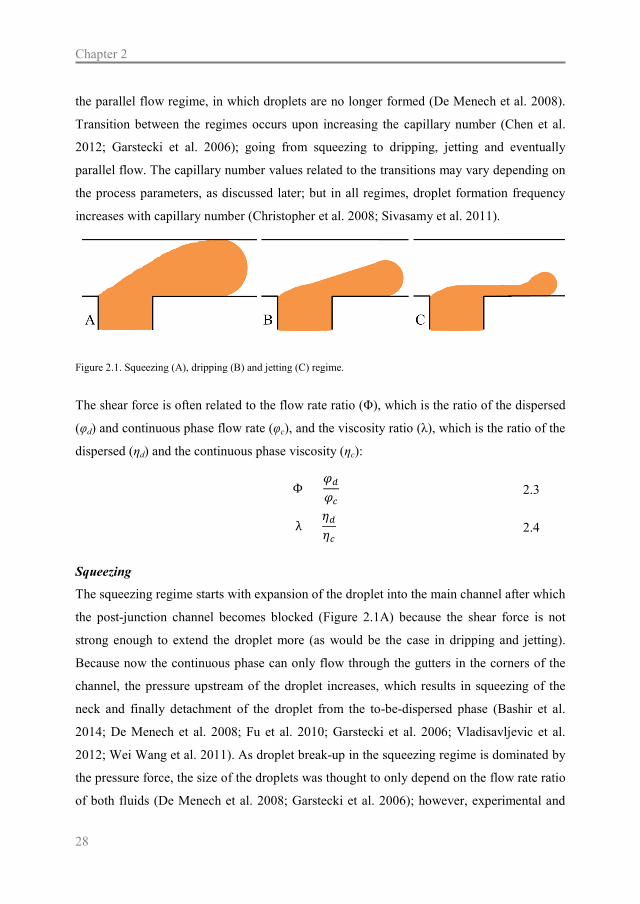
squeezing, dripping and jetting (Figure 2.1). A fourth situation may also be distinguished:
𝐶𝐶𝐶𝐶 = 𝜂𝜂𝑐𝑐𝜈𝜈𝑐𝑐𝛾𝛾
2.2
Chapter 2
28
the parallel flow regime, in which droplets are no longer formed (De Menech et al. 2008).
Transition between the regimes occurs upon increasing the capillary number (Chen et al.
2012; Garstecki et al. 2006); going from squeezing to dripping, jetting and eventually
parallel flow. The capillary number values related to the transitions may vary depending on
the process parameters, as discussed later; but in all regimes, droplet formation frequency
increases with capillary number (Christopher et al. 2008; Sivasamy et al. 2011).
Figure 2.1. Squeezing (A), dripping (B) and jetting (C) regime.
The shear force is often related to the flow rate ratio (Φ), which is the ratio of the dispersed
(φd) and continuous phase flow rate (φc), and the viscosity ratio (λ), which is the ratio of the
dispersed (ηd) and the continuous phase viscosity (ηc):
Squeezing
The squeezing regime starts with expansion of the droplet into the main channel after which
the post-junction channel becomes blocked (Figure 2.1A) because the shear force is not
strong enough to extend the droplet more (as would be the case in dripping and jetting).
Because now the continuous phase can only flow through the gutters in the corners of the
channel, the pressure upstream of the droplet increases, which results in squeezing of the
neck and finally detachment of the droplet from the to-be-dispersed phase (Bashir et al.
2014; De Menech et al. 2008; Fu et al. 2010; Garstecki et al. 2006; Vladisavljevic et al.
2012; Wei Wang et al. 2011). As droplet break-up in the squeezing regime is dominated by
the pressure force, the size of the droplets was thought to only depend on the flow rate ratio
of both fluids (De Menech et al. 2008; Garstecki et al. 2006); however, experimental and
Φ = 𝜑𝜑𝑑𝑑𝜑𝜑𝑐𝑐
2.3
λ = 𝜂𝜂𝑑𝑑𝜂𝜂𝑐𝑐
2.4

Review cross-flow microfluidics
29
numerical experiments showed that droplet size does depend on capillary number, albeit
less than in the dripping regime (Chen et al. 2012; Christopher et al. 2008; Liu & Zhang
2009). This indicates that in the squeezing regime effects of the interfacial tension force
cannot be neglected.
The transition from squeezing to dripping is marked by a critical capillary number (Cac) of
~ 0.02 as found theoretically by both De Menech et al. (2008) and Liu and Zhang (2009),
and experimentally verified by Tostado et al. (2011). In the work of Liu and Zhang (2009),
the Cac was found to be independent of the flow rate ratio, contact angle and viscosity ratio.
However, the Cac was about 10 times smaller in experimental work of Christopher et al.
(2008), for which no explanation was given.
Dripping
In the dripping regime, the shear stress exerted by the continuous phase is large enough to
deform the emerging droplet so it does not block the entire channel (Figure 2.1B). The neck
that holds the droplet attached is stabilised by the Laplace pressure difference between the
upstream and downstream end of the emerging droplet. Shear stress increases until the
droplet reaches a critical size at which the shear stress exceeds the interfacial tension force
and the droplet detaches (Chen et al. 2012). Increasing the capillary number within this
regime will decrease the droplet volume (Chen et al. 2012; Christopher et al. 2008; De
Menech et al. 2008; Fu et al. 2010; Garstecki et al. 2006; Gupta et al. 2009; van der Graaf
et al. 2006; Xu et al. 2008).
In literature, it has been suggested that droplet break-up in the dripping regime is
completely shear-driven (Garstecki et al. 2006; Thorsen et al. 2001), but also that the
droplet is to some extent confined by the channel walls (De Menech et al. 2008) and that
makes droplet break-up also partly pressure-driven, as confirmed in experimental studies
(Abate et al. 2012; Sivasamy et al. 2011); they found pressure fluctuations in the
continuous phase, indicating that pressure forces occur and that droplet formation is a result
of pressure and shear forces. The transition between both regimes is not that sharp and
referred to as the transient or transition regime (Fu et al. 2010; Li et al. 2012; Xu et al.
2008).

Chapter 2
30
The transition from dripping to jetting, and from jetting to parallel flow, cannot be
described with a single Cac as this number depends on the geometry of the junction (Guillot
& Colin 2005), the flow rate ratio (Gupta et al. 2009), the viscosity ratio (Guillot & Colin
2005; Gupta et al. 2009) and the wall wettability (Chen et al. 2012); more details are given
later.
Jetting and parallel flow
In the jetting regime, droplet formation is forced to move more downstream (Figure 2.1C).
The to-be-dispersed phase now has the form of a jet from which droplets detach at the end
(Li et al. 2012; Yan et al. 2012). An even higher shear stress may even completely
dominate the drag force, and parallel flow of the continuous phase and dispersed phase
occurs, and no droplets are formed (Chen et al. 2012).
Ballooning regime
Tarchichi et al. (2013) reported an alternative droplet formation regime called ballooning
that we do not think is relevant for food applications, but report to be complete. At very
high interfacial tension of 100 mN/m, which does not occur in food, and a high viscosity
ratio of 39, the droplet size was found independent of the flow rates of the dispersed and
continuous phases, and the emerging droplet retained a circular shape. At first glance, these
conditions may seem similar to those for spontaneous droplet formation. However, the ratio
of droplet and dispersed phase channel width is significantly larger than normally found for
microchannel emulsification (Sugiura et al. 2002; Sugiura et al. 2001).
2.3.2. Parameters influencing the droplet size
Microfluidic design
Droplet size can, amongst others, be influenced by the construction material of the chip,
channel dimensions (width and depth), and junction design (shape, geometry and angle),
and this is discussed next.
Chip material
Fabrication of microfluidic devices was extensively reviewed by Vladisavljevic et al.
(2013). Most devices are made from polymers (polydimethylsiloxane (PDMS),
Review cross-flow microfluidics
31
polycarbonate (PC), polyethylene terephthalate (PET), polymethyl methacrylate (PMMA),
or polystyrene (PS)), because such chips are easier to manufacture and less expensive than
glass chips. These polymers are hydrophobic, so wetted by the oil phase, and suited for
W/O emulsions (Derzsi et al. 2011). The choice for a polymer depends also on the chemical
resistance, for which we refer through to the detailed overview of Becker and Locascio
(2002). Besides, silica and glass chips can also be used to produce W/O emulsions after
modification with silanes, which renders the surface, depending on the attached groups,
more hydrophobic (Shui et al. 2009) or more hydrophilic (Cecchet et al. 2006).
To produce O/W emulsions, hydrophilic surfaces such as silica and glass have extensively
been used. Alternatively, hydrophobic polymer chips can me made hydrophilic through
various methods such as plasma treatment, silanisation, chemical vapour deposition, layer-
by-layer deposition, surfactant treatment, protein adsorption, graft polymer coating and
hydrosilylation-based surface modification, as reviewed by Zhou et al. (2012); although it
should be mentioned that these modification methods are mostly not permanent.
In general, there are some disadvantages connected to the use of polymeric microfluidic
chips such as their deformability, which limits the accuracy of the channel design, and the
pressure that can be applied. Finally, deformation due to the presence of the liquids may be
an issue; for example, PDMS channels swell in the presence of organic liquids (Seemann et
al. 2012), while glass/silica chips are chemically more resistant, although surface
component interactions are an issue in any device, which can be prevented with surface
modification.
Channel dimensions
A microfluidic junction consists of a continuous phase supply channel with width wc and
dispersed phase supply channel with width wd, and the depth or height (h) of a microfluidic
chip is mostly equal throughout the whole chip. Typical channel widths are 20-100 μm, the
channel depth is mostly similar or smaller (5-100 μm). Often the dimensions are given as
width ratio (Λ) and aspect ratio (Г):
Λ = 𝑤𝑤𝑑𝑑𝑤𝑤𝑐𝑐
2.5

Chapter 2
32
The channel dimensions influence the droplet volume and is co-determined by the process
parameters, for which various scaling relations have been published where droplet volume
is normalised (e.g., by wc2h). To compare process conditions, parameters have been varied
systematically, such as the width and aspect ratio, capillary number, flow rate ratio and the
flow rates. The normalised droplet volume decreases with decreasing dispersed phase
channel width, decreasing channel height, or increasing continuous phase channel width
(Figure 2.2 and Table 2.1) (Christopher et al. 2008; Fries & Rudolf von Rohr 2009;
Glawdel et al. 2012; Wehking et al. 2013; Gupta & Kumar 2010a).
Figure 2.2. Non-dimensional droplet length (L/wc) as a function of the flow ratio (Φ) at different aspect ratios; 1.5 (◊), 1 (∆) and 0.5 (□). Adapted from Gupta and Kumar (2010b).
Table 2.1. An overview of the effect of change in width and aspect ratio and channel dimensions on the change in normalised droplet volume. The symbol ↑ stands for increase, and ↓ for decrease.
Ratio Dimension Normalised droplet volume
Г↓ wc↑
h↓
↓ (Christopher et al. 2008; Fries & Rudolf von Rohr 2009; Gupta & Kumar 2010b;
Wehking et al. 2013)
↓ (Gupta & Kumar 2010a)
Λ↓ wd↓ ↓ (Fries & Rudolf von Rohr 2009; Glawdel et al. 2012)
wc↑
Squeezing: ↓ (Christopher et al. 2008; Gupta & Kumar 2010b; Wehking et al. 2013)
Dripping: ↑ (Gupta & Kumar 2010b)
1
10
0.01 0.1 1 10
L/w
c (-)
Φ (-)
Γ =ℎ𝑤𝑤𝑐𝑐
2.6

Review cross-flow microfluidics
33
In the squeezing regime, at low capillary number or a continuous phase flow rate more than
twice the dispersed phase flow rate, the droplet volume is geometry independent (Gupta &
Kumar 2010a). At increased continuous phase flow rate, the droplets become smaller due to
increased shear on the emerging droplets (Fries & Rudolf von Rohr 2009; Yeom & Lee
2011a). When the capillary number and the flow rate ratio are kept constant, the normalised
droplet size is dependent on the geometry and increases with decreasing continuous phase
channel width (Fries & Rudolf von Rohr 2009; Garstecki et al. 2006; Gupta & Kumar
2010a; Wehking et al. 2013).
When droplets are formed in the dripping regime, the normalised droplet volume decreases
with decreasing continuous phase channel width (Gupta & Kumar 2010b), and increases
with increasing capillary number (low shear and high interfacial tension). Droplets and
bubbles formed in the squeezing or dripping regime decrease in size with decreasing the
dispersed phase channel width (Christopher et al. 2008; Fries & Rudolf von Rohr 2009;
Glawdel et al. 2012; Yeom & Lee 2011a), further it was found that the effect of the
dispersed phase channel width on droplet volume is larger at low capillary number
(Christopher et al. 2008). For the critical capillary numbers related to transitions between
regimes; increasing the aspect ratio decreases Cac for transition from dripping to jetting and
to parallel flow (Chen et al. 2012; Garstecki et al. 2006), whereas the transition from
squeezing to dripping is hardly affected (Wehking et al. 2013).
The smallest droplet size that can be produced with shear-based devices depends on
technical limitations (Gupta & Kumar 2010a; Yeom & Lee 2011a). To the best of our
knowledge, the most shallow channels (5 μm) were reported by Steegmans et al. (2009a).
Although shallower and smaller channels can be made, this would lead to high operating
pressures, which is not the case in spontaneous emulsification devices. Spontaneous devices
with dimensions as small as 200 nanometres, which have been used in our lab, gave
successful droplet formation (~1 µm) at relatively low pressure (unpublished results).
Junction design
Besides the traditional mode of operation with the dispersed phase injected perpendicular to
the main channel (Figure 2.3A), the inlets can be swapped (Abate et al. 2009; Carrier et al.
2014), or droplets can be made in a head-on configuration in which the continuous and

Chapter 2
34
dispersed phases both enter through the main channel (Shui et al. 2009). To increase
productivity, multiple T-junctions can be combined within one chip such as the cross-
junction (Dreyfus et al. 2003; Nisisako & Torii 2008; Tan et al. 2008) (Figure 2.3B) or the
double pore T-junction (Wang, Lu, Xu, Tan, et al. 2009). Further, local changes have been
suggested around the droplet formation point; capillaries have been used as the
perpendicular channel (Figure 2.3C) (Wang, Lu, Xu, Tan, et al. 2009; Wei Wang et al.
2011; Xu, Li, Chen, et al. 2006; Xu, Li, Tan, et al. 2006b; Xu, Luo, et al. 2006; Xu, Li, Tan,
et al. 2006a), cylindrical channels have been used for bubbles (Ben Abdelwahed et al.
2012), Venturi-shaped continuous phase channels (Figure 2.3D) were investigated by
Lattice Boltzmann simulation (W Wang et al. 2011), and a bypass for the continuous phase
was introduced (Figure 2.3E) that led to a narrower size distribution albeit also to a more
complex droplet formation mechanism (van Steijn et al. 2013).
Alternatively, Y-shaped junctions (Figure 2.3F) were used by Steegmans et al. (2009a). The
break-up mechanism is different from that in T-junctions, leading to smaller droplets
(Steegmans, Schroën, et al. 2009a); interestingly their size was not influenced by the angle
of the junction (Steegmans, Schroën, et al. 2010; Yeom & Lee 2011a). For bubbles, it was
reported that bubble volume decreased with increasing junction angle, which was attributed
to differences in the initial width of the neck (Fries & Rudolf von Rohr 2009; Tan et al.
2009).
Figure 2.3. Images of a T-junction (A), cross-junction (Nisisako & Torii 2008) (B), capillary embedded T-junction (Xu, Li, Tan, et al. 2006a) (C), Venturi-shaped T-junction (W Wang et al. 2011) (D), T-junction with a bypass (van Steijn et al. 2013) (E), and Y-junction (Steegmans, Schroën, et al. 2009a) (F).

Review cross-flow microfluidics
35
Shear forces
Flow rate
Changing the flow rate ratio (Equation 2.3) affects the droplet size through the shear rate.
Besides, if surface active components are present, the flow rate ratio may affect surfactant
transport and through that the interfacial tension, which in turn also influences the droplet
size. In general: at a low flow rate ratio (Φ < 0.1), the droplet size is reported to be not
influenced; at a higher flow rate ratio (Φ ≥ 1), droplet size increases linearly with the
dispersed phase flow rate (Garstecki et al. 2006). The effect of the flow rate ratio is a
function of the capillary number (Figure 2.4); in the squeezing regime, droplet (and bubble)
size increases with increasing flow rate ratio (Bashir et al. 2014; De Menech et al. 2008; Fu
et al. 2011; Gupta et al. 2009; Husny & Cooper-White 2006; Liu & Zhang 2009), while in
the dripping regime at higher capillary number, this effect becomes less (Liu & Zhang
2009). And in the jetting regime, droplet size suddenly decreases with increasing flow rate
ratio (Chen et al. 2012). The flow rate ratio influences the detachment point, which moves
further away from the injection point going from dripping, to squeezing, to jetting (Chen et
al. 2012; Gupta et al. 2009; Liu & Zhang 2009; Tan et al. 2009; Tice et al. 2004; Wehking
et al. 2013; Xu, Luo, et al. 2006). As expected, the frequency of droplet production
increased with the flow rate ratio (Glawdel et al. 2012). The effect of flow rate ratio on
droplet volume is summarised in Table 2.2.
Figure 2.4. Droplet diameter as a function of the capillary number at flow rate ratios of 0.125 (□), 0.25 (○) and 0.5 (∆) with the Cac indicated with the dashed line. Adapted from Liu and Zhang (2009).
60
80
100
120
140
160
0.001 0.01 0.1
Dro
plet
dia
met
er (μ
m)
Ca (-)
Squeezing Dripping

Chapter 2
36
Table 2.2. Effect of increasing the flow rate ratio on droplet volume. The symbol ↑ stands for increase, and ↓ for decrease.
Conditions Effect on volume References
Φ ≥ 1 V↑ linearly (Garstecki et al. 2006)
Φ < 0.1 No change in V (Garstecki et al. 2006)
Squeezing V↑ (Bashir et al. 2014; De Menech et al. 2008; Gupta et al. 2009; Husny &
Cooper-White 2006; Liu & Zhang 2009)
Dripping V↑ (Liu & Zhang 2009)
Jetting V↓ (Chen et al. 2012)
Viscosity
The viscosity and viscosity ratio (Equation 2.4) obviously also affect the capillary number
as discussed previously (Gupta & Kumar 2010b); besides, other effects were also noted and
these are summarised in Table 2.3. The viscosity of the aqueous phase is often increased by
adding glycerol (Glawdel et al. 2012; Husny & Cooper-White 2006), while oil phase
viscosity is adjusted by changing the oil type; frequently used oils are hexadecane (η = 3.5
mPa∙s at 23 °C) (Steegmans, De Ruiter, et al. 2010) and silicone oils (η = 6 - 350 mPa∙s)
(Christopher et al. 2008). Since viscosity is temperature dependent, this will influence
droplet size depending on the temperature sensitivity of the used fluids (Ho et al. 2011;
Murshed et al. 2008).
Table 2.3. Effect of viscosity on droplet volume, production frequency and critical capillary number. The symbol ↑ stands for increase, and ↓ for decrease.
Conditions Constant
parameter
Viscosity Effect References
Squeezing Ca and Φ
or φc and
φd
λ↑ No change
in V
(De Menech et al. 2008; Garstecki et al. 2006; Husny &
Cooper-White 2006; Liu & Zhang 2009)
Dripping Ca and Φ λ↑ V↓
Frequency ↓
(Christopher et al. 2008; De Menech et al. 2008; Gupta
& Kumar 2010b; Gupta et al. 2009; Liu & Zhang 2009)
Dripping φc and φd ηc or ηd ↑ V↓
Frequency ↑
(Bashir et al. 2014; Gu & Liow 2011; Ho et al. 2011;
Husny & Cooper-White 2006; Yeom & Lee 2011b)
Dripping
to jetting
φc and φd ηc or ηd ↑ Cac ↓ (Yeom & Lee 2011b; Guillot & Colin 2005)

Review cross-flow microfluidics
37
Irrespective of the process parameters, the droplet size was found to be nearly independent
of the viscosity ratio in the squeezing regime (Figure 2.5), because shear forces hardly
influence droplet formation (De Menech et al. 2008; Garstecki et al. 2006; Husny &
Cooper-White 2006; Liu & Zhang 2009). In the dripping regime, a smaller droplet size may
be expected at lower viscosity ratio, because of the increased shear from the continuous
phase. However, when the capillary number and flow rate ratio are kept constant, the
droplet size increases (Figure 2.5) (Christopher et al. 2008; De Menech et al. 2008; Gupta
& Kumar 2010b; Gupta et al. 2009; Liu & Zhang 2009). To keep the capillary number and
flow rate ratio constant while increasing the continuous phase viscosity, the continuous and
dispersed phase flow rate need to be decreased. The relative effect of the continuous phase
flow rate is bigger than that of the continuous phase viscosity, resulting in less drag force
that leads to larger droplets and a lower droplet formation frequency.
Figure 2.5. Droplet diameter as a function of the capillary number at viscosity ratios of 0.125 (□) and 1 (◊). Adapted from Liu and Zhang (2009).
The critical capillary number for transition from squeezing to dripping is independent of the
viscosity ratio but, at high values of the latter, transition from squeezing to dripping is more
difficult to observe (De Menech et al. 2008; Liu & Zhang 2009). When the viscosity ratio is
close to 1, the shear of the continuous phase on the emerging dispersed phase is reduced
and jetting and parallel flow more readily occur. As a result, the critical capillary number
70
90
110
130
0.001 0.01 0.1
Dro
plet
dia
met
er (μ
m)
Ca (-)
Squeezing Dripping

Chapter 2
38
and critical flow rate ratio for transition to jetting and parallel flow are decreased (Gupta &
Kumar 2010b; Gupta et al. 2009; Wehking et al. 2013).
Interfacial forces
Contact angle
Whether an O/W or W/O emulsion is formed is determined by the wetting properties of the
channel wall in shear-based emulsification; the fluid wetting the channel wall automatically
becomes the continuous phase (Shui et al. 2009). The wettability of the wall is determined
by the three-phase contact angle (θ) and is a function of the involved interfacial tensions as
given in Young’s law:
where γ1,wall, γ2,wall and γ1,2 are the interfacial tensions between liquid 1 - channel wall, liquid
2 - channel wall and the two liquids, respectively (Bonn et al. 2009).
O/W emulsions are formed in hydrophilic channels (e.g., glass or silica: θw < 90°), whereas
W/O emulsions are formed in hydrophobic channels (e.g., PDMS: θo < 90°). When the
contact angle is around 90° there is no preferential wetting which results in a parallel flow
(Chen et al. 2012; Shui et al. 2009). The wettability of the channels can be changed by
surface modification (Silvestrini et al. 2012; Jankowski et al. 2013), and by surfactants;
O/W and W/O emulsions can be produced in the same microfluidic device as a result of
changes in wettability due to surfactant adsorption (Dreyfus et al. 2003; Tan et al. 2008;
Tostado et al. 2011; Xu, Li, Tan, et al. 2006a). Shui et al. (2009) reported that surfactants
did not change wettability of their hydrophobic and modified hydrophilic borosilicate glass
chips, and this could be because the surfactant did not have affinity for these surfaces.
When the contact angle is not homogeneous across the wall, droplets might remain
attached, while heterogeneous wetting may also be intentionally applied to trigger phase
inversion at that specific spot (Shui et al. 2009). Several T-junctions with different wetting
properties can be placed in series to form (complex) double emulsions (Nisisako et al.
2005; Okushima et al. 2004). We refer the interested reader through to recent reviews on
this specific matter (Choi et al. 2014; Engl et al. 2008; Zhao 2013).
cos(𝜃𝜃) = 𝛾𝛾1,𝑤𝑤𝑤𝑤𝑤𝑤𝑤𝑤 − 𝛾𝛾2,𝑤𝑤𝑤𝑤𝑤𝑤𝑤𝑤
𝛾𝛾1,2 2.7

Review cross-flow microfluidics
39
Decreasing the continuous phase wettability only has a minor impact on droplet size. The
interfacial tension force decreases because the curvature at the front edge of the droplet
decreases, but this is balanced by a lower shear force because the surface of the emerging
droplet is flatter (Bashir et al. 2014; Chen et al. 2012; Liu & Zhang 2009). At low capillary
number the effect is larger, because the droplet has a larger contact area with the wall, and
surface adhesive forces become more important (Bashir et al. 2014). The effect of contact
angle in the squeezing regime is the same for bubbles as for droplets, as long as the liquid
phase completely wets the channel wall; however, absence of such a pre-wetting film can
lead to capillary instabilities and the formation of bigger bubbles. And in the dripping
regime, the bubble will adopt a cylindrical shape (Ben Abdelwahed et al. 2012; Wielhorski
et al. 2012).
Interfacial tension
The interfacial tension keeps droplets from detaching; at equal shear but lower interfacial
tension, smaller droplets are obtained (the droplet size scales with the capillary number)
(Bashir et al. 2014; Tan et al. 2009). The interfacial tension can be lowered by the
adsorption of surface-active ingredients, or by adjusting the composition of the phases (i.e.,
addition of alcohol to the aqueous phase). In the latter case, the interfacial tension has an
equilibrium value (e.g., constant over the process of droplet formation and detachment),
while in the former case, the interfacial tension can have a value ranging between that of a
fully covered interface and that of a completely bare interface. Adsorption of emulsifiers
occurs in three steps: 1) Transport (e.g., diffusion or convection) of the molecules towards
the sub-interface, 2) Adsorption of the emulsifier to the interface, 3) Possible structural
reorganisation of the emulsifier at the interface (Stang et al. 1994), which is especially
important for proteins (Zhai et al. 2013; Yano 2012).
In microfluidics, droplet formation and emulsifier adsorption often occur at comparable
time-scales. Hence, the actual interfacial tension during droplet formation depends on the
adsorption rate of surfactants, and on the expansion rate of the droplet. When surfactant
adsorption is slower than droplet formation, the interfacial tension is higher than the
equilibrium interfacial tension (Baret et al. 2009; Steegmans, Warmerdam, et al. 2009; van

Chapter 2
40
der Graaf et al. 2005), while in the opposite situation the interfacial tension will reach the
equilibrium value, which is also the case at high surfactant concentrations (Tan et al. 2009;
Tan et al. 2008). The actual value of the interfacial tension cannot be measured using
conventional tensiometric devices; a drop tensiometer takes much longer than the droplet
formation time to determine the value of the interfacial tension, but it can be measured with
cross-flow microfluidic devices. Nguyen et al. (2007) and Wang et al. (2009) reported the
use of T-junctions with which they could determine the interfacial tension in the
millisecond range. Steegmans et al. (2009) used Y-junctions with which the interfacial
tension within the sub-millisecond range could be determined; which are time-scales that
are relevant in industrial emulsification devices (Walstra 2003). In general, low molecular
weight emulsifiers (e.g., surfactants) have a higher diffusion coefficient and thus a shorter
adsorption time compared to high molecular weight emulsifiers (e.g., proteins), resulting in
a faster interfacial tension decrease (Glawdel & Ren 2012; Steegmans, Warmerdam, et al.
2009; Wang, Lu, Xu & Luo 2009). This implies that, when operating in the dynamic
interfacial tension regime, droplet size can be greatly influenced by surfactants. This can
also be deducted from the small droplets formed with low molecular weight surfactants at
high concentrations (Glawdel & Ren 2012).
Surfactant and protein adsorption to the interface not only influences droplet formation, but
also the subsequent stability of the formed droplet; droplet coalescence may be prevented
through droplet-droplet repulsive interactions (i.e., electrostatic and/or steric repulsion),
which primarily depend on the properties of the droplet surface. Depending on how fast the
surface is covered, droplets will be more or less protected against coalescence, as
demonstrated by Krebs and co-workers (2012b), who systematically varied process
conditions and emulsion formulation in microfluidic devices, and related that to
coalescence of droplets. It is worth mentioning that adsorption of surfactants during
transport of the droplet through a microfluidic channel may give an uneven distribution
over the interface, since surfactants are expected to accumulate at the upstream end of the
droplet (Baret et al. 2009); it is not known whether that has an effect on droplet stability.

Review cross-flow microfluidics
41
Fluid elasticity
Husny and Cooper-White (2006) were the first to investigate the behaviour of non-
Newtonian fluids in cross-flow microfluidics by adding a polymer, polyethylene oxide
(PEO), to the aqueous dispersed phase. The typical rapid pinch-off found for Newtonian
fluids was not found for a non-Newtonian dispersed phase; instead, droplet detachment was
retarded, and an elongated filament between the droplet and the dispersed phase was
formed. The elongated filament formed a secondary droplet after detachment. Elongated
filaments from a non-Newtonian dispersed phase were also reported by Li et al. (2013), but
they found different structures at very low interfacial tension (<0.1 mN/m) in the presence
of surfactants. The droplets deformed at the rear end and a tail was formed that further
fragmented into tiny satellites.
When using a non-Newtonian fluid as the dispersed phase, increasing the viscosity of the
continuous phase resulted in a smaller droplets, as was the case for Newtonian fluids (Gu &
Liow 2011; Husny & Cooper-White 2006). While the effect of the dispersed phase
viscosity was dependent on the elasticity; upon increasing the dispersed phase viscosity
droplet size decreased with a Newtonian dispersed phase, whereas droplet size increased
with a shear thinning dispersed phase (Gu & Liow 2011).
Fu et al. (2011) used a non-Newtonian fluid as the continuous phase for the production of
gas bubbles, and found that bubble size increased non-linearly with the flow rate ratio. With
a Newtonian fluid as continuous phase, bubble size increased linearly with the flow rate
ratio, but this is most probably caused by different bubble formation mechanisms. Bubbles
in the non-Newtonian fluid were formed in the dripping regime, whereas bubbles in the
Newtonian fluid were formed in the squeezing regime leading to different effects on bubble
size.
2.3.3. Scaling relations and mechanistic models
As discussed above, the effect of various parameters on the size of droplets (or bubbles)
have been experimentally investigated and reported for T-junctions. In order to make the
next step towards practical application, these results need to be summarised into scaling

Chapter 2
42
relations. Some are already known from literature, and we summarize them here, but more
work is needed in order to make them useful for food applications.
Thorsen et al. (2001) were the first to report the formation of emulsion droplets in a
microfluidic T-junction, and started with a droplet break-up model based on the balance of
shear stress and interfacial tension:
with r the radius of the droplet, γ the interfacial tension, ηc the viscosity of the continuous
phase and ε the shear rate. This scaling law links droplet size to the reciprocal capillary
number in the shear dominated dripping regime. Thorsen’s model was based on a one-step
mechanism, but soon after other models were proposed that were based on a two-step
mechanism where the growth and detachment phases both influence the final droplet
volume, for example Van der Graaf et al. (2006):
with Vcrit,ref the volume added during the growth phase at a capillary number of 1, tneck,ref the
time detachment takes at a capillary number of 1, and m and n are fitting parameters that
are device specific. Later work, in which data from various sources were combined, also
stated that droplet formation occurs in two stages (Steegmans, Schroën, et al. 2009b).
Garstecki et al. (2006) proposed a scaling relation for droplets produced in the squeezing
regime:
with L the length of the plug, wc the width of the continuous phase channel, Dneck the
diameter of the neck, and Φ the flow rate ratio. Droplet size depends on the confined
channel geometry and the flow rate ratio, however the model was limited to the used
conditions (capillary numbers < 0.01, width ratio of the dispersed and continuous phase
channel below 0.5, and height of the main channel smaller than the width).
𝑟𝑟 ~ 𝛾𝛾𝜂𝜂𝑐𝑐𝜀𝜀
2.8
𝑉𝑉 = 𝑉𝑉𝑐𝑐𝑐𝑐𝑐𝑐𝑐𝑐,𝑐𝑐𝑟𝑟𝑟𝑟 𝐶𝐶𝐶𝐶𝑚𝑚 + 𝑡𝑡𝑛𝑛𝑟𝑟𝑐𝑐𝑛𝑛,𝑐𝑐𝑟𝑟𝑟𝑟𝜑𝜑𝑑𝑑𝐶𝐶𝐶𝐶𝑛𝑛 2.9
𝐿𝐿𝑤𝑤𝑐𝑐
= 1 +𝐷𝐷𝑛𝑛𝑟𝑟𝑐𝑐𝑛𝑛𝑤𝑤𝑐𝑐
ϕ 2.10

Review cross-flow microfluidics
43
Christopher et al. (2008) proposed a model similar to that of Garstecki et al. (2006) for the
transition between the squeezing and dripping regime; for this the model of Garstecki was
extended with the capillary number and the channel width ratio:
where b is the length of the emerging droplet, and Λ the channel width ratio. The length of
the emerging droplet at detachment can be calculated with the capillary number:
The model fits well with experimental data at low capillary number and when the viscosity
of both phases are similar, but under-predicts the droplet volume at higher capillary
numbers, and fails at high viscosity ratio, possibly as a result of a missing aspect ratio
(Glawdel et al. 2012).
The model was further extended by van Steijn et al. (2010), who moved towards a
theoretical model for the squeezing regime, which also includes the influence of the device
geometry:
𝑉𝑉� =𝑉𝑉
𝑤𝑤𝑐𝑐2ℎ= �
𝑏𝑏𝑤𝑤𝑐𝑐�2
+ Λϕ 2.11
�1 −𝑏𝑏𝑤𝑤𝑐𝑐�3
=𝑏𝑏𝑤𝑤𝑐𝑐
∙ Ca 2.12
𝑉𝑉� =𝑉𝑉
𝑤𝑤𝑐𝑐2ℎ=𝑉𝑉𝑔𝑔𝑐𝑐𝑔𝑔𝑤𝑤𝑐𝑐ℎ𝑤𝑤𝑐𝑐2ℎ
+ 𝛼𝛼𝛼𝛼 = 𝑉𝑉�𝑔𝑔𝑐𝑐𝑔𝑔𝑤𝑤𝑐𝑐ℎ + 𝛼𝛼𝛼𝛼
2.13
𝑉𝑉�𝑔𝑔𝑐𝑐𝑔𝑔𝑤𝑤𝑐𝑐ℎ =3𝜋𝜋8−𝜋𝜋2�1 −
𝜋𝜋4� Γ
2.14
for wd ≤ wc
𝑉𝑉�𝑔𝑔𝑐𝑐𝑔𝑔𝑤𝑤𝑐𝑐ℎ = �𝜋𝜋4−
12
arcsin �1 −1Λ�� (Λ)2 −
12
(Λ − 1)(2Λ − 1)12 +
𝜋𝜋8
−12�1 −
𝜋𝜋4� ��
𝜋𝜋2− arcsin �1 −
1Λ��Λ +
𝜋𝜋2� Γ
2.15
for wd > wc

Chapter 2
44
where Vgrowth is the volume added during the growth phase, αΦ is the volume added during
detachment, ϵ is a measure for the curvature of the corner at the junction and is 0 for the
sharp-edged T-junctions that are discussed in this review, and Γ is the aspect ratio. The
model is able to accurately predict droplet size for specific conditions, as experimentally
verified by Schneider et al. (2011). They also pointed out that the model is based on
experiments with an interfacial tension of 17.9 mN/m and that the change in droplet
curvature is hard to predict, therewith limiting the use of the model (Schneider et al. 2011).
Another two-step model with a growth and detachment phase was proposed by Yeom and
Lee (2011b), who incorporated the viscosity effect of both phases in the volume added
during detachment:
with Dhead the diameter of the head of the emerging droplet, λ the viscosity ratio, υ the
superficial velocity ratio (vd/vc), w the width of continuous and dispersed phase channels,
and CA, CB, CC, m, and n were fitting parameters.
Finally, Glawdel and co-workers (2012) developed a three-step model for the transitional
squeezing to dripping regime where they included the effects of interfacial tension and flow
conditions; their model consisted of a lag, filling, and necking stage. During the lag stage,
𝛼𝛼 = �1 −𝜋𝜋4� �1 −
𝜑𝜑𝑔𝑔𝑔𝑔𝑐𝑐𝑐𝑐𝑟𝑟𝑐𝑐𝜑𝜑𝑐𝑐
�−1��𝑅𝑅𝑑𝑑𝑟𝑟𝑐𝑐𝑤𝑤𝑐𝑐ℎ𝑤𝑤𝑐𝑐
�2
− �𝑅𝑅𝑔𝑔𝑐𝑐𝑔𝑔𝑤𝑤𝑐𝑐ℎ𝑤𝑤𝑐𝑐
�2
+𝜋𝜋4�𝑅𝑅𝑑𝑑𝑟𝑟𝑐𝑐𝑤𝑤𝑐𝑐ℎ𝑤𝑤𝑐𝑐
−𝑅𝑅𝑔𝑔𝑐𝑐𝑔𝑔𝑤𝑤𝑐𝑐ℎ𝑤𝑤𝑐𝑐
� Γ�
2.16
𝑅𝑅𝑔𝑔𝑐𝑐𝑔𝑔𝑤𝑤𝑐𝑐ℎ = max (𝑤𝑤𝑑𝑑 ,𝑤𝑤𝑐𝑐)
2.17
𝑅𝑅𝑑𝑑𝑟𝑟𝑐𝑐𝑤𝑤𝑐𝑐ℎ = 𝑤𝑤𝑐𝑐 + 𝑤𝑤𝑑𝑑 − �ℎ𝑤𝑤𝑐𝑐ℎ + 𝑤𝑤𝑐𝑐
− 𝜖𝜖�
+ �2�𝑤𝑤𝑑𝑑 − �ℎ𝑤𝑤𝑐𝑐ℎ + 𝑤𝑤𝑐𝑐
− 𝜖𝜖���𝑤𝑤𝑐𝑐 − �ℎ𝑤𝑤𝑐𝑐ℎ + 𝑤𝑤𝑐𝑐
− 𝜖𝜖���
1/2
2.18
𝑉𝑉 = 𝐶𝐶𝐴𝐴𝐷𝐷ℎ𝑟𝑟𝑤𝑤𝑑𝑑3 + 𝐶𝐶𝐵𝐵𝐷𝐷ℎ𝑟𝑟𝑤𝑤𝑑𝑑𝜐𝜐[1 + 𝐶𝐶𝐶𝐶𝜆𝜆𝑚𝑚𝜐𝜐𝑛𝑛]𝑤𝑤2 2.19

Review cross-flow microfluidics
45
the interface recedes back into the dispersed phase supply channel. This stage is very short
and is not of large influence on droplet volume (~ 0-5 %) but does influence droplet
spacing and thus production frequency. The authors took the model of Christopher et al.
(2008) as a starting point, and extended it to include the aspect ratio and the viscosity ratio
to predict droplet size.
2.4. Food perspective
2.4.1. Production
Clearly, there is a gap between fundamental research as carried out with microfluidics, and
the application of that knowledge to complex, multi-component foods produced at large
scale. Here we propose to speculate on the use of microfluidic techniques to get insights in
the behaviour of food components at dimensions and time-scales that are otherwise not
feasible. And although emulsification with cross-flow microfluidics is still quite new, the
effect of channel dimensions, shear forces, and interfacial forces on droplet production has
already been extensively studied, as summarised earlier. Based on this knowledge, we can
tentatively extend these effects to what is expected for food-grade systems.
Microfluidic devices
Most food emulsions are O/W, and this implies that polymeric microchips would need to be
hydrophilised in order to be used for O/W emulsion production. Alternatively, hydrophilic
silica or glass chips can be used, but as glass traces cannot be monitored, these are not the
first option for the production of food-grade emulsions. The preferred material for the food
industry would be metal, because its use for food processing is widely accepted. First
attempts have been made by Maan et al. (2013), who worked on semi-metal chips (glass
coated with copper or copper/nickel); but eventually, chips will most probably need to be
constructed in stainless steel in order to be useful for the food industry.
If smaller droplets are required, as is customary for foods in which creaming would need to
be prevented, the throughputs would considerably decrease since the channel size, that co-
determines the size of the droplets formed, would need to be accordingly decreased, leading
to higher applied pressures (that are still much lower than in traditional emulsification). The

Chapter 2
46
current channel dimensions are far from the technical limits (100 nm and less), so there is
room to move closer to the targets relevant for food applications.
Fluids and ingredients
Food oils have a relatively high viscosity, but sunflower oil (η = 49 mPa∙s at 25 °C) and
olive oil (η = 63 mPa∙s at 25 °C) are within the probed range (Abramovic & Klofutar 1998).
Furthermore, food oils also contain other components than just triglycerides, such as anti-
oxidants, pigments, free fatty acids, mono- and diglycerides, and phospholipids (Gunstone
2011), and such impurities may lead to a lower interfacial tension during emulsification,
which will affect droplet formation, and possibly also droplet stability in a later stage. Also
the very first steps were made using shear thinning liquids (Fu et al. 2011; Gu & Liow
2011; Husny & Cooper-White 2006; Li et al. 2013) and the results showed that these
liquids can be used and effects captured, but the field is not that developed. This holds even
more for the behaviour of components in the interface, which can lead to specific
rheological surface behaviour. This has not been investigated in microfluidic systems to the
best of our knowledge.
In microfluidic channels, low molecular weight surfactants have been used successfully
before (Dreyfus et al. 2003; Shui et al. 2009; Tan et al. 2008; Tostado et al. 2011; Xu, Li,
Tan, et al. 2006a); however adsorption of these components to the channel wall may alter
wettability (Xu, Li, Tan, et al. 2006a). On the one hand, this may be an asset, as it can be
used to intentionally modify the channels, however adsorption can also have a negative
effect and emulsification may not even be possible anymore. Food proteins have thus far
not been used in microfluidic devices, but it is known that proteins adsorb to glass and
silica channel walls (Sharma et al. 2003), and this may make surface modification
necessary to retain proper wettability.
Besides surface-active ingredients, also colloidal particles can be used to physically
stabilise emulsion droplets, which is referred to as Pickering emulsification (Dickinson
2012). So far, the production of Pickering emulsions was only tested with a flow focusing
microfluidic device, and the presence of particles did not alter the droplet formation
mechanism (Priest et al. 2011), so that could be a convenient emulsion type to work with in
combination with microfluidic devices. T-junctions were used to successfully produce

Review cross-flow microfluidics
47
Pickering stabilised gas bubbles (Park et al. 2009). To the best of our knowledge, no bio-
based, food-grade particles have been used in microfluidic emulsification yet, but one could
think of using cellulose crystals, chitin crystals, protein particles or starch particles
(Dickinson 2012). Another option is to produce particles themselves within microfluidic
devices (Berton-Carabin & Schroën 2015; J. T. Wang et al. 2011).
Up-scaling
Up-scaling of microfluidic devices in order to meet industrial demands is still a major
challenge, and not much literature is available. Nisisako and co-workers (Nisisako & Torii
2008; Nisisako et al. 2012) are one of the few reporting on up-scaling of cross-flow
microfluidic devices. They presented a module with 144 droplet formation units, with
which they were able to produce emulsion droplets with an average diameter of 91 μm and
a coefficient of variation of 2%. Needless to say that this size is way too big for food
applications, but it is a start. Spontaneous emulsification devices have also been scaled up
to some extent, with as much as 196 EDGE devices working simultaneously, using food-
grade components, even though the throughputs were still relatively low. Straight through
emulsification devices have also been scaled up within the group of Nakajima and
Kobayashi in Japan (Vladisavljevic et al. 2012); more information on how various devices
compare can be found in the work of Schroën and co-workers (2004).
The industrial perspective of large scale microfluidic droplet generation has been reviewed
by Holtze (2013). From this work, and our own analysis, it is clear that microfluidic devices
seem far from implementation at an industrial scale. Yet, it should also be mentioned that
other microstructured emulsification systems based on membranes have already been
applied both in the pharmaceutical and food fields, although at relatively small scale and for
products with high added value. One could also think of specialty products such as multiple
emulsions, particles, gels and capsules that all can be made using microfluidic techniques,
but have not yet been demonstrated at larger scale (Capretto et al. 2013; Charcosset 2009;
Engl et al. 2008; Mazzitelli et al. 2013; Nisisako et al. 2005; Okushima et al. 2004; Skurtys
& Aguilera 2008; van Swaay & DeMello 2013; Vladisavljević et al. 2013; Vladisavljevic et
al. 2012; J. T. Wang et al. 2011; Zhao 2013). Examples of encapsulated components in

Chapter 2
48
food are: polyphenols (Fang & Bhandari 2010), probiotic bacteria (Heidebach et al. 2012)
and lipids (Corstens et al. 2015).
Alternatively, novel production systems, such as metal sieves used in combination with
glass beads, can also be used for high throughput production of emulsions containing food-
grade components (Nazir, Boom, et al. 2014). Such systems have proved suitable for the
production of double emulsions (Sahin et al. 2014) and foams (Nazir, Maan, et al. 2014).
Rotating systems, such as suggested by Schadler and Windhab (2006) and Aryanti et al.
(2006), could also be interesting routes to push microstructured devices further towards
application on a larger scale.
2.4.2. Analytical tool
Apart from the production of emulsions, microfluidics also have the potential to be used as
an analytical tool to study the mechanisms of emulsification, including dynamic effects that
occur at extremely short time-scales, as recently reviewed by us (Muijlwijk et al. 2015). As
mentioned before, emulsification efficiency depends on the balance between the adsorption
time of emulsifiers, and the collision events between droplets. Currently, only limited data
is available on adsorption of food surfactants and proteins at the time-scale relevant for
homogenisation (i.e., the sub-millisecond to millisecond range), and Y-junctions seem to be
capable of probing that range (Steegmans, Warmerdam, et al. 2009). In this work, it was
demonstrated that these devices can be used to capture dynamic interfacial tension effects
of simple surfactants. It is expected that this method can also be used to capture the effect
of shear thinning and shear thickening liquids on the emulsification mechanism, and
possibly this can even be extended to surface rheology during emulsification.
The stability of food emulsion droplets from the production stage to their end-use (i.e., the
consumer’s plate) is essential for determining the shelf life of the product, and also for this
microfluidic devices can be used. Stability tests are usually based on size measurements
after production or storage, or after an accelerated test that is supposed to mimic long term
storage. Using so-called microfluidic coalescence channels, the stability of emulsion
droplets during production can be assessed on a single droplet level, and this has been
demonstrated for simple surfactants (Krebs et al. 2012b; Krebs et al. 2012a). Accelerated

Review cross-flow microfluidics
49
storage tests are also possible with microfluidics, for instance by using a micro-centrifuge
(Krebs, Ershov, et al. 2013); it is expected that both tests can directly be applied to food
surfactants at the stage of production. In our view, microfluidic devices make it possible to
follow and model coalescence of droplets, and provide insight in the demulsification
process; and in that respect they are useful tools to improve process conditions and/or
ingredient formulation. Regarding storage of food, it should be mentioned that food
products are complex, and generally they are non-equilibrium systems, with a viscoelastic
matrix and interface, which makes it difficult to understand and control ageing phenomena;
and this would be true for any analytical tool that is to be used. Obviously, the here
discussed microfluidic tools can also be used to analyse the coalescence behaviour of aged
products, and centrifugation may give an impression of the behaviour of aged products, but
predicting the effect of aging ab initio will be extremely challenging.
In summary, microfluidic tools have the potential to help optimise ingredient formulation of
emulsions, and that is not only true for simple emulsions but also for more complex
systems such as foods in which complex interfaces with viscoelastic behaviour are present.
2.5. Conclusions The advantages of the use of microfluidics for emulsion production are the use of low shear
and related to that less energy, and the production of well-defined emulsions with narrow
size distribution. However, the technique is still in its early development stages, and most
of the research so far has been conducted on model, non-food systems.
Using food-grade materials will be the first step towards further use of microfluidics on
large scale; first attempts at up-scaling by parallelisation have been undertaken, and
microfluidics could be a promising option for the production of specialty products such as
multiple emulsions, capsules, particles, gels and emulsions with low heat stability.
Microfluidics can also be used as an analytical tool to investigate the early stages of
emulsifier adsorption in depth, and to probe stability of emulsion droplets in great detail at
short time-scales. This could lead to ab initio optimisation of formulation and process
conditions of conventional food emulsion processes, and possibly give a further boost to
up-scaling of microfluidics.

Chapter 2
50
2.6. Appendix Table A2.1. Overview of reported channel dimensions, liquids and their viscosities, emulsifiers and interfacial tension and the resulting droplet diameter and dimensionless volume.
Reference wd (μm) wc (μm) h (μm)
angle (°) Disperse phase Continuous phase ηd (mPa s)
ηc (mPa s) Emulsifier γ (mN/m)
D (μm)a Vd (-)b
(Christopher et al. 2008) 65-375 150 50
90 water silicone oil 1 6-350 - 45.6 ND 0.3-2
(Garstecki et al. 2006)
50 and 100 50-200 33 and 79
90 water silicone oil 0.9 10 and 100 2% emulsifier ND 20-45 0.8-9.3
(van der Graaf et al. 2005)
24 303 5
90 hexadecane water, 2.5-49% ethanol-water
ND 1-2.65
0.25-1% SDS, 0.001-1% Tween20 4.8-44 5-7.5 0.008-0.03
(Tostado et al. 2011)
200 300 hd=50 hc=200
90 water corn oil 1 67 0.001-0.01% CTAB 0.1-24 41-178 0.13-10.5
(Thorsen et al. 2001) 35 35 6.5
90 water decane, tetradecane and hexadecane
1 ND 0.5-2% span80 ND 10 - 40 4.2-269
(Li et al. 2012) 100 100 80
90 glycerin silicone oil 1 ND - 12.5 27-33 0.8-1.6
(Tarchichi et al. 2013)
10-50 50 and 100 23-72
90 silicone oil water 39 1 - 100 34-88 1.8-32
(Shui et al. 2009) 20 20 20
90 hexadecane water ND 1
0.2% SDS, 0.1% Tween80, 0.02% Span80
< 0.1 - 50 ND ND
(Wehking et al. 2013) 55-150 111-300 100
90 water, FC-43, alumina oxide suspensions silicone oil 1-20
10-100 - 5.4-43 39-65 1-1.2

Review cross-flow microfluidics
51
Reference wd (μm) wc (μm) h (μm)
angle (°) Disperse phase Continuous phase ηd (mPa s)
ηc (mPa s) Emulsifier γ (mN/m)
D (μm)a Vd (-)b
(Glawdel et al. 2012) 33-100 100 30-60
90 10-70% glycerol-water silicone oil 1.21-17.1
10.2 - 34-37 21-30 1-2
(Yeom & Lee 2011a) 30-90 90-270 38-92
30-150 24% glycerol-water PFO/FC-3283 2.7
2.3 - 10 70-240 1-2
(Steegmans, Schroën, et al. 2009a)
23 23 5
97 hexadecane water, 9-66% ethanol-water
3.3 0.9-2.6 - 9.6-41 4-16 0.8-52
(Abate et al. 2009) 15 15 15
90-135 water HFE-7500 oil 0.9
0.77 1.8% ammonium carboxylate 2-5 4-5 0.6-1.5
(Steegmans, De Ruiter, et al. 2010)
13-20 13-20 5
97
40% pentane-hexadecane, hexadecane, 60% capric acid-hexadecane, paraffin oil
water, 20-50% glycerol-water, 9-28% ethanol-water
1-105 1-6.2 - 12-55 4-20 1-148
(Steegmans, Schroën, et al. 2010)
18-24 18-23 and 303 5
49-131 hexadecane water, 9-66%
ethanol-water 3.5 1-2.7 - 7-41 4-30 0.6-57
(Husny & Cooper-White 2006)
27.5 275 100
90
water, 50 wt. % glycerol-water, polyethylene oxide-glycerol-water
silicone oil 1 and 6 5-50 - ND 41-59 0.3-0.9
(Yeom & Lee 2011b) 90 90 90
90 PFO/FC-3283 (1:10), PFO/PPP (1:10)
24-64% glycerol-water
2.7 and 19 2.3 and 18 - 10.6-
13.4 80-130 24-101
(Gu & Liow 2011)
200 400 hd=100 hc=200
90 water, 30+50 wt.% glycerol-water, 0.01-0.5 % xanthan gum
canola oil, paraffin oil, silicone oil
0.18-5.5 ND 0.5% Tween80 6.5-12.7 100-
400 1-67
(Glawdel & Ren 2012) 50 and 100 100
90 water silicone oil 1 ND
0.5-3% SDS, 0.1-2% Tween20
9.4 and 10.3 20-31 0.5-2

Chapter 2
52
Reference wd (μm) wc (μm) h (μm)
angle (°) Disperse phase Continuous phase ηd (mPa s)
ηc (mPa s) Emulsifier γ (mN/m)
D (μm)a Vd (-)b
50
(Steegmans, Warmerdam, et al. 2009)
18 18 5
97 hexadecane water, 9-28% ethanol-water
3.5 1-3
0.03-3% SDS, 0.025-5% synperonic PEF108 5-41 8-13 0.2-0.8
(Li et al. 2013) 100 100 60
90 sodium salicylate-water, polyacrylamide-water
silicone oil 0.25-1.2 69.5
cetyltrimethylammonium chloride 0.04-9.7 ND ND
(Garstecki et al. 2006) 50 50-200 33
90 nitrogen water, 52-62 % glycerol-water
- 0.9-11 2% Tween20 35-72 ND ND
(Fu et al. 2010) 120 120 40
90 nitrogen water, 25-62% glycerol- water
- 0.92-10.2 0.1-0.5% SDS 31.5-72 26-34 1-2.3
(Fries & Rudolf von Rohr 2009)
67-400 200-400 150-230
45-135 nitrogen ethanol -
65-500 - ND 9-20 0.004-0.03
(Fu et al. 2011) 120 120 40
90 nitrogen 0.1-0.5% polyacrylamide-water
ND - ND ND ND
a D is the unrestricted three dimensional droplet diameter b Vd=V/wc
2h ND = not determined


This chapter has been published as Muijlwijk, K.; Hinderink, E.; Ershov, D.; Berton-
Carabin, C.; Schroën, K., Interfacial tension measured at high expansion rates and within
milliseconds using microfluidics, Journal of Colloid and Interface Science, 470, 71-79,
2016
3 3. Interfacial tension measured at
high expansion rates and within
milliseconds using microfluidics

Chapter 3
56
3.1. Abstract To understand droplet formation and stabilisation, technologies are needed to measure
interfacial tension at micrometer range and millisecond scale. In this paper,
microtechnology is used, and that allows us to access these ranges and derive a model for
surfactant free systems. The predicting power of the model was tested, and we found that it
can be used to accurately (validated with > 60 experiments) describe droplet size for a wide
range of flow rates, interfacial tensions, and continuous phase viscosities.
The model was used next to determine interfacial tensions in a system with hexadecane and
sodium dodecylsulfate (SDS) solutions, and it was found that the model can be used for
droplet formation times ranging from 0.4 to 9.4 milliseconds while using a wide range of
process conditions.
The method described here differs greatly from standard interfacial tension methods that
use quiescent, mostly diffusion-limited situations. The effects that we measured are much
faster due to enhanced mass transfer; this allows us to assess the typical time-scales used in
industrial emulsification devices.

Microfluidic tensiometer
57
3.2. Introduction Many products (e.g., milk, mayonnaise, dressings, paint, and shampoo) are emulsion-based
systems. They are generally made using high shear devices that induce fast droplet break-
up (i.e., in the sub-millisecond range) in the presence of surfactants (Walstra et al. 2005).
Surfactants have two roles: they decrease the oil-water interfacial tension so that small
droplets can be formed, and they further stabilise the droplets through formation of an
interfacial layer that provides steric and/or electrostatic repulsion (Walstra et al. 2005).
Surfactant adsorption can be divided into three steps: 1) transport (e.g., diffusion and/or
convection) of the molecules towards the sub-interface, 2) diffusion through the sub-
interface, 3) kinetic adsorption of the surfactant at the interface (Brösel & Schubert 1999).
Depending on the interface expansion rate and surfactant adsorption time, the interfacial
tension can be higher than the equilibrium interfacial tension during emulsification. The
interfacial tension may even be equal to the interfacial tension of the corresponding bare
liquid-liquid interface when surfactant adsorption takes more time than droplet formation.
Conversely, when the adsorption time is in the same order of magnitude or faster than
droplet formation, the interfacial tension ranges between that of a bare interface and that of
a fully covered interface (i.e., the equilibrium interfacial tension).
During large scale emulsification, surfactant adsorption occurs at similar time-scales as
droplet break-up (Walstra et al. 2005), therefore also immediate coalescence can occur
when the interface is not timely stabilised, and this leads to over-processing (Jafari et al.
2008). Quantifying interfacial tension could be of great significance for emulsification
processes, since this provides information on the adsorption time of surfactants and, related
to that, the time needed for interface stabilisation. The interfacial tension can be measured
with commercial techniques such as the oscillating jet and maximum bubble pressure
method, that are both able to measure in the millisecond range (Miller et al. 1994).
Microfluidic devices can also be used for interfacial tension measurements (Wang, Lu, Xu
& Luo 2009; Brosseau et al. 2014; Xu et al. 2012; Wang et al. 2014; Steegmans,
Warmerdam, et al. 2009). The tensiometric measurements of Wang et al. (2009) and
Steegmans et al. (2009) were both conducted in cross-flow microfluidic devices and were
based on the relation between droplet size and interfacial tension; the former is able to
measure in the millisecond range and the latter in the sub-millisecond range, due to
differences in geometry. The method of Xu et al. (2012), with a coaxial microfluidic

Chapter 3
58
device, is based on the same principle as those of Steegmans et al. (2009) and of Wang et
al. (2009). Other microfluidic methods to measure the interfacial tension are based on
droplet deformability after formation (Brosseau et al. 2014) and on the pressure drop during
droplet formation (Wang et al. 2014). Only the method of Steegmans et al. (2009) was able
to measure the interfacial tension in the sub-millisecond to millisecond time-scale.
Please note that the conditions in most traditional methods used to elucidate interfacial
tension are quiescent: the interfacial area remains the same and there is no flow of the
surrounding liquid. In microfluidic methods adsorption during droplet formation is most
probably measured under enhanced mass transfer conditions. Fast droplet break-up may
cause the formation of eddies, resulting in local non-laminar flow conditions and thus
convective transport towards the sub-surface. Transport towards the sub-surface is,
therefore, assumed to be fast and adsorption is determined by diffusion through the sub-
surface and interface expansion rate. Diffusion through the sub-surface might be enhanced
during Y-junction emulsification because the shear force from the continuous phase reduces
the sub-surface thickness (Rayner et al. 2005) and because of the curved interface (Anna
2016). To distinguish the two methods, the interfacial tension measured under dynamic
mass transfer conditions is referred to as the acting interfacial tension (γa).
In the present work, we used droplet formation in a microfluidic Y-junction as was done by
Steegmans et al. (2009), and we evaluated the droplet formation mechanism in detail. Van
der Graaf et al. (2006) proposed a two-step model to describe droplet formation in a cross-
flow T-junction device, comprising of a growth and detachment step (Equation 3.1). The
volume added during both steps depended on the capillary number (Ca), which is the
balance between shear and interfacial tension forces (Equation 3.2), and the volume added
during the detachment step scaled linearly with the dispersed phase flow rate.
where Vcrit,ref and tneck,ref are the reference critical volume and necking time, x a fitting
parameter, ηc the continuous phase viscosity, vc the continuous phase velocity, γ the
interfacial tension, and φd the dispersed phase flow rate.
𝑉𝑉 = 𝑉𝑉𝑐𝑐𝑐𝑐𝑐𝑐𝑐𝑐,𝑐𝑐𝑟𝑟𝑟𝑟Cax + 𝑡𝑡𝑛𝑛𝑟𝑟𝑐𝑐𝑛𝑛,𝑐𝑐𝑟𝑟𝑟𝑟𝜑𝜑𝑑𝑑Cax 3.1
Ca =𝜂𝜂𝑐𝑐𝑣𝑣𝑐𝑐𝛾𝛾
3.2

Microfluidic tensiometer
59
In the work of Steegmans et al. (2009a) a Y-shaped junction was used, and for the rather
limited experimental conditions that were probed it was suggested that the droplet size
could be described with a one-step model, corresponding to Equation 3.1 without the
detachment step. Since we aim to extend the process conditions considerably compared to
those used in earlier investigations, we consider both models, and investigate which one
describes our situation best.
The current research aims to measure the acting interfacial tension in the sub-millisecond to
millisecond range under dynamic mass transfer conditions. To do so, the method of
Steegmans et al. (2009) was used as a starting point, and further refined for a wide range of
experimental conditions. The model for droplet formation in Y-junctions was statistically
validated using > 60 experiments. As a proof of concept, adsorption of sodium
dodecylsulfate (SDS) at the oil-water interface was measured for various flow rates at the
specified time-scales.
3.3. Experimental
3.3.1. Materials
Anhydrous hexadecane > 99% pure (Sigma-Aldrich, USA) was used in all experiments as
the dispersed phase. Water was first filtered and deionised with a Milli-Q system (Q-POD
with Millipak Express 40 0.22 μm filter, Merck Millipore, USA). For the continuous phase,
water, 9 and 28 wt. % ethanol solutions, 20 and 30 wt. % glycerol solutions, and 20 and 25
wt. % sucrose solutions were used. Ethanol was 99.9% pure (Merck, USA), glycerol > 99%
pure (Acros Organics, USA) and sucrose ≥ 99.0% pure (Fluka, Germany). Sodium
dodecylsulfate > 99% pure (Sigma-Aldrich, USA) was used as surfactant in aqueous
solutions of 0.01, 0.05, 0.1, 0.3, 0.5 and 1 wt. %. For microfluidic experiments, all aqueous
liquids were filtered with a 0.2-μm cellulose filter (13/0.2 RC, Whatman Spartan, UK)
before use.

Chapter 3
60
3.3.2. Methods
Characterisation of dispersed and continuous phases
Viscosity
The viscosity of the tested continuous phases (η) was measured in duplicate with a
rheometer (MCR 502, Anton Paar, Austria) equipped with a Couette cell (C-DG26,7/T200,
Anton Paar, Austria). The average viscosity was calculated from 20 measurements during
rate sweeps between 1 and 100 s-1 at 20 ºC (Table 3.1). Each measurement was taken at the
end of a period, the period time decreased from 20 s to 5 s during the experiment.
Interfacial tension
Equilibrium interfacial tension at the hexadecane-continuous phase interface was measured
with an automated drop tensiometer (ADT, Teclis ITconcept, France) (Table 3.1). A rising
oil droplet of 3-25 μL was formed at the tip of a syringe in a cuvette filled with 25 mL
aqueous solution at 20 ºC.
Table 3.1. Viscosity and interfacial tension against hexadecane at 20 ºC.
Sample η (mPa∙s) γow (mN/m)
Water 0.98 44.0
9.0 wt. % Ethanol-water 1.42 31.6
28.0 wt. % Ethanol-water 2.52 16.0
20.0 wt. % Glycerol-water 1.78 41.1
30.0 wt. % Glycerol-water 2.52 36.7
20.0 wt. % Sucrose-water 2.07 42.7
25.0 wt. % Sucrose-water 2.42 42.0
0.01 wt. % SDS 1.01 29.6b
0.05 wt. % SDS 1.00 20.8b
0.1 wt. % SDS 1.00 13.5b
0.3 wt. % SDS 1.06 8.3b
0.5 wt. % SDS 1.09 7.9b
1.0 wt. % SDS 1.09 6.2b
Hexadecane 3.47a -
a From reference (Griesbaum et al. 2012) b Equilibrium interfacial tension

Microfluidic tensiometer
61
Microfluidic set-up
Microfluidic Y-junction device
Borosilicate glass chips were used for the microfluidic experiments (Micronit
Microfluidics, The Netherlands). Channels with a width (w) and depth (z) of 19 and 5.3 μm,
respectively, were etched in the lower plate onto which the upper plate with inlets was
annealed. The junction of the continuous and dispersed phase channel had a Y-shape with
an angle of 97º between the continuous and dispersed phase channel. The distance from the
junction to the collection area was 0.45 mm (Figure 3.1).
Figure 3.1. Outline of the used microfluidic Y-junction: A) continuous phase channel, B) dispersed phase channel, C) post-junction channel, and D) collection area.
Droplet formation experiments
The microfluidic chip was placed in a chip holder (Micronit Microfluidics, The
Netherlands). The continuous and dispersed phase entered the chip through capillaries of
fused silica (Polymicro Technologies, USA) with an inner diameter of 150 μm, and with an
inline microfilter of 0.5 μm placed in the middle (M-120X, IDEX Health and Science,
USA). The continuous phase capillary was connected to a glass syringe of 1 mL (SGE,
Australia), and the dispersed phase capillary was connected to a 1.5-mL microtube with a
microfluidic adapter (Elveflow, France). The continuous phase flow rate (50-300 μL/h) was
controlled with a syringe pump (NE-300, Prosense, The Netherlands). The dispersed phase
pressure (1-6.3 bar) was controlled with the OB1 MkII pressure & flow controller
(Elveflow, France).
Images were recorded with a high-speed camera (MotionPro Y4-S2, IDT, USA) connected
to an inverted light microscope (Axiovert 200 MAT, Carl Zeiss, The Netherlands). Per
experiment, two movies were recorded of 1000 images each. The first one was recorded at
a variable frame rate (typically between 1000 and 90,000 s-1), which corresponds to 25
frames per droplet, and is needed for accurate determination of the droplet size and flow
rates. The second movie was recorded at a set frame rate of 70,000 s-1 for droplet formation

Chapter 3
62
mechanism analysis, which is needed to distinguish between the dripping, transition and
jetting regime.
Image analysis
Droplet size, flow rates, and droplet formation characteristics were determined with a
custom-written script in Matlab R2010a with the image processing toolbox (Mathworks,
USA).
Droplet size
The area of 30 droplets was determined. Droplets were disk-shaped because the channel
depth was smaller than the droplet diameter. The two-dimensional droplet area (A2D) was
measured and used to calculate the two-dimensional droplet diameter (D2D) from which the
droplet volume (V) was calculated with Equation 3.3 where z is the channel depth
(Steegmans, Schroën, et al. 2009a). The average coefficient of variation was 0.6%, which
implies that the droplets are very monodisperse.
Flow rates
The dispersed phase was pushed in the microfluidic channel at pressures between 1.0 and
6.3 bar. The flow rate was determined using image analysis; the droplet formation time
(tdrop) was taken from the number of frames needed for 25 droplets to be formed at a given
frame rate (frec), and the dispersed phase flow rate (φd) was subsequently calculated from
the average droplet volume and the droplet formation time (Steegmans, Schroën, et al.
2009a):
where ni is the frame number just after detachment of the previous droplet, ni+25 the frame
number just after detachment of the 25th droplet.
The actual continuous phase flow rate (φc) was experimentally determined for each
recording, assuming that the velocity in the post-junction channel is equal to the average
𝑉𝑉 =𝜋𝜋𝜋𝜋4
(𝐷𝐷2𝐷𝐷 − 𝜋𝜋)2 +𝜋𝜋2𝜋𝜋2
8�𝐷𝐷2𝐷𝐷 − �1 −
43𝜋𝜋� 𝜋𝜋� 3.3
𝑡𝑡𝑑𝑑𝑐𝑐𝑔𝑔𝑑𝑑 =𝑛𝑛𝑐𝑐+25 − 𝑛𝑛𝑐𝑐
25𝑓𝑓𝑐𝑐𝑟𝑟𝑐𝑐 3.4
𝜑𝜑𝑑𝑑 =𝑉𝑉
𝑡𝑡𝑑𝑑𝑐𝑐𝑔𝑔𝑑𝑑 3.5

Microfluidic tensiometer
63
velocity of 30 droplets (Steegmans, Warmerdam, et al. 2009). The average coefficient of
variation for the continuous phase flow rate was 0.5%.
Droplet formation mechanism characteristics
The images recorded at 70,000 frames s-1 were used, and every second-to-last frame before
detachment was analysed. The length of the neck (Lneck) and the length of the head (Lhead)
measured from the junction corner were determined with the Matlab script (Figure 3.2).
The relative neck length (Lneck,r) was calculated with Equation 3.6, and based on that a
distinction could be made between the different regimes.
Figure 3.2. Picture of the second-to-last frame before detachment of a droplet with Lneck and Lhead indicated.
Expansion rate
For determination of the expansion rate (θ), the images recorded at 70,000 frames s-1 were
analysed with a custom-written script in Matlab 2015b with image processing toolbox
(Mathworks, USA). The circumference (O) and the droplet area touching the top of the
channel wall (Atop) were determined (Figure 3.3). The surface area of a droplet at the start
(Astart) and at the end of formation (Aend) and the droplet formation time (Δt) were used to
calculate the expansion rate:
𝐿𝐿𝑛𝑛𝑟𝑟𝑐𝑐𝑛𝑛,𝑐𝑐 =𝐿𝐿𝑛𝑛𝑟𝑟𝑐𝑐𝑛𝑛𝐿𝐿ℎ𝑟𝑟𝑤𝑤𝑑𝑑
∙ 100% 3.6
𝐴𝐴 = 𝑂𝑂𝜋𝜋 + 2𝐴𝐴𝑐𝑐𝑔𝑔𝑑𝑑 3.7
𝜃𝜃 =𝑙𝑙𝑛𝑛 � 𝐴𝐴𝑟𝑟𝑛𝑛𝑑𝑑𝐴𝐴𝑠𝑠𝑐𝑐𝑤𝑤𝑐𝑐𝑐𝑐
�
∆𝑡𝑡 3.8

Chapter 3
64
Figure 3.3. Determination of circumference (O) and top area (Atop) at the start and end of droplet formation.
3.4. Results and discussion
3.4.1. Droplet formation
The volume of hexadecane droplets formed in pure water increased with the dispersed
phase flow rate (Figure 3.4). Up to a dispersed phase flow rate of 12 μL/h, the droplet
volume scaled linearly with the dispersed phase flow rate. Upon further increasing the
dispersed phase flow rate, the increase in volume was not linear anymore, indicating that
the droplet formation mechanism changed considerably.
Figure 3.4. Experimentally determined droplet volume (VE) at a water flow rate of 75.7 ± 1.5 μL/h (■) and 92.2 ± 1.5 μL/h (●) as a function of the dispersed phase flow rate (φd) with linear fits through data measured in the dripping and transition regime.
1.2
1.4
1.6
1.8
2
2.2
0 5 10 15
V E (1
03 μm
3 )
φd (μL/h)
Dripping
Transition
Jetting

Microfluidic tensiometer
65
At low dispersed phase flow rates, droplets were formed at the junction without complete
blockage of the downstream channel (Figure 3.5). This droplet formation modus is referred
to as the dripping regime (De Menech et al. 2008). At increasing dispersed phase flow rate,
the forming droplets started to move downstream when the droplet formation mechanism
first changed to the transition regime, and next towards the jetting regime, in which droplets
are formed faster. Transition to the jetting regime occurs at higher dispersed phase flow
rates when the inertial forces exceed the surface tension force (Pathak 2011) and eventually
parallel flow would occur, which is outside the scope of this paper.
The droplet formation regimes are reflected in the relative neck length (Lneck,r) of the
emerging droplet (Figure 3.5). In the dripping regime, the neck length is less than 1% and it
increases to at most 13% in the transition regime, and to even higher values for jetting;
corresponding to dispersed phase flow rates of 8 μL/h, and 12 μL/h, respectively for this
data set. The droplet volume increased linearly until a dispersed phase flow rate of 12 μL/h
(Figure 3.4), indicating that the transition regime did not affect the dependency of droplet
size on dispersed flow rate, but the jetting regime did.
Steegmans et al. (2009a) stated that the dispersed phase had no influence on the droplet size
(one-step mechanism); it is expected that for the tested conditions the necking phase was so
rapid that any effect of disperse phase flow could rightfully be neglected. Our observations,
that were done for a much wider range of conditions, showed that droplet size increased
linearly with the dispersed flow rate, which is in line with computational fluid dynamic
results for T-junctions (Chen et al. 2012). These effects can be described with the two-step
model of Van der Graaf et al. (2006); therefore that model was developed further.
To be complete, the contact angle has only a small effect on the resulting droplet size; the
decreased curvature at the front of the droplet causes a decrease in interfacial tension force
but this decrease is balanced by the lower shear force resulting from the flatter droplet
surface (Muijlwijk, Berton-Carabin, et al. 2016), and therefore the contact angle is no part
of the models used here and in other sources in literature. We took utmost care that the
variability in droplet size did not become too large (i.e., >1%); if this happened the
microfluidic devices underwent extensive cleaning. It is safe to state that during the
experiments, the channels were homogeneous hydrophilic, also in the presence of SDS. But
this is a clear point of attention when doing experiments with microfluidic devices.

Chapter 3
66
A
B
Figure 3.5. A) Second-to-last-frame-before-detachment of droplets formed in water at a flow rate of 75.7 (left) and 92.2 (right) μL/h. B) The relative neck length (Lneck,r) in the second-to-last-frame-before-detachment of droplets formed in water at flow rates of 75.7 (■) and 92.2 (●) μL/h. The error bars indicate the standard deviation.
3.4.2. Model definition in the absence of surfactants
Model definition
In Figure 3.4, the linear fits have a Y-axis intercept that corresponds to the volume of the
droplet during the growth phase, and a certain slope that corresponds to the droplet growth
as a function of the dispersed phase flow rate (φd) during the detachment phase. We found
0
5
10
15
20
25
0 2 4 6 8 10 12 14 16
L nec
k,r (
%)
φd (μL/h)
Jetting
Dripping
Transition

Microfluidic tensiometer
67
that the volume added during the growth phase scaled with the inverse square root of the
capillary number (Ca); which is the ratio of the shear force that tries to remove the droplet,
and the interfacial tension force that tries to keep the droplet attached, and the volume
added during the detachment phase scaled with the reciprocal velocity of the continuous
phase at the junction (vc):
where b and c are constants; the values are calculated from the linear fits in Figure 3.4 for
oil droplets formed in pure water. In the Appendix (Table A3.1), additional statistical
information and the parameter values are given; parameters were not correlated, and had
narrow 95% confidence intervals (1-3%), all indicative for the model’s robustness.
The dependency that we found here is less strong as found in the work of van der Graaf and
co-workers (2006) for T-junctions (-0.75); and that most probably has to do with the angle
under which the flows meet. Scaling of the volume with the inverse square root of the
capillary number was also found for cross-flow membrane emulsification (van der Graaf et
al. 2004; Boom & Schroën 2011); in which droplets were formed via a one-step
mechanism, which corresponds to the first part of the model, and is often suggested in
literature. As mentioned previously, under conditions where droplet break-off occurs very
rapidly, the ratio of shear force and interfacial tension force (Ca) determines the size of the
droplet formed (2009a).
Model validation
The predictive power of the model was tested for various continuous phase compositions
and process conditions, and only droplets with a relative neck length below 13% (i.e.,
dripping and transition regime) were used for validation. Please note that the model was
used to predict the outcome of these measurements, it was not fitted to the data. The model
parameters b and c that were fitted for hexadecane droplet formation in water were used to
predict the droplet size for the experiments described here. We specifically highlight the
effect of continuous phase flow rate, and of interfacial tension and continuous phase
viscosity in the next two sections.
𝑉𝑉 = b�1𝐶𝐶𝐶𝐶
+𝑐𝑐𝑣𝑣𝑐𝑐𝜑𝜑𝑑𝑑 3.9

Chapter 3
68
Continuous phase flow rate
The model predictions were compared to data obtained for continuous phase flow rates
ranging from 54 to 171 μL/h (Figure 3.6). The applied dispersed phase pressure was 3 bar,
and resulted in an average dispersed phase flow rate of 5.4 ± 0.8 μL/h. Droplet size
decreased with increasing continuous phase flow rate, because of the resulting increased
shear force. The effect of the continuous phase flow rate on the droplet volume was well
predicted by the model; and the model can be used over a broad range of continuous phase
flow rates.
Figure 3.6. Experimentally determined (■) and calculated (□) volume of droplets formed in water at different continuous phase flow rates. Microscope images of the second-to-last-frame before detachment are depicted at the right.
Interfacial tension and continuous phase viscosity
The model was further used to describe data obtained at various interfacial tensions (15-46
mN/m as a result of the use of ethanol, glycerol, or sucrose in the continuous phase),
continuous phase viscosities (1-2.6 mPa s), continuous phase flow rates (50-126 μL/h), and
dispersed phase flow rates (0.8-14 μL/h). Again, only droplets formed in the dripping and
transition regimes were considered for validation. The model captured all aspects well, as
shown in Figure 3.7, in which the measured values from more than 60 experiments are
plotted against the predicted values. This clearly shows how well suited this model is to
predict the size of droplets formed in continuous phases that had very different properties
than the water that was initially used to generate the data upon which the parameters were
fitted.
0.0
0.5
1.0
1.5
2.0
2.5
0 50 100 150 200
V (1
03 μm
3 )
φc (μL/h)

Microfluidic tensiometer
69
Figure 3.7. Parity plot of droplets formed in: water (■), 9% ethanol (▲), 28% ethanol (●), 20% glycerol (♦), 30% glycerol (+), 20% sucrose (○) and 25% sucrose (X). The dashed line represents the line of parity.
3.4.3. Acting interfacial tension in the presence of surfactants
The next step was to estimate the interfacial tension during droplet formation in the
presence of SDS. To do so, we rewrote Equation 3.9; and the interfacial tension at the
moment of droplet break-up (i.e., acting interfacial tension) could now be calculated from
the measured droplet size:
Oil droplets were formed in a continuous phase of 0.5 wt. % SDS in water (Figure 3.8). The
average continuous phase flow rate was 113 ± 5 μL/h and the dispersed phase flow rate
varied from 0.9 to 13.8 μL/h. The acting interfacial tension increased with the dispersed
phase flow rate; the droplet formation time was shorter, resulting in less time for surfactant
adsorption to take place. However, the calculated acting interfacial tension decreased at
dispersed phase flow rates above 6 μL/h, which was not expected. The point at which this
happened coincided with the change in droplet formation mechanism from dripping to
transition regime where the relative neck length was no longer zero (Figure 3.8). In the
0.0
0.5
1.0
1.5
2.0
2.5
0.0 0.5 1.0 1.5 2.0 2.5
V C (1
03 μm
3 )
VE (103 μm3)
𝛾𝛾𝑤𝑤 = 𝜂𝜂𝑐𝑐𝑣𝑣𝑐𝑐 �𝑉𝑉 − 𝑐𝑐
𝑣𝑣𝑐𝑐𝜑𝜑𝑑𝑑
𝑏𝑏�
2
3.10

Chapter 3
70
dripping regime, the initial surface area just after droplet formation is constant because the
dispersed phase coiled back inside the dispersed phase channel. In the transition regime, the
dispersed phase stayed at the junction after droplet detachment, and the initial surface area
increased, which allows surfactant adsorption that influences the analysis (Appendix,
Figure A3.1). Alternatively, increased build-up of surfactants in the neck may occur, which
is beyond the scope of the current paper; therefore it was decided to analyse only droplets
formed in the dripping regime (Lneck,r < 1%).
Figure 3.8. Calculated acting interfacial tension (left) and the relative neck length (right) of 0.5 wt. % SDS. The error bars indicate the standard deviation of the relative neck length.
The acting interfacial tension was calculated for droplet formation times between 0.4 and
9.4 ms, for different concentrations of SDS (Figure 3.9). The values ranged between the
interfacial tension of the bare hexadecane-water interface (γwater) and the equilibrium
interfacial tension between hexadecane and SDS solution (γsds). The acting interfacial
tension increased with expansion rate, and the interfacial tension was lower at higher
concentrations, as expected.
0
10
20
30
40
50
0 5 10 15
γ a (m
N/m
)
φd (μL/h)
0
5
10
15
0 5 10 15
L nec
k,r (
µm)
φd (μL/h)

Microfluidic tensiometer
71
Figure 3.9. Acting interfacial tension of 0.01 (●), 0.05 (Δ), 0.1 (♦), 0.3 (□), 0.5 (▲) and 1 (○) wt. % SDS as a function of the expansion rate. The equilibrium interfacial tensions between hexadecane and water (γwater) and 1 wt. % SDS (γsds) are indicated as dashed lines.
It is possible that the continuous phase is depleted during the measurement because of the
large surface area in the microfluidic Y-junction. Alvarez et al. (2012) have set-up a
criterion to evaluate the significance of depletion. Depletion effects can be neglected when:
where C is the surfactant bulk concentration, A the surface area, V the volume of the
surrounding liquid, and Γ∞ the maximum surface packing concentration, which was 3.9∙10-
11 mol/cm2 for SDS (Alvarez et al. 2012). The average surface area during droplet formation
and the volume of continuous phase flowing past the emerging droplet was calculated for
data in Figure 3.9. For most of the experimental data depletion effects can be safely
neglected. Based on this criterion, depletion effects may only have been significant for the
experiments with 0.01 wt. % SDS (Appendix, Figure A3.2).
The acting interfacial tensions from Figure 3.9 are plotted together with interfacial tensions
measured with a drop tensiometer in Figure 3.10. Not only the probed time-scales were
very different, also the time needed to reach the equilibrium interfacial tension in the
0
10
20
30
40
50
0 500 1000 1500 2000
γ a (m
N/m
)
θ (s-1)
𝐶𝐶 > 100Γ∞𝐴𝐴𝑉𝑉
3.11
γSDS
γwater

Chapter 3
72
microfluidic system was much shorter than in the drop tensiometer. Adsorption in the ADT
is diffusion-limited because of the absence of flow. Whereas the Y-junction most likely
operates under enhanced mass transfer conditions, as discussed earlier.
Figure 3.10. Interfacial tension of 0.01 (●), 0.05 (Δ), 0.1 (♦), 0.3 (□), 0.5 (▲) and 1 (○) wt. % SDS measured with a microfluidic Y-junction and a drop tensiometer (solid lines). The equilibrium interfacial tensions between hexadecane and water (γwater) and 1 wt. % SDS (γsds) are indicated as dashed lines.
The situation in the Y-junction is as close as it can be to those occurring in industrial
emulsification devices that have convective transport of surfactants to the sub-surface. The
results presented here are therefore expected to be relevant for large-scale operation. How
these effects can be linked, is part of further investigations; here we only want to point out
that microfluidic devices are very well suited to probe micrometer and millisecond scales
during emulsification, which is otherwise not possible.
3.5. Conclusions The size of emulsion droplets formed in the dripping regime in a microfluidic Y-junction
can be accurately predicted with a two-step model consisting of a growth step and a
detachment step of which the first step is similar to models developed for unconfined
droplet formation in membrane emulsification (van der Graaf et al. 2004; Boom & Schroën
2011). The droplet volume scales with the inverse square root of the capillary number, and
scales linearly with the dispersed phase flow rate. The model can be used to describe the
0
10
20
30
40
50
0.0001 0.01 1 100
γ a (m
N/m
)
t (s)
γSDS
γwater

Microfluidic tensiometer
73
dripping regime and the transition regime for a wide range of flow rates, interfacial
tensions, and continuous phase viscosities. With this model, the acting interfacial tension
during droplet formation in Y-junctions was calculated. Only the adsorption of SDS was
measured; other surfactants are part of ongoing research.
The microfluidic tensiometric method described here can measure at droplet formation
times of 0.4 - 9.4 ms. The possibility to probe this time-scale makes this method stand out
from other microfluidic tensiometric methods that are only able to measure in the range of
milliseconds to seconds (Wang, Lu, Xu & Luo 2009; Brosseau et al. 2014; Wang et al.
2014; Xu et al. 2012). This, together with the enhanced mass transfer conditions, brings the
experimental settings close to those used in industry, and in this respect the methods could
mean a break-through in emulsification process design.

Chapter 3
74
3.6. Appendix Table A3.1. Fitting parameters b and c with the 95% confidence intervals and correlation coefficient of data presented in Figure 3 and the average values used for the model.
φc = 75.7 μL/h φc = 92.2 μL/h Average
b (10-18 m3) 95.4 ± 1.0 100.8 ± 1.5 98.1
c (10-6 m) 45.9 ± 1.4 46.9 ± 2.1 46.4
Correlation coefficient -0.933 -0.866
Figure A3.1. The starting surface area of emerging droplets and microscope images of the second-to-last-frame before detachment and the first frame after detachment where Atop,start is indicated in red.
Figure A3.2. Critical SDS concentration for each data point of 0.01 (●), 0.05 (Δ), 0.1 (♦), 0.3 (□), 0.5 (▲) and 1 (○) wt. % SDS. The area above the dashed line indicates the region where depletion is significant and the area below where depletion effects can be safely neglected.
0
100
200
300
400
500
600
0 5 10 15
A sta
rt (μ
m2 )
φd (μL/h)
0.00
0.01
0.10
1.00
0.001 0.01 0.1 1
[SD
S]cr
itica
l (w
t. %
)
[SDS] (wt. %)
Depletion No depletion


This chapter has been published as Muijlwijk, K.; Huang, W.; Vuist, J.; Berton-Carabin,
C.; Schroën, K., Convective mass transport dominates surfactant adsorption in a
microfluidic Y-junction, Soft Matter, 12, 9025-9029, 2016
4 4. Convective mass transport
dominates surfactant adsorption in a
microfluidic Y-junction

Chapter 4
78
4.1. Abstract Surfactant adsorption during emulsification can be quantified by measuring the acting
interfacial tension with a Y-junction microfluidic device. To obtain insight in the surfactant
transport mechanism to the interface, the effect of shear force on the acting interfacial
tension was assessed by systematically varying the continuous phase viscosity and velocity.
Varying the continuous phase viscosity did not affect the acting interfacial tension,
indicating that surfactant adsorption during Y-junction emulsification is not diffusion-
limited. The acting interfacial tension was inversely dependent on the continuous phase
velocity, which indicates that surfactant adsorption is governed by convective mass transfer
resulting from the continuous phase velocity. The acting interfacial tension can be
measured in the sub-millisecond time-scale and under convective transport conditions with
the Y-junction. These conditions are relevant to industrial emulsification and cannot be
assessed with conventional tensiometric techniques (e.g., drop tensiometer) where
surfactant adsorption is mostly driven by diffusion. We believe, therefore, that this method
can be used to understand emulsifier adsorption during industrial emulsification, which can
in turn, be used to rationally design emulsion formulations and processes.

Mass transport conditions
79
4.2. Introduction Emulsions are commonly produced with high-pressure homogenisers, colloid mills, rotor-
stator type stirrers, and ultrasonicators (Walstra 2003), which make droplets at very short
time-scales (i.e., sub-millisecond scale) (Brösel & Schubert 1999). Destabilisation of the
emulsion through immediate coalescence may be prevented through surfactant adsorption
at the oil-water interface (Jafari et al. 2008), and it is therefore important to understand
surfactant adsorption in such short time-scales.
Microfluidic devices can be used as a research tool to study the formation of emulsion
droplets and their subsequent physical stability (Muijlwijk, Berton-Carabin, et al. 2016;
Krebs et al. 2012b). It is customary to investigate droplet size as function of the geometry
of the channels (Wehking et al. 2013; Gupta & Kumar 2010b), and the viscosity ratio has
been linked to changes in droplet formation mechanism (Wehking et al. 2013), but the
effect of surface active components on droplet formation has only been reported very
sparingly. Recently we have shown that a microfluidic Y-junction device can be used to
measure the change in interfacial tension resulting from surfactant adsorption in the sub-
millisecond to millisecond time-scale (Muijlwijk, Hinderink, et al. 2016). In this device,
droplet formation depends on the balance between the shear force exerted by continuous
phase, and the interfacial tension. More precisely, we found that the droplet volume (V)
depends on the properties of the interface (i.e., interfacial tension (γ)), of the continuous
phase (i.e., continuous phase viscosity (ηc)), and on the processing conditions (i.e.,
continuous phase velocity (vc) and dispersed phase flow rate (φd)) (Equation 4.1). This
relation implies that from the measured droplet volume the acting interfacial tension (γa),
which is the interfacial tension at the moment of droplet detachment, can be calculated
(Equation 4.2).
In earlier work, the fitting parameters b and c were determined for hexadecane droplets
formed in water, and the model was then successfully validated using other continuous
𝑉𝑉 = 𝑏𝑏�𝛾𝛾
𝜂𝜂𝑐𝑐𝑣𝑣𝑐𝑐+𝑐𝑐𝑣𝑣𝑐𝑐𝜑𝜑𝑑𝑑 4.1
𝛾𝛾𝑤𝑤 = 𝜂𝜂𝑐𝑐𝑣𝑣𝑐𝑐 �𝑉𝑉 − 𝑐𝑐
𝑣𝑣𝑐𝑐𝜑𝜑𝑑𝑑
𝑏𝑏�
2
4.2

Chapter 4
80
phase liquids that differed in viscosity and led to a wide range of oil-water interfacial
tensions (Muijlwijk, Hinderink, et al. 2016).
The findings in this work indicated that this tensiometric method operates under active
mass transfer conditions resulting in fast surfactant transport towards the sub-surface
(Muijlwijk, Hinderink, et al. 2016), as also described by Wang et al. (2009; 2016). And
subsequent diffusion through the sub-surface is possibly also fast because of the narrow
sub-surface resulting from the continuous phase shear force (Muijlwijk, Hinderink, et al.
2016). This makes this method very different from existing tensiometric methods (e.g.,
drop tensiometer) that operate under quiescent conditions and are generally limited by
surfactant mass diffusion (Lin et al. 1990).
Under industrial emulsification conditions, surfactant transport is dominated by convection
(Brösel & Schubert 1999), and tensiometric methods used to understand surfactant
adsorption under industrial conditions would need to include these effects. In that respect,
the Y-junction method is rather unique, and in this paper we will try to quantify these
effects (Muijlwijk, Hinderink, et al. 2016). When convection dominates, the continuous
phase viscosity should not substantially affect the acting interfacial tension, but surfactant
mass transport should increase with continuous phase velocity (Baroud 2008), contrary to
diffusion-limited systems in which the viscosity of the continuous phase should affect the
interfacial tension through its effect on the diffusion coefficient (Staggemeier et al. 2005).
This is systematically investigated in this paper, which helped us to elucidate surfactant
behaviour and adsorption mechanism during Y-junction emulsification.
4.3. Experimental
4.3.1. Materials
Hexadecane (≥ 99% pure from Sigma-Aldrich, USA) was used as the dispersed phase.
Water was filtered and deionised with a Milli-Q system (Q-POD with Millipak Express 40
0.22 μm filter, Merck Millipore, USA). For the continuous phase sodium dodecylsulfate
(SDS > 99% pure from Sigma-Aldrich, USA) solutions of 0.1 wt. % were prepared in
water, in 10 and 20 wt. % sucrose solutions (≥ 99% pure, Fluka, Germany), or in 20 and 30
wt. % glycerol solutions (> 99% pure, Acros Organics, USA). For microfluidic
experiments, all aqueous solutions were filtered with a 0.2-μm cellulose filter (13/0.2 RC,

Mass transport conditions
81
Whatman Spartan, UK) before use. For the experiments with the oil-soluble surfactant, 0.3
and 0.5 wt. % Span 20 (≥ 44% pure, Sigma-Aldrich, USA) in hexadecane was prepared and
used as the dispersed phase, and water was used as the continuous phase.
4.3.2. Methods
Viscosity and interfacial tension
Viscosity of the aqueous solutions and their equilibrium interfacial tension with hexadecane
was measured in duplicate at 20 ºC as described previously (Muijlwijk, Hinderink, et al.
2016), and the monomer diffusion coefficient of SDS was calculated with the Stokes-
Einstein equation (Table 4.1) (Staggemeier et al. 2005).
Table 4.1. Viscosity (η), diffusion coefficient of SDS monomers (D), and interfacial tension against hexadecane (γ) of various aqueous solutions at 20 ºC.
Sample η
(mPa s)
D
(10-10 m2/s)
γ (mN/m)a
water 0.1% SDS
water 0.98 7.2 44.0 13.5
10 wt. % sucrose 1.41 5.0 42.2 12.5
20 wt. % sucrose 2.07 3.4 42.7 12.1
20 wt. % glycerol 1.78 4.0 41.1 12.7
30 wt. % glycerol 2.52 2.8 36.7 13.2
a ± 0.6 mN/m
Microfluidic set-up
Borosilicate glass chips (Micronit Microfluidics, The Netherlands) were used with a width
(w) and depth (z) of around 20 and 5 μm, respectively. The dispersed and continuous phase
channels met in a Y-shape with an angle of 97º. Droplets were formed and recorded as
described previously (Muijlwijk, Hinderink, et al. 2016). Droplet volume (V), droplet
formation time (tdrop), dispersed phase flow rate (φd), continuous phase flow rate (φc) and
velocity (vc), and relative neck length (Lneck,r) were measured with a custom-written script
for image analysis in Matlab R2010a with the image processing toolbox (Mathworks,
USA). The acting interfacial tension was calculated with Equation 4.2. The expansion rate
(θ) was measured with a custom-written script in Matlab 2015b with the image processing
toolbox (Mathworks, USA). The expansion rate is defined as the increase in surface area
over time calculated:

Chapter 4
82
where Astart and Aend is the surface area of a droplet at the start and end of formation and Δt
the formation time.
4.4. Results and discussion
4.4.1. Continuous phase viscosity
The viscosity of the continuous phase was changed by the addition of sucrose and glycerol,
which also affected the equilibrium interfacial tension (Table 4.1). To isolate the effect of
viscosity, the normalised interfacial tension (γn) was calculated from the acting interfacial
tension (γa), and both equilibrium interfacial tensions:
where the equilibrium interfacial tension in presence of 0.1 wt. % SDS measured with the
ADT was used as the minimum interfacial tension (γmin) and the plateau value in the
appendix (Figure A4.1) was used as the maximum interfacial tension (γmax).
The normalised interfacial tension is plotted as a function of the expansion rate in Figure
4.1. At low expansion rates, when droplets were formed slowly, the normalised interfacial
tension was low. With increasing expansion rate, the normalised interfacial tension
increased, since less time for surfactant adsorption was available, until it reached the
maximum normalised interfacial tension when the interface was devoid of surfactant. The
addition of sucrose and glycerol to the continuous phase resulted in a viscosity increase
from 1.0 to 2.5 mPa∙s, leading to a decrease in calculated diffusion coefficient for SDS
molecules from 7.2∙10-10 to 2.8∙10-10 m2/s (Table 4.1). The sucrose and glycerol curves
coincided with the water curve, which indicates that the normalised interfacial tension was
independent of continuous phase viscosity.
𝜃𝜃 =𝑙𝑙𝑛𝑛 � 𝐴𝐴𝑟𝑟𝑛𝑛𝑑𝑑𝐴𝐴𝑠𝑠𝑐𝑐𝑤𝑤𝑐𝑐𝑐𝑐
�
Δ𝑡𝑡 4.3
𝛾𝛾𝑛𝑛 =(𝛾𝛾𝑤𝑤 − 𝛾𝛾𝑚𝑚𝑐𝑐𝑛𝑛)
(𝛾𝛾𝑚𝑚𝑤𝑤𝑚𝑚 − 𝛾𝛾𝑚𝑚𝑐𝑐𝑛𝑛)
4.4
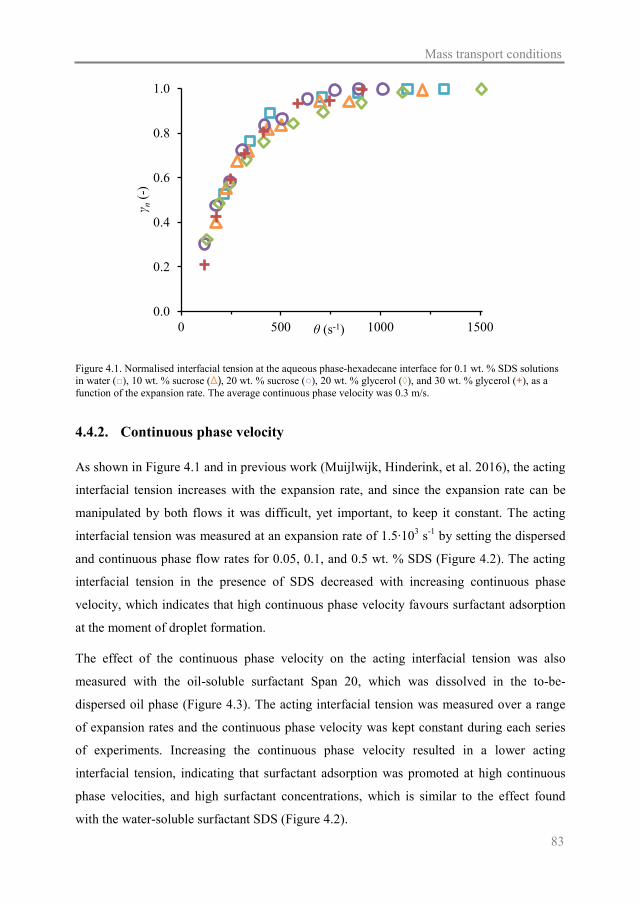
Mass transport conditions
83
Figure 4.1. Normalised interfacial tension at the aqueous phase-hexadecane interface for 0.1 wt. % SDS solutions in water (□), 10 wt. % sucrose (Δ), 20 wt. % sucrose (○), 20 wt. % glycerol (◊), and 30 wt. % glycerol (+), as a function of the expansion rate. The average continuous phase velocity was 0.3 m/s.
4.4.2. Continuous phase velocity
As shown in Figure 4.1 and in previous work (Muijlwijk, Hinderink, et al. 2016), the acting
interfacial tension increases with the expansion rate, and since the expansion rate can be
manipulated by both flows it was difficult, yet important, to keep it constant. The acting
interfacial tension was measured at an expansion rate of 1.5∙103 s-1 by setting the dispersed
and continuous phase flow rates for 0.05, 0.1, and 0.5 wt. % SDS (Figure 4.2). The acting
interfacial tension in the presence of SDS decreased with increasing continuous phase
velocity, which indicates that high continuous phase velocity favours surfactant adsorption
at the moment of droplet formation.
The effect of the continuous phase velocity on the acting interfacial tension was also
measured with the oil-soluble surfactant Span 20, which was dissolved in the to-be-
dispersed oil phase (Figure 4.3). The acting interfacial tension was measured over a range
of expansion rates and the continuous phase velocity was kept constant during each series
of experiments. Increasing the continuous phase velocity resulted in a lower acting
interfacial tension, indicating that surfactant adsorption was promoted at high continuous
phase velocities, and high surfactant concentrations, which is similar to the effect found
with the water-soluble surfactant SDS (Figure 4.2).
0.0
0.2
0.4
0.6
0.8
1.0
0 500 1000 1500
γ n (-
)
θ (s-1)

Chapter 4
84
Figure 4.2. Acting interfacial tension of hexadecane droplets formed in 0.05 (Δ), 0.1 (◊), and 0.5 (Δ) wt. % SDS at an average expansion rate of 1.5∙103 s-1 as a function of the continuous phase velocity.
Figure 4.3. Acting interfacial tension of 0.3 wt. % Span 20 in hexadecane at a continuous phase velocity of 0.3 (▲) and 0.7 (Δ) m/s and 0.5 wt. % Span 20 at a continuous phase velocity of 0.3 (●) and 0.5 (○) m/s as a function of the expansion rate.
0
10
20
30
40
50
0.0 0.2 0.4 0.6 0.8 1.0
γ a (m
N/m
)
vc (m/s)
0
10
20
30
40
50
0 500 1000 1500 2000 2500 3000
γ a (
mN
/m)
θ (s-1)

Mass transport conditions
85
4.4.3. Adsorption mechanism
The fact that the acting interfacial tension was independent of the continuous phase
viscosity but was dependent of the continuous phase velocity needs further discussion in
relation to the underlying surfactant transport mechanism, as done in this section.
It is well known that surfactant adsorption can be divided in three steps: 1) transport
towards the sub-interface, 2) diffusion through the sub-surface, and 3) kinetic adsorption at
the surface (Brösel & Schubert 1999). There are two possible transport mechanisms of
surfactants towards the sub-interface: diffusion and convection. If the dominant transport
mechanism is diffusion, a decrease in adsorption would be expected upon increasing the
continuous phase viscosity, especially at short time-scales (Staggemeier et al. 2005). In this
case, the lower diffusion coefficient resulting from the increased viscosity (Table 4.1) did
not change the acting interfacial tension (Figure 4.1), which indicates that convection
dominates transport towards the sub-interface rather than diffusion.
To verify that convection is the dominating mass transport mechanism, the Péclet number
(Pe) was calculated:
𝑃𝑃𝑒𝑒 =𝑣𝑣𝑐𝑐𝐿𝐿𝐷𝐷
4.5
where vc is the continuous phase velocity, L the characteristic length scale (in this case the
channel depth), and D the diffusion coefficient of the surfactant. A Péclet number above
one indicates convection is dominating and a Péclet number below 1 indicates diffusion is
dominating (Baroud 2008). For vc=0.2 m/s, L=5∙10-6 m, and D=7∙10-10 m2/s, which is the
condition corresponding to the lowest Péclet number, the value is 1.4∙103, thereby
indicating that convective transport is dominant when the surfactant is present in the
continuous phase, as illustrated in Figure 4.4A. The Péclet number and thus mass transport
towards the interface, increases with increasing the continuous phase velocity as also
experimentally verified (Figure 4.2).
When the surfactant molecules were solubilised in the oil phase, the continuous phase
velocity also influenced surfactant adsorption (Figure 4.3), and this may be due to the flow
outside a forming droplet that can create circulation zones inside the droplet (Baroud 2008;
Lee et al. 2012; Wang et al. 2015). The velocity in the to-be-dispersed phase is highest near
the interface, scales linearly with the velocity of the continuous phase (Lee et al. 2012), and

Chapter 4
86
is less pronounced for higher viscosity of the to-be-dispersed phase (Lee et al. 2012). For
the conditions tested here, a low inner velocity is expected but the Péclet number is still
above one as long as the inner velocity is above 1.4∙10-4 m/s. Thus, convection in the to-be-
dispersed phase determines surfactant mass transfer towards the interface when surfactants
are present in the dispersed phase, as shown graphically in Figure 4.4B.
Figure 4.4. Effect of continuous phase flow on adsorption of surfactants adsorbing from the continuous phase (A) and from the dispersed phase (B).
In summary, when emulsion droplets form, surfactant molecules need to adsorb at the
interface, and for low molecular weight surfactants this is expected to be fast (Wang et al.
2016), unlike macromolecules that need to rearrange before adsorption. The transfer
through the sub-surface is, therefore, expected to be rate-limiting for SDS. Only when the
sub-surface layer is thinner than the distance over which mass transfer takes place,
surfactant adsorption is determined by convective flow and mass transfer time (Wang et al.
2016). There was no effect of viscosity, and thus transport through the sub-surface is not
expected to influence adsorption in this case. This is most likely because the sub-surface
thickness was reduced by the shear force exerted on the emerging droplet (van der Graaf et
al. 2005). Besides, when the surfactant concentration exceeded the CMC (i.e., for 0.1%
SDS in 20% sucrose (Acharya et al. 1999)), the acting interfacial tension as function of
Mass transport conditions
87
expansion rate was not affected, indicating that disintegration of micelles did not play a role
in the observed effects.
To be complete, besides inducing flow within the forming droplet, the shear exerted by the
continuous phase may drag surfactants along the oil-water interface, resulting in a higher
surfactant concentration at the tip of the droplet (Eggleton et al. 2001; Anna & Mayer
2006), that may generate small droplets through tip streaming under specific conditions
(e.g., Capillary number ~ 0.5, viscosity ratio ~ 0.1) (Anna & Mayer 2006; De Bruijn 1993).
However, it is not likely that this has played any role since there was no effect of the
continuous phase viscosity on the acting interfacial tension. In case there are surface
tension gradients, these can induce Marangoni flow by which surfactant molecules are
distributed along the interface (Levich & Krylov 1969). For the conditions used here, the
Marangoni flow velocity can maximally be 1∙10-3 m/s (Dunér et al. 2016; Johnson et al.
2008), which is negligible compared to the used continuous phase velocity that is orders of
magnitude higher (0.3 - 4.4 m/s).
4.5. Conclusions The microfluidic Y-junction allowed us to elucidate the mechanisms governing surfactant
transport during emulsion formation. Because the acting interfacial tension decreased with
increasing the continuous phase velocity, and was independent of the continuous phase
viscosity, it could be concluded that convection dominates surfactant adsorption.
Surprisingly, increasing the continuous phase velocity not only promoted surfactant
adsorption when surfactant molecules were present in the continuous phase, but also when
they were present in the dispersed phase, which is most probably due to an increase in
internal flow velocity.
With these insights, the next step was made toward a tool that can predict interfacial tension
under conditions relevant to industrial processes. We have shown previously that the Y-
junction method is able to measure the acting interfacial tension in the sub-millisecond to
millisecond time-scale, corresponding to the time-scales in process lines. In the present
study, we have shown that we can measure it under conditions that are primarily governed
by convective mass transfer, as would also be the case in industrial processes. We believe
that this method will lead to better understanding of large scale emulsification.

Chapter 4
88
4.6. Appendix
Figure A4.1 Acting interfacial tension at the aqueous phase-hexadecane interface for 0.1 wt. % SDS solutions in water (□), 10 wt. % sucrose (Δ), 20 wt. % sucrose (○), 20 wt. % glycerol (◊), and 30 wt. % glycerol (+), as a function of the expansion rate.
0
10
20
30
40
50
0 500 1000 1500
γ a (m
N/m
)
θ (s-1)


This chapter has been submitted as Muijlwijk, K.; Li, X.; Berton-Carabin, C.; Schroën, K.,
Dynamic fluid interface formation in microfluidics: effect of emulsifier structure and oil
viscosity
5 5. Dynamic fluid interface formation
in microfluidics: effect of emulsifier
structure and oil viscosity

Chapter 5
92
5.1. Abstract Microfluidic devices are known for their accurate control of emulsification, but are less
known for their suitability to investigate involved dynamic mechanisms. We previously
showed that a microfluidic Y-junction can be used to measure interfacial tension in the
millisecond time-scale, at high interface expansion rates, and under convective mass
transport. In the present work, we further use this device to elucidate and compare dynamic
adsorption behaviour of water- or oil-soluble surfactants, in combination with different
alkanes. We found that oil viscosity affects adsorption of the oil-soluble surfactant Span 20
because surfactant transport is influenced by viscosity through the internal velocity.
Conversely, adsorption of the water-soluble surfactant Tween 20 was not affected by oil
viscosity. When comparing surfactant adsorption rates, it was clear that surfactant structure
became more important when more surfactants were present at the interface; Tween 20
adsorption was slower than Span 20 because of steric repulsion at the interface.

Effect of emulsifier structure and oil viscosity
93
5.2. Introduction At an industrial level, emulsions are made in very large quantities, using devices that
mostly impose large shear forces on droplets that are consequently broken up into smaller
ones (Walstra 2003). To characterise droplet formation, and to tentatively predict their size,
dimensionless numbers are used, such as the Capillary number, Weber number, and
Ohnesorge number (Rayner & Dejmek 2015). What all these numbers have in common is
that a value for the interfacial tension needs to be inserted, but the decision on which value
to use is far from trivial. Droplet formation typically takes place at sub-millisecond time-
scales, while interfacial tension measurements are not possible at such time-scales using
conventional methods. The droplet volume tensiometer, which is the standard measurement
technique, can measure at time intervals that are in the order of seconds or just below,
which is thus an order of 3 slower than the time-scales relevant for large scale
emulsification.
Although microfluidic and microstructured devices can be used for monodisperse emulsion
production (Muijlwijk, Berton-Carabin, et al. 2016; Vladisavljevic et al. 2012), the current
low throughputs limit their application (Schroën et al. 2015). Yet, since droplet formation
in these devices can be very fast (Bremond & Bibette 2012; Baret 2012), they are of interest
to investigate processes at time-scales relevant to the industrial scale. Recently, we have
shown that it is possible to measure the interfacial tension during droplet formation in the
sub-millisecond to millisecond time-scale with a microfluidic Y-junction (Muijlwijk,
Hinderink, et al. 2016). Others have also used microfluidics for this purpose, albeit
exploring slightly longer time-scales (Brosseau et al. 2014; Wang et al. 2016; Xu et al.
2012; Wang et al. 2014). The steps beyond initial emulsifier adsorption can also be
investigated by microfluidics, for example whether emulsifiers efficiently stabilise the oil-
water interface and prevent droplet coalescence (Krebs et al. 2012b; Krebs, Schroën, et al.
2013; Baret et al. 2009). Through these methods, more insights can be generated on how
and how fast the interface is covered and stabilised by emulsifiers, which will ultimately
help to optimise processing conditions and emulsion formulation.
In the present work, we focus on the initial stages of emulsifier adsorption using a
microfluidic Y-junction, for which a relation between the interfacial tension at the moment
of droplet formation (the acting interfacial tension) and the droplet size was derived using a
balance between the continuous phase shear force and the interfacial tension. The acting

Chapter 5
94
interfacial tension (γa) can be calculated from the droplet volume (V), continuous phase
velocity (vc), dispersed phase flow rate (φd), continuous phase viscosity (ηc), and chip
specific fitting parameters b and c with Equation 5.1 as described in detail in earlier work
(Muijlwijk, Hinderink, et al. 2016).
At a low expansion rate, emulsifier adsorption can take place over a longer period of time
because droplet formation is slower, resulting in lower acting interfacial tensions
(Muijlwijk, Hinderink, et al. 2016). In previous work, we focussed on effects occurring in
the continuous phase, and showed that the adsorption process is greatly influenced by the
convective mass transport conditions (Muijlwijk, Huang, et al. 2016). Others have indicated
that the dispersed phase viscosity also influences droplet size (Husny & Cooper-White
2006; Gu & Liow 2011; Yeom & Lee 2011b; Zhang & Stone 1997; Nie et al. 2008), as
does the droplet formation regime (Pathak 2011; Wehking et al. 2013), yet without
establishing a direct link with the dynamic behaviour of surfactants.
In this paper, we systematically vary the viscosity of the oil phase and the droplet
expansion rate, while using Span 20 and Tween 20 as oil- and water-soluble emulsifiers,
respectively.
5.3. Experimental
5.3.1. Materials
As dispersed phase, decane (≥ 99% pure from Sigma-Aldrich, USA), dodecane (≥ 99%
pure from Sigma-Aldrich, USA), or hexadecane (99% pure from Sigma-Aldrich, USA) was
used either pure or with 0.05, 0.3, or 0.5 wt. % Span 20 (sorbitan monolaurate, Sigma-
Aldrich, USA). As continuous phase, filtered and deionised water (Milli-Q system Q-POD
with Millipak Express 40 0.22 μm filter, Merck Millipore, USA) was used, either pure or
with 0.05, 0.1, 0.3, or 0.5 wt. % Tween 20 (polyoxyethylenesorbitan monolaurate, Sigma-
Aldrich, USA). For model validation, liquid systems with a constant interfacial tension
were used; the continuous phase consisted of pure water or of mixtures with 5, 9, or 28 wt.
𝛾𝛾𝑤𝑤 = 𝜂𝜂𝑐𝑐𝑣𝑣𝑐𝑐 �𝑉𝑉 − 𝑐𝑐
𝑣𝑣𝑐𝑐𝜑𝜑𝑑𝑑
𝑏𝑏�
2
5.1
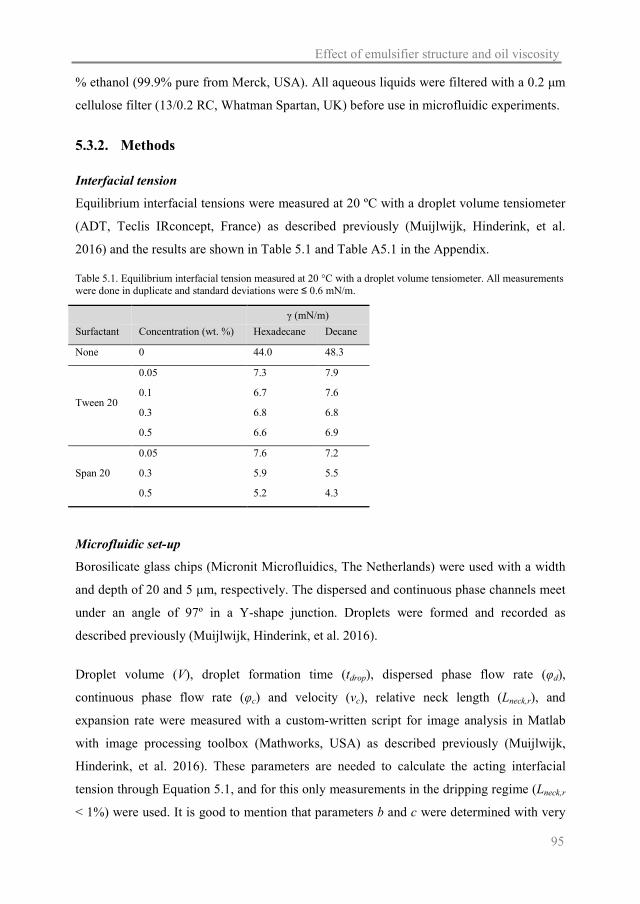
Effect of emulsifier structure and oil viscosity
95
% ethanol (99.9% pure from Merck, USA). All aqueous liquids were filtered with a 0.2 μm
cellulose filter (13/0.2 RC, Whatman Spartan, UK) before use in microfluidic experiments.
5.3.2. Methods
Interfacial tension
Equilibrium interfacial tensions were measured at 20 ºC with a droplet volume tensiometer
(ADT, Teclis IRconcept, France) as described previously (Muijlwijk, Hinderink, et al.
2016) and the results are shown in Table 5.1 and Table A5.1 in the Appendix.
Table 5.1. Equilibrium interfacial tension measured at 20 °C with a droplet volume tensiometer. All measurements were done in duplicate and standard deviations were ≤ 0.6 mN/m.
Microfluidic set-up
Borosilicate glass chips (Micronit Microfluidics, The Netherlands) were used with a width
and depth of 20 and 5 μm, respectively. The dispersed and continuous phase channels meet
under an angle of 97º in a Y-shape junction. Droplets were formed and recorded as
described previously (Muijlwijk, Hinderink, et al. 2016).
Droplet volume (V), droplet formation time (tdrop), dispersed phase flow rate (φd),
continuous phase flow rate (φc) and velocity (vc), relative neck length (Lneck,r), and
expansion rate were measured with a custom-written script for image analysis in Matlab
with image processing toolbox (Mathworks, USA) as described previously (Muijlwijk,
Hinderink, et al. 2016). These parameters are needed to calculate the acting interfacial
tension through Equation 5.1, and for this only measurements in the dripping regime (Lneck,r
< 1%) were used. It is good to mention that parameters b and c were determined with very
γ (mN/m) Surfactant Concentration (wt. %) Hexadecane Decane
None 0 44.0 48.3
Tween 20
0.05 7.3 7.9
0.1 6.7 7.6
0.3 6.8 6.8
0.5 6.6 6.9
Span 20
0.05 7.6 7.2
0.3 5.9 5.5
0.5 5.2 4.3

Chapter 5
96
high accuracy before each experiment using a liquid system with a static interfacial tension;
more details can be found in (Muijlwijk, Hinderink, et al. 2016).
5.4. Results and discussion
5.4.1. Effect of dispersed phase viscosity on droplet formation
Model determination and validation
To establish model parameters b and c of Equation 5.1, experiments were done with only
water and the respective oil (Appendix, Figure A5.1). For both decane and dodecane, the
droplet volume increased linearly with increasing the dispersed phase flow rate, as was
previously found for hexadecane (Muijlwijk, Hinderink, et al. 2016). The model parameters
could be determined with great accuracy, and the parameters were not correlated
(Appendix, Table A5.2). The values may indicate that the b parameter is fairly constant,
and that the c parameter is oil-dependent, but given small differences in channel dimensions
between the different micro-chips, we cannot confirm that this conclusion holds.
The models were validated through experiments carried out with water/ethanol mixtures
that had a range of viscosities and interfacial tensions (Appendix, Table A5.1), and the
experimentally determined droplet volumes (VE) were compared with the predicted values
(VC) (Appendix, Figure A5.2). From the excellent agreement found for both oils we
concluded that the two-step model is valid for a broader range of process conditions than
previously investigated, therewith facilitating in depth exploration of surfactant adsorption.
Droplet formation
The Y-junction model (Equation 5.1) is derived for the dripping regime where droplet
formation occurs at the junction (i.e., Lneck,r < 1%) (Muijlwijk, Hinderink, et al. 2016). The
dispersed phase viscosity has a pronounced effect on droplet formation, as illustrated in
microscopy images taken just before droplet detachment at an almost constant dispersed
phase flow rate of 11-12 μL/h (Figure 5.1). The relative neck length increased with
increasing oil viscosity for a given dispersed phase flow rate and resulted in an earlier
change in droplet formation regime from dripping to transition and ultimately jetting as
indicated by the dashed lines in Figure 5.1. Such changes have been linked to the viscosity
ratio, which is the ratio of dispersed phase and continuous phase viscosity; at higher
viscosity ratio the drag force increases and the droplets are more rigid, resulting in an

Effect of emulsifier structure and oil viscosity
97
increased shear at the boundary of the two fluids (Milliken et al. 1993; Pathak 2011;
Wehking et al. 2013). The forming droplet becomes more deformed (i.e., longer neck),
resulting in an earlier change of droplet formation regime from dripping to jetting. This has
also been found for T-junctions (Gupta & Kumar 2010b; Yeom & Lee 2011b; Wehking et
al. 2013), co-flowing devices (Cramer et al. 2004), flow-focusing devices (Nie et al. 2008),
and vertical capillaries (Zhang & Stone 1997).
Figure 5.1. The relative neck length for decane (♦), dodecane (●) and hexadecane (■) droplets formed in water as a function of the dispersed phase flow rate and microscope images of the second-to-last frame before detachment at a dispersed phase flow rate of 11-12 μL/h, showing a distinct difference in neck length from the junction.
5.4.2. Surfactant adsorption
Water-soluble Tween 20
The acting interfacial tension when Tween 20 was dissolved in the continuous water phase
was measured with hexadecane or decane as the oil phase, and plotted as a function of the
interface expansion rate (Appendix, Figure A5.3). Since the equilibrium interfacial tension
0
10
20
30
0 10 20 30 40
L nec
k,r (
%)
φd (μL/h)
Jetting
Transition
Dripping

Chapter 5
98
of the bare liquid-liquid interfaces and of those saturated with emulsifiers are different for
the two liquids (Table 5.1), we normalised the data with Equation 5.2; the normalised
interfacial tension (γn), which can be interpreted as relative surface coverage at the moment
of droplet formation, was calculated from the acting interfacial tension (γa), the minimum
(γmin), and the maximum interfacial tension (γmax).
As expected, the normalised interfacial tension increased with expansion rate and decreased
with surfactant concentration (Figure 5.2), which is in line with earlier observations
obtained for sodium dodecylsulfate (Muijlwijk, Hinderink, et al. 2016). The normalised
interfacial tension increased with increasing dispersed phase viscosity, which is most
notable for the highest tested Tween 20 concentrations in the continuous phase (0.3 and 0.5
wt. %). Intercalation of surfactant hydrophobic groups and the oil hydrocarbon groups is
easier when the hydrocarbon tail is shorter (Peltonen et al. 2001), and this can explain the
difference in adsorption of water-soluble surfactants between the oils.
Figure 5.2. Normalised interfacial tension of 0.05 (■□), 0.1 (▲Δ) 0.3 (♦◊) and 0.5 (●○) wt. % Tween 20 against hexadecane (closed symbols) and decane (open symbols) as a function of the expansion rate.
0.0
0.2
0.4
0.6
0.8
1.0
0 1000 2000 3000 4000 5000
γ n (-
)
θ (s-1)
𝛾𝛾𝑛𝑛 =(𝛾𝛾𝑤𝑤 − 𝛾𝛾𝑚𝑚𝑐𝑐𝑛𝑛)
(𝛾𝛾𝑚𝑚𝑤𝑤𝑚𝑚 − 𝛾𝛾𝑚𝑚𝑐𝑐𝑛𝑛)
5.2

Effect of emulsifier structure and oil viscosity
99
Oil soluble Span 20
Span 20 has the same hydrophobic tail as Tween 20 but has a smaller head group and is
thus more hydrophobic and is oil-soluble (Appendix, Figure A5.4). The acting interfacial
tension was plotted against the expansion rate for various Span 20 concentrations in the oil
phase (Appendix, Figure A5.5), and used to plot the normalised interfacial tension (Figure
5.3). The normalised interfacial tension was a function of the Span 20 concentration, as
expected, and of the used oil. As discussed previously, intercalation of Span 20 molecules
was expected to occur more readily for decane compared to hexadecane; however, the
differences between the oils for Span 20 were much greater than found for Tween 20, and
thus another mechanism needs to be considered.
Figure 5.3. Normalised interfacial tension of 0.05 (■□), 0.3 (♦◊) and 0.5 (●○) wt. % Span 20 in hexadecane (closed symbols) and in decane (open symbols) against water as a function of the expansion rate.
When surfactants are present in the dispersed phase, convective mass transport towards the
interface can take place because the continuous phase velocity induces an internal fluid
circulation (Muijlwijk, Huang, et al. 2016), and this internal velocity is reported to be
inversely proportional to the dispersed phase viscosity (Lee et al. 2012). To check whether
this explains the differences, the data were re-plotted in Figure 5.4 with the expansion rate
normalised for viscosity ratio (θn) calculated:
0.0
0.2
0.4
0.6
0.8
1.0
0 1000 2000 3000
γ n (
-)
θ (s-1)
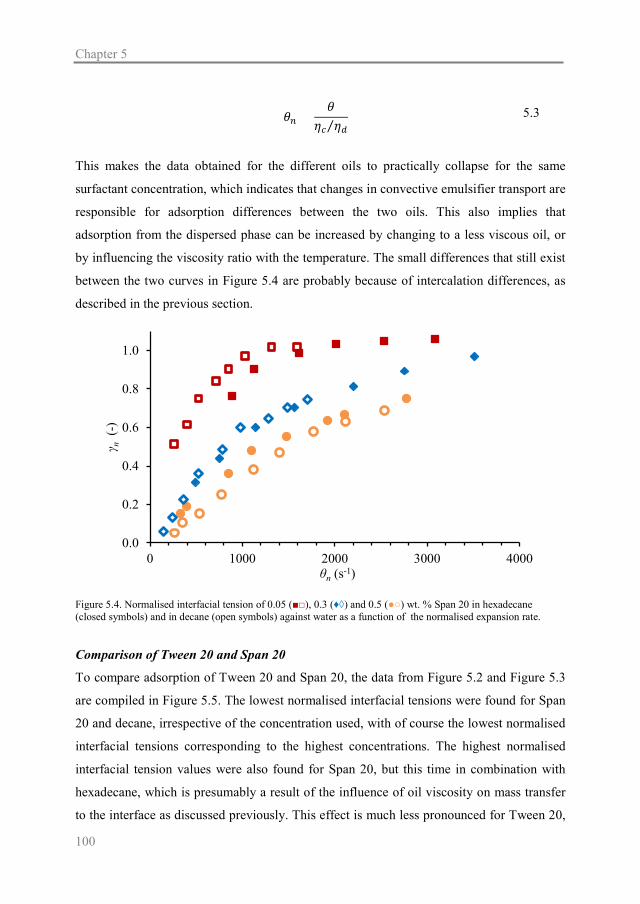
Chapter 5
100
This makes the data obtained for the different oils to practically collapse for the same
surfactant concentration, which indicates that changes in convective emulsifier transport are
responsible for adsorption differences between the two oils. This also implies that
adsorption from the dispersed phase can be increased by changing to a less viscous oil, or
by influencing the viscosity ratio with the temperature. The small differences that still exist
between the two curves in Figure 5.4 are probably because of intercalation differences, as
described in the previous section.
Figure 5.4. Normalised interfacial tension of 0.05 (■□), 0.3 (♦◊) and 0.5 (●○) wt. % Span 20 in hexadecane (closed symbols) and in decane (open symbols) against water as a function of the normalised expansion rate.
Comparison of Tween 20 and Span 20
To compare adsorption of Tween 20 and Span 20, the data from Figure 5.2 and Figure 5.3
are compiled in Figure 5.5. The lowest normalised interfacial tensions were found for Span
20 and decane, irrespective of the concentration used, with of course the lowest normalised
interfacial tensions corresponding to the highest concentrations. The highest normalised
interfacial tension values were also found for Span 20, but this time in combination with
hexadecane, which is presumably a result of the influence of oil viscosity on mass transfer
to the interface as discussed previously. This effect is much less pronounced for Tween 20,
0.0
0.2
0.4
0.6
0.8
1.0
0 1000 2000 3000 4000
γ n (
-)
θn (s-1)
𝜃𝜃𝑛𝑛 =𝜃𝜃
𝜂𝜂𝑐𝑐 𝜂𝜂𝑑𝑑⁄ 5.3
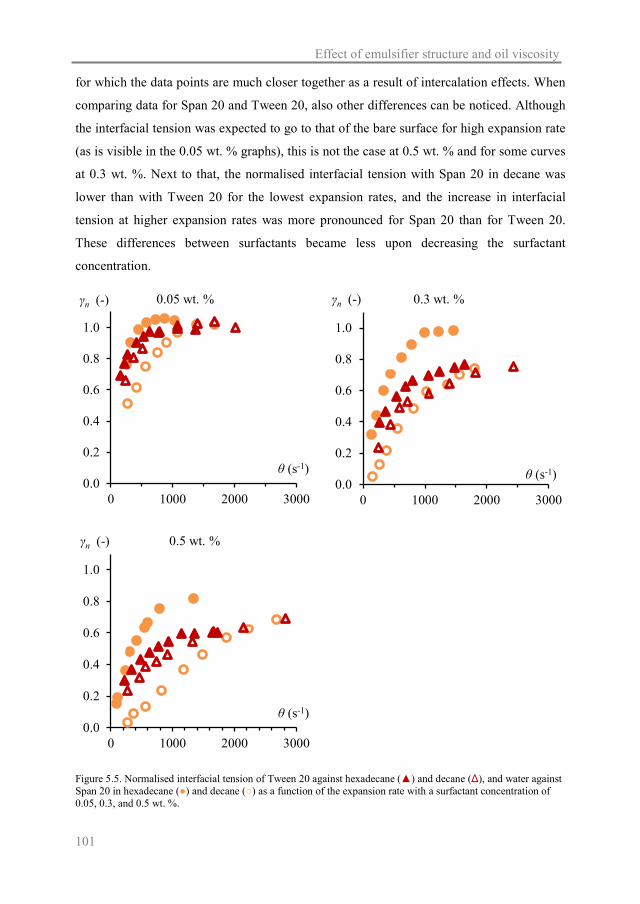
Effect of emulsifier structure and oil viscosity
101
for which the data points are much closer together as a result of intercalation effects. When
comparing data for Span 20 and Tween 20, also other differences can be noticed. Although
the interfacial tension was expected to go to that of the bare surface for high expansion rate
(as is visible in the 0.05 wt. % graphs), this is not the case at 0.5 wt. % and for some curves
at 0.3 wt. %. Next to that, the normalised interfacial tension with Span 20 in decane was
lower than with Tween 20 for the lowest expansion rates, and the increase in interfacial
tension at higher expansion rates was more pronounced for Span 20 than for Tween 20.
These differences between surfactants became less upon decreasing the surfactant
concentration.
Figure 5.5. Normalised interfacial tension of Tween 20 against hexadecane (▲) and decane (Δ), and water against Span 20 in hexadecane (●) and decane (○) as a function of the expansion rate with a surfactant concentration of 0.05, 0.3, and 0.5 wt. %.
0.0
0.2
0.4
0.6
0.8
1.0
0 1000 2000 3000
γn (-)
θ (s-1)
0.05 wt. %
0.0
0.2
0.4
0.6
0.8
1.0
0 1000 2000 3000
γn (-)
θ (s-1)
0.3 wt. %
0.0
0.2
0.4
0.6
0.8
1.0
0 1000 2000 3000
γn (-)
θ (s-1)
0.5 wt. %

Chapter 5
102
Span 20 and Tween 20 have the same hydrophobic group but the head group of Tween 20
is much larger (Appendix, Figure A5.4), which results in differences in equilibrium
molecular surface area: 90 Å2 for Tween 20 and 40 Å2 for Span 20 when measured at the
gas-liquid interface (Berton et al. 2012), which is expected to be a reasonably good
indicator for the oil-water interface. Tween 20 adsorption is hindered by steric repulsion
between the polyoxyethylene groups (Berton et al. 2012), while Span 20 has a smaller head
group and thus less hindrance during adsorption is expected, and this leads to
comparatively steeper curves for Span 20. Upon increasing the expansion rate or upon
decreasing surfactant concentration, the interface becomes less crowded, and hindrance
between surfactant head groups becomes less important, therewith diminishing differences
in adsorption behaviour between Span 20 and Tween 20.
5.5. Conclusions The microfluidic Y-junction can be used to elucidate effects occurring during
emulsification, including those related to the molecular structure of surfactants and
convective mass transfer. We found that when surfactants adsorb from the continuous phase
at a certain expansion rate, the surface coverage increases with decreasing hydrocarbon
chain length of the oil, because of easier intercalation of the surfactant alkyl chains. When
surfactants adsorb from the dispersed phase, surfactant transport results from internal flow
within the dispersed phase, which is driven by continuous phase flow that scales with
dispersed phase viscosity.
By using dimensionless interfacial tension values, adsorption of Span 20 and Tween 20
could be compared and we were able to measure small differences in adsorption resulting
from the surfactant structure in combination with the oils that were used. To the best of our
knowledge, the effect of dispersed phase viscosity and surfactant structure on the acting
interfacial tension at such very short time-scales, and under convective mass transport
conditions, has not been described before. In that respect, the microfluidic Y-junction is
unique, since it allows measuring at time-scales and transport conditions very close to those
used in industrial emulsification and these insights are, therefore, expected to be of great
significance for improvement of emulsion formulation and process optimisation.

Effect of emulsifier structure and oil viscosity
103
5.6. Appendix Table A5.1. Viscosity and interfacial tension with decane and dodecane at 20 ºC.
Fluid η
(mPa∙s)
γdecane
(mN/m)
γdodecane
(mN/m)
γhexadecane
(mN/m)
Water 0.98a 48.3 52.7 44.0a
5.0 wt. % Ethanol-water 1.24 - 38.6 -
9.0 wt. % Ethanol-water 1.42a 30.7 31.7 -
28.0 wt. % Ethanol-water 2.52a 14.9 - -
Decane 0.93b - - -
Dodecane 1.50b - - -
Hexadecane 3.47b - - -
a. From reference (Muijlwijk, Hinderink, et al. 2016) b. From reference (Griesbaum et al. 2012)
Figure A5.1. Experimentally determined volume (VE) of decane (left) (◊) and dodecane (right) (○) droplets formed in water as a function of the dispersed phase flow rate (φd) with linear fits of which the parameters are in Table A5.2.
Table A5.2. Reference volume (b) and fitting constant (c) with the 95% confidence intervals and correlation coefficient of the fits for decane and dodecane determined with the linear fits in Figure A5.1.
Decane Dodecane
b (10-18 m3) 97.5 ± 1.8 98.6 ± 0.6
c (10-6 m) 34.8 ± 1.7 39.4 ± 0.8
Correlation coefficient -0.936 -0.888
0
1
2
0 10 20
V E (1
03 μm
3 )
φd (μL/h)
0
1
2
0 10 20
V E (1
03 μm
3 )
φd (μL/h)

Chapter 5
104
Figure A5.2. Parity plot of decane (left) and dodecane droplets (right) formed in: water (□), 5 wt. % (◊), 9 wt. % (Δ) and 28 wt. % (○) ethanol. The dashed line represents the line of parity.
Figure A5.3. Acting interfacial tension of 0.05 (■□), 0.1 (▲Δ) 0.3 (♦◊) and 0.5 (●○) wt. % Tween 20 against hexadecane (closed symbols) and decane (open symbols) as a function of the expansion rate. The equilibrium interfacial tensions between water and hexadecane (γhexadecane-water) and decane (γdecane-water) are indicated as dashed lines.
0.0
1.0
2.0
0.0 1.0 2.0
V C (1
03 μm
3 )
VE (103 μm3)
0.0
1.0
2.0
0.0 1.0 2.0
V C (1
03 μm
3 )
VE (103 μm3)
0
10
20
30
40
50
0 1000 2000 3000 4000 5000
γ a (m
N/m
)
θ (s-1)
γhexadecane-water γdecane-water

Effect of emulsifier structure and oil viscosity
105
Figure A5.4. Molecular structures of Tween 20 (w + x + y + z = 20) and Span 20, from Berton et al. (2012).
Figure A5.5. Acting interfacial tension of 0.05 (■□), 0.3 (♦◊) and 0.5 (●○) wt. % Span 20 in hexadecane (closed symbols) and in decane (open symbols) against water as a function of the expansion rate. The equilibrium interfacial tensions between water and hexadecane (γhexadecane-water) and decane (γdecane-water) are indicated as dashed lines.
0
10
20
30
40
50
0 500 1000 1500 2000 2500 3000
γ a (
mN
/m)
θ (s-1)
γdecane-water γhexadecane-water


This chapter has been published as Muijlwijk, K.; Colijn, I.; Harsono, H.; Krebs, T.;
Berton-Carabin, C.; Schroën, K., Coalescence of protein-stabilised emulsions studied with
microfluidics, Food Hydrocolloids, 70, 96-104, 2017
6 6. Coalescence of protein-stabilised
emulsions studied with microfluidics

Chapter 6
108
6.1. Abstract Emulsion droplet formation occurs in milliseconds to seconds when emulsifier adsorption is
often not yet completed, therewith allowing coalescence to take place. Because of these
short time-scales, it is difficult to quantify adsorption and coalescence during processing. A
microfluidic device can be used to measure coalescence shortly after droplet formation in
laminar flow, and this device was used to assess coalescence of oil-in-water emulsions
stabilised with dairy proteins (β-lactoglobulin, whey protein isolate, and oxidised whey
protein isolate). Different microfluidic designs were used to vary the protein adsorption
time prior to droplet collision.
Coalescence stability depended on protein concentration (0.0002-0.02 wt. %) and
adsorption time (11-173 ms): emulsion droplets were stable at low protein concentrations
(as low as 0.005 wt. % β-lactoglobulin), as long as the time allocated for protein adsorption
was sufficient (in this case 31 ms). Protein type was also important for coalescence
stability: emulsions stabilised with whey protein isolate were less stable than those with β-
lactoglobulin, and coalescence stability further decreased upon protein oxidation.
Regarding the effect of pH (3.0-8.0), coalescence stability was lowest around the protein’s
isoelectric point.
With the coalescence channel we demonstrated the importance of adsorption time and
interface composition for coalescence stability at low protein concentrations. Coalescence
can be measured at small time-scales and in high detail since coalescence measurements are
decoupled from droplet formation. The microfluidic coalescence channel can be used as an
analytical tool to gain better understanding of fluid interface stabilisation during
emulsification, and to develop emulsion formulations ab initio.

Coalescence of protein-stabilised emulsions
109
6.2. Introduction Emulsions are dispersions of two immiscible liquids, and food emulsions are generally
produced using rotor-stator systems or high-pressure homogenisers (Stang et al. 2001).
During emulsification a large amount of interface is created, which increases the Gibbs free
energy of the system. Because thermodynamics strive to minimise the latter, coalescence is
often encountered and this occurs when the contact time between colliding droplets exceeds
the time for interfacial film drainage followed by film rupture. From a process efficiency
perspective, coalescence during emulsification should be prevented, for example by
emulsifier adsorption at the droplet surface before droplet collision (Jafari et al. 2008).
However, the time-scale for droplet formation, emulsifier adsorption, and droplet collision
during emulsification is in the millisecond to second range (Schultz et al. 2004).
Coalescence quantification is not possible with existing methods that measure longer-term
coalescence stability of equilibrated systems, and therefore non-equilibrium and faster
measurements are needed.
Microfluidics offer new routes to study emulsions in for processing relevant length- and
time-scales (Schroën et al. 2015; Muijlwijk, Berton-Carabin, et al. 2016). In previous work
we looked for example at interfacial tension effects occurring at the sub-millisecond to
millisecond time-scale during droplet formation (Muijlwijk, Hinderink, et al. 2016;
Muijlwijk, Huang, et al. 2016). Coalescence was also probed with microfluidics, for
example with the coalescence channel, where emulsion droplets are formed and
subsequently collide in a wider channel and, when not sufficiently stabilised, coalesce. Up
to now, stability of oil-in-water droplets (Krebs et al. 2012b), water-in-oil droplets (Baret et
al. 2009), and air-in-water bubbles (Fu et al. 2015) have been measured in model systems,
but food-grade emulsifiers have not been used before to the best of our knowledge. Proteins
are often used for that purpose and for such emulsifiers, which have a high molecular
weight and are composed of mixed molecules, it is crucial to understand how fast these
emulsifiers stabilise emulsions and whether the process can be optimised in terms of
ingredient formulation, processing conditions, and process equipment.
In this article, we measured coalescence of oil-in-water droplets stabilised by dairy proteins
with different purity or level of chemical modification: β-lactoglobulin, whey protein
isolate, and oxidised whey protein isolate. We used a device where emulsion droplets were
made at a T-shaped junction, then travelled through an adsorption channel of various

Chapter 6
110
lengths, before entering a coalescence channel. The effect of adsorption time before
collision on droplet coalescence was quantified based on droplet size through image
analysis, and also the effect of pH on the coalescence of β-lactoglobulin stabilised
emulsions was determined.
6.3. Materials and methods
6.3.1. Sample preparation
A 10 mM phosphate buffer was prepared with sodium dibasic phosphate (Na2HPO4),
sodium monobasic phosphate (NaH2PO4), phosphoric acid (H3PO4 85%) (all from Sigma-
Aldrich, USA), and purified water (Millipore Milli-Q system, Q-POD with Millipak
Express 40 0.22 μm filter, Merck Millipore, USA) at pH 7.0, and for the pH experiments at
pH 3.0, 4.0, 5.0, 6.0, 7.0, 8.0, and 9.0. Protein solutions were prepared in phosphate buffer
and were filtered with a 0.45 µm filter (Millipore, USA) before use. β-lactoglobulin was
purified to 91.2% protein (measured with the Dumas method (FlashEA 1112 analyser,
Thermo Scientific, USA) with a nitrogen conversion factor of 6.29) from whey protein
isolate containing 97.5% protein (Bipro, Davisco, USA). For purification, the whey protein
isolate solution was adjusted to pH 2 and a sodium chloride concentration to 14%, and after
stirring the solution was diluted and centrifuged. The sodium chloride concentration of the
supernatant was adjusted to 23% and centrifuged again. The pH of the pellet was adjusted
to 7, after which it was dialysed and freeze-dried for storage (Mailliart & Ribadeau-Dumas
1988). To oxidise whey protein isolate, the protein solution in phosphate buffer at pH 7.0
was subjected to metal-catalysed oxidation for 48 hours (Berton-Carabin et al. 2016), which
resulted in a carbonyl content of 39.1 mmol/kg soluble protein (the measurement was based
on the derivatization of carbonyls with 2,4-dinitrophenylhydrazine (Berton-Carabin et al.
2016)). The conductivity of 0.02 wt. % β-lactoglobulin solution (9.6∙10-2 S/m) was
comparable to that of 0.02 wt. % whey protein isolate solution (9.9∙10-2 S/m) (both in 10
mM phosphate buffer at pH 7.0). Hexadecane 99% (Sigma-Aldrich, USA) was used as the
dispersed phase. All chemicals were used as received, unless specified differently.
6.3.2. Microfluidic experiments
Custom-designed microchips (Micronit Microfluidics, The Netherlands) were made from
glass and the channels had a uniform depth of 45 µm. The chip contained three sections: a

Coalescence of protein-stabilised emulsions
111
T-junction, a meandering channel, and a wider coalescence channel (Figure 6.1). Oil
droplets were formed at the T-junction (width = 100 μm) where the continuous and
dispersed phase intersect. The emulsion then passed through the meandering channel during
which adsorption of emulsifiers at the surface of oil droplets may occur; the residence time
of the formed emulsion being directly proportional to the length of this channel. The length
of the adsorption channel was varied from 1.6 to 25.6 mm and an overview of the used
designs is given in the Appendix (Figure A6.1). For the sets of experiments in which the
adsorption time was kept constant, an adsorption channel length of 14.8 mm was used.
After the adsorption channel, the emulsion entered the wider coalescence channel (width =
500 μm) where droplets collided and possibly coalesced.
Figure 6.1. Layout of the microfluidic chip with an adsorption channel length of 14.8 mm. Other designs are depicted in the Appendix Figure A6.1. The rectangles indicate the regions from which images were recorded with examples of recorded microscope images.
Water and oil were dosed into the microfluidic device using a pressure system (OB1,
Elveflow, France) and the flow was controlled with flow sensors (FS2 and FS4, Elveflow,
France) that were connected to the chip with fused silica capillaries with an inner diameter
of 150 μm (Polymicro Technologies, USA). The continuous phase flow rate was 40 μL/min
(pressure ~1.5 bar) and the dispersed phase flow rate was 2 μL/min (pressure ~1.2 bar),
unless otherwise stated, and the resulting droplet diameter was 57 μm. The actual oil
volume fraction was determined by image analysis, and was 25%. This fraction is actually
higher than the theoretical fraction that can be calculated from the applied flow rates, which
can be explained by the fact that the droplets are squeezed between the walls of the
microchip, and therefore tend to reside longer in the system compared to the more easily
flowing continuous phase. The extra channel connected to the coalescence channel can be

Chapter 6
112
used to adjust the flow rate but was blocked during these experiments (indicated with ‘X’ in
Figure 6.1). A chip holder (Fluidic Connect 4515, Micronit Microfluidics) was used to
place the chip under the light microscope (Axiovert 200 MAT, Carl Zeiss B.V.) that was
connected to a high-speed camera (MotionPro Y4-S2). Images were recorded at the T-
junction, at the inlet of the coalescence channel, and at the outlet (i.e., 2.6 cm from the
inlet). Per measurement, 1000 images were recorded in triplicate at a rate of 30 frames per
second. The images were processed and the two-dimensional area of each droplet was
obtained with a custom-made ImageJ macro.
6.3.3. Coalescence frequency
From the obtained mean area (Af) and the mean initial droplet area (Ai), the mean number of
coalescence events (Ncoal) during the experiment was calculated:
An example of the obtained size distribution from one measurement is given in the
Appendix (Figure A6.2). The residence time inside the coalescence channel (tres) was
calculated from the length of the coalescence channel (Lcoal), which was 2.6∙10-2 m in these
experiments, and the mean drop velocity (vdrop), from which the mean coalescence
frequency (fcoal) was calculated:
Using the work of Krebs et al. (2012b), we chose to work at a vdrop of 1.3∙10-2 m/s at a total
flow rate of 42 μL/min.
6.3.4. Interfacial tension
Interfacial tension was measured in triplicate with an automated drop tensiometer (ADT,
Teclis ITconcept, France). A rising hexadecane droplet of 10 μL was formed at the tip of a
syringe in a cuvette filled with 25 mL 0.1 wt. % β-lactoglobulin or whey protein isolate
aqueous solution at 20 ºC. Interfacial tension was measured for 100 s by analysing the
profile of the droplet using the Laplace equation.
𝑁𝑁𝑐𝑐𝑔𝑔𝑤𝑤𝑤𝑤 = 𝐴𝐴𝑟𝑟𝐴𝐴𝑐𝑐
− 1 6.1
𝑡𝑡𝑐𝑐𝑟𝑟𝑠𝑠 = 𝐿𝐿𝑐𝑐𝑔𝑔𝑤𝑤𝑤𝑤𝑣𝑣𝑑𝑑𝑐𝑐𝑔𝑔𝑑𝑑
6.2
𝑓𝑓𝑐𝑐𝑔𝑔𝑤𝑤𝑤𝑤 = 𝑁𝑁𝑐𝑐𝑔𝑔𝑤𝑤𝑤𝑤𝑡𝑡𝑐𝑐𝑟𝑟𝑠𝑠
6.3

Coalescence of protein-stabilised emulsions
113
6.4. Results and discussion In this section we first describe various factors that influence emulsion stabilisation with
proteins. The droplet size in emulsions made by traditional techniques is the result of
formation and subsequent coalescence, but the microfluidic systems used here allow
decoupling of formation and coalescence and this allows for further understanding of
emulsification processes. Our thoughts about this are given throughout this section.
6.4.1. Coalescence stability of emulsion droplets stabilised with β-lactoglobulin
The mean coalescence frequency as a function of the β-lactoglobulin concentration in the
aqueous phase is, together with corresponding microscope images from the outlet of the
coalescence channel, depicted in Figure 6.2. As expected, coalescence frequency decreased
with increasing β-lactoglobulin concentration, but droplets were stable (i.e., fcoal < 0.02 s-1)
in the coalescence channel from a concentration of 0.005 wt. % onward, which is much
lower than expected and normally used for stable emulsion preparation (as discussed later).
Figure 6.2. Mean coalescence frequency and microscope images from the outlet of the coalescence channel. The error bars indicate the standard deviation of the three recordings taken per measurement, most of them being within data markers. The adsorption time before entering the coalescence channel was 100 ms.
0
0.1
0.2
0.3
0.4
0.5
0 0.005 0.01 0.015 0.02
f coal
(s-1
)
[β-lactoglobulin] (wt. %)

Chapter 6
114
Effect of flow rate
Coalescence was also measured as a function of the total flow rate, which ranged from 31
to 72 μL/min (Figure 6.3); the used continuous and dispersed phase flow rates and resulting
oil fraction are in given the Appendix (Table A6.1). With 0.0005 wt. % β-lactoglobulin, the
coalescence frequency was inversely related to the total flow rate, while stable droplets
were obtained independent of this flow rate with 0.005 wt. % β-lactoglobulin. The flow rate
can affect coalescence in three ways: 1) Residence time in the coalescence channel is
longer at lower flow rates, and thus there is higher chance for droplets to coalesce but,
because coalescence frequency is normalised, this will not affect the coalescence frequency
as such. 2) At lower total flow rate, the contact time of colliding droplets may become
longer (Krebs et al. 2012b; Zhou et al. 2016), and thus more coalescence is expected when
the collision time exceeds the time for film drainage. 3) Besides, at low flow rate
convective transport of proteins towards the interface will be reduced (Muijlwijk, Huang, et
al. 2016), and this may reduce surface coverage, potentially leading to more coalescence.
Figure 6.3. Mean coalescence frequency with 0.0005 (♦) and 0.005 (▲) wt. % β-lactoglobulin as a function of the total flow rate and microscope images from the outlet of the coalescence channel. The adsorption time was 100 ms. The error bars indicate the standard deviation of the three recordings taken per measurement, most of them being within data markers.
Effect of adsorption time
By changing the adsorption channel length, we intended to vary the time for protein
adsorption, but also the number of curves in the adsorption channel increased. The channel
0
0.5
1
1.5
2
2.5
0 20 40 60 80
f coal
(s-1
)
Total flow rate (μL/min)

Coalescence of protein-stabilised emulsions
115
length was varied from 1.6 to 25.6 mm and the residence time in this channel, referred to as
adsorption time (tads), accordingly increased from 11 to 173 ms at a total flow rate of 42
μL/min (Appendix Figure A6.1). Coalescence frequency is shown together with
microscope images taken at the coalescence channel outlet in Figure 6.4. At low
concentration, stability improved by increasing adsorption time, but droplet coalescence
was still observed in the chip with the longest adsorption time. At higher protein
concentrations (i.e., ≥ 0.005 wt. %), droplets were unstable in the chip with the shortest
adsorption time, and were completely stable against coalescence when adsorption time was
sufficient (i.e., ≥ 31 ms). Note that droplets formed with ≤ 0.001 wt. % β-lactoglobulin
were very unstable against coalescence for the shortest channels, and for clarity these data
points were omitted from Figure 6.4, but are in the Appendix (Figure A6.3).
Besides the adsorption time, it is important to point out that the number of curves in the
design may have influenced mass transfer (Jiang et al. 2004), and therewith coalescence
frequency. The 11 ms channel has no curve, while the 31 and 65 ms channels have 1 curve,
and the 100 and 173 ms channels have 3 curves (Appendix Figure A6.1). When looking at
Figure 6.4, the values for coalescence frequency for the 31 and 65 ms seem to be at similar
levels, as is the case for the 100 and 173 ms channels, and this could point to an increase of
mass transfer with the number of curves.
Figure 6.4. Mean coalescence frequency as a function of the adsorption time with 0.0005 (♦), 0.001 (■), 0.005 (▲), and 0.01 (●) wt. % β-lactoglobulin and microscope images from the outlet of the coalescence channel. The
0
0.1
0.2
0.3
0 50 100 150
f coal
(s-1
)
tads (ms)

Chapter 6
116
error bars indicate the standard deviation of the three recordings taken per measurement, some of them being within data points.
Coalescence was also measured at the inlet of the coalescence channel after an adsorption
time of 11 ms (Figure 6.5). The mean number of coalescence events was very low for the
highest protein concentrations, and no difference was found between the inlet and the
outlet, whereas the number of coalescence events increased for the lowest concentrations.
There is a clear interplay between adsorption time and protein concentration in relation to
coalescence early on in the channel and at the outlet. Sufficient time for adsorption is a
requirement to create stable emulsions throughout the channel; if this time is too short
before droplets enter the coalescence channel, some coalescence will occur early on and
stabilisation may still occur inside the coalescence channel, therewith arresting further
coalescence. To be complete, upon coalescence the surface coverage will increase, which in
turn will facilitate stabilisation.
Figure 6.5. Mean number of coalescence events at the inlet (dotted bars) and outlet (solid bars) of the coalescence channel. The adsorption time before entering the coalescence channel was 11 ms.
Discussion of the outcomes for β-lactoglobulin stabilised emulsions
For the experimental conditions used here (droplets of 57 μm in diameter and an oil volume
fraction of 0.25), 0.006 wt. % β-lactoglobulin is theoretically needed for monolayer surface
0
5
10
15
20
0.0005 0.001 0.005 0.01
Nco
al (-
)
[β-lactoglobulin] (wt. %)

Coalescence of protein-stabilised emulsions
117
coverage (considering a surface load of 1.7 mg β-lactoglobulin m-2 at the tetradecane-water
interface (Courthaudon et al. 1991), which is close to the monolayer surface load of 1.65
mg/m2 determined by Tcholakova et al. (2002)). Droplets in the coalescence channel were
already stable at a concentration of 0.005 wt., which is close to the theoretical value for
monolayer coverage.
Droplet stability at such low concentrations was, to our knowledge, not reported before. For
emulsions prepared by high-pressure homogenisation, at least 30% β-lactoglobulin in
excess was needed to protect against coalescence for 48 to 72 h (Berton et al. 2011). Please
note that the calculation of the protein excess concentration corrects for the larger surface
area of droplets prepared with the high-pressure homogeniser compared to the microfluidic
droplets. The higher protein concentration needed for high-pressure homogenisation
compared to microfluidic emulsification is most probably due to differences in the
emulsification conditions. First, collision in the microfluidic channel results from laminar
shear forces (Krebs et al. 2012b), while in high-pressure homogenisers there is also
turbulent flow (Håkansson et al. 2016; Urban et al. 2006), and more stabilisation may be
needed in the latter case. Second, in the coalescence channel measurements took 2 s, while
emulsions are generally processed and stored for a longer time. Although we think that
when droplets are stable within this time interval this is most probably also the case for
longer times, it is advisable to investigate this further. More insight in the physical stability
of droplets produced at such low emulsifier concentrations could be gained with other
microfluidic devices, for example with the micro-centrifuge that can be used to study
enhanced gravity-induced coalescence (Krebs et al. 2012c; Krebs, Ershov, et al. 2013).
Third, and most strikingly, the time allowed for emulsifier adsorption before droplets
interact is rather different: in the coalescence channel emulsifier adsorption time is 11-173
ms, while this time is 0.1-30 ms in high-pressure homogenisers (Schultz et al. 2004)).
Basically droplet formation and coalescence are de-coupled in this microfluidic device,
while droplet formation and coalescence compete at very short time-scales in the
homogeniser, leading to a situation where more protein is needed to reach a stable droplet.
To sum up, the flow conditions in our microfluidic channel in combination with the
substantial adsorption time before droplet collision, and most probably enhanced mass
transfer induced by the channel curves, resulted in stable droplets at low protein
concentrations. To reduce coalescence without increasing protein concentration, the time
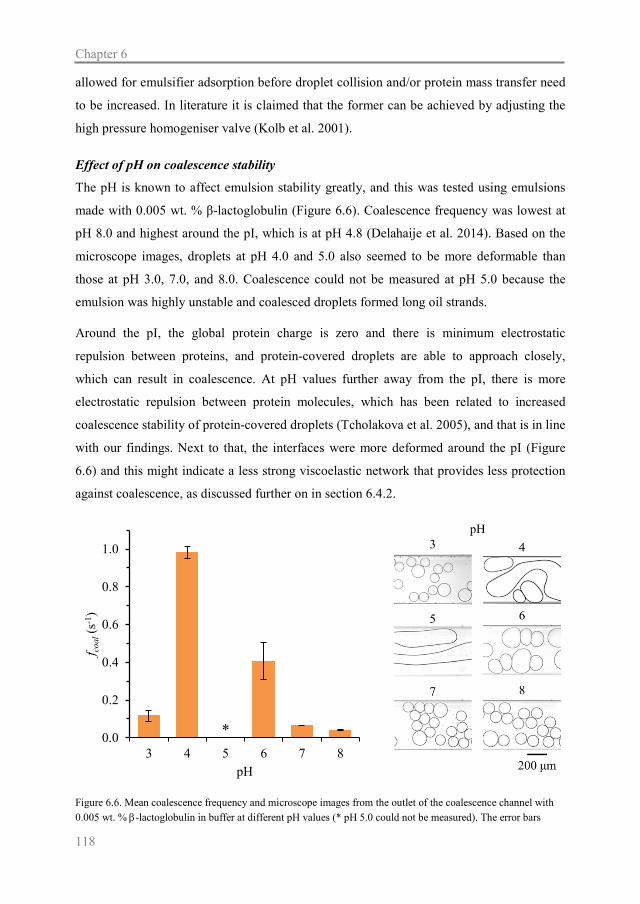
Chapter 6
118
allowed for emulsifier adsorption before droplet collision and/or protein mass transfer need
to be increased. In literature it is claimed that the former can be achieved by adjusting the
high pressure homogeniser valve (Kolb et al. 2001).
Effect of pH on coalescence stability
The pH is known to affect emulsion stability greatly, and this was tested using emulsions
made with 0.005 wt. % β-lactoglobulin (Figure 6.6). Coalescence frequency was lowest at
pH 8.0 and highest around the pI, which is at pH 4.8 (Delahaije et al. 2014). Based on the
microscope images, droplets at pH 4.0 and 5.0 also seemed to be more deformable than
those at pH 3.0, 7.0, and 8.0. Coalescence could not be measured at pH 5.0 because the
emulsion was highly unstable and coalesced droplets formed long oil strands.
Around the pI, the global protein charge is zero and there is minimum electrostatic
repulsion between proteins, and protein-covered droplets are able to approach closely,
which can result in coalescence. At pH values further away from the pI, there is more
electrostatic repulsion between protein molecules, which has been related to increased
coalescence stability of protein-covered droplets (Tcholakova et al. 2005), and that is in line
with our findings. Next to that, the interfaces were more deformed around the pI (Figure
6.6) and this might indicate a less strong viscoelastic network that provides less protection
against coalescence, as discussed further on in section 6.4.2.
Figure 6.6. Mean coalescence frequency and microscope images from the outlet of the coalescence channel with 0.005 wt. % β-lactoglobulin in buffer at different pH values (* pH 5.0 could not be measured). The error bars
0.0
0.2
0.4
0.6
0.8
1.0
3 4 5 6 7 8
f coal
(s-1
)
pH
*

Coalescence of protein-stabilised emulsions
119
indicate the standard deviation of the three recordings taken per measurement. The adsorption time before entering the coalescence channel was 11 ms.
6.4.2. Coalescence stability of emulsion droplets stabilised with whey protein isolate
β-lactoglobulin is the main component of whey protein isolate, and is often used for
research purposes but, because of the high costs for isolation, whey protein isolate is the
ingredient of choice in industrial applications, and coalescence stability with whey protein
isolate is therefore relevant (Figure 6.7). At the lowest whey protein isolate concentrations
tested (i.e., ≤ 0.002 wt. %), droplets were highly unstable, and very large coalesced droplets
were observed at the outlet of the coalescence channel. Stability increased with adsorption
time and with increasing whey protein isolate concentration. Droplets were stable when the
residence time in the adsorption channel was sufficient (i.e., 100 ms for 0.01 wt. % and 65
ms for 0.02 wt. %).
Figure 6.7. Mean coalescence frequency and microscope images from the outlet of the collision channel with 0.001 (♦), 0.002 (■), 0.01 (▲), and 0.02 (●) wt. % whey protein isolate. The error bars indicate the standard deviation of the three recordings taken per measurement, some of them being within data points.
Comparison with β-lactoglobulin stabilised emulsions
When using whey protein isolate, a higher protein concentration and a longer adsorption
time were needed to stabilise droplets against coalescence (100 ms for 0.01 wt. % whey
protein isolate, Figure 6.7) compared with β-lactoglobulin (31 ms for 0.005 wt. % β-
0
2
4
6
8
10
12
0 50 100 150
f coal
(s-1
)
tads (ms)

Chapter 6
120
lactoglobulin, Figure 6.4). This observation is interesting, as the functional properties of
whey protein isolate are often attributed to those of its main component, β-lactoglobulin,
and very few studies have systematically compared whey protein isolate and β-
lactoglobulin in that respect. It is thus interesting to speculate on the possible mechanisms
involved. The interfacial tension of β-lactoglobulin and whey protein isolate at the water-
hexadecane interface were determined (Appendix Figure A6.4), and no differences were
found between them, but the electrostatic interactions, viscoelastic, or steric properties of
the interfacial layer may have been different.
As mentioned previously when discussing the effect of pH, charge can stabilise droplets
through repulsive electrostatic interactions that prevent droplets from coming into close
contact (Tcholakova et al. 2006). In our experiments, the pH was fixed at 7.0 and at this pH
the charge of β-lactoglobulin is similar to that of whey protein isolate (Lam & Nickerson
2015; Lam & Nickerson 2014), and the conductivity of the protein solutions was
comparable (section 6.3.1), therefore it is not likely that electrostatic interactions are
responsible for the observed differences between β-lactoglobulin- and whey protein isolate-
stabilised emulsions.
A more viscoelastic protein network reduces film drainage (Bhamla et al. 2014; Tambe &
Sharma 1991) and tends to resist dilatational deformation (Bos & van Vliet 2001; Murray
2011), and thus decreases coalescence (Amine et al. 2014). A stronger interfacial
viscoelastic network is formed with β-lactoglobulin compared to α-lactalbumin, which is
also present in whey protein isolate, because of the establishment of S-S bonds between β-
lactoglobulin molecules at the interface (Dickinson et al. 1989). And when a protein
mixture is used, as is the case for whey protein isolate, this interfacial layer is less strongly
connected than for pure proteins (Dalgleish 1997). It should be mentioned that these
differences were reported for equilibrated films that take hours to form, and these
conditions were most probably not met in the short microfluidic experiments, but our
findings might be indicative of the fact that these effects occur very early on in film
formation. In order to determine this, interfacial rheology would need to be determined in
the millisecond time-scale, which may be possible through interfacial mobility
measurement with microfluidics (Martin et al. 2011; Schwalbe et al. 2011; Erk et al. 2012),
but this is considered outside the scope of the present work.

Coalescence of protein-stabilised emulsions
121
To sum up, it is difficult to pinpoint the exact reason for the difference in coalescence
stability between β-lactoglobulin- and whey protein isolate-stabilised emulsions. Most
likely, β-lactoglobulin forms an interfacial film with a higher viscoelasticity or stronger
steric repulsion that provides better protection against coalescence at these time-scales
compared to whey protein isolate. In the whey protein isolate interface, also other whey
proteins such as α-lactalbumin, bovine serum albumin, and immunoglobulins may be
present besides β-lactoglobulin, and they may weaken the interfacial protein network,
whereas the β-lactoglobulin interface has a homogeneous composition.
6.4.3. Effect of whey protein oxidation on coalescence stability
Oxidation of dairy proteins can occur during processing as a result of heat treatment, light
exposure, or presence of oxygen (Fenaille et al. 2005), and may also vary between batches.
Upon whey protein isolate oxidation, aggregates and peptides are formed and the protein
interfacial network becomes less elastic (Berton-Carabin et al. 2016). Up to a certain
protein oxidation level, the oil-water interfacial tension in the presence of oxidised whey
protein isolate decreases faster than with non-oxidised whey protein isolate because the
formed peptides adsorb more rapidly (Berton-Carabin et al. 2016). Oxidised proteins can
change the emulsifying ability and emulsion stability index (Kong et al. 2013), and it is thus
important to quantify the effect of protein oxidation on coalescence.
The mean coalescence frequency with corresponding microscope images of hexadecane
droplets stabilised with oxidised whey protein isolate is in Figure 6.8. Coalescence stability
of droplets with the lowest oxidised whey protein concentration (i.e., 0.001 wt. %) was very
poor: many droplets could not even be measured because they were larger than the
measurement window, therefore these data are not shown. Coalescence stability increased
with increasing protein concentration but droplets were only stable when 0.02 wt. %
oxidised whey protein isolate was used in the longest adsorption channel.

Chapter 6
122
Figure 6.8. Mean coalescence frequency and microscope images from the outlet of the coalescence channel with 0.002 (■), 0.01 (▲) and 0.02 (●) wt. % oxidised whey protein isolate (0.001 wt. % could not be measured). The error bars indicate the standard deviation of the three recordings taken per measurement, some of them being within data points.
Protein oxidation clearly decreased coalescence stability: in the longest adsorption channel,
0.01 wt. % whey protein isolate was needed to stabilise against coalescence (Figure 6.7)
compared to 0.02 wt. % oxidised whey protein isolate (Figure 6.8). In line with what was
discussed previously, mixed interfaces may be less protective against coalescence due to
changes in electrostatic interactions, surface viscoelasticity, or steric interactions, and in the
case of oxidised protein even more components are present. Peptides have an effect on the
droplet surface charge (Smulders 2000), but it is unknown what effect the peptides formed
during protein oxidation have on electrostatic emulsion stability. Surface viscoelasticity
was shown to change upon oxidation (Berton-Carabin et al. 2016), but as discussed
previously it is unclear how fast this viscoelastic protein layer is formed. A third possible
explanation is that the oxidised protein interface provides less steric repulsion, for example
because the interface, at least for certain interfacial domains, is thinner in presence of
peptides (McClements 2005), or because peptides more readily desorb from the interface
than proteins (Smulders 2000).
Integrating all the present outcomes on coalescence stability of emulsions stabilised by β-
lactoglobulin, whey protein isolate, and oxidised whey protein isolate, there seems to be a
trend that more heterogeneous (in composition and/or structure) interfaces are less stable
0
2
4
6
8
10
12
0 50 100 150
f coal
(s-1
)
tads (ms)

Coalescence of protein-stabilised emulsions
123
against coalescence than homogeneous interfaces. Further investigations will be needed to
assess the underlying mechanisms.
6.5. Conclusions This work highlights the importance of protein concentration and adsorption time for
coalescence stability of emulsions. When the adsorption time was 31 ms or longer, a β-
lactoglobulin concentration slightly below the concentration needed for full surface
coverage was sufficient to stabilise the interface against coalescence. Emulsions stabilised
with β-lactoglobulin were more stable than emulsions stabilised with whey protein isolate,
and coalescence stability decreased upon protein oxidation. The reason for these differences
is not yet fully elucidated, but our results may indicate that a homogeneous protein-
stabilised interface offers better protection against coalescence than a heterogeneous
interface.
The results obtained with the microfluidic coalescence channel demonstrate the importance
of adsorption time and interface composition for emulsion droplet stability during
processing. With this device, it is possible to measure coalescence separately from droplet
formation, which can give new insights in the stabilisation of fluid interfaces by proteins
and other emulsifiers. For larger scale industrial emulsification, higher protein
concentrations are used and our results indicate that this process could be optimised
considerably when taking the time needed for interface stabilisation as a starting point.

Chapter 6
124
6.6. Appendix
Figure A6.1. Design of the different coalescence chips with the length of the adsorption channel indicated for each design and the corresponding residence time at a continuous phase flow rate of 40 μL/min and a dispersed phase flow rate of 2 μL/min.
Figure A6.2. Example of a droplet size distribution and coalescence event distribution of an experiment with 0.005 wt. % β-lactoglobulin. The adsorption time was 11 ms.
0 1 2 3 4 5
Rel
ativ
e oc
cure
nce
(-)
Droplet area relative to initial area (-) 0 1 2 3 4 5
Rel
ativ
e oc
cure
nce
(-)
Coalescence events (-)

Coalescence of protein-stabilised emulsions
125
Table A6.1. Used dispersed, continuous, and total flow rate and measured volume fraction for data presented in Figure 6.3.
φd (µL/min) φc (µL/min) φtotal (μL/min) Φ (-)
1.4 30 31 0.28
1.7 40 42 0.25
1.9 50 52 0.24
2.1 60 62 0.24
2.2 70 72 0.24
Figure A6.3. Mean coalescence frequency events of the coalescence channel as a function of the residence time with 0.0005 (♦), 0.001 (■), 0.005 (▲), and 0.01 (●) wt. % β-lactoglobulin. The error bars indicate the standard deviation of the three recordings taken per measurement.
Figure A6.4. Interfacial tension of 0.1 wt. % β-lactoglobulin (—) and whey protein isolate (—) with hexadecane. Measurements were done in triplicate and for clarity only one measurement is shown for each sample, which is representative for the other measurements.
0
2
4
6
8
10
12
0 50 100 150
f coal
(s-1
)
tads (ms)
0
10
20
30
40
0 20 40 60 80 100
Inte
rfac
ial t
ensi
on (m
N/m
)
Time (s)


7 7. General discussion

Chapter 7
128
7.1. Introduction The focus of this thesis was to use microfluidic methods to study emulsifier adsorption and
coalescence stability of emulsions. The underlying thought was to gain better understanding
of emulsion formation and physical stability during processing. This information is
expected to help optimise processes with respect to ingredient formulation and processing
conditions, and will form a scientific basis for new process design. The main challenge was
to investigate the aspects mentioned earlier at very short time-scales, and in this chapter the
most important findings will be discussed and related to industrial emulsification.
7.2. Main findings A literature review about the dependency of cross-flow microfluidic emulsification on
microfluidic design, shear forces, and interfacial tension forces is given in Chapter 2. From
the available designs, the Y-junction microfluidic device was chosen to measure interfacial
tension at very short time-scales, and the method and model development are described in
Chapter 3. The acting interfacial tension at the moment of droplet break-up was measured
based on the known relation with droplet size, and measurements were done at short time-
scales (0.4-9.4 ms), and high expansion rates (100-2000 s-1). From the findings in this
chapter, it became clear that emulsifier transport was fast, therefore the mass transfer
conditions were investigated further in Chapter 4, in which we found that mass transfer in
the Y-junction was dominated by convection (both in the continuous and dispersed phase).
The acting interfacial tension in the presence of food-grade emulsifiers (Tween 20 and Span
20) was reported in Chapter 5 for different dispersed phases (alkanes of various chain
lengths). Besides droplet formation, droplet stability to coalescence in the presence of
proteins (β-lactoglobulin and whey protein isolate) was investigated in Chapter 6 with a
microfluidic coalescence channel, and it was found that for the conditions probed, stable
emulsions may be obtained at concentrations just below monolayer surface coverage.
7.3. Relevance for emulsification As discussed in Chapter 1, emulsification is most efficient when there is minimal
coalescence, which implies that emulsifiers should stabilise the interface before droplet
collision. Typical time-scales for emulsifier adsorption are given in Table 7.1 for each of
the emulsification devices described in Chapter 1. For the high-pressure homogeniser and
colloid mill this is the time droplets spend in the dispersing zone, for pre-mix membrane

General discussion
129
emulsification the time droplets spend inside the membrane, and for direct membrane
emulsification and microfluidic emulsification the droplet formation time. Adsorption time
in the coalescence channel is relatively long and therefore it is expected that is represents
phenomena occurring in colloid mills, direct membrane emulsification, and spontaneous
microfluidic emulsification, whereas the Y-junction can be used to study faster processes
such as the high-pressure homogeniser, premix membrane emulsification, and shear-based
microfluidic emulsification.
Table 7.1. Time-scale for emulsifier adsorption in various emulsification devices.
Emulsification device Adsorption time-scale (s)
High-pressure homogeniser 10-4 - 10-2 (Schultz et al. 2004)
Colloid mill 10-1 – 100 (Schultz et al. 2004)
Direct membrane emulsification 10-2 (van der Graaf et al. 2004)
Pre-mix membrane emulsification 10-6 – 10-1 (Nazir, Boom, et al. 2013; Nazir, Schroën, et al. 2013)
Spontaneous microfluidic emulsification 10-2 – 10-1 (Kobayashi et al. 2008)
Shear-based microfluidic emulsification 10-4 (Nisisako & Torii 2008)
Y-junction 10-4 - 10-2
Coalescence channel 10-2 - 10-1
In Chapter 6 we have shown that the time allocated for emulsifiers to adsorb determines
emulsion stability against coalescence. Other results in literature point in the same
direction: 1) Karbstein and Schubert (1995) reported that emulsions formed with colloid
mills were more stable against immediate coalescence than emulsions formed in toothed
disc dispersing machines and high-pressure homogenisers, and they argue that this results
from the longer emulsifier adsorption time in the colloid mill. 2) A high-pressure
homogeniser equipment was improved by Kolb et al. (2001) who designed a high-pressure
valve (combined orifice valve) with a turbulence chamber to prolong the time spent by
droplets in the dispersing zone (where collision time is too short for coalescence) from 0.1-
3 to 0.5-30 ms (Schultz et al. 2004), and this indeed resulted in less coalescence compared
to the normal orifice valve (Figure 7.1). However, the direct effect of adsorption time on
coalescence during processing could not be quantified in these studies because droplet
formation and coalescence could not be decoupled in the measurements. Our microfluidic
method can do so, and indeed shows that adsorption time is key for coalescence stability. It
is thus possible that such measurements can help to optimise emulsification devices, as they
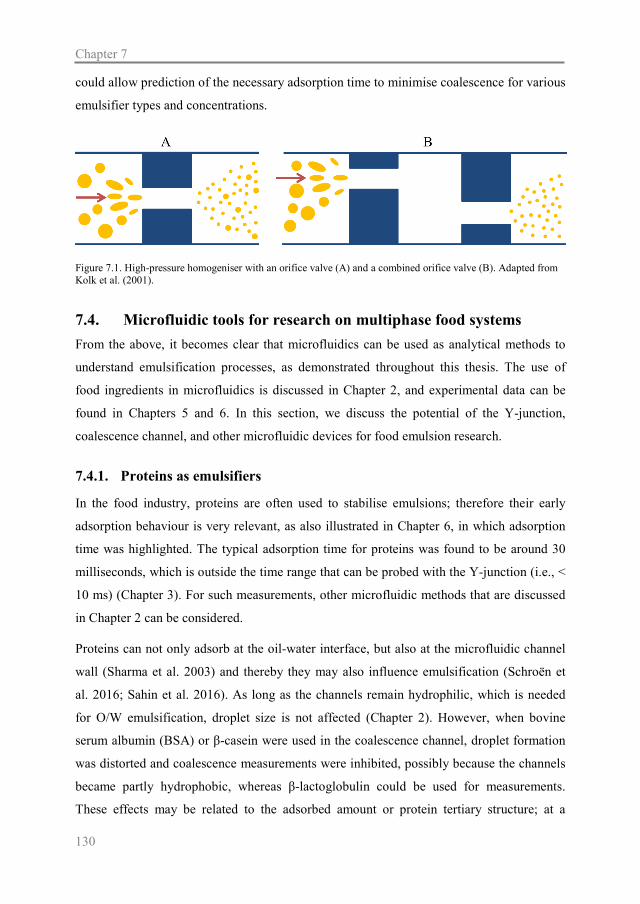
Chapter 7
130
could allow prediction of the necessary adsorption time to minimise coalescence for various
emulsifier types and concentrations.
Figure 7.1. High-pressure homogeniser with an orifice valve (A) and a combined orifice valve (B). Adapted from Kolk et al. (2001).
7.4. Microfluidic tools for research on multiphase food systems From the above, it becomes clear that microfluidics can be used as analytical methods to
understand emulsification processes, as demonstrated throughout this thesis. The use of
food ingredients in microfluidics is discussed in Chapter 2, and experimental data can be
found in Chapters 5 and 6. In this section, we discuss the potential of the Y-junction,
coalescence channel, and other microfluidic devices for food emulsion research.
7.4.1. Proteins as emulsifiers
In the food industry, proteins are often used to stabilise emulsions; therefore their early
adsorption behaviour is very relevant, as also illustrated in Chapter 6, in which adsorption
time was highlighted. The typical adsorption time for proteins was found to be around 30
milliseconds, which is outside the time range that can be probed with the Y-junction (i.e., <
10 ms) (Chapter 3). For such measurements, other microfluidic methods that are discussed
in Chapter 2 can be considered.
Proteins can not only adsorb at the oil-water interface, but also at the microfluidic channel
wall (Sharma et al. 2003) and thereby they may also influence emulsification (Schroën et
al. 2016; Sahin et al. 2016). As long as the channels remain hydrophilic, which is needed
for O/W emulsification, droplet size is not affected (Chapter 2). However, when bovine
serum albumin (BSA) or β-casein were used in the coalescence channel, droplet formation
was distorted and coalescence measurements were inhibited, possibly because the channels
became partly hydrophobic, whereas β-lactoglobulin could be used for measurements.
These effects may be related to the adsorbed amount or protein tertiary structure; at a

General discussion
131
hydrophilic surface more BSA adsorbs compared to β-lactoglobulin (Brzozowska et al.
2010), and flexible proteins (β-casein) adsorb rather freely, whereas rigid proteins (β-
lactoglobulin and BSA) need to unfold to expose their inner hydrophobic groups (Walstra
2003). In contrast to the coalescence channel experiments, BSA and β-lactoglobulin could
be used successfully in spontaneous emulsification devices (use of β-casein was not
reported), however also in these channels proper droplet formation depended on the used
emulsifier-oil combination (Sahin et al. 2016; Saito et al. 2005). The main difference is the
droplet formation mechanism and the surface contact area with the droplets, which is high
in the coalescence channel, while droplets move freely after formation in spontaneous
emulsification devices. However, whether these factors are indeed responsible for the
differences in the compatibility of proteins in microfluidic channels is unclear.
In food matrices, proteins are often used in the presence of other emulsifiers. For example
when used with different proteins, this may affect emulsion coalescence stability as shown
in Chapter 6. Proteins are also used together with low molecular weight emulsifiers, which
affects interfacial behaviour because of competitive adsorption between them (Pugnaloni et
al. 2004) and possibly droplet coalescence stability. Relatively new is the use of protein-
polysaccharide complexes to stabilise emulsions, for which stability needs to be further
assessed (Evans et al. 2013). Coalescence stability of these systems can be elucidated with
microfluidics; the ingredient mixture is used as the continuous phase, or the second
ingredient (emulsifier or polysaccharide) is added in the coalescence channel via a channel
designed for that purpose after droplets are formed and stabilised with the first ingredient.
The flexibility of microfluidic design makes it possible to add additional emulsifiers at any
point after droplet formation. Another option is to include hydrophobic emulsifiers (e.g.,
mono-diglycerides or lecithins) in the to-be-dispersed oil phase.
7.4.2. Interfacial mobility
Microfluidic devices can also be used to measure interfacial mobility (Martin & Hudson
2009; Martin et al. 2011), and dilatational interfacial rheology (Schwalbe et al. 2011; Erk et
al. 2012), which are important parameters to quantify because of their role in droplet
coalescence stability: interface immobilisation reduces film drainage (Martin et al. 2011),
and film rupture can be seen as dilatational deformation (Bos & van Vliet 2001). For such
measurements, particle movement at the interface is tracked (Figure 7.2A), and from these

Chapter 7
132
images interfacial mobility was determined (Figure 7.2B). The same method was used to
measure dilatational interfacial rheology, and the time-scale for such measurements is 0.5-
20 s. When this time-scale is brought down to the millisecond time-scale, which is the time-
scale relevant for the microfluidic coalescence channel, this would provide more insight on
the effect of interfacial mobility and viscoelasticity on coalescence stability shortly after
droplet formation, as discussed in Chapter 6.
A
B
Figure 7.2. Superimposed images of a flowing droplet illustrating the internal flow pattern with streak lines that visualise polystyrene tracer particle motion at the oil-water interface (A), and from which the internal drop circulation was measured as a function of the interfacial tension for different butanol concentrations (0 (*), 0.5 (X), 1 (▲), 2 (■), and 5 (♦) %) (B). From Martin et al. (2011) and Martin and Hudson (2009).
7.4.3. Particles as stabilisers
Besides standard food emulsifiers such as proteins and surfactants, colloidal particles are an
interesting new class of interface stabilisers. Particles that are partly wetted by oil and water
can adsorb at the oil-water interface; the energy needed for desorption depends on their
three-phase contact angle and on the particle size. When desorption energy is larger than
0
0.1
0.2
0.3
0.4
0.5
10 20 30 40 50
Inte
rnal
dro
p ci
rcul
atio
n (-
)
Interfacial tension (mN/m)
remobilise
immobilised
expected fully mobile interface

General discussion
133
the thermal energy, particles are irreversibly adsorbed and the interface is stabilised against
coalescence, which is referred to as Pickering stabilisation (Berton-Carabin & Schroën
2015). Adsorption of particles requires convective mass transfer (Anna 2016; Berton-
Carabin & Schroën 2015), and microfluidic devices that operate under convective mass
transfer conditions are therefore expected to be useful for Pickering emulsion formation.
Because of this, the coalescence channel may be used to determine when and where
particles, but also proteins and surfactants, adsorb at the interface by fluorescence
microscopy, as shown previously by Baret et al. (2009) for surfactants. Also the effect of
the adsorption channel length and number of curves can be measured, as was done in
Chapter 6 for proteins, and therewith important design parameters can be elucidated.
Although inorganic particles have been used in microfluidic channels to stabilise foams
(Kotula & Anna 2012) and emulsions (Priest et al. 2011), the use of bio-based particles has
not been published yet, and microfluidic devices will be instrumental in speeding up the
formulation of Pickering emulsions.
7.4.4. Storage stability
Coalescence stability of emulsions under enhanced gravity can be measured with a micro-
centrifuge (Krebs, Ershov, et al. 2013). For these measurements, a rectangular dead-end
channel containing an emulsion is placed on a custom-made centrifuge and microscope
images are recorded with a high-speed camera during centrifugation. Coalescence time and
extent can be determined from the microscope images as shown in Figure 7.3. The increase
in droplet size and the evolution of the oil layer is visualised, from which the amount of
coalesced oil is quantified. With this set-up, it is possible to measure coalescence of highly
packed emulsions under enhanced gravity. Depending on the centrifugation speed (relative
radial accelerations of 0.9 to 4000 g can be reached), this information can be used to predict
stability under processing and storage shelf life conditions. Also temperature dependency of
coalescence stability can be measured with the micro-centrifuge as shown by Feng et al.
(2014).

Chapter 7
134
A
B
Figure 7.3. Microscope images of the micro-centrifuge sample chamber taken during centrifugation (A), and the amount of coalesced oil of the bulk (○), at the front (Δ), and in the total sample (□) (B). Adapted from Feng et al. (2014).
7.4.5. Foams
Since foam is also a two phase colloidal system, it can be expected that the learnings taken
from emulsions can, at least to some extent, be applied to foams. Many food products
contain air bubbles, for example whipped cream, beer, bread, ice cream, mousse, and
aerated chocolate (Campbell & Mougeot 1999), and these products may destabilise due to
drainage, Ostwald ripening, or coalescence, of which the latter is the least understood
0.00
0.10
0.20
0.30
0.40
0.50
0 50 100 150 200
Coa
lesc
ed a
rea
(mm
2 )
Time (s)
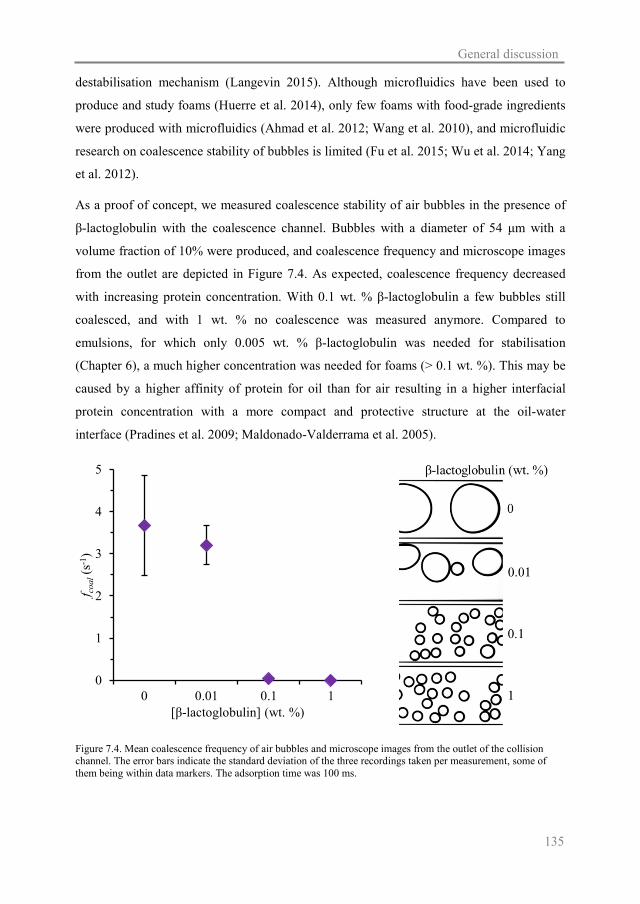
General discussion
135
destabilisation mechanism (Langevin 2015). Although microfluidics have been used to
produce and study foams (Huerre et al. 2014), only few foams with food-grade ingredients
were produced with microfluidics (Ahmad et al. 2012; Wang et al. 2010), and microfluidic
research on coalescence stability of bubbles is limited (Fu et al. 2015; Wu et al. 2014; Yang
et al. 2012).
As a proof of concept, we measured coalescence stability of air bubbles in the presence of
β-lactoglobulin with the coalescence channel. Bubbles with a diameter of 54 μm with a
volume fraction of 10% were produced, and coalescence frequency and microscope images
from the outlet are depicted in Figure 7.4. As expected, coalescence frequency decreased
with increasing protein concentration. With 0.1 wt. % β-lactoglobulin a few bubbles still
coalesced, and with 1 wt. % no coalescence was measured anymore. Compared to
emulsions, for which only 0.005 wt. % β-lactoglobulin was needed for stabilisation
(Chapter 6), a much higher concentration was needed for foams (> 0.1 wt. %). This may be
caused by a higher affinity of protein for oil than for air resulting in a higher interfacial
protein concentration with a more compact and protective structure at the oil-water
interface (Pradines et al. 2009; Maldonado-Valderrama et al. 2005).
Figure 7.4. Mean coalescence frequency of air bubbles and microscope images from the outlet of the collision channel. The error bars indicate the standard deviation of the three recordings taken per measurement, some of them being within data markers. The adsorption time was 100 ms.
0
1
2
3
4
5
0 0.01 0.1 1
f coal
(s-1
)
[β-lactoglobulin] (wt. %)

Chapter 7
136
This foam experiment shows that it is possible to form protein-stabilised air bubbles in a
microfluidic device and subsequently measure their coalescence stability. The layout is
flexible in the choice of gas, emulsifier, or particle and we think that formulation of foam
systems could be greatly facilitated by early evaluation with the microfluidic coalescence
channel.
7.5. Concluding remarks Microfluidic devices can be used to study emulsion formation and stability under
conditions relevant to industrial emulsification processes. With these devices, one can
separate or combine measurements on interfacial tension during droplet formation, interface
mobility, emulsion coalescence stability, and emulsion storage stability, to obtain a better
understanding on the effect of ingredient formulation and processing conditions on
emulsion formation and subsequent stability. With such information, industry can screen
and evaluate ingredients for their potential to stabilise interfaces. The advantage of
microfluidic devices over existing methods are the use of low fluid amounts, which reduces
ingredient costs and allows screening of new ingredients that are not available in bulk yet.
Microfluidics can also reduce production costs: 1) When it is known what type of
emulsifier or mixture is best to use and how much of that is needed to form and stabilise
emulsions, ingredient formulation can be optimised. 2) When the effect of processing
parameters on emulsion formation and stability is known, processing parameters can be
optimised to reduce coalescence and thereby increase energy efficiency. And when
designing new emulsification processes, such as microfluidic devices or other
microstructured devices, even more detailed information can become available for
optimising the design through microfluidic measurements. Therefore, we envision that the
microfluidic devices presented in this thesis, but also other devices yet to be developed, will
lead to faster ingredient screening, lower ingredient usage, and more energy efficient
production of emulsions.


R 8. References
References
140
Abate, A.R. et al., 2012. Experimental validation of plugging during drop formation in a T-junction. Lab on a Chip - Miniaturisation for Chemistry and Biology, 12, pp.1516–1521.
Abate, A.R. et al., 2009. Impact of inlet channel geometry on microfluidic drop formation. Physical Review E - Statistical, Nonlinear, and Soft Matter Physics, 80, p.26310.
Ben Abdelwahed, M.A. et al., 2012. Characterisation of bubbles formed in a cylindrical T-shaped junction device. Chemical Engineering Science, 76, pp.206–215.
Abramovic, H. & Klofutar, C., 1998. The temperature dependence of dynamic viscosity for some vegetable oils. Acta Chimica Slovenica, 45(1), pp.69–77.
Acharya, K.R., Bhattacharyya, S.C. & Moulik, S.P., 1999. Effects of carbohydrates on the solution properties of surfactants and dye–micelle complexation. Journal of Photochemistry and Photobiology A: Chemistry, 122, pp.47–52.
Ahmad, B., Stride, E. & Edirisinghe, M., 2012. Calcium alginate foams prepared by a microfluidic T-junction system: stability and food applications. Food and Bioprocess Technology, 5, pp.2848–2857.
Alvarez, N.J., Walker, L.M. & Anna, S.L., 2012. A criterion to assess the impact of confined volumes on surfactant transport to liquid–fluid interfaces. Soft Matter, 8, p.8917.
Amine, C. et al., 2014. Investigation of emulsifying properties and emulsion stability of plant and milk proteins using interfacial tension and interfacial elasticity. Food Hydrocolloids, 39, pp.180–186.
Anna, S.L., 2016. Droplets and bubbles in microfluidic devices. Annual Review of Fluid Mechanics, 48, pp.285–309.
Anna, S.L., Bontoux, N. & Stone, H. a., 2003. Formation of dispersions using ‘flow focusing’ in microchannels. Applied Physics Letters, 82(3), pp.364–366.
Anna, S.L. & Mayer, H.C., 2006. Microscale tipstreaming in a microfluidic flow focusing device. Physics of Fluids, 18(12), p.121512.
Aryanti, N. et al., 2006. Performance of rotating membrane emulsification for o/w production. Desalination, 200, pp.572–574.
Atalay, Y.T. et al., 2011. Microfluidic analytical systems for food analysis. Trends in Food Science & Technology, 22, pp.386–404.
Atencia, J. & Beebe, D.J., 2005. Controlled microfluidic interfaces. Nature, 437, pp.648–655.
Baret, J.C. et al., 2009. Kinetic aspects of emulsion stabilization by surfactants: A microfluidic analysis. Langmuir, 25(11), pp.6088–6093.
Baret, J.C., 2012. Surfactants in droplet-based microfluidics. Lab on a chip, 12, pp.422–433.
Baroud, C.N., 2008. Marangoni convection. Encyclopedia of Microfluidics and Nanofluidics, pp.1050–1055.
Baroud, C.N., Gallaire, F. & Dangla, R., 2010. Dynamics of microfluidic droplets. Lab on a Chip, 10, pp.2032–2045.
Bashir, S., Rees, J.M. & Zimmerman, W.B., 2014. Investigation of pressure profile evolution during confined microdroplet formation using a two-phase level set method. International Journal of Multiphase Flow, 60, pp.40–49.
Becker, H. & Locascio, L.E., 2002. Polymer microfluidic devices. Talanta, 56, pp.267–287.
Berton-Carabin, C. et al., 2016. Protein and lipid oxidation affect the viscoelasticity of whey protein layers at the oil-water interface. European Journal of Lipid Science and Technology, 118,

References
141
pp.1630–1643.
Berton-Carabin, C.C., Ropers, M.H. & Genot, C., 2014. Lipid oxidation in oil-in-water emulsions: involvement of the interfacial layer. Comprehensive Reviews in Food Science and Food Safety, 13, pp.945–977.
Berton-Carabin, C.C. & Schroën, K., 2015. Pickering emulsions for food applications: background, trends, and challenges. Annual review of food science and technology, 6, pp.263–297.
Berton, C.C. et al., 2012. Effect of lateral heterogeneity in mixed surfactant-stabilized interfaces on the oxidation of unsaturated lipids in oil-in-water emulsions. Journal of Colloid and Interface Science, 377, pp.244–250.
Berton, C.C., Genot, C. & Ropers, M.H., 2011. Quantification of unadsorbed protein and surfactant emulsifiers in oil-in-water emulsions. Journal of colloid and interface science, 354, pp.739–748.
Bhamla, M.S. et al., 2014. Influence of interfacial rheology on drainage from curved surfaces. Soft Matter, 10(36), pp.6859–7134.
Bonn, D. et al., 2009. Wetting and spreading. Reviews of Modern Physics, 81, pp.739–805.
Boom, R.M. & Schroën, C.G.P.H., 2011. Emulsification with micro-structured membranes and micro-engineered systems. In Bubble and Drop Interfaces. Brill, pp. 481–502.
Bos, M.A. & van Vliet, T., 2001. Interfacial rheological properties of adsorbed protein layers and surfactants: a review. Advances in Colloid and Interface Science, 91, pp.437–471.
Bremond, N. & Bibette, J., 2012. Exploring emulsion science with microfluidics. Soft Matter, 8, pp.10549–10559.
Brösel, S. & Schubert, H., 1999. Investigations on the role of surfactants in mechanical emulsification using a high-pressure homogenizer with an orifice valve. Chemical Engineering and Processing: Process Intensification, 38, pp.533–540.
Brosseau, Q., Vrignon, J. & Baret, J.-C., 2014. Microfluidic dynamic interfacial tensiometry (μDIT). Soft matter, 10(1), pp.3066–3076.
De Bruijn, R.A., 1993. Tipstreaming of drops in simple shear flows. Chemical Engineering Science, 48(2), pp.277–284.
Brun, M. et al., 2015. Stabilization of air bubbles in oil by surfactant crystals: A route to produce air-in-oil foams and air-in-oil-in-water emulsions. Food Research International, 67, pp.366–375.
Brzozowska, A.M. et al., 2010. Reduction of protein adsorption on silica and polysulfone surfaces coated with complex coacervate core micelles with poly(vinyl alcohol) as a neutral brush forming block. Colloids and Surfaces A: Physicochemical and Engineering Aspects, 368, pp.96–104.
Campbell, G.M. & Mougeot, E., 1999. Creation and characterisation of aerated food products. Trends in Food Science and Technology, 10, pp.283–296.
Capretto, L. et al., 2013. Microfluidic and lab-on-a-chip preparation routes for organic nanoparticles and vesicular systems for nanomedicine applications. Advanced drug delivery reviews, 65, pp.1496–1532.
Carrier, O., Funfschilling, D. & Li, H.Z., 2014. Effect of the fluid injection configuration on droplet size in a microfluidic T junction. Physical Review E, 89, p.13003.
Cecchet, F. et al., 2006. One step growth of protein antifouling surfaces: monolayers of poly (ethylene oxide)(PEO) derivatives on oxidized and hydrogen-passivated silicon surfaces. Langmuir, 22, pp.1173–1181.

References
142
Chan, D.Y.C., Klaseboer, E. & Manica, R., 2011. Film drainage and coalescence between deformable drops and bubbles. Soft Matter, 7, pp.2235–2264.
Charcosset, C., 2009. Preparation of emulsions and particles by membrane emulsification for the food processing industry. Journal of Food Engineering, 92, pp.241–249.
Charcosset, C., Limayem, I. & Fessi, H., 2004. The membrane emulsification process - A review. Journal of Chemical Technology and Biotechnology, 79, pp.209–218.
Chen, N. et al., 2012. CFD simulation of droplet formation in a wide-type microfluidic T-junction. Journal of Dispersion Science and Technology, 33, pp.1635–1641.
Chesters, A.K., 1991. The modelling of coalescence process in fluid-liquid dispersions: A Review of Current Understanding. Chemical Engineering Research and Design, 69, pp.259–270.
Choi, C. et al., 2014. Microfluidic design of complex emulsions. ChemPhysChem, 15, pp.21–29.
Christopher, G.F. et al., 2008. Experimental observations of the squeezing-to-dripping transition in T-shaped microfluidic junctions. Physical Review E - Statistical, Nonlinear, and Soft Matter Physics, 78, p.36317.
Corstens, M.N. et al., 2015. Food-grade micro-encapsulation systems that may induce satiety via delayed lipolysis: A review. Critical Reviews in Food Science and Nutrition.
Courthaudon, J.L. et al., 1991. Competitive adsorption of ??-lactoglobulin + tween 20 at the oil-water interface. Colloids and Surfaces, 56(C), pp.293–300.
Cramer, C., Fischer, P. & Windhab, E.J., 2004. Drop formation in a co-flowing ambient fluid. Chemical Engineering Science, 59(15), pp.3045–3058.
Dalgleish, D., 1997. Adsorption of protein and the stability of emulsions. Trends in Food Science & Technology, 8, pp.1–6.
Delahaije, R.J.B.M. et al., 2014. Quantitative description of the parameters affecting the adsorption behaviour of globular proteins. Colloids and surfaces B: Biointerfaces.
Derzsi, L. et al., 2011. Hydrophilic polycarbonate for generation of oil in water emulsions in microfluidic devices. Lab on a Chip, 11, pp.1151–1156.
Dickinson, E., 2010. Food emulsions and foams: Stabilization by particles. Current Opinion in Colloid & Interface Science, 15, pp.40–49.
Dickinson, E., 2012. Use of nanoparticles and microparticles in the formation and stabilization of food emulsions. Trends in Food Science & Technology, 24(1), pp.4–12.
Dickinson, E., Rolfe, S.E. & Dalgleish, D.G., 1989. Competitive adsorption in oil-in-water emulsions containing α-lactalbumin and β-lactoglobulin. Food Hydrocolloids, 3(3), pp.193–203.
van Dijke, K.C. et al., 2010. EDGE emulsification for food-grade dispersions. Journal of Food Engineering, 97, pp.348–354.
Dreyfus, R., Tabeling, P. & Willaime, H., 2003. Ordered and disordered patterns in two-phase flows in microchannels. Physical Review Letters, 90(14), p.144505.
Dunér, G. et al., 2016. Transient Marangoni transport of colloidal particles at the liquid/liquid interface caused by surfactant convective-diffusion under radial flow. Journal of Colloid and Interface Science, 462, pp.75–87.
Eggleton, C.D., Tsai, T.-M. & Stebe, K.J., 2001. Tip streaming from a drop in the presence of surfactants. Physical Review Letters, 87(4), p.48302.
Engl, W., Backov, R. & Panizza, P., 2008. Controlled production of emulsions and particles by milli- and microfluidic techniques. Current Opinion in Colloid and Interface Science, 13, pp.206–
References
143
216.
Erk, K.A. et al., 2012. Shear and dilational interfacial rheology of surfactant-stabilized droplets. Journal of Colloid and Interface Science, 377, pp.442–449.
Evans, M., Ratcliffe, I. & Williams, P.A., 2013. Emulsion stabilisation using polysaccharide-protein complexes. Current Opinion in Colloid and Interface Science, 18, pp.272–282.
Fang, Z. & Bhandari, B., 2010. Encapsulation of polyphenols - A review. Trends in Food Science and Technology, 21, pp.510–523.
Fenaille, F. et al., 2005. Carbonylation of milk powder proteins as a consequence of processing conditions. Proteomics, 5, pp.3097–3104.
Feng, H. et al., 2014. Manipulating and quantifying temperature-triggered coalescence with microcentrifugation. Lab on a chip, 15, pp.188–194.
Friberg, S. & Larsson, K., 2004. Food emulsions 4th ed. S. Friberg, K. Larsson, & J. Sjöblom, eds., New York: Dekker.
Fries, D.M. & Rudolf von Rohr, P., 2009. Impact of inlet design on mass transfer in gas–liquid rectangular microchannels. Microfluidics and Nanofluidics, 6, pp.27–35.
Fu, T. et al., 2011. Bubble formation in non-Newtonian fluids in a microfluidic T-junction. Chemical Engineering and Processing: Process Intensification, 50, pp.438–442.
Fu, T. et al., 2010. Squeezing-to-dripping transition for bubble formation in a microfluidic T-junction. Chemical Engineering Science, 65, pp.3739–3748.
Fu, T., Ma, Y. & Li, H.Z., 2015. Bubble coalescence in non-Newtonian fluids in a microfluidic expansion device. Chemical Engineering and Processing: Process Intensification, 97, pp.38–44.
Garstecki, P. et al., 2006. Formation of droplets and bubbles in a microfluidic T-junction - Scaling and mechanism of break-up. Lab on a Chip, 6, pp.437–446.
Garstecki, P., 2010. Formation of droplets and bubbles in microfluidic systems. In S. Kakac et al., eds. Microfluidics Based Microsystems: Fundamentals and Applications. Springer, pp. 163–181.
Gijsbertsen-Abrahamse, A.J., Van Der Padt, A. & Boom, R.M., 2004. Status of cross-flow membrane emulsification and outlook for industrial application. Journal of Membrane Science, 230, pp.149–159.
Glawdel, T., Elbuken, C. & Ren, C.L., 2012. Droplet formation in microfluidic T-junction generators operating in the transitional regime. I. Experimental observations. Physical Review E - Statistical, Nonlinear, and Soft Matter Physics, 85, p.16323.
Glawdel, T. & Ren, C.L., 2012. Droplet formation in microfluidic T-junction generators operating in the transitional regime. III. Dynamic surfactant effects. Physical Review E - Statistical, Nonlinear, and Soft Matter Physics, 86, p.26308.
Goudédranche, H., Fauquant, J. & Maubois, J.-L., 2000. Fractionation of globular milk fat by membrane microfiltration. Le Lait, 80, pp.93–98.
van der Graaf, S. et al., 2005. Droplet formation in a T-shaped microchannel junction: A model system for membrane emulsification. Colloids and Surfaces A: Physicochemical and Engineering Aspects, 266, pp.106–116.
van der Graaf, S. et al., 2004. Influence of dynamic interfacial tension on droplet formation during membrane emulsification. Journal of Colloid and Interface Science, 277, pp.456–463.
References
144
van der Graaf, S. et al., 2006. Lattice Boltzmann simulations of droplet formation in a T-shaped microchannel. Langmuir, 22, pp.4144–4152.
Griesbaum, K. et al., 2012. Hydrocarbons. Ullmann’s Encyclopedia of Industrial Chemistry, pp.134–189.
Gu, H., Duits, M.H.G. & Mugele, F., 2011. Droplets formation and merging in two-phase flow microfluidics. International Journal of Molecular Sciences, 12, pp.2572–2597.
Gu, Z. & Liow, J., 2011. Microdroplet formation in a T-junction with xanthan gum solutions. In Chemeca 2011: Engineering a Better World. pp. 1442–1451.
Guillot, P. & Colin, A., 2005. Stability of parallel flows in a microchannel after a T junction. Physical Review E - Statistical, Nonlinear, and Soft Matter Physics, 72, p.66301.
Gunstone, F., 2011. Vegetable oils in food technology: composition, properties and uses,
Gupta, A. & Kumar, R., 2010a. Effect of geometry on droplet formation in the squeezing regime in a microfluidic T-junction. Microfluidics and Nanofluidics, 8(6), pp.799–812.
Gupta, A. & Kumar, R., 2010b. Flow regime transition at high capillary numbers in a microfluidic T-junction: viscosity contrast and geometry effect. Physics of Fluids.
Gupta, A., Murshed, S. & Kumar, R., 2009. Droplet formation and stability of flows in a microfluidic T-junction. Applied Physics Letters, 94(16).
Håkansson, A., 2015. Experimental methods for measuring coalescence during emulsification - A critical review. Journal of Food Engineering, 178, pp.47–59.
Håkansson, A., Askaner, M. & Innings, F., 2016. Extent and mechanism of coalescence in rotor-stator mixer food-emulsion emulsification. Journal of Food Engineering, 175, pp.127–135.
Håkansson, A., Trägårdh, C. & Bergenståhl, B., 2009. Studying the effects of adsorption, recoalescence and fragmentation in a high pressure homogenizer using a dynamic simulation model. Food Hydrocolloids, 23(4), pp.1177–1183.
Hasenhuettl, G.L.G. & Hartel, R.R.W., 2008. Food emulsifiers and their applications, New York: Springer-Verlag.
Heidebach, T., Först, P. & Kulozik, U., 2012. Microencapsulation of probiotic cells for food applications. Critical Reviews in Food Science and Nutrition, 52(4), pp.291–311.
Higashi, S. et al., 1999. Size of lipid microdroplets effects results of hepatic arterial chemotherapy with an anticancer agent in water-in-oil-in-water emulsion to hepatocellular carcinoma. The Journal of pharmacology and experimental therapeutics, 289(2), pp.816–819.
Ho, P. et al., 2011. Thermally mediated droplet formation at a microfluidic T-junction. Micro and Nanosystems, pp.65–75.
Holtze, C., 2013. Large-scale droplet production in microfluidic devices - An industrial perspective. Journal of Physics D: Applied Physics, 46(11), p.114008.
Huerre, A., Miralles, V. & Jullien, M.-C., 2014. Bubbles and foams in microfluidics. Soft matter, 10, pp.6888–6902.
Husny, J. & Cooper-White, J.J., 2006. The effect of elasticity on drop creation in T-shaped microchannels. Journal of Non-Newtonian Fluid Mechanics, 137, pp.121–136.
Jafari, S.M. et al., 2008. Re-coalescence of emulsion droplets during high-energy emulsification. Food Hydrocolloids, 22, pp.1191–1202.
Jankowski, P. et al., 2013. Hydrophilic polycarbonate chips for generation of oil-in-water (O/W) and water-in-oil-in-water (W/O/W) emulsions. Microfluidics and Nanofluidics, 14, pp.767–774.

References
145
Jiang, F. et al., 2004. Helical flows and chaotic mixing in curved micro channels. AIChE Journal, 50(9), pp.2297–2305.
Jiménez-Colmenero, F., 2013. Potential applications of multiple emulsions in the development of healthy and functional foods. Food Research International, 52, pp.64–74.
Johnson, D.D. et al., 2008. Marangoni flow of Ag nanoparticles from the fluid-fluid interface. Journal of physical chemistry A, 112, pp.9318–9323.
Karbstein, H. & Schubert, H., 1995. Developments in the continuous mechanical production of oil-in-water macro-emulsions. Chemical Engineering and Processing, 34, pp.205–211.
Kobayashi, I. et al., 2010. Microchannel emulsification for mass production of uniform fine droplets: Integration of microchannel arrays on a chip. Microfluidics and Nanofluidics, 8, pp.255–262.
Kobayashi, I. et al., 2008. Straight-through microchannel devices for generating monodisperse emulsion droplets several microns in size. Microfluidics and Nanofluidics, 4, pp.167–177.
Kolb, G. et al., 2001. Evaluation of a new high-pressure dispersion unit (HPN) for emulsification. Chemical Engineering and Technology, 24(3), pp.293–296.
Kong, B. et al., 2013. Hydroxyl radical-stressed whey protein isolate: Functional and rheological properties. Food and Bioprocess Technology, 6, pp.169–176.
Kotula, A.P. & Anna, S.L., 2012. Probing timescales for colloidal particle adsorption using slug bubbles in rectangular microchannels. Soft Matter, 8, pp.10759–10772.
Krebs, T., Ershov, D., et al., 2013. Coalescence and compression in centrifuged emulsions studied with in situ optical microscopy. Soft Matter, 9, pp.4026–4035.
Krebs, T., Schroën, K. & Boom, R., 2012a. A microfluidic method to study demulsification kinetics. Lab on a Chip, 12, pp.1060–1070.
Krebs, T., Schroën, K. & Boom, R., 2012b. Coalescence dynamics of surfactant-stabilized emulsions studied with microfluidics. Soft Matter, 8, pp.10650–10657.
Krebs, T., Schroën, K. & Boom, R., 2013. Coalescence kinetics of oil-in-water emulsions studied with microfluidics. Fuel, 106, pp.327–334.
Krebs, T., Schroën, K. & Boom, R., 2012c. Separation kinetics of an oil-in-water emulsion under enhanced gravity. Chemical Engineering Science, 71, pp.118–125.
Lam, R.S.H. & Nickerson, M.T., 2014. The effect of pH and heat pre-treatments on the physicochemical and emulsifying properties of β-lactoglobulin. Food Biophysics, 9, pp.20–28.
Lam, R.S.H. & Nickerson, M.T., 2015. The effect of pH and temperature pre-treatments on the physicochemical and emulsifying properties of whey protein isolate. LWT - Food Science and Technology, 60, pp.427–434.
Lambrich, U. & Schubert, H., 2005. Emulsification using microporous systems. Journal of Membrane Science, 257, pp.76–84.
Langevin, D., 2015. Bubble coalescence in pure liquids and in surfactant solutions. Current Opinion in Colloid & Interface Science, 20(2), pp.92–97.
Lee, L.L. et al., 2013. Emulsification: Mechanistic understanding. Trends in Food Science & Technology, 31, pp.72–78.
Lee, S., Gallaire, F. & Baroud, C.N., 2012. Interface-induced recirculation within a stationary microfluidic drop. Soft Matter, 8, pp.10750–10758.
Levich, V.G. & Krylov, V.S., 1969. Surface-tension-driven phenomena. Annual Review of Fluid Mechanics, 1, pp.293–316.

References
146
Li, X.B. et al., 2012. Study on the mechanism of droplet formation in T-junction microchannel. Chemical Engineering Science, 69, pp.340–351.
Li, X.B. et al., 2013. Viscoelastic droplet dynamics under very low interfacial tension in a serpentine T-junction microchannel. In 7th International Symposium on Multiphase Flow, Heat Mass Transfer and Energy Conversion. Springer Berlin Heidelberg, pp. 194–204.
Lin, S.-Y., Mckeigue, K. & Maldarelli, C., 1990. Diffusion-controlled surfactant adsorption studied by pendant drop digitization. AIChE Journal, 36(12), pp.1785–1795.
Liu, H. & Zhang, Y., 2009. Droplet formation in a T-shaped microfluidic junction. Journal of applied physics, 106(3).
Lucassen-Reynders, E.H. & Kuijpers, K.A., 1992. The role of interfacial properties in emulsification. Colloids and Surfaces, 65, pp.175–184.
Maan, A.A., Schroën, K. & Boom, R., 2013. Monodispersed water-in-oil emulsions prepared with semi-metal microfluidic EDGE systems. Microfluidics and Nanofluidics, 14, pp.187–196.
Maan, A.A., Schroën, K. & Boom, R., 2011. Spontaneous droplet formation techniques for monodisperse emulsions preparation – Perspectives for food applications. Journal of Food Engineering, 107, pp.334–346.
Mailliart, P. & Ribadeau-Dumas, B., 1988. Preparation of b-lactoglobulin and b-lactoglobulin-free proteins from whey retentate by NaCI salting out at low pH. Journal of Food Science, 53(3), pp.743–745.
Maindarkar, S. et al., 2014. Prediction of emulsion drop size distributions in colloid mills. Chemical Engineering Science, 118, pp.114–125.
Maldonado-Valderrama, J. et al., 2005. Dilatational rheology of b-casein adsorbed layers at liquid-fluid interfaces. Journal of Physical Chemistry B, 109, pp.17608–17616.
Martin, J.D. et al., 2011. Interfacial rheology through microfluidics. Advanced materials, 23, pp.426–432.
Martin, J.D. & Hudson, S.D., 2009. Mass transfer and interfacial properties in two-phase microchannel flows. New Journal of Physics, 11, p.115005.
Mazzitelli, S. et al., 2013. Preparation of cell-encapsulation devices in confined microenvironment. Advanced drug delivery reviews, 65, pp.1533–1555.
McClements, D.J., 2005. Food emulsions: Principles, practices and techniques, Boca Raton, CRC Press.
De Menech, M. et al., 2008. Transition from squeezing to dripping in a microfluidic T-shaped junction. Journal of Fluid Mechanics, 595, pp.141–161.
Miller, R., Joos, P. & Fainerman, V., 1994. Dynamic surface and interfacial tensions of surfactant and polymer solutions. Advances in colloid and interface science, 49, pp.249–302.
Milliken, W.J., Stone, H. a. & Leal, L.G., 1993. The effect of surfactant on the transient motion of Newtonian drops. Physics of Fluids A: Fluid Dynamics, 5, pp.69–79.
Mohan, S. & Narsimhan, G., 1997. Coalescence of protein-stabilized emulsions in a high-pressure homogenizer. Journal of colloid and interface science, 192, pp.1–15.
Muijlwijk, K., Huang, W., et al., 2016. Convective mass transport dominates surfactant adsorption in a microfluidic Y-junction. Soft Matter, 12, pp.9025–9029.
Muijlwijk, K., Hinderink, E., et al., 2016. Interfacial tension measured at high expansion rates and within milliseconds using microfluidics. Journal of Colloid and Interface Science, 470, pp.71–

References
147
79.
Muijlwijk, K., Berton-Carabin, C.C. & Schroën, K., 2016. Cross-flow microfluidic emulsification from a food perspective. Trend in food science and technology, 49, pp.51–63.
Muijlwijk, K., Berton-Carabin, C.C. & Schroën, K., 2015. How microfluidic methods can lead to better emulsion products. Lipid Technology, 27(10), pp.234–236.
Murray, B., 2011. Rheological properties of protein films. Current Opinion in Colloid & Interface Science, 16, pp.27–35.
Murshed, S.M.S., Tan, S.-H. & Nguyen, N.-T., 2008. Temperature dependence of interfacial properties and viscosity of nanofluids for droplet-based microfluidics. Journal of Physics D: Applied Physics, 41, p.85502.
Muschiolik, G., 2007. Multiple emulsions for food use. Current Opinion in Colloid & Interface Science, 12, pp.213–220.
Nazir, A., Maan, A. a., et al., 2014. Foam preparation at high-throughput using a novel packed bed system. Food and Bioproducts Processing, 94, pp.561–564.
Nazir, A., Boom, R. & Schroën, K., 2013. Droplet break-up mechanism in premix emulsification using packed beds. Chemical Engineering Science, 92, pp.190–197.
Nazir, A., Boom, R. & Schroën, K., 2014. Influence of the emulsion formulation in premix emulsification using packed beds. Chemical Engineering Science, 116, pp.547–557.
Nazir, A., Schroën, K. & Boom, R., 2011. High-throughput premix membrane emulsification using nickel sieves having straight-through pores. Journal of Membrane Science, 383, pp.116–123.
Nazir, A., Schroën, K. & Boom, R., 2010. Premix emulsification: A review. Journal of Membrane Science, 362, pp.1–11.
Nazir, A., Schroën, K. & Boom, R., 2013. The effect of pore geometry on premix membrane emulsification using nickel sieves having uniform pores. Chemical Engineering Science, 93, pp.173–180.
Nguyen, N.T. et al., 2007. Interfacial tension measurement with an optofluidic sensor. IEEE Sensors Journal, 7(5), pp.692–697.
Nie, Z. et al., 2008. Emulsification in a microfluidic flow-focusing device: effect of the viscosities of the liquids. Microfluidics and Nanofluidics, 5, pp.585–594.
Nisisako, T., Ando, T. & Hatsuzawa, T., 2012. High-volume production of single and compound emulsions in a microfluidic parallelization arrangement coupled with coaxial annular world-to-chip interfaces. Lab on a Chip, 12, pp.3426–3435.
Nisisako, T., Okushima, S. & Torii, T., 2005. Controlled formulation of monodisperse double emulsions in a multiple-phase microfluidic system. Soft Matter, 1, pp.23–27.
Nisisako, T. & Torii, T., 2008. Microfluidic large-scale integration on a chip for mass production of monodisperse droplets and particles. Lab on a Chip, 8, pp.287–293.
Okushima, S. et al., 2004. Controlled production of monodisperse double emulsions by two-step droplet breakup in microfluidic devices. Langmuir, 20, pp.9905–9908.
Park, J. et al., 2009. A microfluidic approach to chemically driven assembly of colloidal particles at gas-liquid interfaces. Angewandte Chemie (International ed. in English), 48, pp.5300–5304.
Pathak, M., 2011. Numerical simulation of membrane emulsification: Effect of flow properties in the transition from dripping to jetting. Journal of Membrane Science, 382, pp.166–176.
Peltonen, L., Hirvonen, J. & Yliruusi, J., 2001. The behavior of sorbitan surfactants at the water-oil
References
148
interface: Straight-chained hydrocarbons from pentane to dodecane as an oil phase. Journal of colloid and interface science, 240, pp.272–276.
Pradines, V. et al., 2009. Interfacial properties of mixed b-lactoglobulin-SDS layers at the water/air and water/oil interface. Journal of physical chemistry B, 113, pp.745–751.
Priest, C., Reid, M.D. & Whitby, C.P., 2011. Formation and stability of nanoparticle-stabilised oil-in-water emulsions in a microfluidic chip. Journal of colloid and interface science, 363, pp.301–306.
Pugnaloni, L.A. et al., 2004. Competitive adsorption of proteins and low-molecular-weight surfactants: Computer simulation and microscopic imaging. Advances in Colloid and Interface Science, 107, pp.27–49.
Rayner, M. & Dejmek, P., 2015. Engineering Aspects of Food Emulsification and Homogenization, London: CRCpress Taylor Francis group.
Rayner, M., Trägårdh, G. & Trägårdh, C., 2005. The impact of mass transfer and interfacial expansion rate on droplet size in membrane emulsification processes. Colloids and Surfaces A: Physicochemical and Engineering Aspects, 266, pp.1–17.
Sahin, S. et al., 2016. Microfluidic EDGE emulsification: the importance of interface interactions on droplet formation and pressure stability. Scientific Reports, 6(26407).
Sahin, S., 2016. Upscaling microstructured emulsification devices (PhD thesis). Wageningen University.
Sahin, S., Sawalha, H. & Schroën, K., 2014. High throughput production of double emulsions using packed bed premix emulsification. Food Research International, 66, pp.78–85.
Saito, M. et al., 2005. Preparation characteristics of monodispersed oil-in-water emulsions with large particles stabilized by proteins in straight-through microchannel emulsification. Food Hydrocolloids, 19, pp.745–751.
Schadler, V. & Windhab, E.J., 2006. Continuous membrane emulsification by using a membrane system with controlled pore distance. Desalination, 189, pp.130–135.
Schneider, T. et al., 2011. Systematic investigation of droplet generation at T-junctions. Lab on a Chip, 11, pp.2055–2059.
Schröder, V., Behrend, O. & Schubert, H., 1998. Effect of dynamic interfacial tension on the emulsification process using microporous, ceramic membranes. Journal of colloid and interface science, 202, pp.334–340.
Schroën, K. et al., 2004. Emulsion preparation with micro-structured systems. Encyclopedia of Microfluidics and Nanofluidics, p.16.
Schroën, K. et al., 2016. Linking findings in microfluidics to membrane emulsification process design: The importance of wettability and component interactions with interfaces. Membranes, 6(26), pp.1–17.
Schroën, K. et al., 2015. Microfluidic emulsification devices: from micrometer insights to large-scale food emulsion production. Current Opinion in Food Science, 3, pp.33–40.
Schultz, S. et al., 2004. High-pressure homogenization as a process for emulsion formation. Chemical Engineering & Technology, 27(4), pp.361–368.
Schwalbe, J.T. et al., 2011. Interfacial effects on droplet dynamics in Poiseuille flow. Soft Matter, 7, pp.7797–7804.
Seemann, R. et al., 2012. Droplet based microfluidics. Reports on Progress in Physics, 75, p.16601.

References
149
Sharma, S., Johnson, R. & Desai, T., 2003. Ultrathin poly (ethylene glycol) films for silicon-based microdevices. Applied Surface Science, 206, pp.218–229.
Shui, L., Van Den Berg, A. & Eijkel, J.C.T., 2009. Interfacial tension controlled W/O and O/W 2-phase flows in microchannel. Lab on a Chip, 9, pp.795–801.
Silvestrini, S. et al., 2012. Tailoring the wetting properties of thiolene microfluidic materials. Lab on a chip, 12, pp.4041–4043.
Sivasamy, J. et al., 2011. An investigation on the mechanism of droplet formation in a microfluidic T-junction. Microfluidics and Nanofluidics, 11, pp.1–10.
Skurtys, O. & Aguilera, J.M., 2008. Applications of microfluidic devices in food engineering. Food Biophysics, 3, pp.1–15.
Smulders, P.E.A., 2000. Formation and stability of emulsions made with proteins and peptides (PhD thesis). Wageningen University.
Staggemeier, B.A. et al., 2005. Effect of solution viscosity on dynamic surface tension detection. Analytica Chimica Acta, 534, pp.79–87.
Stang, M., Karbstein, H. & Schubert, H., 1994. Adsorption kinetics of emulsifiers at oil -water interfaces and their effect on mechanical emulsification. Chemical Engineering and Processing, 33, pp.307–311.
Stang, M., Schuchmann, H. & Schubert, H., 2001. Emulsification in high-pressure homogenizers. Engineering in Life Sciences, 1(4), p.151.
Steegmans, M., De Ruiter, J., et al., 2010. A descriptive force-balance model for droplet formation at microfluidic Y-junctions. AIChE Journal, 56(10), pp.2641–2649.
Steegmans, M., Warmerdam, A., et al., 2009. Dynamic interfacial tension measurements with microfluidic Y-junctions. Langmuir, 25(17), pp.9751–9758.
Steegmans, M., Schroën, K. & Boom, R., 2009a. Characterization of emulsification at flat microchannel y junctions. Langmuir, 25, pp.3396–3401.
Steegmans, M., Schroën, K. & Boom, R., 2009b. Generalised insights in droplet formation at T-junctions through statistical analysis. Chemical Engineering Science, 64, pp.3042–3050.
Steegmans, M., Schroën, K. & Boom, R., 2010. Microfluidic Y-junctions: A robust emulsification system with regard to junction design. AIChE Journal, 56(7), pp.1922–1931.
van Steijn, V. et al., 2013. Block-and-break generation of microdroplets with fixed volume. Biomicrofluidics, 7(2), p.24108.
van Steijn, V., Kleijn, C.R. & Kreutzer, M.T., 2010. Predictive model for the size of bubbles and droplets created in microfluidic T-junctions. Lab on a Chip, 10, pp.2513–2518.
Stubenrauch, C. & Von Klitzing, R., 2003. Disjoining pressure in thin liquid foam and emulsion films—new concepts and perspectives. Journal of Physics: Condensed Matter, 15, pp.1197–1232.
Sugiura, S. et al., 2002. Characterization of spontaneous transformation-based droplet formation during microchannel emulsification. The Journal of Physical Chemistry B, 106, pp.9405–9409.
Sugiura, S. et al., 2001. Interfacial tension driven monodispersed droplet formation from microfabricated channel array. Langmuir, 17(18), pp.5562–5566.
van Swaay, D. & DeMello, A., 2013. Microfluidic methods for forming liposomes. Lab on a chip, 13, pp.752–767.
Tadros, T., 2005. Applied surfactants: principles and applications, Wiley.

References
150
Tambe, D.E. & Sharma, M.M., 1991. Hydrodynamics of thin liquid films bounded by viscoelastic interfaces. Journal of Colloid And Interface Science, 147(1), pp.137–151.
Tan, J. et al., 2008. Drop dispenser in a cross-junction microfluidic device: Scaling and mechanism of break-up. Chemical Engineering Journal, 136, pp.306–311.
Tan, J. et al., 2009. Gas–liquid flow in T-junction microfluidic devices with a new perpendicular rupturing flow route. Chemical Engineering Journal, 146, pp.428–433.
Tarchichi, N., Chollet, F. & Manceau, J.-F., 2013. New regime of droplet generation in a T-shape microfluidic junction. Microfluidics and Nanofluidics, 14, pp.45–51.
Tcholakova, S. et al., 2002. Coalescence in b-lactoglobulin-stabilized emulsions: effects of protein adsorption and drop size. Langmuir, 18, pp.8960–8971.
Tcholakova, S. et al., 2006. Coalescence stability of emulsions containing globular milk proteins. Advances in colloid and interface science, 123–126, pp.259–93.
Tcholakova, S. et al., 2005. Effects of electrolyte concentration and pH on the coalescence stability of b-lactoglobulin emulsions: Experiment and interpretation. Langmuir, 21, pp.4842–4855.
Thorsen, T. et al., 2001. Dynamic pattern formation in a vesicle-generating microfluidic device. Physical Review Letters, 86(18), pp.4163–4166.
Tice, J.D., Lyon, A.D. & Ismagilov, R.F., 2004. Effects of viscosity on droplet formation and mixing in microfluidic channels. Analytica Chimica Acta, 507, pp.73–77.
Tostado, C.P., Xu, J. & Luo, G., 2011. The effects of hydrophilic surfactant concentration and flow ratio on dynamic wetting in a T-junction microfluidic device. Chemical Engineering Journal, 171, pp.1340–1347.
Urban, K. et al., 2006. Rotor-stator and disc systems for emulsification processes. Chemical Engineering & Technology, 29(1), pp.24–31.
Ushikubo, F.Y. et al., 2014. Designing food structure using microfluidics. Food Engineering Reviews, 7(4), pp.393–416.
Vladisavljevic, G.T. et al., 2012. Production of uniform droplets using membrane, microchannel and microfluidic emulsification devices. Microfluidics and Nanofluidics, 13, pp.151–178.
Vladisavljević, G.T. et al., 2013. Industrial lab-on-a-chip: Design, applications and scale-up for drug discovery and delivery. Advanced drug delivery reviews, 65, pp.1626–1663.
Vladisavljević, G.T., Kobayashi, I. & Nakajima, M., 2010. Effect of dispersed phase viscosity on maximum droplet generation frequency in microchannel emulsification using asymmetric straight-through channels. Microfluidics and Nanofluidics, 10, pp.1199–1209.
Vladisavljević, G.T. & Williams, R.A., 2005. Recent developments in manufacturing emulsions and particulate products using membranes. Advances in Colloid and Interface Science, 113, pp.1–20.
Walstra, P., 2003. Physical Chemistry of Foods, New York: Marcel Dekker.
Walstra, P., Wouters, J. & Geurts, T., 2005. Dairy science and technology, Boca Raton: CRC Press.
Wang, J.T., Wang, J. & Han, J.-J., 2011. Fabrication of advanced particles and particle-based materials assisted by droplet-based microfluidics. Small, 7(13), pp.1728–1754.
Wang, K., Lu, Y.C., Xu, J.H. & Luo, G.S., 2009. Determination of dynamic interfacial tension and its effect on droplet formation in the T-shaped microdispersion process. Langmuir, 25, pp.2153–2158.
Wang, K., Lu, Y.C., Xu, J.H., Tan, J., et al., 2009. Liquid-liquid micro-dispersion in a double-pore T-

References
151
shaped microfluidic device. Microfluidics and Nanofluidics, 6, pp.557–564.
Wang, K. et al., 2016. Mass-transfer-controlled dynamic interfacial tension in microfluidic emulsification processes. Langmuir, 32, pp.3174–3185.
Wang, W. et al., 2011. Controllable microfluidic production of multicomponent multiple emulsions. Lab on a Chip, 11(9), pp.1587–92.
Wang, W. et al., 2011. LBM simulation of droplet formation in micro-channels. Chemical Engineering Journal, 173, pp.828–836.
Wang, X. et al., 2015. Measurement of internal flow field during droplet formation process accompanied with mass transfer. Microfluidics and Nanofluidics, 19, pp.757–766.
Wang, X. et al., 2010. Novel preparation and characterization of porous alginate films. Carbohydrate Polymers, 79, pp.989–997.
Wang, X. et al., 2014. Pressure drop-based determination of dynamic interfacial tension of droplet generation process in T-junction microchannel. Microfluidics and Nanofluidics, 18, pp.503–512.
Wehking, J.D. et al., 2013. Effects of viscosity, interfacial tension, and flow geometry on droplet formation in a microfluidic T-junction. Microfluidics and Nanofluidics, 16(3), pp.441–453.
Wielhorski, Y. et al., 2012. Wetting effect on bubble shapes formed in a cylindrical T-junction. Chemical Engineering Science, 84, pp.100–106.
Wu, Y. et al., 2014. Bubble coalescence at a microfluidic T-junction convergence: From colliding to squeezing. Microfluidics and Nanofluidics, 16, pp.275–286.
Xu, J.H., Li, S.W., Tan, J., et al., 2006a. Controllable preparation of monodisperse O/W and W/O emulsions in the same microfluidic device. Langmuir, 22(19), pp.7943–7946.
Xu, J.H. et al., 2008. Correlations of droplet formation in T-junction microfluidic devices: From squeezing to dripping. Microfluidics and Nanofluidics, 5, pp.711–717.
Xu, J.H., Li, S.W., Chen, G.G., et al., 2006. Formation of monodisperse microbubbles in a microfluidic device. AIChE Journal, 52(6), pp.2254–2259.
Xu, J.H., Li, S.W., Tan, J., et al., 2006b. Preparation of highly monodisperse droplet in a T-junction microfluidic device. AIChE Journal, 52(9), pp.3005–3010.
Xu, J.H., Luo, G.S., et al., 2006. Shear force induced monodisperse droplet formation in a microfluidic device by controlling wetting properties. Lab on a Chip, 6, pp.131–136.
Xu, J.H. et al., 2012. The dynamic effects of surfactants on droplet formation in coaxial microfluidic devices. Langmuir, 28, pp.9250–9258.
Yan, Y., Guo, D. & Wen, S.Z., 2012. Numerical simulation of junction point pressure during droplet formation in a microfluidic T-junction. Chemical Engineering Science, 84, pp.591–601.
Yang, L. et al., 2012. Experimental study of microbubble coalescence in a T-junction microfluidic device. Microfluidics and Nanofluidics, 12, pp.715–722.
Yano, Y.F., 2012. Kinetics of protein unfolding at interfaces. Journal of Physics: Condensed Matter, 24(50), p.503101.
Yeom, S. & Lee, S.Y., 2011a. Dependence of micro-drop generation performance on dispenser geometry. Experimental Thermal and Fluid Science, 35, pp.1565–1574.
Yeom, S. & Lee, S.Y., 2011b. Size prediction of drops formed by dripping at a micro T-junction in liquid–liquid mixing. Experimental Thermal and Fluid Science, 35, pp.387–394.
References
152
Zhai, J.L. et al., 2013. Protein folding at emulsion oil/water interfaces. Current Opinion in Colloid & Interface Science, 18, pp.257–271.
Zhang, D.F. & Stone, H. a, 1997. Drop formation in viscous flows at a vertical capillary tube. Physics of Fluids, 9(8), pp.2234–2242.
Zhao, C.-X., 2013. Multiphase flow microfluidics for the production of single or multiple emulsions for drug delivery. Advanced drug delivery reviews, 65, pp.1420–1446.
Zhou, J. et al., 2012. Surface modification for PDMS-based microfluidic devices. Electrophoresis, 33, pp.89–104.
Zhou, Q. et al., 2016. Investigation of droplet coalescence in nanoparticle suspensions by a microfluidic collision experiment. Soft Matter, 12, pp.1674–1682.
Zuidam, N.J. & Nedović, V.A., 2010. Encapsulation Technologies for Active Food Ingredients and Food Processing N. J. Zuidam & V. Nedovic, eds., New York, NY: Springer New York.
van der Zwan, E. et al., 2006. Visualization of droplet break-up in pre-mix membrane emulsification using microfluidic devices. Colloids and Surfaces A: Physicochemical and Engineering Aspects, 277, pp.223–229.
van der Zwan, E., Schroën, K. & Boom, R., 2008. Premix membrane emulsification by using a packed layer of glass beads. Environmental and Energy Engineering, 54(8), pp.2190–2197.


S 9. Summary and samenvatting

Summary
156
Emulsions are dispersions of one liquid in another that are commonly used in various
products, and methods such as high-pressure homogenisers and colloid mills are used to
form emulsions. The size and size distribution of emulsion droplets are important for the
final product properties and thus need to be controlled. Rapid coalescence of droplets
during emulsification increases droplet size and widens the size distribution, and therefore
needs to be prevented.
To increase stability of emulsions, emulsifiers are added to adsorb at the oil-water interface
before droplets collide. The time allowed for emulsifier adsorption is typically in the range
of sub-milliseconds to seconds and to optimise emulsification processes, emulsifier
adsorption and coalescence stability need to be measured in this time-scale, for which the
microfluidic methods described in this thesis were developed.
Chapter 2 provides an overview of existing literature on cross-flow microfluidic
emulsification. The effects of various parameters such as microfluidic design, shear forces,
and interfacial tension forces on droplet formation and the resulting droplet size are
discussed, as well as the use of microfluidics to produce food-grade emulsions. Based on
this evaluation, the methods to elucidate interfacial tension and coalescence stability are
chosen, and these are presented in the next chapters.
To measure emulsifier adsorption in the sub-millisecond time-scale, a tensiometric method
was developed using a cross-flow microfluidic Y-junction, which is described in Chapter
3. This method is based on the relation between droplet size and interfacial tension at the
moment of droplet formation, which is referred to as the acting interfacial tension. The
acting interfacial tension of a system with hexadecane as the dispersed phase and sodium
dodecylsulfate (SDS, a model surfactant) solutions as the continuous phase was
successfully measured for droplet formation times ranging from 0.4 to 9.4 milliseconds and
with high expansion rates (100-2000 s-1). Comparison of these results with data from a drop
tensiometer (a conventional, static, and supra-second time-scale method) indicates that
mass transport in the microfluidic Y-junction is fast and probably not limited by diffusion.
Emulsifier mass transport conditions were further investigated in Chapter 4. The
continuous phase viscosity and velocity were systematically varied and the effect on the
acting interfacial tension in presence of water-soluble SDS was measured. We found that
the acting interfacial tension was independent of the continuous phase viscosity, but was

Summary
157
inversely dependent on continuous phase velocity. Both aspects led us to conclude that
convective emulsifier transport in the continuous phase determines the acting interfacial
tension in the Y-junction. When using oil-soluble surfactant Span 20 (dissolved in
hexadecane), the acting interfacial tension also decreased with increasing continuous phase
velocity, and we therefore concluded that convection also dominated mass transport of
emulsifiers dissolved in the to-be-dispersed phase.
The Y-junction method was used in Chapter 5 to elucidate the effect of the dispersed phase
viscosity on adsorption of the food-grade emulsifiers Tween 20 (dissolved in the
continuous water phase) and Span 20 (dissolved in the dispersed oil phase). A reduction in
dispersed phase viscosity sped up adsorption of Tween 20, probably because the shorter
hydrocarbon made intercalation of the hydrophobic surfactant tail at the interface easier.
Dispersed phase viscosity had an even greater effect on adsorption of Span 20 because
convective transport towards the interface was increased.
Next to interfacial tension, also coalescence can be measured with microfluidics and a
microfluidic collision channel was used in Chapter 6 to measure emulsion coalescence
stability shortly after droplet formation under flow. Coalescence of emulsions stabilised
with proteins was measured at various concentrations, pH values, and adsorption times. We
found that protein concentrations just below the concentration needed for monolayer
surface coverage may be used effectively. β-lactoglobulin-stabilised emulsions were most
stable. Emulsions stabilised with whey protein isolate (with as main component β-
lactoglobulin), were less stable and when these proteins were oxidised, this led to reduced
stability, therewith indicating that also the oxidative state of proteins needs to be considered
in emulsion formulation.
The relevance of our work for microfluidic research and industrial emulsification processes
is discussed in Chapter 7. Microfluidic devices can be used to study emulsion formation
and stability under conditions relevant to industrial emulsification processes; at short time-
scales and with convective mass transport. In this thesis we used various food-grade
ingredients, and with that application in that field has come closer. We expect that the
findings on emulsions can also be applied on foams. With the discussed microfluidic
devices different aspects that are important for emulsion formation can be decoupled: for
example interfacial tension during droplet formation and emulsion coalescence stability.
Furthermore, microfluidic methods are available to for example gain insight in emulsion

Summary
158
interface mobility and emulsion storage stability, and we envision that all these microfluidic
methods will lead to faster ingredient screening, lower ingredient usage, and more energy
efficient emulsion production.

Samenvatting
159
Emulsies zijn dispersies van een vloeistof in een andere die worden gebruikt in
verschillende producten, en om emulsies te maken worden methodes zoals hogedruk
homogenisatoren en colloïdmolens gebruikt die ervoor zorgen dat druppels verkleind
worden. Behalve opbreken van druppels treed ook snelle coalescentie van druppels op
tijdens emulgeren, en dit vergroot de druppelgrootte en -distributie. Deze eigenschappen
zijn belangrijk voor de uiteindelijke emulsie-eigenschappen en moeten daarom worden
beheerst.
Om de stabiliteit van de gevormde emulsies te verhogen worden emulgatoren toegevoegd,
en die adsorberen idealiter op het olie-wateroppervlak voordat de druppels met elkaar in
contact komen. Voor emulgatoradsorptie is typisch een tijdsbestek van sub-milliseconden
tot seconden nodig, en om het emulgeerproces te optimaliseren moet emulgatoradsorptie en
coalescentie stabiliteit worden gemeten op deze tijdschaal, en dat kan met de
microfluïdische methoden beschreven in deze thesis.
Hoofdstuk 2 verschaft een overzicht van de bestaande literatuur op het gebied van
langsstroom-emulgeren met microfluïdische systemen. De effecten van verschillende
parameters zoals het microfluïdisch design, afschuif-, en grensvlakspanningskrachten op
druppelvorming en de uiteindelijke druppelgrootte worden bediscussieerd, alsmede het
gebruik van microfluïdische methoden om emulsies te produceren geschikt voor toepassing
in levensmiddelen. Gebaseerd op deze evaluatie zijn methodes gekozen om
grensvlakspanning en coalescentie stabiliteit te meten, en deze zijn beschreven in de
volgende hoofdstukken.
Om emulgatoradsorptie te meten in de sub-milliseconden tijdschaal is een tensiometrische
methode ontwikkeld waarbij een langsstroom-microfluïdische Y-splitsing wordt gebruikt,
zoals beschreven in Hoofdstuk 3. Deze methode is gebaseerd op de relatie tussen
druppelgrootte en de grensvlakspanning op het moment van druppelvorming, de heersende
grensvlakspanning genaamd. De heersende grensvlakspanning is succesvol gemeten voor
een systeem bestaande uit hexadecaan (disperse fase) en natriumdodecylsulfaat (SDS, een
model emulgator) oplossingen (continue fase) voor druppelvormingstijden variërend van
0.4 tot 9.4 milliseconden en met hoge expansiesnelheden (100-2000 s-1). Vergelijking van
deze resultaten met data verkregen met een druppeltensiometer (een conventionele,
statische methode die meet in het seconden bereik) duidt aan dat massatransport in de

Samenvatting
160
microfluïdische Y-splitsing dusdanig snel is dat die waarschijnlijk niet gelimiteerd wordt
door diffusie.
De massatransportcondities zijn verder onderzocht in Hoofdstuk 4. De viscositeit en
snelheid van de continue fase zijn systematisch gevarieerd en het effect op de heersende
grensvlakspanning in de aanwezigheid van wateroplosbaar SDS is gemeten. We hebben
gevonden dat de heersende grensvlakspanning onafhankelijk is van de viscositeit, en
omgekeerd evenredig met de snelheid van de continue fase. Door beide aspecten
concluderen wij dat convectief emulgatortransport de acterende oppervlaktespanning in de
Y-splitsing bepaalt. Voor het olie-oplosbare Span 20 (opgelost in hexadecaan) daalt de
acterende oppervlaktespanning bij toenemende snelheid van de continue fase, en dat geeft
aan dat ook massatransport van emulgatoren opgelost in de te dispergeren fase door
convectie wordt gedomineerd.
De Y-splitsing methode is gebruikt in Hoofdstuk 5 om het effect van de disperse fase-
viscositeit op adsorptie van emulgatoren geschikt voor toepassing in levensmiddelen,
Tween 20 (opgelost in de continue waterfase) en Span 20 (opgelost in de disperse oliefase),
te verhelderen. Bij lagere viscositeit van de disperse fase neemt adsorptie van Tween 20
toe, waarschijnlijk omdat de kortere koolwaterstofketen intercalatie op het
emulsieoppervlak vergemakkelijkt. De viscositeit van de disperse fase heeft een additioneel
effect omdat convectief transport van Span 20 naar het emulsieoppervlak verhoogd wordt
bij lagere viscositeit.
Naast de grensvlakspanning kan ook coalescentie worden gemeten met microfluïdische
methoden en in Hoofdstuk 6 wordt de coalescentiestabiliteit kort na druppelvorming onder
stroming bepaald. Coalescentie van emulsies gestabiliseerd met eiwitten is gemeten voor
verschillende concentraties, pH waarden, en adsorptietijden. We hebben gevonden dat
oppervlakken die naar verwachting een bedekking hebben die net onder monolaag
bedekking ligt al effectief beschermd worden tegen coalescentie. β-lactoglobuline-
gestabiliseerde emulsies waren het meest stabiel. Emulsies gestabiliseerd met wei eiwit
isolaat (met als hoofdbestanddeel β-lactoglobuline) waren minder stabiel, en als deze
eiwitten waren geoxideerd leidde dit tot een verdere reductie van stabiliteit. Dit geeft aan
dat ook de oxidatieve staat van eiwitten van belang is voor emulsieformulering.

Samenvatting
161
De relevantie van ons werk voor microfluïdisch onderzoek en industriële
emulgeerprocessen is bediscussieerd in Hoofdstuk 7. Microfluïdische methoden kunnen
worden gebruikt om emulsievorming en -stabiliteit onder condities relevant voor industriële
emulgeerprocessen te onderzoeken; dat wil zeggen gebruikmakend van korte tijdschalen en
met convectief massatransport. In dit proefschrift zijn verschillende ingrediënten gebruikt
die geschikt zijn voor toepassing in levensmiddelen, en daarmee is toepassing in dat veld
dichterbij gekomen. We verwachten dat deze vindingen ook kunnen worden toegepast op
schuim. Met de besproken microfluïdische methoden kunnen verschillende aspecten die
van belang zijn tijdens emulsievorming ontkoppeld worden: bijvoorbeeld
grensvlakspanning tijdens druppelvorming en stabiliteit van emulsies tegen coalescentie.
Verder zijn er microfluïdische methoden waarmee bijvoorbeeld inzicht kan worden
verkregen in oppervlaktemobiliteit en emulsiestabiliteit tijdens opslag, en we voorzien dat
al deze microfluïdische methoden zullen leiden tot snellere ingrediëntscreening, verlaging
van ingrediëntgebruik, en een efficiëntere emulsieproductie.


Dankwoord
163
Dankwoord
Op de voorkant van dit boekje staat enkel mijn naam maar ik heb dit werk zeker niet alleen
uitgevoerd. De belangrijkste personen die me de afgelopen vier PhD jaren hebben
bijgestaan waren Karin en Claire. Karin, bedankt dat er altijd tijd was in je drukke schema
voor onze afspraken en om al mijn documenten door te lezen. Ik heb heel veel van je
geleerd op het gebied van microfluidics en emulsificatie, maar vooral hoe onderzoek moet
worden gedaan en hoe dat goed opgeschreven kan worden. Claire, I would also like to
thank you for all your help and kindness in the past years. I really valued your expertise on
emulsifiers and have learned from your precision in writing, merci beaucoup!
Next to having experienced the good supervision of Karin and Claire, I have supervised
some students of my own who all helped to gather the data needed for this thesis, but also
to do the trial and error needed to get the microfluidic systems up and running. For that I
would like to thank Sophie, Panos, Emma, Adarsh, Yu-Fang, Wenqian, Xuezhu, Tya, and
Ivanna. Jos en Maurice, bedankt voor jullie hulp in het lab, en Martin en Marjan bedankt
voor jullie hulp bij de administratieve zaken. Dmitry and Jan-Eise, thanks a lot for
developing the Matlab scripts, without them I could not have done such accurate
measurements. En Thomas bedankt voor je hulp bij de coalescentie experimenten.
Verder wil ik nog NanoNextNL en alle betrokken bedrijven bedanken; tijdens de
NanoNextNL congressen en thema meetings heb ik mijn werk vaak kunnen presenteren en
met geïnteresseerden kunnen spreken. Ook de FPE groep is erg belangrijk geweest voor
mij. Ik waardeer alle discussies op wetenschappelijk gebied tijdens de presentaties op
donderdag en in het lab met de andere emulsie PhD’s, maar ook alle sociale activiteiten
binnen onze groep. Ik wil graag mijn kamergenoten bedanken voor de gezelligheid op onze
kamer, en het zwaai en loopgroepje voor de fysieke beweging tussen het aanklikken van al
die druppeltjes.
Hoewel niet direct betrokken bij mijn werk wil ik ook mijn vrienden en familie bedanken
voor hun interesse in mijn gekke druppels maar vooral ook voor de gezelligheid buiten het
werk. Menno, ik wil jou bedanken voor al je steun de afgelopen jaren en de jaren die nog
gaan volgen. Lieve Evy, dankjewel dat je er bent!


About the author
165
About the author
Kelly Muijlwijk was born on 16 July 1989 in Alkmaar in the
Netherlands. She attended primary school in Asperen and
Dalfsen, and obtained her high school diploma in 2007 in
Zwolle. She studied Food Technology at Wageningen
University, conducted her thesis in the Food Physics group on
the formation of protein particles, and obtained her bachelor
degree in 2010. After which Kelly continued with the master
Food Technology with a specialisation in Dairy Science and
Technology. For the master thesis she joined the Surfactant and Colloid group of the
University of Hull (UK) to perform a research for FrieslandCampina on food-grade
Pickering stabilisation of foams. And for the internship she joined the Applied
Biochemistry department of DSM Delft to study the influence of coagulants on biochemical
and rheological properties of cheese during ripening. In February 2013, after obtaining her
master diploma, Kelly started as a PhD candidate in the Food Process Engineering group of
Wageningen University. During this research, she developed and used microfluidic devices
to measure emulsifier adsorption and emulsion stability, and results obtained during these
four years are described in this thesis.


Publications
167
Publications
Muijlwijk, K.; Berton-Carabin, C.; Schroën, K., Cross-flow microfluidic emulsification
from a food perspective, Trends in Food Science & Technology, 49, 51-63, 2016
Muijlwijk, K.; Hinderink, E.; Ershov, D.; Berton-Carabin, C.; Schroën, K., Interfacial
tension measured at high expansion rates and within milliseconds using microfluidics,
Journal of Colloid and Interface Science, 470, 71-79, 2016
Muijlwijk, K.; Huang, W.; Vuist, J.; Berton-Carabin, C.; Schroën, K., Convective mass
transport dominates surfactant adsorption in a microfluidic Y-junction, Soft Matter, 12,
9025-9029, 2016
Muijlwijk, K.; Li, X.; Berton-Carabin, C.; Schroën, K., Dynamic fluid interface formation
in microfluidics: effect of emulsifier structure and oil viscosity, Submitted
Muijlwijk, K.; Colijn, I.; Harsono, H.; Krebs, T.; Berton-Carabin, C.; Schroën, K.,
Coalescence of protein-stabilised emulsions studied with microfluidics, Food
Hydrocolloids, 70, 96-104, 2017
Muijlwijk, K.; Berton-Carabin, C.; Schroën, K., How microfluidic methods can lead to
better emulsion products, Lipid Technology, 27 (10), 234-236, 2015
Muijlwijk, K.; Harsono, H.; Li, X.; Schroën, K.; Berton-Carabin, C., Using microfluidic
tools to understand emulsification, Inform magazine, 27 (10), 18-21, 2016
Schroën, K.; Bliznyuk, O.; Muijlwijk, K.; Sahin, S.; Berton-Carabin, C., Microfluidic
emulsification devices: from micrometer insights to large-scale food emulsion production,
Current Opinion in Food Science, 3, 33-40, 2015
Binks, B.P.; Muijlwijk, K.; Koman, H.; Poortinga, A., Food-grade Pickering stabilisation
of foams by in situ hydrophobisation of calcium carbonate particles, Food Hydrocolloids,
63, 585-592, 2017


Overview of completed training activities
169
Overview of completed training activities
Discipline specific activities
Courses Sustainability analysis in food and biobased production (NL) 2013 Industrial food proteins (NL)a 2013 Han-Sur-Lesse physical chemistry winterschool (BE) 2014 Conferences ECCE9-ECAB2 (NL) 2013 Biennial meeting of the German Colloid Society (DE)a
2013 MicroNano Conference (NL)b 2013 Food Colloids (DE)a 2014 NanoCity (NL)ab 2014 International symposium on food rheology and structure (CH)b 2015 NanoCity (NL)ab 2015 Food Colloids (NL)ab 2016 AOCS annual meeting (USA)b
2016 NanoCity (NL)ab 2016
General courses
VLAG PhD week (NL) 2013 PhD competence assessment (NL) 2013 Interpersonal communication for PhD students (NL) 2013 Voice matters (NL) 2013 Teaching and supervising thesis students (NL) 2013 Intellectual property awareness and valorisation (NL) 2013 Risk analysis and technology assessment (NL) 2014 Story telling (NL) 2014 Scientific writing (NL) 2014 Techniques for writing and presenting a scientific paper (NL) 2015 Career perspectives (NL) 2016
Optional courses and activities
NanoNextNL team meetings (NL) 2013-2016 Food Process Engineering Group day (NL)ab 2014-2016 PhD study tour, Chile and Brazilb 2014 PhD study tour, Germany and Switzerlandb 2016 a Poster presentation b Oral presentation

This thesis is part of NanoNextNL, a micro and nanotechnology innovation consortium of the government of the Netherlands and 130 partners from academia and industry.
