microlearning with mobile devices - asu digital repository › attachments › 186538 › content...
TRANSCRIPT

Microlearning with Mobile Devices:
Effects of Distributed Presentation Learning and the Testing Effect on Mobile Devices
by
Elaine Rettger
A Dissertation Presented in Partial Fulfillment of the Requirements for the Degree
Doctor of Philosophy
Approved March 2017 by the Graduate Supervisory Committee:
Gary Bitter, Chair
Jane Legacy Wilhelmina Savenye
A RIZONA STATE UNIVERSITY
May 2017

i
ABSTRACT
This study investigated the effects of distributed presentation microlearning and
the testing effect on mobile devices and student attitudes about the use of mobile devices
for learning in higher education. For this study, a mobile device is considered a
smartphone. All communication, content, and testing were completed remotely through
participants’ mobile devices.
The study consisted of four conditions: (a) an attitudinal and demographic pre-
survey, (b) five mobile instructional modules, (c) mobile quizzes, and (d) an attitudinal
post-survey. A total of 311 participants in higher education were enrolled in the study.
One hundred thirty-seven participants completed all four conditions of the study.
Participants were randomly assigned to experimental conditions in a 2 x 2 factorial
design. The levels of the first factor, distribution of instructional content, were: once-per-
day and once-per-week. The levels of the second factor, testing, were: a quiz after each
module plus a comprehensive quiz and a single comprehensive quiz after all instruction.
The dependent variable was learning outcomes in the form of quiz-score results.
Attitudinal survey results were analyzed using Principal Axis Factoring to reveal three
components, (a) student perceptions about the use of mobile devices in education,
(b) student perceptions about instructors’ beliefs for mobile devices for learning, and
(c) student perceptions about the use of mobile devices post-instruction.
The results revealed several findings. There was no significant effect for type of
delivery of instruction in a one-way ANOVA. There was a significant effect for testing in
a one-way ANOVA There were no main effects of delivery and testing in a 2 x 2 factorial
design and there was no main interaction effect, and there was a significant effect of

ii
testing on final quiz scores controlling for technical beliefs in a 2 x 2 ANCOVA. The
significant difference in testing was contradictory to some literature.
Ownership of personal mobile devices in persons aged 18–29 is practically all-
inclusive. Thus, future research on student attitudes and the implementation of personal
smartphones for microlearning and testing is still needed to develop and integrate mobile-
ready content for higher education.

iii
ACKNOWLEDGMENTS
I would like to thank the many instructors at the ASU Mary Lou Fulton College
of Education who supported and contributed to my success. I would like to give special
thanks to my Committee Chair, Dr. Gary Bitter for his steadfast encouragement, prompt
responses to my questions, and weekly meetings to keep my dissertation on-track.
I would also like to thank my committee members, Dr. Jane Legacy and Dr. Wilhelmina
Savenye for their encouragement and participation in my dissertation.
To Nedim Yel, who tutored me through statistics during my coursework and
provided support for the analysis of my data. Without your help and friendship, I would
not have been able to translate the information presented in this study.
A special thanks to friends I met along the way: Nicholas Butler, Caroline Savio-
Ramos, ChristiAnne Ritchie, and many others. Your friendship and support were
invaluable to my success.
Finally, I would like to thank my family. My husband, Bill; children, Alison, Bill,
Hannah, and Peter, who were constant cheerleaders for Dr. Mom.

iv
TABLE OF CONTENTS
Page
LIST OF TABLES ........................................................................................................... viii
LIST OF FIGURES ........................................................................................................... ix
CHAPTER
1 INTRODUCTION ...................................................................................................1
Importance of the Problem .......................................................................................2
Overview of the Study and Research Questions ......................................................3
Limitations of the Study ...........................................................................................5
2 LITERATURE REVIEW ........................................................................................7
Distributed Presentations .........................................................................................7
Testing Effect .........................................................................................................12
Distributed Presentation and Testing on Mobile Devices ......................................15
Definition of Microlearning and Examples ...........................................................18
Attitudes about the use of Personal Mobile Devices for Learning ........................19
Discussion of Human Interactions with Mobile Devices ......................................22
Summary and Research Questions .........................................................................22
3 METHOD ..............................................................................................................24
Participant Characteristics .....................................................................................24
Sampling Procedures .............................................................................................24
Sample size ................................................................................................24
Recruitment ................................................................................................25
v
CHAPTER Page
Demographics ............................................................................................26
Materials ................................................................................................................28
Learning Environment ...........................................................................................31
Study Procedure .........................................................................................31
Instructional content ...................................................................................31
Measures ................................................................................................................34
Attitudinal pre-instruction survey ..............................................................34
Instructional quizzes ..................................................................................34
Scoring .......................................................................................................38
Attitudinal post-instruction survey ............................................................39
4 RESULTS ..............................................................................................................40
Learning Outcomes ................................................................................................42
One-way ANOVA .....................................................................................42
Two-way ANOVA Test of Main and Interaction Effects ..........................44
Three-way or factorial ANOVA ................................................................47
Participant Mobile Device Characteristics .................................................48
Attitudes .....................................................................................................50
Analysis of Per-instruction Attitudinal Measures ......................................52
Analysis of Post-instruction Attitudinal Measures ....................................58
Open-Ended Survey Responses .................................................................59
5 DISCUSSION ........................................................................................................63
Findings by Research Question .............................................................................63

vi
CHAPTER Page
Research Question 1 ..................................................................................63
Research Question 2 ..................................................................................64
Research Question 3 ..................................................................................66
Research Question 4 ..................................................................................67
Limitations .............................................................................................................68
Implications ............................................................................................................70
Development of Custom Content ...........................................................................71
Future Research .....................................................................................................72
Conclusions ............................................................................................................73
REFERENCES ..................................................................................................................74
APPENDIX
A PARTICIPANT CONSENT FORM ..........................................................80
B BLACKBOARD LMS DAILY ANNOUNCEMENTS TO
PARTICIPANTS .......................................................................................83
C TECHNICAL JOB AID FOR BLACKBOARD APP ...............................86
D PRE-SURVEY QUESTIONAIRRE ..........................................................90
E TEXT PASSAGES AND SAMPLE SCREENS FOR
MICROLEARNING MOBILE MODULES .............................................95
F POST-INSTRUCTION SURVEY ...........................................................105
G ASSESSMENTS – COMPREHENSIVE QUIZ AND SCORING AND
INDIVIDUAL MODULE QUIZZES ......................................................108

vii
APPENDIX Page
H RESPONSES TO OPEN-ENDED COMMENT SECTION FROM
POST-INSTRUCTION SURVEY ...........................................................116
I INSTITUTIONAL REVIEW BOARD CONSENT ................................120
viii
LIST OF TABLES
Table Page
1. Summary of Power Analysis .......................................................................................25
2. Tests Conducted ...........................................................................................................41
3. Learning Outcome by Delivery of Instruction .............................................................43
4. Learning Outcome by Number of Quizzes ..................................................................43
5. Learning Outcome by Delivery of Instruction and Number Quizzes ..........................45
6. Learning Outcome by Delivery of Instruction, Number of Quizzes, and Gender .......48
7. Characteristics of Participant Mobile and Laptop or Desktop Device Ownership and
Usage ............................................................................................................................49
8. Descriptive Statistics for Pre-instruction Attitude Measures .......................................51
9. Descriptive Statistics for Post-instruction Attitude Measures .....................................52
10. Total Variance Explained Pre-instruction Survey Items .............................................53
11. Eigenvalues from Patil et al. (2008) compared to values from SPSS ..........................55
12. Summary of Rotated Component Matrix loadings on Two-Factor Solutions for Pre-
instruction Student Attitudes about Learning on Mobile Devices ...............................56
13. Component Identification for a Two-Factor Solution for Pre-Instruction Student
Attitudes about Learning Mobile Devices ...................................................................57
14. Total Variance Explained Post-instruction Survey Items ............................................59
15. Summary of Matrix loadings of a One-Factor Solution for Post-instruction Student
Attitudes about Learning on Mobile Devices ..............................................................60

ix
LIST OF FIGURES
Figure Page
1. Illustration of single-hand thumb navigation and user control ....................................30
2. Illustration of custom formatting of instructional screens ...........................................30
3. Screen of Single Informational Unit ............................................................................33
4. Example of acknowledgments of integrity unlocks screen for quizzes .......................36
5. Example of multiple choice quiz question screen ........................................................37
6. Boxplot of outlier less than 3 box-lengths from the edge of the boxplot ....................41
7. Plot of estimated marginal means for Delivery of Instruction showing no interaction
between groups ............................................................................................................46
8. Plot of estimated marginal means for Testing shows a significant interaction
between groups ............................................................................................................46
9. Scree Plot for Pre-instruction Survey ..........................................................................54
10. Scree Plot for Post-instruction Survey .........................................................................59
1
CHAPTER 1
INTRODUCTION
Learning anywhere at any time is not a new concept. Books have been available
for centuries and were probably the first “mobile” learning device. In his introduction to
The New Landscape of Mobile Learning, Searson (2014) wrote: “Consider for a moment,
the book as education’s first mobile device; specifically, the type of book driven by the
invention of Johannes Gutenberg’s printing press.” What is new in the concept of mobile
learning is access to interactive learning content, contact and communication with
teachers and other students, and assessments through the internet via wireless-enabled
smartphones.
Students have long carried backpacks full of books to-and-from class lugging
them around like a sack of bricks. Textbooks provided the opportunity to catch up on
reading assignments or other instructional support, but could not provide testing,
feedback or interactive engagement. Today’s students now connect with information in a
vastly different way. The Pew Institute (2017) found that 95% of Americans own a
cellphone of any kind and among adults between the ages of 18–29 virtually 100%
owned a cellphone of any kind, with 92% owning a smartphone.
The first phone with a keyboard was developed in 1997, and in 2007 Apple
released the first iPhone with a multi-touch surface and virtual keyboard. 1n 2007,
Americans sent more text messages per month than received phone calls. Our mobile
society quickly embraced 160-character text messages, one-minute or shorter video
content, and apps (applications) capable of providing e-reading, educational support,
interactive games, lists, notes, and reminders. Today a student traveling by shuttle
2
between campuses or relaxing on a campus mall is connected to information and learning
resources previously unimagined. The learning content can be multimedia learning
pushed to students by instructors, content that includes instruction and links to additional
resources, assessments linked to course records, assessments that provide feedback, and
content with embedded opportunities to communicate with instructors and other students.
The possibilities are endless.
Now consider a student working on short-lesson modules, perhaps three-to-five
minutes in length while taking the shuttle. Each module includes discrete instruction and
assessment. The modules are short enough to be consumed in a single setting but
complete enough to address a specific teachable concept. One entire lesson plan for the
week might include 10 or more modules to complete a section or learning objective.
Alternatively, a module might provide flipped classroom support to prepare students for
the day’s learning activities. Embedded in the module is an assessment that when
completed is sent directly to the course database to be graded thereby satisfying the need
for documented grading and feedback about student academic success.
Importance of the Problem
Adoption of mobile devices for personal use is virtually comprehensive in society,
but opportunities in education are still struggling to catch up. Chen and deNoyelles
(2013) indicated that in a study about mobile-device usage, more than half of college
students utilized a mobile device for academic purposes. Eighty-two percent of students
that owned a tablet device reported using the device for academic purposes while only
58% of students that owned a smartphone used their device for academic purposes. The
study also indicated that there was a negative relationship between students’ GPA and

3
academic use of smartphones and that freshman used smartphones and small mobile
devices in an academic setting more than juniors or seniors. Students also expected
technological support from instructors, but only about 54% of students indicated that
their instructors provided support (Chen & Denoyelles, 2013).
The foundation for the content in this study was based on a multimedia, animated
instructional learning study about how lightning works developed by Johnson and Mayer
(2010). The original materials were created and tested by Mayer, Heiser, and Lonn
(2001) and later revised (Johnson & Mayer, 2010). Both studies used 16 segments of
narrated animation in a 140-second presentation. The instruments and content in these
studies (Mayer et al., 2001; Johnson et al., 2010) were not extensive enough to be used as
the entire foundation for this research study but provided an outline for the instructional
content. The content was expanded and includes resources from: the National Oceanic
and Atmospheric Association (NOAA), and the National Weather Service, and
Theweatherprediction.com.
This study was designed to examine a hypothetical learning situation in which the
concept of mobile learning and assessment can be evaluated and tested. The next section
provides a literature review of distributed presentation learning, pacing, and the testing
effect and explores potential gaps in knowledge about these topics. Some areas are
grounded in more than 100 years of research. It is not possible to cover all the research
for these topics in this paper. A brief historical presentation of each topic is followed by a
description of recent research articles and their significance to the study. A literature
review of microlearning, mobile learning, and human interactions with mobile devices is

4
also presented to relate the historical concepts in a contemporary environment and
provide a foundation for this study.
Overview of the Study and Research Questions
The purpose of this study was to investigate outcomes of mobile learning,
distributed presentation, and testing on mobile devices. Specifically, the study
investigated differences between distributed presentation microlearning outcomes based
upon time of evaluation after microlearning instruction and whether planned – once-daily
instruction and testing or massed availability of instruction and testing has an impact on
learning outcomes. Additionally, this study examined pre- and post-instruction student
attitudes about microlearning, mobile devices and mobile use in academic settings. The
research questions for this study are:
1. Is there a difference in learning outcomes depending upon the method of delivery
of instruction – distributed presentation or massed availability?
2. Is there an improvement in learning outcomes with the testing effect on mobile
devices depending on the number of assessments after instruction?
3. What are students’ attitudes about using personal mobile devices for learning?
4. What are students’ beliefs about the ease of learning on mobile devices?
The study employed a 2 x 2 factorial design and compared differences in learning
outcomes based on type of instructional presentation and time of delivery of assessment.
The two independent variables manipulated in this study were distribution of presentation
of instruction, with two levels once-per-day or massed availability in which all
instruction was made presented without restriction to availability, and testing with two

5
levels – immediately upon completion of instruction or at the end of all instruction. The
dependent variable was learning outcomes in the form of scores on the comprehensive
quiz. Participant attitudes about learning on mobile devices were evaluated as co-variates
to the dependent variable and as attitudinal exploratory factor analysis.
Limitations of the Study
This study was conducted entirely online, through the Arizona State University
Blackboard Learning Management System (LMS) version 9.1, Google documents (docs),
forms and sheets, and email. Students were expected to participate in the study with the
same academic integrity and rigor outlined in the Arizona State University Student Code
of Conduct. At the beginning of the instructional and assessment components, students
were asked to sign a digital acknowledgment of integrity and not to use resources other
than the instructional material, such as Google or the internet. Unfortunately, there was
no way to prevent participants from not adhering to the guidelines, and in at least one
example a participant responded with text revealed to have been copied verbatim from
the National Oceanic and Atmospheric Association’s website.
The Blackboard LMS employed by Arizona State University during this study
was Blackboard version 9.1. To access content via a smartphone, participants had to
download the Blackboard app available through Google Play for Android devices and
iTunes for Apple iOS devices. The app was upgraded in 2016 to improve the
responsiveness of the interface on small devices such as smartphones. An outage of the
entire Blackboard system was experienced one Monday for approximately six hours.
Participants in the daily distribution of instruction were moved to the following week.
Participants in the massed instruction were not moved. Some technical issues arose for a

6
few participants. However, most were resolved through reference to an online instruction
sheet, screen captures shared through Google Docs and email.
Another limitation of the study was the high dropout rate. More than 430 potential
participants signed the participation consent form and were enrolled in the study. Of
those 301 completed the pre-survey, only 137 fully completed the instructional content,
and only 97 completed all three phases of the study that is pre-survey, instruction, and
post-survey.

7
CHAPTER 2
LITERATURE REVIEW
Learning anywhere at any time is not a new concept, but mobile devices bring
new opportunities to learning as briefly discussed in the Introduction. Learning theory
has more than a century’s worth of research, but early research is the foundation of
instructional design and still plays a significant role in today’s learning environments.
Some theories have become particularly relevant with the potential for learning on mobile
devices.
The literature review presents a brief historical view of learning theories relevant
to this study then associates those theories to current research and findings of distributed
presentations and massed presentations, the testing effect, microlearning, and mobile
learning or m-learning. The literature review also discusses new areas of study related to
attitudes about learning on mobile devices and considerations for creating content unique
to mobile devices.
Distributed Presentations
Spaced or distributed presentations (DP) are defined as practice or learning that is
repeated and spaced over a period of time (Ebbinghaus, 1913). Massed presentations
(MP) are defined as learning that is studied over a short period of time and are
exemplified by traditional lectures in higher education where a large amount of
information is provided in a single presentation. Research focusing on DP-MP has a long
history. In 1885, Ebbinghaus found that spaced instruction and repetition of learning
improved errorless recall. Since Ebbinghaus, there has been a substantial amount of
research and literature to support this theory (Craik, F.I.M, 1970; Gates, 1917; Melton,

8
1970). Many researchers conducted studies on remembering word lists, images or
numbers. Early studies by Ebbinghaus and Peterson and Peterson (1959) relied on
consonant-vowel pairs that had no meaning. Tulving (1967) and Hintzman and Block
(1971) used lists of common nouns. This literature review will focus on select recent
studies. The studies researched multimedia content and complex concepts that align more
closely with potential learning on mobile devices. These studies are believed to be more
relevant to the current state of distributed presentations in higher education.
To define learning experiments in the context of DP-MP studies, this portion of
the literature review typically adheres to Tulving’s (1967) description of a learning
experiment. A learning experiment consists of two operationally distinguishable phases:
input and output. During the input phase, a student is presented material for study while
during the output phase the presented material is recalled and tested. These two phases
are present in free-recall learning experiments where the number of combinations of input
and output phases is systematically varied.
Peterson and Peterson (1959) conducted a series of studies about spacing and
short-term retention that would serve as the foundation for many subsequent studies. In
this series of studies Peterson and Peterson (1959) used individual items, that is,
consonant syllables as opposed to the traditional use of lists, and found that participants
would forget consonant syllable pairs as recall intervals increased. Additionally, they
found that by using controlled rehearsal, a process in which the participants counted
backward or used some other method to distract from practicing the syllable pairs,
forgetting increased at different rates depending upon the amount of controlled rehearsal.

9
In a subsequent study, Peterson, Saltzman, Hillner, and Land (1962) studied
retention of paired words in short-term memory experiments. The study found that
immediately after presentations, participant recall was almost perfect and that after
2- and 4-sec. intervals retention was higher than after an 8-sec. interval. However, the
effect reversed at the 16-sec. interval whereby after a second presentation of materials at
16-sec. retention was improved. This method is known as the Continuous Paired
Associate (CPA) method. In a follow-up study, Peterson, Wampler, Kirkpatrick, and
Saltzman (1963) performed a series of studies using a similar CPA method, but with
varied lengths of spacing intervals to further research the spacing effect. They found that
spacing presented material over increments of time increases the effectiveness of learning
and remembering.
Fishman, Keller, and Atkinson (1968) noted that spacing of learning sessions had
received significant experimental investigation and support but that questions related to
optimal spacing had not been resolved. Fishman et al. described a hypothetical situation
in which six days were available to learn a set of 24 spelling words. One solution was to
select two sets of four words for presentation every other day over a period of six
consecutive days, and the other solution was to present all six sets of four words on one
day. Fishman et al. described these two conditions, respectively, as distributed and
massed presentation, which they empirically tested in one of the earliest examples of
testing with computer-assisted instruction. They found that the probability of a correct
response during learning sessions was higher for the massed presentation than the
distributed presentation, however, when retention tests were performed 10 and 20 days
later, students in the distributed presentation had better retention.

10
Tulving (1967) studied free-recall learning experiments in which the number and
sequential combinations of input and output stages were varied in an organized manner.
The study focused on the effects of the recall tests. He found that the recall tests seemed
to facilitate and interfere with the recall of items. This was counter to previously adopted
views that the strength of items in a free-recall test experiment increase as a result of the
number and reinforcement during input phase, and that the recall test simply provided an
accounting of the degree of learning.
Melton (1970) discussed previous research about DP and MP and found that it
pertained mostly to perceptual motor skills, verbal learning, and analytic tracking tasks.
Melton noted that the study of rote learning tasks was easier to examine because it was
not confounded by more complex learning such as trial-and-error learning and
instrumental learning. Melton found that Peterson, Saltzman, Hillner, and Land’s (1962)
study broke with traditional list recall by using the CPA method. Melton’s (1970) studies
were influenced by Tulving’s (1967) findings whereby DP and free-recall tests allow
different cues to be stored than does massed presentation and that the cues improved
retrieval. He summarized his findings by stating that the effects of DP on remembering
have been studied and proven in enough experimental situations that there is basic
understanding under which conditions repetition improves remembering.
Hintzman and Block (1971) performed studies on the effect of spacing and
repetition on performance and discussed that repetitions may form independent traces
upon memory and that these traces may be separate and discernable. They found that
repetition increases and strengthens memory traces. In a subsequent study, Hintzman

11
(1974) showed that two spaced presentations were almost twice as effective as a single
mass presentation in improving achievement.
In a more recent study, Raaijmakers (2003) summarizes that in general, the
spacing of presentations will lead to more contextual, structural, and descriptive
components being stored in memory. Also, Braun and Ruben (1998) indicated that
spacing instruction is of practical importance because it can be implemented without any
additional study time or training. Although much research has been done to show that
distributed presentation (DP) and spacing is more powerful for learning outcomes than
massed presentation (MP), instruction in higher education tends to be a pervasively
massed presentation in the style of three-hour long lectures and linear.
In a departure from using vocabulary, pictures and lists, Raman, M., Mclaughlin,
K., Violato, C., Rostom, A., Allard, J., & Coderre, S. (2010) investigated distributed
delivery learning (DD) as compared to massed delivery learning (MD) with
gastroenterology residents. In this study, the authors use slightly different language to
describe the instruction but the method is consistent with DP instruction and MP
instruction previously mentioned. Most higher education and medical school instruction
are based on multi-hour lectures; the goal was to determine if DD would be as effective
or more effective than MD for acquiring learning that requires higher levels of reasoning.
The one-week post-exam results for the DD groups were improved over that of the MD
groups, and at three months a post-test showed that the DD group continued to score
higher than the MD group. Ramen et. al. (2010) concluded that long-term nutrition
knowledge was improved with distributed learning as compared to mass learning.

12
In a recent review of the literature, Son and Simon (2012) found that on the
whole, spacing instruction leads to better performance than mass instruction. This
performance advantage was evident in laboratory experiments, in the classroom, across
all ages, and in all learning domains. Additionally, Son and Simon (2012) noted that there
were only a few instances of massed presentation outperforming distributed presentation.
They found that the instances and environments were relatively rare in real-world settings
and concluded that for both educators and learners, spaced or distributed study is the best
strategy.
This study will employ the independent variable – distributed presentation
instruction. This variable has been widely researched. This study defines distributed
presentation instruction as instruction that is spaced over a series of learning interventions
and is a short duration of time – five to seven minutes or less.
Testing Effect
The testing effect also has been widely researched by Gates (1917), Whitten and
Bjork (1977) and McDaniel and Fisher (1991) among others. As early as 1917, Gates
studied outcomes of the testing effect and found that testing improves long-term memory
and retrieval of information needed for future performance. The testing effect is defined
as improved performance on learning when delayed retention and practice retention tests
are implemented after studying material, as compared to studying the material twice.
In a frequently cited study, Whitten and Bjork (1977) investigated resting and
retrieval where they reported that learning gained from retrieval practice produced results
similar to practice and repetition. Additionally, successful retrieval increases memory in
an equivalent method to repetition. The authors also discussed that in practical

13
applications as learning may be optimized when retrieval practice is delayed for a brief
interval and that the spacing-of-tests effect produces results that are qualitatively similar
to the spacing-of-repetition. They concluded that successful retrieval supplements
memory in a similar way as repetition.
McDaniel and Fisher (1991) performed experiments examining the influence of
test taking and feedback in promoting learning and found the beneficial effects of testing
whereby tested facts were better recalled on a final criterion-referenced test than untested
facts. They also found that tested facts were also better recalled than facts that were
presented for additional study or spaced instruction.
A series of experiments by Carrier and Pashler (1992) sought to extend research
on the testing effect and found that after some amount of learning has been attained,
learners should be engaged in forced retrievals (tests) without having access to the
original instruction. Additionally, the authors found that in experiments in which
performing a test trial/study trial (TTST) condition as compared to a strict study trial (ST)
condition was conducted; the TTST condition led to better performance than the ST
condition. Carrier and Pashler (1992) rejected the hypothesis that successful retrieval is
beneficial only to the extent that it provides another study experience.
Recently, Roediger and Karpicke (2006) researched the testing effect under more
educationally relevant conditions. Previously the testing effect focused on materials
similar to materials used in the spacing effect – words, syllables, and images – but they
used materials from the preparation book for the Test of English as a Foreign Language.
Passages were selected and participants either restudied or were tested on the material.
The study reported that the positive effects of repeated testing were dramatic where tested

14
students recalled 61% of materials after one week compared to repeated studying students
recalled 40% of materials after one week.
In an another study, Karpicke and Roediger (2007) found that delaying an initial
retrieval attempt, similar to equally spaced retrieval practice conditions, promotes long-
term retention and learning by increasing the difficulty of retrieval on the first test and is
consistent with prior research on the topic. The authors concluded that practicing retrieval
is a robust method to enhance learning and retention, but that expanding retrieval
may not be as effective as equally spaced practice and that the desired technique to
enhance learning is a delayed initial retrieval attempt rather than expanding intervals
between retrieval.
For most studies investigating the testing effect, the instructional materials
involved verbal learning materials like word lists, prose passages, and in only a few
cases, simple pictures as learning materials. Johnson and Mayer (2009) proposed a series
of multimedia learning experiments that involved more complex materials, which
included both words and pictures. In their experiments, Johnson and Mayer found that the
testing effect can be obtained with multimedia lesson containing multiple modalities,
words, and pictures. The authors sought to explore whether the testing effect would
extend beyond simple retention test to transfer skills. Transfer skills are considered the
ability to solve more conceptual problems such as troubleshooting, modifying or
redesigning something to achieve a goal and diagnosing problems. They found that the
testing effect can be obtained with transfer tests that contain educationally relevant items.
Wojcikowski and Kirk (2013) took testing effects experiments a step further and
integrated detailed feedback into testing. The experiment tested high-level knowledge of

15
biomedical information with medical students. The experiment consisted of multiple-
choice tests deployed through an online-testing system. The study found that compared to
a test situation in which participants only received feedback about the correct answer,
participants that received detailed feedback explaining why each answer was correct or
incorrect, the detailed feedback group performed significantly better. Wojcikowski and
Kirk found that test-enhanced learning with detailed feedback has the potential to
reinforce student knowledge of the complex material.
This study will employ the independent variable – the testing effect. Though this
variable has been widely studied, it has not been studied in mobile learning. This study
defines the testing effect as improvement in learning outcomes through testing.
Distributed Presentation and Testing with Mobile Devices
As previously discussed, considerable research has been conducted on distributed
presentation instruction and testing, but not much has been researched about distributed
presentation instruction and testing on mobile devices. After years of trending toward
parity, in 2014, the number of mobile device users overtook desktop users, including
users of laptops. Pew Institute (2017) found that 95% of Americans own a cellphone of
any kind with 77% owning a smartphone. Among adults between the ages of 18–29
virtually 100% owned a cellphone of any kind with 92% owning a smartphone. Younger
adults and those with lower incomes and education are more dependent on smartphones
to access the Internet. As smartphone usage increases so do the number of hours spent
accessing the web and multimedia content. Bosomworth (2015) found that 2015 year-to-
date Internet usage and engagement growth on mobile devices are also at the tipping
point. Fifty-one percent of all digital media consumption is on mobile devices. However,

16
development of instruction and education on mobile devices significantly lag
development of other forms of mobile content. For the purpose of this study, mobile
devices are defined as personal smartphones with an advanced operating system
combining the features of a personal computer and a cellphone and employing
touchscreen interactivity. Mobile devices are Internet capable without the use of data
cables or cords, lightweight, and portable.
Mobile learning is defined as the use of mobile technologies to promote and
distribute learning. Traxler (2005) originally described mobile learning as any
educational provision where the sole or dominant technologies are handhelds or palmtop
devices. Later, Traxler (2010) revised his thinking about mobile learning to make it less
technology centric and to include additional concepts of distance learning, and virtual and
real spaces for learning. Recently, Allen and Seaman (2015) found that online, or
distance education continues to grow and that more than one in four students (28%) are
taking some type of distance education course and 72.7% of all undergraduate students in
public institutions are participating in some type of distance education.
Educational institutions were early adopters of apps on mobile devices through
the use of e-books and educational games. However, e-learning designed for desktop and
laptop computers fails for effective learning on mobile devices. Alrasheedi and Capretz
(2013) found that despite the immense penetration and worldwide popularity of the usage
of mobile technology, its adoption in the education section, especially higher education,
has been slow.
Prensky’s (2001) assertion that digital natives (i.e., persons born after 1980) are
more technically adept than digital immigrants, persons born before 1980, is being

17
challenged. New research is finding that digital natives’ use of technology in higher
education may be more dependent on students’ majors than simply their year of birth
(Margaryan, Littlejohn, & Vojt, 2010). The scenario is slightly different or instructors.
There was no significant difference in teachers’ attitudes about mobile usage as support
for education in classrooms for teachers less than 32 years of age and those between 33–
49, for teachers over the age of 50, it varied significantly (O’Bannon & Thomas, 2014).
Chen and deNoyelles (2013) found that instructors are unprepared to integrate mobile
technologies in learning as most faculty professional development opportunities do not
specifically focus on adoption and conversion of mobile learning into course content.
Another barrier to adoption of mobile learning is students may not be willing to
use their personal mobile devices for nonsocial interactions. Most students prefer to keep
their academic and social lives separate, and view social networks as more about
connecting with friends and less about doing academic activities. E-mail is the preferred
method of communication with instructors while on-demand interactive communication
methods (i.e., texting, instant messaging, online chatting) are commonly used among
students to interact with one another (Dahlstom, 2013).
Smartphones and mobile devices may not be ideal for consuming traditional
e-learning, which includes online learning and distance learning generally taught through
online videos and tutorials. Much e-learning consists of recorded classroom lectures of
indeterminate length that lack interactivity. Recorded lectures can be difficult to update
and edit, bandwidth intensive, and not responsive for viewing on smartphones and mobile
devices that have smaller viewing ports than computers.

18
The multimedia and technology effect has been widely researched (Clark, 2001;
Mayer, 2002) in an effort to distinguish media’s influence on learning. Original studies
focused on the use of computers, e-learning, and digital books and found that there was
no evidence to support the idea that media influences learning (Clark and Feldon, 2005).
As technology and devices improved and became more widely available, findings by
Sung and Mayer (2013) indicated that in a multimedia lesson study comparing students
using a computer vs. an iPad, a media effect between the two groups was observed
(d = .60). The importance of effective instructional design strategies should not be
diminished and are still necessary to improve learning outcomes across all media
however, the addition of handheld devices may increase student engagement in learning.
(Sung & Mayer, 2013).
Definition of Microlearning and Examples
Microlearning is a relatively new phrase and is described as learning that deals
with relatively small learning units and short-term-focused activities (Hug, 2005). Rather
than limit microlearning to a single definition, Hug stipulated that microlearning has
certain characteristics. Microlearning is relatively short in duration, ranging from a
second to up to an hour. It consists of small units of content such as limited amounts of
text and narrow subject matter and takes on the form of fragments of knowledge. It is
usually part of a larger curriculum or set of other instructional material. It can be situated
or non-situated as well as sometimes repetitive and action-based. The foundations of
microlearning can also be related to concepts of chunking (Miller, 1956) where
information for processing and reduction of extraneous cognitive load is managed by
parsing content into digestible units.

19
Job and Ogalo (2012) found that microlearning emerges from micro-content and
micro-content is described as small learning units and short-term activities. Although the
term microlearning may be new, micro-content and microlearning concepts are grounded
in cognitive load theory (Sweller, 1988). In study for OPALESCE (Online Portal forand
Active Learning System for Senior Citizens in Europe) Buetner and Pechuel (2017)
designed “Micro Units” as a way to rethink the delivery of instruction for mobile
learning. They defined Micro Units as:
A Micro Unit is a very short learning course that focuses on one topic and has clear learning goals. An example of a Micro Unit could be “How to change your motor oil” which would be a rather practically oriented lesson or “The Battle of Waterloo” which would be a brief history lesson. Since Micro Units are meant to be short, generally not lasting more than 10 minutes, bigger topics can be grouped in suits of Micro Units. Micro Units consist of a number of “views” that can be seen in a certain order. A learner can go through the views one by one, stop at any time, and go back at any time. A view consists of one of eight content elements which can be categorized in four groups: Text Elements, Graphic Elements, Audio Elements and Video Elements.
Attitudes about use the of Personal Mobile Devices for Learning
Previous research indicated that although student ownership of mobile devices is
high, attitudes about using personal mobile devices for learning in higher education was
moderate (Chen et al., 2013; Sung et al., 2013). This may be changing. Newer research
on the topic by Thomas and Muñoz (2016) indicates that 90.7% of high school students
in an urban school district were using mobile phone features for school-related work and
more than 70% believed that mobile phones could help support learning. Students used
features such as calculators, calendars, clocks and timers, and accessing the internet. On a
4-point scale (1 = strongly disagree to 4 = strongly agree) students indicated high levels
of agreement (M = 3.53, SD = .55) with the statement “I think mobile phones support

20
learning.” Further, students indicated that benefits of mobile phones in classrooms
included: reduction of the digital divide between students who have technology and
those who do not, provide learning opportunities, and improve digital fluency
(Thomas et al., 2016).
Yeap, Ramayah, and Soto-Acosta (2016) also replicated the study by Cheon et al.,
(2012) using the Theory of Planned Behavior (TPB) to predict factors influencing
adoption of m-learning in higher education. The study by Yeap et al., (2016) collected
data from 900 undergraduates in a public university in Malaysia. The study confirmed
that all three constructs – Behavioral beliefs, Normative beliefs, and Control beliefs – had
a significant positive influence on student intentions to adopt m-learning. However, the
study found that subjective norm had the strongest impact followed by perceived
behavior control and finally attitude (Yeap et. al, 2016) as compared to perceived
behavioral control having impact followed by attitudes and then subjective norms (Cheon
et al., 2012). The study validated the model of m-learning readiness based on the TBP
(Choen et al., 2012) and successfully proved that it holds true with a different population
(Yeap et al., 2016).
Jeno, Grytnes, and Vandvik (2017) investigated biology students’ intrinsic
motivation using a mobile app – ArtsApp available for Android smartphones compared to
traditional textbooks for species identification. The study found that students had higher
intrinsic motivation (M = 5.44, SD = 1.23) compared to using the textbook (M = 3.24,
SD = 1.31). Additionally, students scored higher on achievement tests with the mobile
application than did students using textbooks (mobile application; M = 7.78, SD = 3.21,
textbook; M = 5.95, SD = 3.46) (Jeno et al., 2017).

21
In a study by Mieshar-Tal and Ronen (2016) instructor attitudes about the use of a
mobile game and its impacts on learning were examined. The study conducted a
workshop using a mobile-game app with location-based services for creating treasure
hunts. The game was designed to be an in-school activity. The study revealed that
instructor attitudes about the potential of smartphones for learning was changed after the
experiment and that a willingness to adopt them as part of student’s personal learning
toolkit was strengthened. Additionally, teachers’ attitudes about positive effects of using
smartphones in learning increased (Mieshar-Tal et al. 2016).
Al-Emran, Elsherif, and Shallan (2016) conducted a study with 383 undergraduate
students and 54 instructors in five universities to explore the perceived usefulness of
mobile devices in educational environments. Student participants were from four majors:
Business management, English, IT, and Project management. The study was exploratory
and utilized a 10-question survey. For both students and instructors, the results indicated
no significant difference among attitudes towards the use of m-learning in terms of
gender. The study did find a significant difference of attitudes for use of technology for
learning in student who owned smartphones compared to those who did not. Further, the
study indicated that almost all majors have a positive attitude towards m-learning and that
both undergraduate and graduate students are motivated to use their mobile devices for
learning. (Al-Emran et al. 2016). In summary, the study by Cheon et. al., (2012) using
TBT to predict mobile learning readiness has been replicated and further validated by
recent researchers indicating that students’ intentions to use mobile devices for learning
can aid in prediction of successful use of mobile devices in educational settings.

22
Discussion of Human Interactions with Mobile Devices
Nielsen and Molich (1990) developed a set of 10 heuristics for computer user
interface design that are now commonplace in most human-computer interactions and are
heavily relied upon within the mobile application (App) development community. These
heuristics allow users to easily adopt new devices, software, Apps, and user interfaces
based upon previous learned expectations and behaviors as well as speeding up
development time for new products. Hobber (2013) found that 49% of smartphone users
hold their device with one hand and the thumb in primary contact with the device screen.
Billinghurst and Vu (2015) found that most users have a dominant hand interaction with
their mobile device and use a single finger for most motions.
Summary and Research Questions
The purpose of this study was to investigate outcomes with mobile learning,
distributed presentation, and testing on mobile devices. Specifically, the study
investigated differences between distributed presentation microlearning outcomes based
upon the number of evaluations after instruction and whether planned – once-daily
instruction and testing; or the massed availability of instruction and testing, has an impact
on learning outcomes. Additionally, this study examined pre- and post-instruction student
attitudes about microlearning, mobile devices and mobile use in academic settings. The
research questions for this study are:
1. Is there a difference in learning outcomes depending upon the method of delivery
of instruction – distributed presentation or massed availability?
2. Is there an improvement in learning depending on the number of assessments after
instruction?

23
3. What are students’ attitudes about using personal mobile devices for learning?
4. What are students’ beliefs about the ease of learning on mobile devices?
The study employed a 2 x 2 factorial design and compared differences in learning
outcomes based on type of instructional presentation and time of delivery of assessment.
The first of the two independent variables manipulated in this study were the distribution
of presentation of instruction with two levels, once-per-day or the massed availability of
instruction in which all learning modules were presented without restriction to
availability. The second independent variable was testing with two levels, immediately
upon completion of instruction or at the end of all instruction. The dependent variable
was learning outcomes in the form of scores on the comprehensive quiz. Participant
attitudes about learning on mobile devices were evaluated as covariates to the dependent
variable and as attitudinal exploratory factor analysis.

24
CHAPTER 3
METHODS
Participant Characteristics
Participants for this study were a random sample of undergraduate and graduate
students at Arizona State University (ASU). Participants were required to be at least 18
years of age and be able to sign legal consent. Beyond that, no restrictions were placed on
the academic level, area of study or campus location of potential participants. Participants
also had to be enrolled in classes at the time of the study with a valid ASU identification
number. Participants were required to own a personal touch-enabled, wireless-capable
smartphone device and agree to use it for the study. The study did not provide
participants with any computers, mobile devices or smartphones. Participants needed a
connection to a wireless network and the Blackboard LMS mobile application (App). A
free wireless connection was available on all main ASU campuses and participants were
not required to purchase wireless service to participate in the study. The Blackboard LMS
App was free and available for download on Google Play for Android devices or iTunes
for Apple iOS devices. All materials were only presented in English and no
accommodations were made for persons with language barriers or disabilities. These
conditions were clearly described in the online consent form.
Sampling Procedures
Sample size. To determine a sample size for the two-way ANOVA with two
levels, an a-prior power analysis was conducted to using G*Power (a = .05).
Table 1 provides a summary of the power analysis.

25
Table 1
Summary of power analysis
r2 ____________________________________________________________
Power .10 .25 .40
.70 620 101 41
.80 787 128 52
.90 1053 171 68
The resulting sample size with Cohen’s f = 0.25, alpha = .05, and power = .80 was
128 total participants, or 32 per condition. The family-wise Type I error rate was set at
the 0.05 level. Cohen’s f defines the following effect sizes: small f = 0.10, medium
f = 0.25, large f = 0.40 (Cohen 1988).
Recruitment. Participants were recruited through online advertisements placed in
the My ASU student portal, ASU Sport Teams, an ASU fraternity, and classes in Arts,
Communications, and Educational Technology. A condition of the My ASU student
portal advertisement was that the study had to be available to most students at the
university. As a result, a very diverse group of students participated in the study. Various
incentives were offered to participants: Amazon gift cards for the My ASU online portal,
community service for the ASU Sport Teams and ASU fraternity, and extra credit for the
class participants. The three forms of incentives were clearly outlined and described in
the IRB to ensure equality of compensation.
All participants signed an online consent form through Google Docs (Appendix
A) regardless of recruitment method and were enrolled in the instructional portion of the

26
study. The forms were authenticated through the Arizona State University user ID
authentication portal to ensure that only ASU students participated in the study and
enabling association of identification with survey responses and Blackboard instructional
content completion. There were 311 total applicants; 137 completed the instructional
content.
Demographics. The sample collected for this study was composed of 311
students. The data sources for the study included a pre-survey, mobile instruction with
quizzes, and a post-survey. This produced five participant data sources for examination:
131 pre-survey only (42.1%), 10 post-survey only (3.2%), 33 pre- and post-survey but no
instruction (10.6%), 40 only post-test missing (12.9%), and 97 all components (31.2%).
A total of 301 participants completed the pre-instruction survey (96.8%) and 10
completed the post-survey only (3.2%). Reported gender was 171 males (55%), 130
females (41.8%) and 10 preferred not to disclose or were missing (3.2%). The academic
level of achievement was 60 freshman (19.3%), 58 sophomore (18.6%), 69 junior
(22.2%), 61 senior (19.6%), 53 graduate student (17%), and 10 missing or did not
disclose (3.2%). The type of smartphone mobile device owned was 96 Android devices
(30.9%), 204 Apple iOS devices (65.6%), 1 Windows device (0.3%), and 10 missing or
did not disclose (3.2%). The age of the participants for the pre-instruction survey was;
148 18–20 years-old (47.6%), 104 21–24 years-old (33.4%), 35 25–30 years-old (11.3%),
14 31-or-older (4.5%) and 10 missing or did not disclose (3.2%). Participant area of study
was too diverse to differentiate and areas of study included: Art, Business,
Communications, Education, Engineering, Life Sciences, and Nursing.

27
A total of 137 participants completed the mobile instruction and some
combination of the pre- and post-survey (none missing). Of these participants there were
75 males (54.7%) and 62 females (45.3%). The academic level of achievement was:
23 freshman (16.8%), 24 sophomores (17.5%), 32 juniors (23.4%), 29 seniors (21.2%),
and 29 graduate students (21.2%). The type of smartphone mobile device owned was
44 Android devices (31.6%) and 93 Apple iOS devices (68.4%). The age of the
participants was: 61 18–20 years-old (44.5%), 48 21–24 years-old (35.0%), 18 25–30
years-old (13.1%), and 10 31-or-older (7.4%). Participants were randomly assigned to
one of the following instructional conditions.
1. One instructional module delivered each day, Monday – Friday, in which the
daily instructional module and individual module quiz were available at 6:00 a.m.
each morning and made unavailable at midnight each day. The final
comprehensive quiz was available on Friday.
2. One instructional module delivered each day, Monday – Friday, in which the
instruction was available at 6:00 a.m. each morning and made unavailable at
midnight each day. This group only received the final comprehensive quiz, which
was available on Friday.
3. All instructional modules available for self-pacing in which the instructional
modules, individual quizzes, and final comprehensive quiz were available at
6:00 a.m. Monday and made unavailable at midnight Friday.
4. All instructional modules available for self-pacing in which the instructional
modules and final comprehensive quiz were available at 6:00 a.m. Monday and
made unavailable at midnight Friday.

28
Materials
To create a culture of full-mobile utilization, all consent forms, instructions,
surveys and instructional content were set up to be available for viewing and completion
on a smartphone. Custom online multimedia about lightning was created for this study
and distributed through the Blackboard LMS. A single Blackboard master course was
created and contained all instruction, quizzes, and announcements. From the master
course, four duplicate courses were created, one for each of the four study conditions.
Duplication of a single master course ensured consistent instruction and quiz questions,
and enabled automated deployment of content availability and removal of availability for
each participant group based on the study conditions. Course access was made
unavailable at the end of each week for all participants enrolled in that week’s research
group. Announcements were sent daily to all participants. The participants in the groups
that got daily instruction received both a morning announcement at 8:00 a.m. and an
evening announcement at 6:00 p.m. (Appendix B). Participants were able to turn off
announcements through the Blackboard user interface.
A technical job aid for how to use the app and access the content was created and
placed in an online Google Doc (Appendix B). The pre- and post-surveys were also
created using Google Forms and results were captured in a Google Sheet for analysis.
The Google docs and forms were mobile responsive and fully functional on smartphones.
Almost half of smartphone users hold their device with one hand and most have a
dominant hand interaction with their mobile device (Hobber, 2013; Billinghurst & Vu,
2015). For this study, the Blackboard App and controls native to the student’s personal
device type predetermined certain device controls.

29
The study did have control over how the content was designed and developed, and
custom content was created to model common mobile application (App) behavior and
mimicked common vertical App orientation on smartphone displays. Similar to an App
interface the content was swipe-able and tap-able using a single digit for navigation. Due
to the vast range of device and screen sizes some users may have experienced suboptimal
single-digit access to controls.
Once created, the instructional materials were optimized for mobile devices (see
Figure 1) and specifically designed to fit a vertical smartphone screen (see Figure 2) as
compared to normal horizontal video and multimedia display. Creating this unique format
allowed participants to optimally view and engage in the mobile content more seamlessly
since they did not need to rotate their smartphones. The expected behavior was a simple
swipe to the left or right, using a thumb or single finger to navigate the content, that users
reflexively utilize when interacting with their smartphones. Common user interface
design interactions, referred to as heuristics (Nielsen & Molich, 1990), were relied upon
to improve adoption of a new system and to make participants feel more comfortable
engaging with the instruction on their device.

30
Figure 1. Illustration of single-hand thumb navigation and user control (Wroblewski, 2012).
Figure 2. Illustration of custom formatting of instructional screens.

31
Learning Environment
Study procedure. Enrollment in the study ran for approximately 15 weeks
throughout a normal academic semester. Participants who completed the consent form
were randomly assigned to one of the four conditions and enrolled in the Blackboard
instruction on a rolling basis. All instruction began on a Monday and ended on a Friday,
simulating traditional academic course work. Some weeks as many as 80% of enrolled
participants failed to complete the instruction. Participants were not allowed to re-enroll,
take modules or quizzes over or switch to another group. Participants in all conditions
received the same learning content and final quiz questions.
Each weekend new participants were sent a message from Blackboard in the form
of an email announcement (Appendix E). The announcement reminded participants that
they were enrolled in a research study. On each Monday, the new group of participants
would begin to receive daily announcements about the study. The announcements for the
distributed presentation groups would receive a morning and afternoon announcement
reminding them that availability for the day’s content would end at midnight. Once-daily
announcements were also sent for the massed presentation participants, but the
announcement reminded them that availability to the study content would end at midnight
on Friday.
Instructional content. The learning modules consisted of approximately 25 total
minutes of instructional content, five module quizzes, and a final comprehensive quiz.
The video content was created using a combination of Camtasia, an audio and video
editing program; Adobe Illustrator, a drawing program; and PowerPoint. The content
storyboards were drafted in PowerPoint and the custom illustrations were created to
32
accompany the audio, which was recorded in Camtasia. Once the illustrations and audio
were combined in Camtasia to create a movie, the movie was saved in a custom format of
320 pixels wide by 480 pixels tall. Multiple tests were performed to find an ideal
compression level so that the video files were not overly large causing buffering and
bandwidth problems for smartphones.
Participants were informed that they would need to turn on the speaker on their
smartphone or use headphones. A few participants indicated a problem with newer
Bluetooth enable headphones and other participants needed additional assistance turning
on the sound on their smartphones. Assistance was provided in the form of screen
captures and instructions via email.
Compared to traditional online instruction, where content, links, and resources are
often presented on multiple screens in the same browser window, the microlearning
instruction was presented as a single informational unit (SIU) that fits on a single
smartphone screen. Each SIU contained a short headline or keywords and illustrations
essential to the instruction. The use of headlines and or keywords in instruction is known
as signaling. The content was carefully curated to ensure concepts per microlearning
instructional unit were discrete. This approach is similar to the Micro Units created by
Beutner and Pechuel (2017) in which small units of learning content only fill one screen.
At the beginning of each module, an introductory screen appeared with the title of
the instructional module, i.e., How Lightning Works. Modules were broken into
microlearning instructional units of between approximately 30 seconds to 1 minute. The
same narrator was ued to minimize disparity in accent, dictation, pacing or pronunciation.

33
A sample microlearning session typically included two or three SIUs
accompanied by narration.
Figure 3. Screen of Single Informational Unit.
Narration: “The smaller positively charged particles tend to rise while the larger
negatively charged particles gravitate toward the bottom of clouds.
These particles tend to separate under the influences of updrafts and gravity until
the upper portion of the cloud acquires a net positive charge and the lower
portion of the cloud becomes negatively charged.” (A Lightning Primer, National
Air and Space Administration [NASA.gov] n.d.)
Participant activity logs were not always available due to lack of functionality
with the current version of Blackboard and database integration with student
identification numbers at ASU. To verify completion, participants signed an
acknowledgment (Figure 4) at the end of each module that they viewed all content within
34
the module. While this was not fool-proof, it is a common check of student integrity in
online courses.
Measures
Attitudinal pre-instruction survey. After completing the consent form, and
before taking the instruction, participants were asked to complete a survey. The survey
collected demographic information, the number of mobile and other computing devices,
hours spent using technology, and attitudes about learning on mobile devices (Appendix
C). The attitudinal questions consisted of 15 Likert-scale items. The instrument was
adapted from Cheon, Lee, Crooks, and Song (2012) study investigating mobile learning
readiness in higher education. Cronbach’s Alpha for the individual measurement items in
the Cheon et al. (2012) study was between .879 and .94. All 15 items of the pre-
instruction survey were initially combined to create a new variable to calculate
Cronbach’s Alpha for the reliability of the scale. Cronbach’s Alpha for the variable
was .927, which indicates that the scale meets conventional standards of scale reliability.
Instructional quizzes. All participants who completed the instruction took a 10-
question quiz. The quiz consisted of five multiple-choice questions and five short answer
questions. One multiple-choice question and one short answer question was derived from
each module (Appendix J). Testing had two conditions: immediately upon completion of
instruction or at the end of all instruction. Participants in the first condition also received
a five-question quiz at the end of each module, thus completing six total quizzes
(Appendix K). The individual modules quizzes consisted of four multiple-choice
questions and one short answer question. A limitation of the study is that two conditions
did not receive the five additional module quizzes.

35
Multiple-choice questions consisted of five answer choices. Of the five answers,
some answers were weighted more than other answers. Each question had an answer that
was worth 10 points, and other answers were scored: 0, 3, 5, 7, or 10. The scoring scale
was utilized to increase the variability of scores so that scores were not in clusters of
multiples of 5 and 10.
Short answer questions were incorporated into both testing conditions to decrease
guessing and to facilitate transfer skills. Short-answer questions were based on the
instrument created by Johnson and Mayer (2009) but were revised and expanded to
include content created for the instructional modules. Johnson and Mayer (2009)
indicated that transfer questions are not as rhetorical in nature, are more conceptual, and
challenge students to use a problem-solving approach to instruction. Short answer
questions were also scored: 0, 3, 5, 7, or 10.
Quizzes were created using the Blackboard Mobile compatible test type. The tests
were completed on the participants’ smartphones in the same course content area as the
instructional modules. Participants swiped a virtual string at the beginning of the quiz,
unlocking the content (Figure 4).

36
Figure 4. Example of acknowledgments of integrity unlocks screen for quizzes.
Each quiz question fit on a single screen (Figure 5) to decrease cognitive load and
mimic a single informational unit, similar to the instructional modules. The advantage of
a common user interface for both the instruction and the evaluation is that users became
familiar with the interface, facilitating ease and access to content and quizzes.

37
Figure 5. Example of multiple choice quiz question screen.
Short answer transfer questions accessed the smartphone keypad. Short answers
were limited to 300 characters, approximately double the length of a Twitter social-media
post. The character limit was chosen so that participants did not feel compelled to write a
short essay in order to answer questions. Answers could be as short as a few words to
convey understanding. Answers that reflected a deeper understanding of the instruction
were assigned 10 points. Answers that reflected a rudimentary understanding of
instruction were assigned a lower score.
Example: Final quiz, Module 1 assessment.
Question 2: An indirect strike can be very dangerous because:
Sample 10-point participant answer: The electrical current finds a better path in
humans and releases the charge. Hence they become part of the flash channel.
Various objects on the person can amplify the effects and cause serious damage
to the individual. Such as burns and neurological damage.

38
Sample 7-point participant answer: Because when it strikes someone electricity
runs through their whole bodies.
Sample 5-point participant answer: it can cause explosions that are very
dangerous.
Example: Final quiz, Module 4 assessment
Question 8: Lightning might strike the ground instead of a nearby tree because:
Sample 10-point participant answer: The lightening often seeks the path of least
resistance, which might be the ground rather than the tree. The ground is more
positively charged than the tree, making the ground a better target.
Some participants did indicate in the open-ended survey response that they
wished there were more characters available to answer short-answer questions.
Scoring. All quiz results were collected electronically. Multiple-choice answers
were assigned a predetermined value and automatically scored in Blackboard. Short
answers were individually scored on the scoring scale checking for completeness and
accuracy of the answer. A second grader was not utilized because the answers were short
and discrete, so no inter-grader reliability was tested.
Some short answers did receive a score of zero. An example of a short answer that
received a score of zero in response to any question was: “I do not remember.” Although
it is unfortunate that some participants did not remember, it is considered better for the
honest answer of not remembering than to find that participants searched the internet for
answers to questions.

39
Attitudinal post-instruction survey. After completing the pre-instruction survey,
the instruction and all quizzes, the participants were asked to complete a post-instruction
survey. The survey collected 10 additional attitudinal questions utilizing the same Likert-
scale. This instrument was also adapted from the Cheon et al. (2012) study. All 10 items
of the post-instruction survey were initially combined to create a new variable to
calculate Cronbach’s Alpha. Cronbach’s Alpha for the variable was .903, which indicates
that the scale meets conventional standards of scale reliability.

40
CHAPTER 4
RESULTS
The primary goal of this research study was to investigate learning improvement
and outcomes based on delivery of instructional content and assessment of instructional
content after completion. To measure this a one-way, two-way, and three-way or factorial
ANOVA were conducted to compare differences in learning outcomes based on the type
of delivery of instructional content, the number of assessments, the factorial ANOVA,
and gender. There were two independent variables manipulated in this study. The first
independent variable was delivery of presentation of instruction, with two levels – once-
per-day or massed availability in which all instruction was made presented without
restriction to availability. The second independent variable was testing with two levels –
quizzes for each individual learning module and a comprehensive quiz or a single
comprehensive quiz at the end of all instruction. The dependent variable was learning
outcomes in the form of scores on the comprehensive quiz.
The final study achieved 137 participants in the instructional portion. Scores
ranged from 28 – 100, M = 71.57, SD = 16.28. A post hoc power analysis using G*Power
with Cohen’s f = 0.25 and alpha = .05 resulted in power = .83. Participant groups were as
follows: 34 daily instruction with all quizzes, 36 daily instruction with only a final quiz,
32 all instruction at once with all quizzes, 35 all instruction at once with only a final quiz.
Outliers were explored using boxplots. One condition; daily instruction with the final
quiz only, had an outlier, but the outlier was not greater than 3 box-lengths from the edge
of the boxplot (Figure 6). The outlier was not removed. Table 2 presents a summary of
the study’s research questions and the tests conducted.

41
Figure 6. Boxplot of outlier less than 3 box-lengths from the edge of the boxplot.
Table 2
Tests Conducted Hypothesis Data Source Analyses
H1 There is a relationship between delivery of instruction and learning outcomes.
Learning Measure Scores
Analysis of Variance
H2 There is a relationship between the amount of testing and learning outcomes.
Learning Measure Scores
Analysis of Variance

42
Tests Conducted
H3 There is a relationship between students’ attitudes about using personal mobile devices and a willingness to engage in learning on their devices.
Survey Data Exploratory Factor Analysis Analysis of Variance
H4 There is a relationship between students’ beliefs about their technical abilities to use mobile devices and their willingness to engage in learning on mobile devices.
Survey Data Exploratory Factor Analysis Analysis of Covariance
Learning Outcomes
One-way ANOVA. A one-way ANOVA was conducted to evaluate learning
outcome scores first by type of distribution of instruction (daily or group) and next by the
number of quizzes (one quiz for each module plus a comprehensive quiz and the final
quiz or final quiz only).
The independent variable, the distribution of instruction, had two levels: daily
delivery of instruction in which individual daily instruction was available at 6:00 a.m.
each morning and made unavailable at midnight each day, Monday – Friday, and massed
instruction in which all instructional modules and quizzes were available at 6:00 a.m.
Monday and made unavailable at midnight Friday of that same week. The dependent
variable was learning outcomes in the form of final quiz score results from the first group
to the second group. Table 3 shows the sample size, mean, and standard deviation for the
dependent variable. The ANOVA was not significant, F (1, 135) = .23, MSE = 61.42,
p = .63. The partial 𝜂2 = .00 indicates a very low effect size. Homogeneity of variances

43
was observed as assessed by Levene’s test for equality of variances F = .00, p = .98.
Post hoc tests were not performed because there were fewer than three groups.
Table 3.
Learning Outcome by Delivery of Instruction
N Mean SD
Daily 70 70.91 16.33
Massed 67 72.25 16.33
The independent variable, number of quizzes, had two levels: one quiz for each
module plus a comprehensive quiz – six total, and comprehensive quiz only. The
dependent variable was learning outcomes in the form of final quiz score results from the
first group to the second group. Table 3 shows the sample size, mean, and standard
deviation for the dependent variable. The ANOVA was significant, F (1, 135) = 4.01,
p = .047. The partial 𝜂2 = .03 indicates a large effect size. Homogeneity of variances was
observed as assessed by Levene’s test for equality of variances F = .04, p = .84. Post hoc
tests were not performed because there were fewer than three groups.
Table 4.
Learning Outcome by Number of Quizzes
N Mean SD
All quizzes 66 68.71 17.05
Final quiz only 71 74.23 15.17
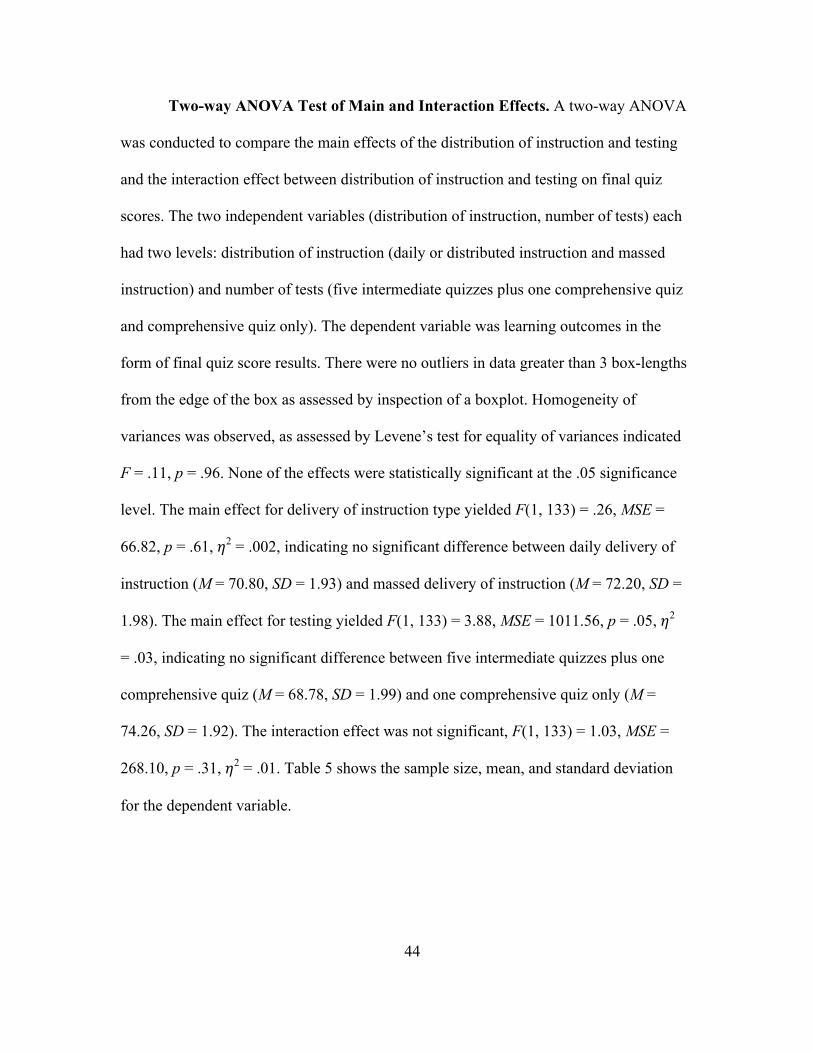
44
Two-way ANOVA Test of Main and Interaction Effects. A two-way ANOVA
was conducted to compare the main effects of the distribution of instruction and testing
and the interaction effect between distribution of instruction and testing on final quiz
scores. The two independent variables (distribution of instruction, number of tests) each
had two levels: distribution of instruction (daily or distributed instruction and massed
instruction) and number of tests (five intermediate quizzes plus one comprehensive quiz
and comprehensive quiz only). The dependent variable was learning outcomes in the
form of final quiz score results. There were no outliers in data greater than 3 box-lengths
from the edge of the box as assessed by inspection of a boxplot. Homogeneity of
variances was observed, as assessed by Levene’s test for equality of variances indicated
F = .11, p = .96. None of the effects were statistically significant at the .05 significance
level. The main effect for delivery of instruction type yielded F(1, 133) = .26, MSE =
66.82, p = .61, 𝜂2 = .002, indicating no significant difference between daily delivery of
instruction (M = 70.80, SD = 1.93) and massed delivery of instruction (M = 72.20, SD =
1.98). The main effect for testing yielded F(1, 133) = 3.88, MSE = 1011.56, p = .05, 𝜂2
= .03, indicating no significant difference between five intermediate quizzes plus one
comprehensive quiz (M = 68.78, SD = 1.99) and one comprehensive quiz only (M =
74.26, SD = 1.92). The interaction effect was not significant, F(1, 133) = 1.03, MSE =
268.10, p = .31, 𝜂2 = .01. Table 5 shows the sample size, mean, and standard deviation
for the dependent variable.
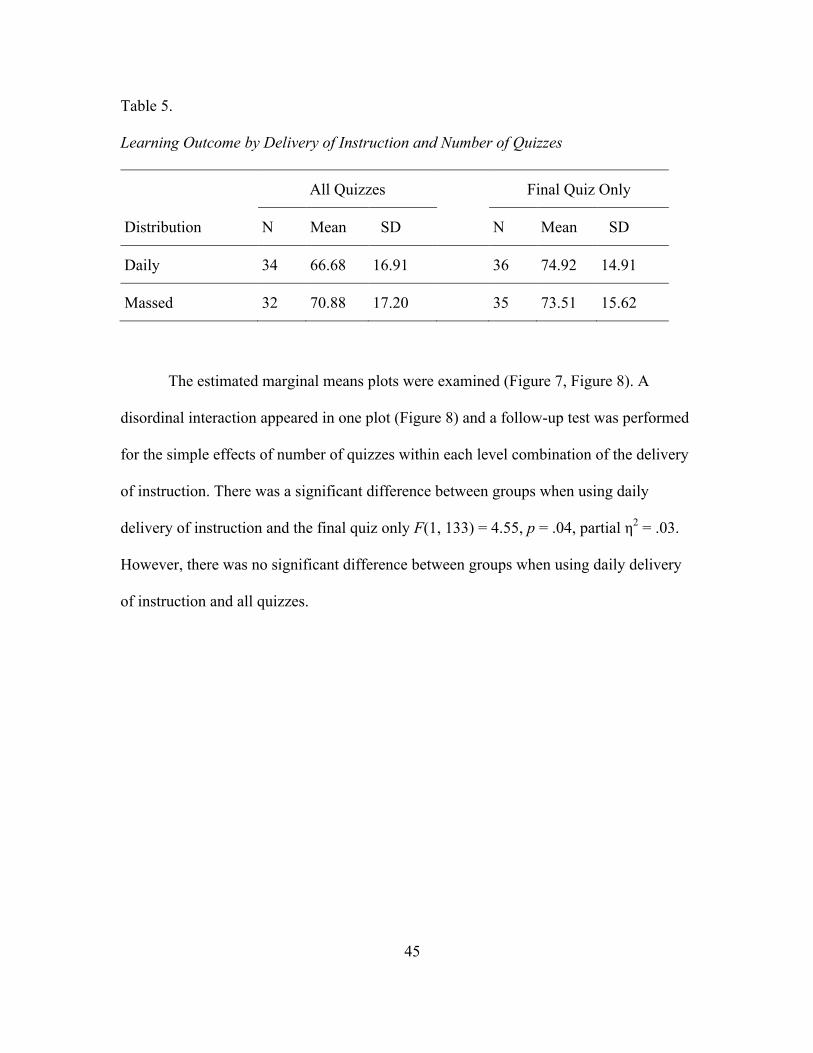
45
Table 5.
Learning Outcome by Delivery of Instruction and Number of Quizzes
All Quizzes Final Quiz Only
Distribution N Mean SD N Mean SD
Daily 34 66.68 16.91 36 74.92 14.91
Massed 32 70.88 17.20 35 73.51 15.62
The estimated marginal means plots were examined (Figure 7, Figure 8). A
disordinal interaction appeared in one plot (Figure 8) and a follow-up test was performed
for the simple effects of number of quizzes within each level combination of the delivery
of instruction. There was a significant difference between groups when using daily
delivery of instruction and the final quiz only F(1, 133) = 4.55, p = .04, partial η2 = .03.
However, there was no significant difference between groups when using daily delivery
of instruction and all quizzes.
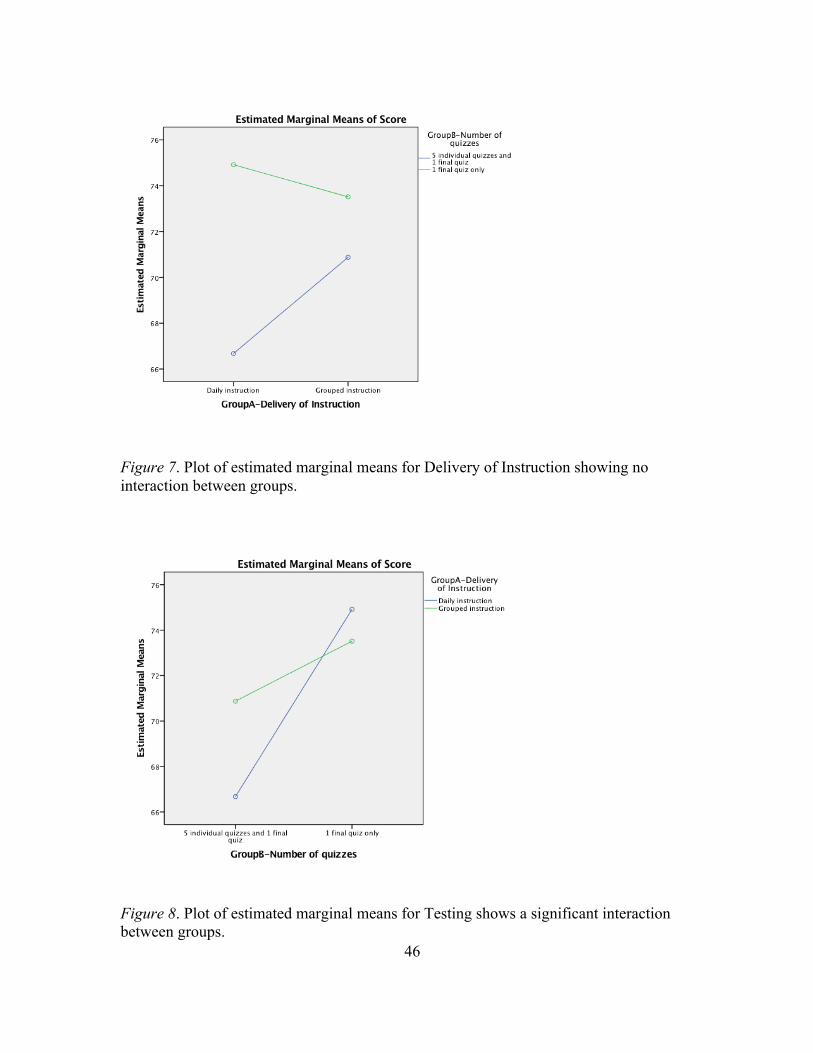
46
Figure 7. Plot of estimated marginal means for Delivery of Instruction showing no interaction between groups.
Figure 8. Plot of estimated marginal means for Testing shows a significant interaction between groups.

47
Three-way or factorial ANOVA. A 3 x 2 factorial ANOVA was conducted.
There were three independent variables each having two levels. The independent
variable, the distribution of instruction, had two levels: daily delivery of instruction in
which individual daily instruction was available at 6:00 a.m. each morning and made
unavailable at midnight each day, Monday – Friday, and massed instruction in which all
instructional modules and quizzes were available at 6:00 a.m. Monday and made
unavailable at midnight Friday of that same week. The second independent variable,
number of quizzes, had two levels: quizzes for individual modules plus a comprehensive
quiz – six total, and comprehensive quiz only. The third independent variable was gender,
which had two levels: male and female. The dependent variable was learning outcomes in
the form of final quiz score results from the first group to the second group. To evaluate
the effect of distribution (daily or massed) and quizzes (all quizzes or final quiz only) on
participants learning outcome scores. There were no outliers in data greater than 3 box-
lengths from the edge of the box as assessed by inspection of a boxplot. Quiz scores were
normally distributed (p > .05) except for two groups (females in the daily distribution of
instruction with all quizzes, p = .045, and males in the daily delivery of instruction with
the final quiz only, p = .03), as assessed by Shapiro-Wilk’s test of normality.
Homogeneity of variances was observed, as assessed by Levene’s test for equality of
variances indicated F = .97, p = .45.
There was no statistically significant interaction between delivery of instruction,
the number of quizzes, and gender for the dependent variable outcome scores F(1, 129)
= .04, MSE = 10.30, p = .84. The partial 𝜂2 = .00 indicates a very low effect size. Table 6
shows the sample size, mean, and standard deviation for the dependent variable.
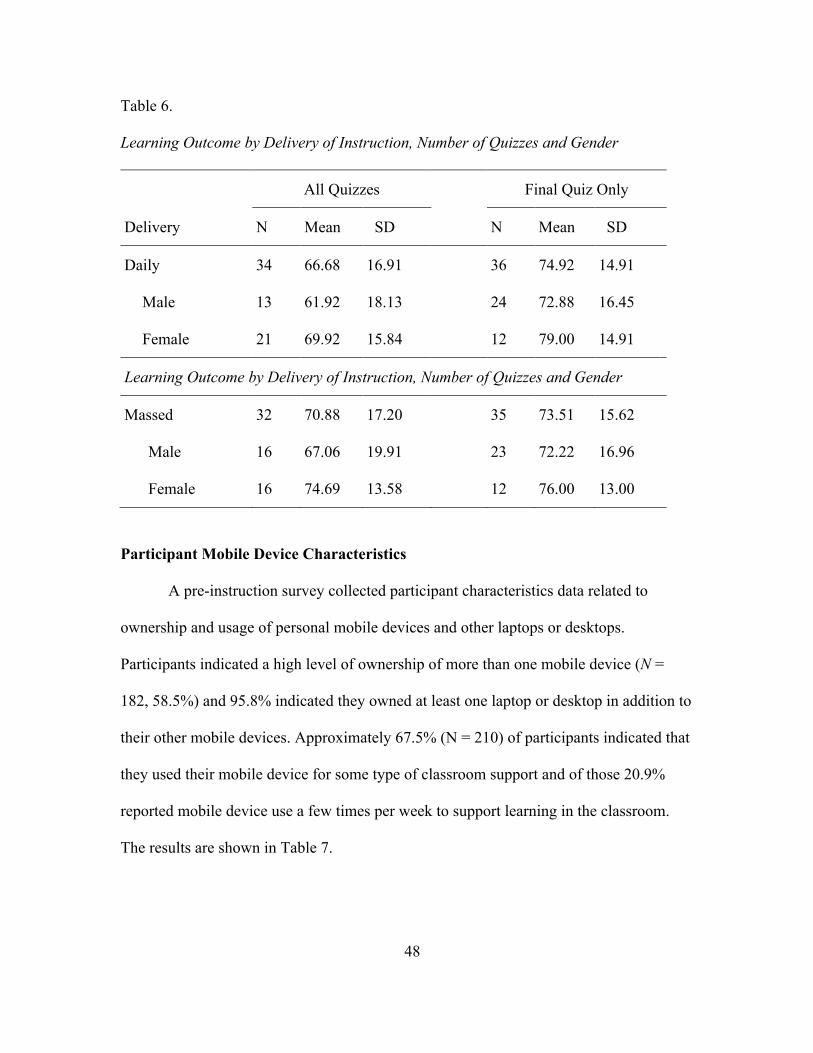
48
Table 6.
Learning Outcome by Delivery of Instruction, Number of Quizzes and Gender
All Quizzes Final Quiz Only
Delivery N Mean SD N Mean SD
Daily 34 66.68 16.91 36 74.92 14.91
Male 13 61.92 18.13 24 72.88 16.45
Female 21 69.92 15.84 12 79.00 14.91
Learning Outcome by Delivery of Instruction, Number of Quizzes and Gender
Massed 32 70.88 17.20 35 73.51 15.62
Male 16 67.06 19.91 23 72.22 16.96
Female 16 74.69 13.58 12 76.00 13.00
Participant Mobile Device Characteristics
A pre-instruction survey collected participant characteristics data related to
ownership and usage of personal mobile devices and other laptops or desktops.
Participants indicated a high level of ownership of more than one mobile device (N =
182, 58.5%) and 95.8% indicated they owned at least one laptop or desktop in addition to
their other mobile devices. Approximately 67.5% (N = 210) of participants indicated that
they used their mobile device for some type of classroom support and of those 20.9%
reported mobile device use a few times per week to support learning in the classroom.
The results are shown in Table 7.

49
Table 7.
Characteristics of Participant Mobile and Laptop or Desktop Device Ownership and
Usage (N = 311)
Characteristic n % Mobile device (smartphone and/or tablet) ownership 1 device 98 31.5 2 devices 182 58.5 3 devices 16 5.1 4 devices 5 1.6 Missing 10 3.2 Hours per-day of mobile device(s) use Less than 1 hour per day 7 2.3 1–3 hours per day 119 38.3 4–5 hours per day 96 30.9 6–7 hours per day 43 13.8 7 or more hours per day 36 11.6 Missing 10 3.2
Desktop or laptop ownership in addition to mobile device ownership 1 laptop or desktop 214 68.8 2 laptop or desktop 63 20.3 3 laptop or desktop 6 1.9 4 or more 15 4.8 Missing 13 4.2 Hours per-day of desktop or laptop computer use separate from mobile device use 1 hour per day 32 10.3 2–3 hours per day 113 36.3 4–5 hours per day 87 28.0 6 or more hours per day 68 21.9 Missing 11 3.5
Number of alerts, announcements, and classroom information sent to mobile devices by instructors None 97 31.2 1–3 85 27.3 4–5 67 21.5 6–7 16 5.1 8 or more 34 10.9 Missing 12 3.9

50
Characteristic n % Use of a mobile device to support learning during class Yes 210 67.5 No 89 28.6 Missing 12 3.9
Frequency of mobile device use to support learning in class A couple of times per month 90 28.9 Once per week 28 9.0 A few times per week 65 20.9 Daily 43 13.8 No or missing 85 27.3
Attitudes
Two surveys were created to explore participant attitudes about learning on
mobile devices. The pre-instruction survey (N = 301) consisted of 15 items with five-
point Likert scale range. The post-instruction survey consisted of 10 items with a five-
point Likert scale range. The post-instruction survey also included an opportunity for
participants to provide open-ended responses. Responses to both surveys ranged from Not
at all well (1) to Extremely well (5) with values in parentheses assigned to scale items for
analysis. Scale items had a high degree of reliability as determined by Cronbach’s Alpha.
Means, standard deviation, and Cronbach’s Alpha if the item is deleted are shown for
Pre-instruction survey items in Table 8 and Post-survey items in Table 9.
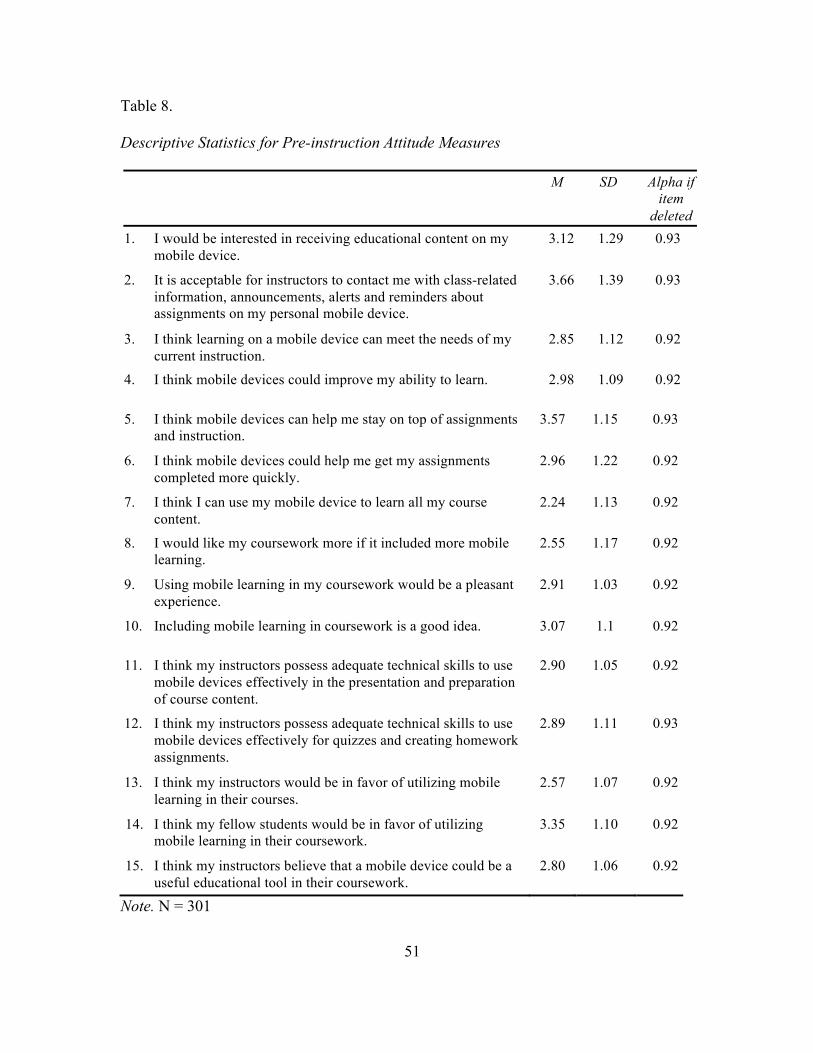
51
Table 8.
Descriptive Statistics for Pre-instruction Attitude Measures
M SD Alpha if item deleted 1. I would be interested in receiving educational content on my
mobile device. 3.12 1.29 0.93
2. It is acceptable for instructors to contact me with class-related information, announcements, alerts and reminders about assignments on my personal mobile device.
3.66 1.39 0.93
3. I think learning on a mobile device can meet the needs of my current instruction.
2.85 1.12 0.92
4. I think mobile devices could improve my ability to learn. 2.98 1.09 0.92
5. I think mobile devices can help me stay on top of assignments and instruction.
3.57 1.15 0.93
6. I think mobile devices could help me get my assignments completed more quickly.
2.96 1.22 0.92
7. I think I can use my mobile device to learn all my course content.
2.24 1.13 0.92
8. I would like my coursework more if it included more mobile learning.
2.55 1.17 0.92
9. Using mobile learning in my coursework would be a pleasant experience.
2.91 1.03 0.92
10. Including mobile learning in coursework is a good idea. 3.07 1.1 0.92
11. I think my instructors possess adequate technical skills to use mobile devices effectively in the presentation and preparation of course content.
2.90 1.05 0.92
12. I think my instructors possess adequate technical skills to use mobile devices effectively for quizzes and creating homework assignments.
2.89 1.11 0.93
13. I think my instructors would be in favor of utilizing mobile learning in their courses.
2.57 1.07 0.92
14. I think my fellow students would be in favor of utilizing mobile learning in their coursework.
3.35 1.10 0.92
15. I think my instructors believe that a mobile device could be a useful educational tool in their coursework.
2.80 1.06 0.92
Note. N = 301

52
Table 9.
Descriptive Statistics for Post-instruction Attitude Measures
M SD Alpha if item deleted
1. The degree to which you would be interested in receiving educational content on your mobile device. a
2.94 1.29 0.89
2. Your attitude about instructors contacting you on your mobile device.
3.57 1.42 0.91
3. Your attitude about how well do you think learning on a mobile device can meet your instructional needs.
2.60 1.19 0.88
4. Your attitude to which the technology used for this instruction worked on your mobile device.
3.14 1.10 0.90
5. Your belief that you have the technical skills to use your mobile device for learning.
4.12 .997 0.91
6. Your belief that accessing courses on your mobile device would be easy
3.54 1.12 0.89
7. Your belief that you would have more learning opportunities if your coursework were available on mobile devices.
2.81 1.30 0.88
8. Your belief that you would enjoy your courses more if instruction were available on mobile devices.
2.51 1.22 0.80
9. Your belief that having your instruction available on a mobile device would help you stay on track with your coursework.
2.83 1.27 0.88
10. Your belief that learning on mobile devices is the wave of the future.b
2.69 .919 0.90
Note. N = 138. a Scale 1–5: 1=not at all, 5=I would like to receive all my instruction on my mobile device b Scale 1–4: 1=not at all, 4=definitely
Analysis of Pre-instruction Attitudinal Measures. The pre-instruction survey
was used to examine student attitudes about mobile devices and to determine if there
were any underlying constructs. A principal axis factoring using Varimax (orthogonal)
rotation was employed to determine if the 15 items could be reduced and simplified. The
Kaiser-Meyer-Olkin (KMO) and Bartlett’s test of sphericity were used for sampling

53
adequacy. Kaiser-Meyer Olkin measure of sampling adequacy (KMO = .95) and
Bartlett’s test of sphericity < .001. Eigenvalues > 1 were considered for retention. Factor
1 explained 51.52% of the variance, Factor 2 explained 10.23% of the variance, and
Factor 3 explained 7.06% of the variance. Three factors were retained and are shown in
Table 10 and the scree plot is shown in Figure 9.
Table 10.
Total Variance Explained Pre-instruction Survey Items
Initial Eigenvalues Extraction Sums of Squared Rotation Sums of Squared
% of % of % of
Factor Total Variance Cum. % Total Variance Cum. % Total Variance Cum. %
1 7.727 51.516 51.516 7.727 51.516 51.516 4.768 31.785 31.785
2 1.534 10.227 61.743 1.534 10.227 61.743 3.059 20.395 52.181
3 1.058 7.056 68.799 1.058 7.056 68.799 2.493 16.618 68.799
4 0.77 5.135 73.934
5 0.661 4.406 78.34
6 0.547 3.649 81.989
7 0.472 3.144 85.134
8 0.405 2.699 87.832
9 0.367 2.444 90.277
10 0.32 2.132 92.408
11 0.291 1.937 94.345
12 0.246 1.638 95.983
13 0.23 1.533 97.516
14 0.211 1.405 98.921
15 0.162 1.079 100
Extraction Method: Principal Axis Factoring.

54
Figure 9. Scree Plot for Pre-instruction Survey.
Factor 3 was very close to one, so a Parallel Analysis using a web-based tool
created by Patil et al. (2008) re-examined the number of factors shown in Table 11. Since
the original value for the third factor (1.058) was smaller than the corrected factor mean
Eigenvalue (1.243) the third factor was not retained and the principal component analysis
was reevaluated using Varimax rotation. Results of the new orthogonal rotation show a
two-factor solution. Kaiser-Meyer Olkin measure of sampling adequacy (KMO = .93)
and Bartlett’s test of sphericity < .001. Following recommendations made based on
criteria by Hair, Anderson, Tatham, and Black (1988) a value of .40 was considered as
the minimum loading for a given item and a value of .60 was considered to load highly.
Five items loaded on both components, Q7, Q8, Q9, Q10, and Q14 (Table 12). Items

55
loading on both factors were removed, and the resulting Rotated Component Matrix
displays two factors show in Table 13.
Table 11.
Eigenvalues from Patil et al. (2008) compared to values from SPSS
Patil et. al SPSS
Factor Total Factor Total
1 1.400 1 7.73
2 1.306 2 1.53
3 1.243 3 1.06
4 1.183 4 0.77
5 1.129 5 0.66
6 1.078 6 0.55
7 1.031 7 0.47
8 0.984 8 0.41
9 0.940 9 0.37
10 0.903 10 0.32
11 0.855 11 0.29
12 0.813 12 0.25
13 0.767 13 0.23
14 0.714 14 0.21
15 0.651 15 0.16
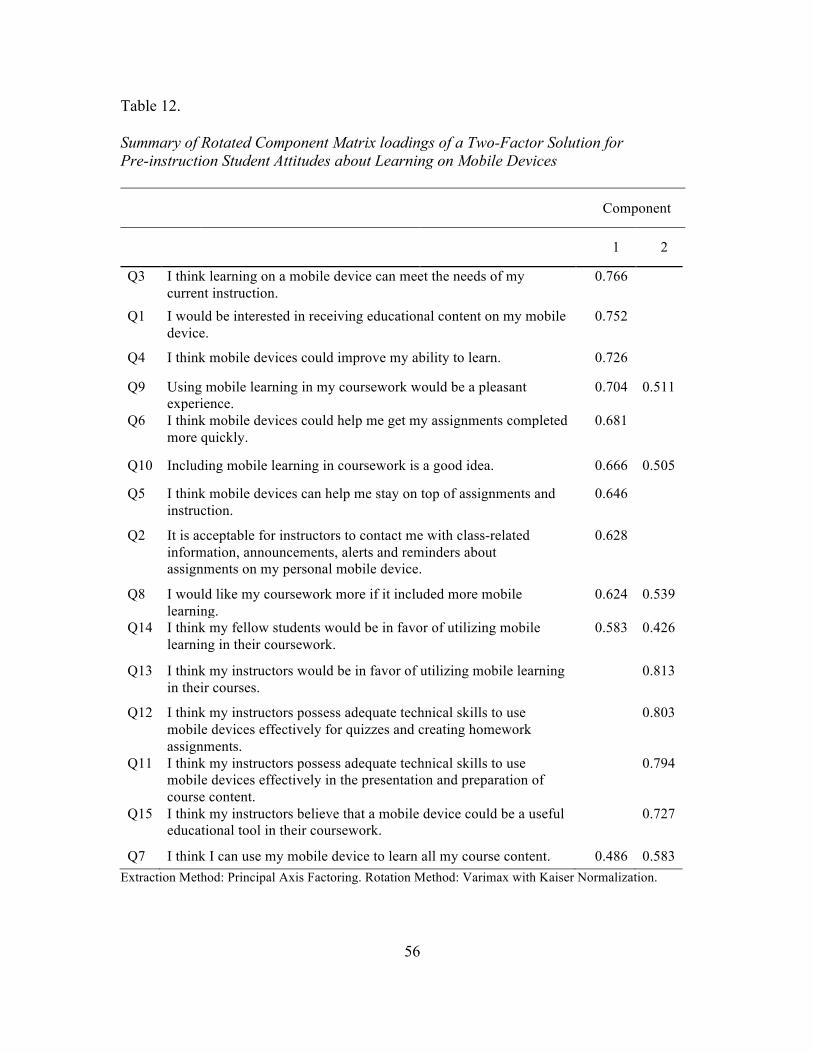
56
Table 12.
Summary of Rotated Component Matrix loadings of a Two-Factor Solution for Pre-instruction Student Attitudes about Learning on Mobile Devices
Component
1 2
Q3 I think learning on a mobile device can meet the needs of my current instruction.
0.766
Q1 I would be interested in receiving educational content on my mobile device.
0.752
Q4 I think mobile devices could improve my ability to learn. 0.726
Q9 Using mobile learning in my coursework would be a pleasant experience.
0.704 0.511
Q6 I think mobile devices could help me get my assignments completed more quickly.
0.681
Q10 Including mobile learning in coursework is a good idea. 0.666 0.505
Q5 I think mobile devices can help me stay on top of assignments and instruction.
0.646
Q2 It is acceptable for instructors to contact me with class-related information, announcements, alerts and reminders about assignments on my personal mobile device.
0.628
Q8 I would like my coursework more if it included more mobile learning.
0.624 0.539
Q14 I think my fellow students would be in favor of utilizing mobile learning in their coursework.
0.583 0.426
Q13 I think my instructors would be in favor of utilizing mobile learning in their courses.
0.813
Q12 I think my instructors possess adequate technical skills to use mobile devices effectively for quizzes and creating homework assignments.
0.803
Q11 I think my instructors possess adequate technical skills to use mobile devices effectively in the presentation and preparation of course content.
0.794
Q15 I think my instructors believe that a mobile device could be a useful educational tool in their coursework.
0.727
Q7 I think I can use my mobile device to learn all my course content. 0.486 0.583 Extraction Method: Principal Axis Factoring. Rotation Method: Varimax with Kaiser Normalization.

57
Table 13.
Component Identification for a Two-Factor Solution for Pre-Instruction Student Attitudes about Learning Mobile Devices
Component
1 2
Component 1: Student Perceptions about the use of Their Personal Mobile Devices for Learning
Q1 I would be interested in receiving educational content on my mobile device.
.769
Q3 I think learning on a mobile device can meet the needs of my current instruction.
.762
Q4 I think mobile devices could improve my ability to learn. .729 Q2 It is acceptable for instructors to contact me with class-related
information, announcements, alerts and reminders about assignments on my personal mobile device.
.684
Q6 I think mobile devices could help me get my assignments completed more quickly.
.683
Q5 I think mobile devices can help me stay on-top of assignments and instruction.
.682
Component 2: Student Perceptions about Instructors Beliefs and Mobile Devices for Learning
Q12 I think my instructors possess adequate technical skills to use mobile devices effectively for quizzes and creating homework assignments.
.833
Q11 I think my instructors possess adequate technical skills to use mobile devices effectively in the presentation and preparation of course content.
.820
Q13 I think my instructors would be in favor of utilizing mobile learning in their courses.
.816
Q15 I think my instructors believe that a mobile device could be a useful educational tool in their coursework.
.743
Extraction Method: Principal Axis Factoring. Rotation Method: Varimax with Kaiser Normalization.
The two components were labeled and a mean attitudinal score was calculated for
each factor. Factor 1, student perceptions about their own use of mobile devices in
education (M = 3.19, SD = 0.90), and Factor 2, student perceptions about their

58
instructors’ beliefs about the use of mobile devices in education (M = 2.79, SD = .89).
Gender was examined as an independent variable; Factor 1 males (N = 171, M = 3.18,
SD = .89), females (N = 130, M = 3.21, SD = .97) and Factor 2 males (N = 171, M = 2.87,
SD = .88), females N = 171, M = 2.68, SD = .89). A one-way ANOVA was conducted for
both factors based on gender and mean attitudes scores. There was no significant
interaction between genders for Factor 1 F(1, 299) = .12, MSE = .095, p = .734.
There was no significant interaction between genders for Factor 2 F(1, 299) = 3.53,
MSE = 2.78, p = .061.
Analysis of Post-instruction Attitudinal Measures. Using the same approach,
the 10 post-instruction survey items were examined (N = 140). The Kaiser-Meyer-Olkin
(KMO) and Bartlett’s test of sphericity were used for sampling adequacy. Kaiser-Meyer
Olkin measure of sampling adequacy (KMO = .92) and Bartlett’s test of sphericity
< .001. Eigenvalues > 1 were considered for retention. Only one factor had an Eigenvalue
> 1, it explained 55.30% of the variance shown in Table 14 and scree plot in Figure 10.
The component matrix could not be rotated. Using the Hair et al. (1988) criteria, one
item; Q5 Your belief that you have the technical skills to use your mobile device for
learning scored less than .40 and was removed. An additional item, Q10 Your belief that
mobile learning is the wave of the future was also removed because it used a different
scale, see Table 15.

59
Table 14.
Total Variance Explained Post-instruction Survey Items
Initial Eigenvalues Extraction Sums of Squared % of % of Factor Total Variance Cum. % Total Variance Cum. % 1 5.533 55.330 55.330 5.533 55.330 55.330 2 .986 9.859 65.189 3 .808 8.081 73.269 4 .708 7.078 80.347 5 .578 5.783 86.130 6 .417 4.166 90.296 7 .383 3.833 94.129 8 .257 2.571 96.700 9 .176 1.761 98.461 10 .154 1.539 100.000
Extraction Method: Principal Axis Factoring.
Figure 10. Scree Plot for Post-instruction Survey.

60
Table 15.
Summary of Matrix loadings of a One-Factor Solution for Post-Instruction Student Attitudes about Learning on Mobile Devices
Componenta
1
Q7 Your belief that you would have more learning opportunities if your coursework were available on mobile devices.
.907
Q3 Your attitude about how well do you think learning on a mobile device can meet your instructional needs.
.886
Q8 Your belief that you would enjoy your courses more if instruction were available on mobile devices.
.876
Q9 Your belief that having your instruction available on a mobile device would help you stay on track with your coursework.
.840
Q1 The degree to which you would be interested in receiving educational content on your mobile device.
.805
Q6 Your belief that accessing courses on your mobile device would be easy. .722 Q10 Your belief that learning on mobile devices is the wave of the future. .658 Q4 Your attitude to which the technology used for this instruction worked on
your mobile device. .640
Q2 Your attitude about instructors contacting you on your mobile device. .550 Q5 Your belief that you have the technical skills to use your mobile device for
learning. .370
Extraction Method: Principal Axis Factoring. a1 components extracted.
The two components were labeled and a mean attitudinal score was calculated for
each factor. Factor 1 Post, student perceptions about their own use of mobile devices in
education after instruction (M = 3.00, SD = 0.98). Gender was examined as an
independent variable; Factor 1 post males (N = 78, M = 3.11, SD = .92), females (N = 52,
M = 2.76, SD = 1.00). Homogeneity of variances was observed as assessed by Levene’s
test for equality of variances F = .561, p = .455. The results were not significant F(3, 93)
= .127, MSE = .130, p = .944. A one-way ANOVA was conducted based on gender and

61
mean attitudes scores. There was a significant interaction between genders F(1, 128) =
3.80, MSE = .04, p = .04.
Question 5 Post-instruction, Your belief that you have the technical skills to use
your mobile device for learning, was of particular interest because it evaluated student
self-confidence and self-belief regarding technical skills when using a mobile device. It
did not fit with the other items in creating the factor and had the highest mean score
(N = 140, MS = 4.12, SD .997). The overall self-belief score is high. Choen, Lee, Crooks,
and Song (2012) developed a conceptual model about mobile learning readiness using the
Theory of Planned Behavior with students in higher education. Using a series of videos
about mobile learning, then surveying participants, they found that students who felt that
m-learning was easy to use and useful were more likely to consider using their mobile
devices for coursework (Choen et al., 2012). Different from the Choen et. al (2012)
study, this study collected participant attitudes after an actual m-learning exercise, rather
than just reviewing videos about m-learning.
A one-way between groups ANOVA was performed comparing all four groups.
Homogeneity of variances was observed as assessed by Levene’s test for equality of
variances F = 1.032, p = .382. The results were not significant F(3, 93) = .127,
MSE = .130, p = .944.
Before conducting an ANCOVA, the homogeneity-of-slopes assumption was
tested. The interaction score for distribution of instruction and student attitudes about
their technical skills was not significant F(1, 93) = .90, MSE = 227.34, p = .35, 𝜂2 = .01.
The interaction score for number of quizzes and student attitudes about their technical
skills was not significant F(1, 93) = .65, MSE = 143.92, p = .42, 𝜂2 = .01. The null

62
hypothesis that the population slopes are homogenous was not rejected and an
ANCOVA was conducted.
A two-way ANCOVA examining the difference between the distribution of
instruction and testing on final quiz scores controlling for student attitudes about their
technical skills to use a mobile device for learning was conducted. There was a
significant effect of testing on final quiz scores after controlling for student technical
skills belief F(1, 92) = 12.76, MSE = 2850.85, p = .00, with the covariate accounting for
about 12% of the variance of the number of tests on outcome scores, controlling for
student attitudes about their technical skills, 𝜂2 = .12.
Open-Ended Survey Responses. Forty-nine open-ended survey responses were
collected. The responses are listed in Appendix H and were not codified or analyzed in
this study. Some responses were referenced anecdotally in discussions.

63
CHAPTER 5
DISCUSSION
The purpose of this study was to investigate the effects of distributed presentation
microlearning and the testing effect on mobile devices on learning outcomes in the form
of quiz scores. This study also looked at student attitudes about the use of mobile devices
for learning in higher education and their perceptions about their instructors’ beliefs
about mobile devices in higher education. The following section discusses the findings of
each research question, survey results, limitations of the study, and implications for
future research.
Findings by Research Question
Research Question 1. There is a relationship between delivery of instruction and
learning outcomes.
In educational settings students sit for hours in classrooms or online listening to
lectures. The massed presentation of information has been a foundation of instruction for
centuries. This study explored effects of distributed presentation learning as compared to
massed presentation learning.
The expected outcome, students receiving small units of instruction over a series
of days would perform better than students receiving the instruction in a massed unit, on
comprehensive quiz scores was not supported by the results. Initial results indicate there
was no significant main effect of distribution of instruction in this study. This is
contradictory to previous findings founded in educational theory (Ebbinghaus, 1913) as
early as a century ago. Recent studies also support this finding and indicate that

64
distribution of presentation of instruction (Raaijmakers, 2003; Raman et al. 2010; and
Tulving et al., 1967) was more effective than massed presentation of instruction. Son and
Simon (2012) found that across all ages and domains spacing instruction lead to better
performance than massing instruction. Many of these studies relied on sets of paired
words or sounds (Fishman et al., 1968; Peterson et al. 1962). This study departed from
the traditional word-pair association distributed over a period of time and utilized a series
of small instructional units called microlearning (Hug, 2005) as a replacement for a
comprehensive lecture. Job and Ogalo (2012) found that microlearning could be used as a
strategy to support learning and strengthen knowledge inputs.
The instruction in this study may have been too fragmented or short in duration
without association to a larger learning goal to achieve the desired results. It may have
simply been better to combine the micro units into a single learning intervention of
approximately three to five minutes. One student replied in the open-ended survey: “I felt
as though having multiple modules could be a slight nuisance. Once you got into the
lesson, it was over. Forcing you to click out and back into another. I felt this made me
lose my train of thought.”
Research Question 2. There is a relationship between the number of assessments
and learning outcomes.
As with hours-long lectures, students commonly take mid-term and final tests that
may span hours of time. Not only is testing used to ascertain knowledge gained but it can
also be used to reinforce learning. This study explored the testing effect in support of
student learning as a form of practice or rehearsal.
65
In the two-way ANOVA, the main effect of testing produced no significant
results. In a one-way ANOVA testing did produce significant results F(1, 136) = 4.01,
MSE = 1039.67, p = .047. However, the expected outcome, participants receiving quizzes
on individual units and a comprehensive quiz would perform better on the comprehensive
quiz (M = 68.71, SD = 17.05) than the participants that only received the comprehensive
quiz (M = 74.23, SD = 15.17), was not consistent with traditional research.
Rehearsal and practice were a key feature of the distributed presentation studies
(Hintzman, 1971; Raman et al. 2010). One of the foundations for this study was a study
by Johnson and Mayer (2009) in which participants were shown multimedia instruction
and had either a) practice retention in the form of watching the instruction a second time,
b) immediate rehearsal in the form of a quiz, or c) practice-transfer in the form of short
answer questions. Additionally, the study found that participants in a delayed retention
test remembered less than participants that took the immediate retention test (Johnson &
Mayer, 2009). Other studies found similar results (Carrier et al. 1992; Karpicke et al.,
2007). However, this study is also inconsistent with existing findings across all groups;
distributed presentation instruction group with all quizzes (M = 66.68, SD 2.77)
compared to the distributed presentation group with only the final quiz (M = 74.92, SD
2.69) and the massed presentation group with all quizzes (M = 70.88, SD 2.86) and the
massed presentation group with only the final quiz (M = 73.51, SD = 2.73).
One possible explanation is that participants did not view the quizzes as an
opportunity to reinforce learning. The study also had significant dropout rates. The
dropout rates in the groups that had all quizzes were high after the first quiz. This may
indicate that participants did not want to take the quizzes as part of the study. The study

66
may have been too similar to traditional schoolwork and therefore unenjoyable or
burdensome. Another possible limitation is that students in the individual modules plus
comprehensive quiz groups did not receive feedback on the individual quizzes and the
quizzes did not become a learning intervention. However, Johnson and Mayer (2009) also
did not provide feedback on answers in testing conditions.
Finally, Questions 1 and 2 were also examined in a factorial ANOVA with the
added independent variable of gender (male, female). There were no significant results.
Some of the groups were very small and analysis was not robust.
Research Question 3. There is a relationship between students’ attitudes about
using their personal mobile devices and a willingness to engage in learning on their
devices.
Smartphone and mobile device ownership and usage among people aged 18–29 is
virtually ubiquitous (Pew, 2017) and society’s dependence on smartphones to access the
internet exceeds even its’ dependence on computers for accessing the internet
(Bosomworth, 2015). This study used survey instruments to investigate participant
attitudes about using personal mobile devices for learning. Student attitudes were
moderately positive (M = 3.19, SD = 0.90) using Likert-type questions on a scale of
1 = Not at all well, to 5 = Extremely well. Two components emerged from the
exploratory factor analysis of pre-instruction survey items. The first component related to
students’ perceptions about using their personal mobile devices for learning which
indicated moderate to high positive loadings on five items.

67
This finding is consistent with Sung and Mayer (2013) who found that students’
attitudes about using mobile media in an instructional study were significantly more
positive than students using desktop computers.
Post-instruction participant survey attitudes were slightly less positive about the
use of mobile devices for instruction (M = 3.00, SD = 0.98). A one-way ANOVA was
conducted based on gender and mean attitudes scores for the post-instruction survey
finding a significant interaction between genders F(1, 128) = 4.128, MSE = 3.80, p = .04.
The groups were unequal, but the scores between genders, male (N = 78, M = 3.11,
SD = .92) and females (N = 52, M = 2.76, SD = 1.00) indicate that males had a slightly
more positive attitude about learning on mobile devices after instruction.
The post-instruction decrease in positive attitudes about using a personal mobile
device for learning after instruction could be due to participants’ dislike of the
Blackboard mobile app. In an open-ended response one participant wrote, “My primary
issue is Blackboard’s software, which is generally bad.” Another participant commented,
“Blackboard has a horrible app.”
Research Question 4. There is a relationship between students’ beliefs about
their technical abilities to use mobile devices and their willingness to engage in learning
on mobile devices.
Although participants in the post-instruction survey showed a slight decrease in
attitude about using mobile devices for learning, participant beliefs about their skills to
use mobile devices was high (N = 140, MS = 4.12, SD .997) indicating strong self-
confidence about technical skills. In their study about college students’ intentions to use
mobile devices for learning, Cheon et al. (2012) found that attitudes about perceived ease
68
of use and self-ability to use mobile devices contributed to a willingness to use mobile
devices for learning.
A two-way ANCOVA examining the difference between distribution of
instruction and testing on final quiz scores controlling for student attitudes about their
own technical skills to use a mobile device for learning was conducted. There was a
significant effect of testing on final quiz scores after controlling for student technical
skills belief F(1, 92) = 12.76, MSE = 2850.85, p = .00, with the covariate accounting for
about 12% of the variance of the number of tests on outcome scores, controlling for
student attitudes about their technical skills, 𝜂2 = .12. The effect size was small
participants that took the instruction but did not take the final survey further reduced the
sample size from the original participant group. No conclusive evidence can be stated.
Limitations
This study was conducted without direct physical contact between the researcher
and participants utilizing the ASU Learning Management System, Blackboard. The
version of Blackboard, 9.1, while mobile friendly, is not completely mobile native. While
students at ASU are familiar with Blackboard for classes, using Blackboard for mobile
was new to many participants. Other LMS tools may provide better mobile support and a
more App-like experience.
Although student codes of ethics were expected to be adhered to, and participants
had to sign acknowledgments of integrity, there is no way to guarantee that participants’
respected the conditions and integrity of the study. As discussed, upon review of short
answers, in at least one instance a participant copied content directly from a website.
Outcome scores used as the dependent measure for analysis may have been compromised

69
by the ability of participants to use other resources to answer questions on the
comprehensive quiz and therefore creating Type I error rates.
Study participants were very diverse representing all academic levels in higher
education and virtually all majors. Participants were randomly assigned to multiple study
dates so the study assumes no selection bias. There was a very high dropout rate of
participants from time of enrollment to time of completion so the study did experience
attrition. Athletes in recreational sports participating for community service hours had a
higher rate of completion than other groups. It is possible that peer pressure among
teammates or information sharing occurred, which could have created unreproducible
outcomes for that particular group. However, only the total number of team members
who completed the study was reported to the ASU student sports committee, not
individual names, as guaranteed by the agreement of student anonymity in the IRB. Other
participants may have been compelled to completed the study based on incentives in the
form of extra credit or remuneration in the form of Amazon gift cards.
Other issues with dropouts were the inconsistent completion of all components.
The unevenness of completion of pre-survey, instruction and quizzes, and post-survey
decreased thorough analysis of participants across all study components.
Another limitation of the study was potential technical difficulties experienced by
some participants. One group started the study on a day when a system-wide Blackboard
outage occurred. Other participants reported various technical difficulties such as the
Blackboard app hanging or not responding. Since participants used their own personal
devices for the study, it is not known if various devices utilized the most current available
operating systems or how much memory was available for the Blackboard app.

70
The study had an additional limitation based on the number of quizzes received
by some participants. Approximately half the participants received five additional quizzes
to evaluate the testing effect. The scores on the additional quizzes were not included in
the study results and feedback about the quizzes was not provided.
Potential limitations of significant results found for testing in a one-way ANOVA
F(1, 136) = 4.01, MSE = 1039.67, p = .047, include internal threats to validity in the type
of instrument used for testing and the ability of participants to utilize outside resources
for answering quiz questions.
Potential limitations of significant results found for student attitude scores in one-
way ANOVA between genders F(1, 128) = 4.128, MSE = 3.80, p = .04, include unequal
sample sizes and a small effect size.
Implications
According to the study results, distributed presentation microlearning and the
testing effect on mobile devices were not significant on learning outcomes scores. This
differs from many other studies about distributed presentation learning (Craik, F.I.M,
1970; Gates, 1917; Melton, 1970; Raaijmakers, 2003) and the testing effect (Carrier et al.
1992; Johnson et al., 2009; Karpicke et al, 2007). Implications for instruction may be that
the current method of massed instruction is appropriate for higher education and for the
dissemination of complex concepts. The use of a mobile device could be a confounding
effect in this study.
The results regarding student attitudes and usage of their personal mobile devices
for learning are in line with findings by Chen and deNoyelles (2013) and Sung and
Mayer (2013) but indicate a continued increase in positive attitudes and intentions that

71
students are receptive to using personal mobile devices for learning (Al-Emran et al.,
2016; Jeno et al., 2017; Yeap et al., 2016). While intention and action are different, the
implications for educators is that making learning content available for consumption on
personal mobile devices would be well received by students.
Development of Custom Content
This study utilized the development of custom content formatted to resemble an
app-like experience. The method is similar to the Micro Unit content created by Beutner
and Pechuel (2017) in their OPALESCE study. The development of this content required
multiple skills including: compression technology, design, illustration, interactive web
forms, mobile user experience and interaction theory, and narration and video creation.
First, each unit was storyboarded using PowerPoint, the narration was noted for
each slide in the notes section. Next, backgrounds, illustrations, and text screens were
created using Adobe Illustrator. Graphics were set up in portrait format, which is
different than the traditional video format which is landscape. A screen size of 480 pixels
tall x 320 pixels wide was selected to simulate an aspect ratio of 3:2. This screen
resolution is standard in older devices and lower than most current smartphone devices,
but preliminary tests of higher resolution content at 960 pixels tall x 640 pixels wide
resulted in large file sizes of more than 3mb. To prevent buffering files were compressed
and saved to be approximately 1mb or smaller. Each illustration and text screen was
saved as a .jpg format. The images were imported to Camtasia where they were paired
with narration to create a video. In Camtasia, the canvas size was adjusted from the
default format of 1280 pixels wide x 720 pixels tall or 720p HD to 480 pixels tall x 320
pixels wide (portrait). Once the illustrations and narration were synched in Camtasia the

72
content was split into units of approximately 30 s – 1 min and exported as an MP4 file
format with medium compression for smaller file sizes. The MP4 files were then loaded
into Blackboard using exiting tools to add videos to Blackboard content. The Blackboard
video player automatically adds minimal video controls to each video.
These skills are unique and may not be in the repertoire of most instructors or
even instructional designers. Carlson and Gadio (2002) found that while most instructors
want to integrate technology into teaching, they lack the time and technical skill to do so.
Creating professional development programs such as McKenny, Boschman, Pieters, and
Voogt’s (2016) Teacher Talk: Collaborative Design of Technology-Enhanced Learning,
is essential to improve teacher technical fluency and skills.
As newer smartphones are developed and released other considerations, including
smartphone screen sizes and resolution will be critical. Smartphones exponentially
exceed computational perform of not distant desktop and laptop computers so more
sophisticated graphics, interactions, and videos should be created to take advantage of
smartphone features. Expansion of free and easily accessible wifi will improve content
load times when no wifi connection is available and will minimize some necessity to over
compress visual content. To realize the potential of learning on smartphones, a team of
experts is needed to assist instructors with technical training skills and in the creation and
deployment of mobile ready content.
Future Research
Like e-learning in the late 1990’s, mobile learning or m-learning is emerging as a
new area of study. Instruction in higher education does not yet take advantage of the
affordances of mobile devices to promote learning. Many instructors may not have the

73
technical skills and therefore need training and support for content creation specifically
for mobile devices. Further, more research is needed to develop best practices for the type
of content suitable for learning on personal mobile devices. To utilize the affordances of
mobile devices in education additional studies about testing and user content creation
such as short-answers, possible homework assignments and collaboration with other
students to support learning should be investigated. Future research about human
interactions with mobile devices (Billinghurst et al., 2015; Hobber, 2013) for learning is
needed and should include studies about the format and presentation of content. New
paradigms may need to be developed moving content away from traditional landscape
video formats mimicking vertical App-like formats.
Conclusion
Smartphones and mobile devices of today are more powerful than many
computers of the previous decade. Mobile devices have permeated our society and are
replacing traditional laptops and desktops for the way we communicate, interact socially,
access the internet and conduct our daily activities. This study indicates that students are
skilled with their mobile devices and are receptive to using them for higher education or
are already using them to capture lecture notes, images of instruction written on black-
and whiteboards, and reminders for class. Some participants responded positively to
receiving instructional content on their mobile devices. It is now up to educational
institutions to take the next step in effectively integrating mobile devices and instruction
optimized for mobile devices in education.

74
REFERENCES
Al-Emran, Mostafa, Hatem M. Elsherif, and Khaled Shaalan. “Investigating attitudes towards the use of mobile learning in higher education.” Computers in Human Behavior 56 (2016): 93-102.
Allen, I. E., & Seaman, J. (2015). Grade level: Tracking online education in the United States. Babson Park, MA: Babson Survey Research Group. Accessed March, 10, 2015.
Alrasheedi, M., & Capretz, L. F. (2013). A meta-analysis of critical success factors affecting mobile learning. In Teaching, Assessment and Learning for Engineering (TALE), 2013 IEEE International Conference on (pp. 262–267). IEEE. Retrieved from http://ieeexplore.ieee.org/xpls/abs_all.jsp?arnumber=6654443
Arizona State University. (n.d.). Student Code of Conduct. What is Academic Integrity? Retrieved from https://provost.asu.edu/academic-integrity
Beutner, M., & Pechuel, R. (2017, March). Micro Units–A New Approach to Making Learning Truly Mobile. In Society for Information Technology & Teacher Education International Conference (pp. 744-751). Association for the Advancement of Computing in Education (AACE).
Billinghurst, S. S., & Vu, K. P. L. (2015). Touch screen gestures for web browsing tasks. Computers in Human Behavior, 53, 71-81.
Bosomworth, Danyl. "Mobile Marketing Statistics 2015." Smart Insights. Smart Insights, 22 July 2015. Web. 15 Nov. 2015.
Dahlstrom, E., Walker, J. D., & Dziuban, C. (2013). ECAR study of undergraduate students and information technology. 2013. Retrieved from http://www.csus.edu/irt/cio/strategicplanning/Documents/Undergrad-Students-and-IT-2014-Full-Report.pdf
Carlson, S., & Gadio, C. T. (2002). Teacher professional development in the use of technology. Technologies for Education, 118-132.
Carrier, M., & Pashler, H. (1992). The influence of retrieval on retention. Memory & Cognition, 20(6), 633–642.
Chen, B., & deNoyelles, A. (2013). Exploring students’ mobile learning practices in higher education. Educause Review. Retrieved from Http://www. Educause. Edu/ero/article/exploring-Students-Mobile-Learning-Practices-Higher-Education. Retrieved from http://www.educause.edu/ero/article/exploring-students-mobile-learning-practices-higher-education

75
Cheon, J., Lee, S., Crooks, S. M., & Song, J. (2012). An investigation of mobile learning readiness in higher education based on the theory of planned behavior. Computers & Education, 59(3), 1054-1064.
Clark, R. E. (2001). Learning from media: Arguments, analysis, and evidence (Vol. 1). IAP.
Clark, R. E., & Feldon, D. F. (2005). Five common but questionable principles of multimedia learning. The Cambridge Handbook of Multimedia Learning, 6.
Cohen, J. (1988). Statistical power analysis for the behavioral sciences. New York, NY: Routledge.
Craik, F. I. M. (1970). The fate of primary memory items in free recall. Journal of Verbal Learning and Verbal Behavior, 9(2), 143. Retrieved from http://login.ezproxy1.lib.asu.edu/login?url=http://search.proquest.com/docview/1297356501?accountid=4485
Ebbinghaus, H. (1913). Memory: A contribution to experimental psychology (No. 3). University Microfilms.
Gates, A. I. (1917). Recitation as a factor in memorization. Arch Psychol, 6(40), 112-121
Gikas, J., & Grant, M. M. (2013). Mobile computing devices in higher education: Student perspectives on learning with cellphones, smartphones & social media. The Internet and Higher Education, 19, 18-26.
GHRC: Lightning Characterstics. (n.d.). Retrieved from https://lightning.nsstc.nasa.gov/primer/primer2.html
Grimus, M., & Ebner, M. (2016, June). Mobile Phones and LearningPerceptions of Austrian Students aged from 11 to 14 Years. In EdMedia: World Conference on Educational Media and Technology (pp. 112-121). Association for the Advancement of Computing in Education (AACE).
Haby, J. (n.d.). WEATHER PREDICTION EDUCATION. Accessed 11 July 2016, from http://theweatherprediction.com/habyhints/286/. (n.d.).
Hair, J. F., Jr., R. E. Anderson, R. L. Tatham, and W. C. Black (1998) Multivariate Data Analysis with Readings (5th ed.). Englewood Cliffs, NJ: Prentice Hall.
Hintzman, D. L., & Block, R. A. (1970). Memory judgments and the effects of spacing. Journal of Verbal Learning and Verbal Behavior, 9(5), 561. Retrieved from http://login.ezproxy1.lib.asu.edu/login?url=http://search.proquest.com/docview/1297344047?accountid=4485

76
Hintzman, D. L., & Block, R. A. (1971). Repetition and memory: Evidence for a multiple-trace hypothesis. Journal of Experimental Psychology, 88(3), 297-306. doi:http://dx.doi.org/10.1037/h0030907
Hoober, S. (2013). How do users really hold mobile devices. Uxmatters (http://www. uxmatter. com). Published: Feburary, 18.
Hyman, J. A., Moser, M. T., & Segala, L. N. (2014). Electronic reading and digital library technologies: understanding learner expectation and usage intent for mobile learning. Educational Technology Research and Development, 62(1), 35–52. https://doi.org/10.1007/s11423-013-9330-5
Hug, T. (2005, May). Micro learning and narration. In fourth Media in Transition conference, May (pp. 6-8).
Job, M. A., & Ogalo, H. S. (n.d.). Micro Learning As Innovative Process of Knowledge Strategy. Retrieved from http://citeseerx.ist.psu.edu/viewdoc/download?doi=10.1.1.300.3139&rep=rep1&type=pdf
Jeno, L. M., Grytnes, J. A., & Vandvik, V. (2017). The effect of a mobile-application tool on biology students' motivation and achievement in species identification: A Self-Determination Theory perspective. Computers & Education, 107, 1-12.
Johnson, C.I. & Mayer, R.E. (2009). A Testing Effect with Multimedia Learning. Journal of Educational Psychology, 101(3), 621-629.
Karpicke, J. D., & Roediger, H. L. (2007). Expanding retrieval practice promotes short-term retention, but equally spaced retrieval enhances long-term retention. Journal of Experimental Psychology: Learning, Memory, and Cognition, 33(4), 704–719. http://doi.org/10.1037/0278-7393.33.4.704
Mayer, R. E. (2002). Multimedia learning. Psychology of learning and motivation, 41, 85-139.
McDaniel, M. A., & Fisher, R. P. (1991). Tests and test feedback as learning sources. Contemporary Educational Psychology, 16(2), 192–201.
McKenney, S., Boschman, F., Pieters, J., & Voogt, J. (2016). Collaborative Design of Technology-Enhanced Learning: What can We Learn from Teacher Talk?. TechTrends, 60(4), 385-391.
Margaryan, A., Littlejohn, A., & Vojt, G. (2011). Are digital natives a myth or reality? University students’ use of digital technologies. Computers & Education, 56(2), 429–440. http://doi.org/10.1016/j.compedu.2010.09.004

77
Mayer, R. E., Heiser, J., & Lonn, S. (2001). Cognitive constraints on multimedia learning: When presenting more material results in less understanding. Journal of Educational Psychology, 93(1), 187–198. http://doi.org/10.1037//0022-0663.93.1.187
Melton, A. W. (1970). The situation with respect to the spacing of repetitions and memory. Journal of Verbal Learning and Verbal Behavior, 9(5), 596. Retrieved from http://login.ezproxy1.lib.asu.edu/login?url=http://search.proquest.com/docview/1297344232?accountid=4485
Miller, C., & Doering, A. (2014). The new landscape of mobile learning: Redesigning education in an app-based world. Routledge.
Miller, G. A. (1956). The magical number seven, plus or minus two: some limits on our capacity for processing information. Psychological review, 63(2), 81.
Meishar-Tal, Hagit, and Miky Ronen. "Experiencing mobile game and its impact on teachers' attitude towards mobile learning." Proceeding of ML2016, Vilamoura, Portugal, April (2016): 35-42.
Multiple Choice Quiz. (n.d.). Retrieved September 27, 2015, from http://highered.mheducation.com/sites/0073659630/student_view0/chapter11/multiple_choice_quiz.html (n.d.). Retrieved November 15, 2015, from https://en.wikipedia.org/wiki/Lightning
Nielsen, J., and Molich, R. (1990). Heuristic evaluation of user interfaces, Proc. ACM CHI'90 Conf. (Seattle, WA, 1-5 April), 249-256.
NOAA 2016, Lightning Safety Tips and Resources, National Weather Service, MD,USA, accessed 15 August 2016, <http://www.lightningsafety.noaa.gov/>.
O’Bannon, B. W., & Thomas, K. (2014). Teacher perceptions of using mobile phones in the classroom: Age matters! Computers & Education, 74, 15–25. http://doi.org/10.1016/j.compedu.2014.01.006
Patil, Vivek H., Surendra N. Singh, Sanjay Mishra,and D. Todd Donavan (2007),“Parallel Analysis Engine to Aid Determining Number of Factors to Retain” [Computer software]. Available from http://smishra.faculty.ku.edu/parallelengine.htm; Utility developed as part of Patil, Vivek H., Surendra N. Singh, Sanjay Mishra, and Todd Donovan (2008), “Efficient Theory Development and Factor Retention Criteria: A Case for Abandoning the ‘Eigenvalue Greater Than One’ Criterion,” Journal of Business Research, 61 (2), 162-170.
Peterson, L., & Peterson, M. J. (1959). Short-term retention of individual verbal items. Journal of Experimental Psychology, 58(3), 193.
78
Peterson, L. R., Saltzman, D., Hillner, K., & Land, V. (1962). Recency and frequency in paired-associate learning. Journal of Experimental Psychology, 63(4), 396-403. doi:http://dx.doi.org/10.1037/h0043571
Peterson, L. R., Wampler, R., Kirkpatrick, M., & Saltzman, D. (1963). Effect of spacing presentations on retention of a paired associate over short intervals. Journal of Experimental Psychology, 66(2), 206-209. doi:http://dx.doi.org/10.1037/h0046694
Prensky, M. (2005). Computer games and learning: Digital game-based learning. Handbook of Computer Game Studies, 18, 97–122.
Raaijmakers, J. (2003). Spacing and repetition effects in human memory: application of the SAM model. Cognitive Science, 27(3), 431–452. http://doi.org/10.1016/S0364-0213(03)00007-7
Raman, M., Mclaughlin, K., Violato, C., Rostom, A., Allard, J., & Coderre, S. (2010). Teaching in small portions dispersed over time enhances long-term knowledge retention. Medical Teacher, 32(3), 250–255. http://doi.org/10.3109/01421590903197019
Roediger, H. L., & Karpicke, J. D. (2006). Test-enhanced learning taking memory tests improves long-term retention. Psychological Science, 17(3), 249–255.
Smith, A. (2017, January 12). Record shares of Americans now own smartphones, have home broadband. Retrieved April 01, 2017, from http://www.pewresearch.org/fact-tank/2017/01/12/evolution-of-technology/
Son, L. K., & Simon, D. A. (2012). Distributed Learning: Data, Metacognition, and Educational Implications. Educational Psychology Review, 24(3), 379–399. http://doi.org/10.1007/s10648-012-9206-y
Sweller, J. (1988). Cognitive load during problem solving: Effects on learning. Cognitive science, 12(2), 257-285.
Thomas, K., & Muñoz, M. A. (2016). Hold the Phone! High School Students' Perceptions of Mobile Phone Integration in the Classroom. American Secondary Education, 44(3), 19.
Traxler, J. (2005). Mobile learning – it’s here but what is it? Interactions, 9(1). Retrieved from http://www2.warwick.ac.uk/services/ldc/resource/interactions/archive/issue25/traxler
Traxler, J. (2010). Distance education and mobile learning: Catching up, taking stock. Distance Education, 31(2), 129–138. http://doi.org/10.1080/01587919.2010.503362

79
Tulving, E. (1967). The effects of presentation and recall of material in free-recall learning. Journal of Verbal Learning and Verbal Behavior, 6(2), 175. Retrieved from http://login.ezproxy1.lib.asu.edu/login?url=http://search.proquest.com/docview/1297340611?accountid=4485
Whitten, W. B., & Bjork, R. A. (1977). Learning from tests: Effects of spacing. Journal of Verbal Learning and Verbal Behavior, 16(4), 465. Retrieved from http://login.ezproxy1.lib.asu.edu/login?url=http://search.proquest.com/docview/1297338409?accountid=4485
Woodward, A. E., Bjork, R. A., & Jongeward, R. H. (1973). Recall and recognition as a function of primary rehearsal. Journal of Verbal Learning and Verbal Behavior, 12(6), 608. Retrieved from http://login.ezproxy1.lib.asu.edu/login?url=http://search.proquest.com/docview/1297353627?accountid=4485
Wojcikowski, K., & Kirk, L. (2013). Immediate detailed feedback to test-enhanced learning: An effective online educational tool. Medical Teacher, 35(11), 915–919. http://doi.org/10.3109/0142159X.2013.826793
Wroblewski, L. (2012). Responsive navigation: Optimizing for touch across devices. LukeW Ideation+ Design.
Yeap, J. A., Ramayah, T., & Soto-Acosta, P. (2016). Factors propelling the adoption of m-learning among students in higher education. Electronic Markets, 26(4), 323-338.

80
APPENDIX A
CONSENT FORM

81
Learning on Mobile devices consent form Microlearning with Mobile Devices: Effects of Distributed Presentation and the Testing Effect About this project Thank you for your interest in this research project. The expected effort for this research project is approximately 30-45 minutes total, over the course of five weekdays, approximately 5-7 minutes per day, starting on Monday and ending on Friday. The research project consists of these components: 1. A pre-instructional survey - 26 questions 2. 5 audio/video modules of learning content. Each module consists of 4 – 6
microlearning episodes of approximately 30 seconds to one minute in length. 3. Accompanying quizzes. 4. Final quiz, 10 question. 5. Final survey, 10 questions. What you will need to participate in this study 1. An Android or Apple iOS smartphone. This research project is specifically designed
to be completed entirely on a smartphone. 2. The Blackboard App available through Apple iTunes or Google Play. 3. An ASU email address. 4. A wifi connection. Letter of consent Dear Participant,
My name is Elaine Rettger, I am a doctoral candidate in the Educational Technology and Instructional Design program in the Mary Lou Fulton College of Education at Arizona State University.
You must be 18 years of age or older to participate, and have access to a smartphone. You will be asked to download the Blackboard app to your phone.
The purpose of this research project is to investigate learning and testing on smartphones in an effort to improve educational support, curriculum development and best practices for using smartphones in higher education.
You will receive five distributed presentation micro learning modules over a one-week period. Each module will be accompanied by a quiz. You will receive a final quiz covering the content of all modules after the last module is completed. You will also be asked to fill out a pre- and post- survey.
Your participation will take approximately 30-45 minutes total, to complete. You are free to decide whether you wish to participate in this study. If you start the study but change your mind you are free to leave the research at any time without consequence.
I cannot promise any benefits to you or others from your taking part in this research. However, possible benefits include improved understanding of smartphones in education and policies that could benefit future students as a result of information gathered in this research project.

82
Your responses will be confidential. Quiz results from the application and your responses to the surveys will be collected for data analysis. All information will be collected through the ASU Blackboard Learning Management System. All data will be stored on a secure computer. You will be assigned a randomized ID, and any personal identifying information will be stripped from the data collected. The results of this study may be used in reports, presentations or publications but your name and personal information will not be used.
If you have any questions or concerns about this study or your participation in this study, please call me at 480-965-7906 or email me at [email protected] or the Principal Investigator at Dr. Gary Bitter [email protected].
This research has been reviewed and approved by the Social Behavioral IRB, STUDY00003713. You may talk to them at 480-965-6788 or by email at [email protected] if:
• Your questions, concerns, or complaints are not being answered by the research team.
• You cannot reach the research team. • You want to talk to someone besides the research team. • You have questions about your rights as a research participant. • You want to get information or provide input about this research.
By agreeing to this study, you agree to only use the instruction and resources found in the content area provided. No outside sources such as the google, bing or other websites, should be used for completion of instruction and quizzes in this study. Sincerely, Elaine Rettger Please enter your full name ________________________________________________________________________ If you are a member of an ASU Sport team, please indicate your team affiliation so that your team receives credit for your participation. ________________________________________________________________________ If you are participating for extra credit, please indicate your professor's name. ________________________________________________________________________ Thank you for completing the consent form. Please take the pre-instructional survey and be prepared to begin the study.

83
APPENDIX B
BLACKBOARD LMS DAILY ANNOUNCEMENTS TO PARTICIPANTS
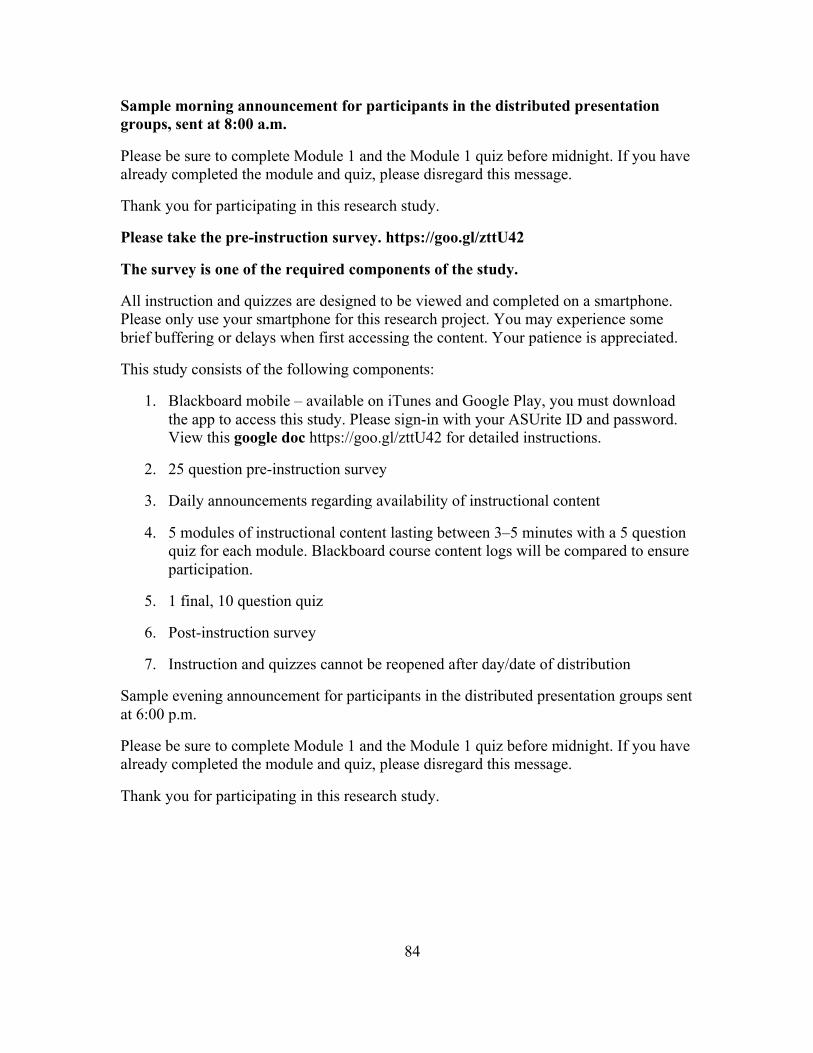
84
Sample morning announcement for participants in the distributed presentation groups, sent at 8:00 a.m.
Please be sure to complete Module 1 and the Module 1 quiz before midnight. If you have already completed the module and quiz, please disregard this message.
Thank you for participating in this research study.
Please take the pre-instruction survey. https://goo.gl/zttU42
The survey is one of the required components of the study.
All instruction and quizzes are designed to be viewed and completed on a smartphone. Please only use your smartphone for this research project. You may experience some brief buffering or delays when first accessing the content. Your patience is appreciated.
This study consists of the following components:
1. Blackboard mobile – available on iTunes and Google Play, you must download the app to access this study. Please sign-in with your ASUrite ID and password. View this google doc https://goo.gl/zttU42 for detailed instructions.
2. 25 question pre-instruction survey
3. Daily announcements regarding availability of instructional content
4. 5 modules of instructional content lasting between 3–5 minutes with a 5 question quiz for each module. Blackboard course content logs will be compared to ensure participation.
5. 1 final, 10 question quiz
6. Post-instruction survey
7. Instruction and quizzes cannot be reopened after day/date of distribution
Sample evening announcement for participants in the distributed presentation groups sent at 6:00 p.m.
Please be sure to complete Module 1 and the Module 1 quiz before midnight. If you have already completed the module and quiz, please disregard this message.
Thank you for participating in this research study.

85
Sample daily announcement for participants in the massed distributed presentations send daily at 8:00 a.m.
Thank you for participating in this research study.
Please take the pre-instruction survey. https://goo.gl/zttU42 The survey is one of the required components of the study.
All instruction and quizzes are designed to be viewed and completed on a smartphone. Please only use your smartphone for this research project. You may experience some brief buffering or delays when first accessing the content. Your patience is appreciated.
All modules, module quizzes and the final quiz must be completed by midnight, Friday.
This study consists of the following components:
1. Blackboard mobile – available on iTunes and Google Play, you must download the app to access this study. Please sign-in with your ASUrite ID and password. View this google doc https://goo.gl/zttU42 for detailed instructions.
2. 25 question pre-instruction survey
3. Daily announcements regarding availability of instructional content
4. 5 modules of instructional content lasting between 3–5 minutes with a 5 question quiz for each module. Blackboard course content logs will be compared to ensure participation.
5. 1 final, 10 question quiz
6. Post-instruction survey
7. Instruction and quizzes cannot be reopened after midnight, Friday.

86
APPENDIX C
TECHNICAL JOB AID FOR THE BLACKBOARD APP

87
Dear student,
Thank you for your interest in participating in my research project. You will receive five modules about lightning. The modules are audio and video and are designed to be viewed exclusively on your smartphone. Please use headphones or turn on your speakers. Please respect the conditions of this study and only view and complete the learning content and quizzes on your smartphone.
This study has been tested with a pilot group and the content performs on both Android and iOS devices. This study has not been tested on a Windows phone.
Participants will be enrolled in one of four different conditions. All content is the same across conditions. Each study group starts on a Monday and ends on a Friday.
Study consists of:
1. A consent form. https://goo.gl/g5ZPrg You must be 18 years of age or older to participate.
2. A pre-instruction survey. https://goo.gl/k5rzVN
3. Blackboard daily announcements letting students know that they are participating in a study and that information is available.
4. Instructional modules daily; approximately 3 – 5 minutes of audio and video content about lightning. You will need to plug in your headphones, the audio does not work well with bluetooth headphones.
5. A quiz after each module; 5 questions
6. A final quiz; 10 questions
7. A final survey. https://goo.gl/nJc74h
Please attempt to answer questions to the best of your ability and answer all questions without accessing other resources, such as the internet.
Students will need a wifi connection and the Blackboard app.
Below are screen captures and instructions about how to participate.

88

89

90
APPENDIX D
PRE-SURVEY QUESTIONNAIRE

91
Thank you for participating in this survey. All survey data will be stripped of any identification after surveys are matched with completed experiments. Participant information is collected only so that participants can receive credit or community service hours. All identification will also be removed from all experimental conditions. For the purpose of this survey a mobile device is considered a smartphone or tablet. This survey consists of 25 questions; 10 demographic questions and 15 attitudinal questions. The entire survey will take approximately 5–7 minutes to complete.
Demographic questions
1. Please indicate your age a. 18–20 b. 21–24 c. 25–30 d. 25–30
2. Please indicate current academic status a. Freshman b. Sophomore c. Junior d. Senior e. Graduate student
3. Please indicate which type of smartphone or mobile device (tablet) you own – select all that apply.
a. Apple iOS b. Android c. Windows d. Blackberry
4. How many mobile devices (smartphone and/or tablet) how many do you own? E.g., smartphone and tablet = 2
a. 2 b. 3 c. 4 d. 5 or more
5. Approximately how many hours per-day do you use your mobile device(s) a. Less than 1 b. 1–3 c. 4–5 d. 6–7 e. more than 7
6. If you also have a desktop or laptop computer, please indicate how many? a. 1 b. 2 c. 3 d. 4 or more
92
7. How many hours per-day do you use your desktop or laptop computer(s) separate from your mobile device usage?
a. 1 b. 2–3 c. 4–5 d. 6 or more
8. In how many of your classes at ASU have instructors sent classroom information, alerts, announcements or notifications to your mobile device(s)?
a. None b. 1–3 c. 4–5 d. 6–7 e. 8 or more
9. Do you use a mobile device to support learning during class? E.g., to record lectures, take notes, or photos of classroom materials that your instructor writes on a black- or whiteboard?
a. Yes b. No
10. If you indicated yes to question 9, how often do you use your mobile device to support learning in class?
a. A couple of times per month b. Once per week c. A few times per week d. Daily
11. Please indicate your gender a. Female b. Male c. Prefer not to say
12. Please indicate your current area of study a. Open-ended
Attitudinal questions
Attitudes about learning on mobile devices
Adapted from: An investigation of mobile learning readiness in higher education based on the theory of planned behavior. Cheon, J., Lee, S., Crooks, S. M., & Song, J. (2012).
1. I would be interested in receiving educational content on my mobile device. a. Not at all b. Once or twice per semester c. Once per month d. Weekly e. I would like to receive all my instruction on my mobile device.
2. It is acceptable for instructors to contact me with class related information, announcements, alerts and reminders about assignments on my personal mobile device.

93
a. No, it’s private, I do not want my instructors contacting me on my mobile device at all
b. Once or twice per semester c. I would like monthly communication from my instructor about
assignments and classroom updates d. I would like my instructor to contact me weekly with classroom updates e. My instructors are free to contact me anytime on my mobile device
3. I think learning on a mobile device can meet the needs of my current instruction. a. Not at all well b. Slightly well c. Moderately well d. Very well e. Extremely well
4. I think mobile devices could improve my ability to learn. a. Not at all well b. Slightly well c. Moderately well d. Very well e. Extremely well
5. I think mobile devices can help me stay on-top of assignments and instruction. a. Not at all well b. Slightly well c. Moderately well d. Very well e. Extremely well
6. I think mobile devices could help me get my assignments completed more quickly.
a. Not at all well b. Slightly well c. Moderately well d. Very well e. Extremely well
7. I think I can use my mobile device to learn all my course content. a. Not at all well b. Slightly well c. Moderately well d. Very well e. Extremely well
8. I would like my coursework more if it included more mobile learning. a. Not at all well b. Slightly well c. Moderately well d. Very well e. Extremely well
9. Using mobile learning in my coursework would be a pleasant experience. a. Not at all pleasant

94
b. Slightly pleasant c. Moderately pleasant d. Very pleasant e. Extremely
10. Including mobile learning in coursework is a good idea. a. Not at all b. Slightly good idea c. Moderately good idea d. A good idea e. Extremely good idea
11. I think my instructors possess adequate technical skills to use mobile devices effectively in the presentation and preparation of course content.
a. Not at all well b. Slightly well c. Moderately well d. Very well e. Extremely well
12. I think my instructors possess adequate technical skills to use mobile devices effectively for quizzes and creating homework assignments.
a. Not at all b. Slightly well c. Moderately well d. Very well e. Extremely well
13. I think my instructors would be in favor of utilizing mobile learning in their courses.
a. Not at all b. Slightly well c. Moderately well d. Very well e. Extremely well
14. I think my fellow students would be in favor of utilizing mobile learning in their coursework.
a. Not at all well b. Slightly well c. Moderately well d. Very well e. Extremely well
15. I think my instructors believe that a mobile device could be a useful educational tool in their coursework.
a. Not at all b. Slightly well c. Moderately well d. Very well e. Extremely well

95
APPENDIX E
TEXT PASSAGES AND SAMPLE SCREENS FOR MICROLEARNING
MOBILE MODULES

96
Lightning Instruction Modules Approximately 5-minutes in length with 4-5 question quiz for each module. Average narration of approximately 100 words per minute for instruction. Each module consists of 300 – 500 words. Introduction: Narrative:
Thank you for participating in this study about learning on mobile devices. Your input will be valuable to the development of mobile learning content and creation and may provide new opportunities for instruction in academic settings. Module 1 – Lightning overview Narrative:
Let’s talk about lightning.
Lightning is one of the oldest observed natural phenomena on earth, but it is also one of the most misunderstood. Simply put, lightning is a spark of electricity in the atmosphere between clouds, the air, or the ground. Lightning can be seen in volcanic eruptions, extremely intense forest fires, surface nuclear detonations, heavy snowstorms, in large hurricanes, and of course, in thunderstorms.
A thunderstorm is defined as convection that has at least one stroke of lightning that produces audible thunder.
At any given time there may be as many as 2,000 thunderstorms occurring across the earth. NASA satellite research indicates that these storms produce lightning flashes about 40 times per second, worldwide. This translates to more than 14.5 million storms and 1.4 billion lightning flashes each year. The National Weather Service estimates that lightning strikes the ground more than 25 million times each year in the United States.
Although lightning is the second highest cause of weather-related deaths in the US, fortunately on average, there are only about 50 lightning fatalities per year, in the United States. The chance of an average person in the US being struck by lightning in a given year is estimated at 1 in 960,000.
Lightning strikes can injure humans in several different ways: Direct
o Direct strike – the person is part of the flash channel. Enormous quantities of energy pass through the body very quickly and this can result in internal burns and organ damage, explosions of flesh and bone, and a damaged nervous system. Depending on the flash strength and access to medical services, it may be instantaneously fatal or cause permanent injuries and impairments.
o Contact injury – the person was touching an object, generally a conductor, that is electrified by the strike.
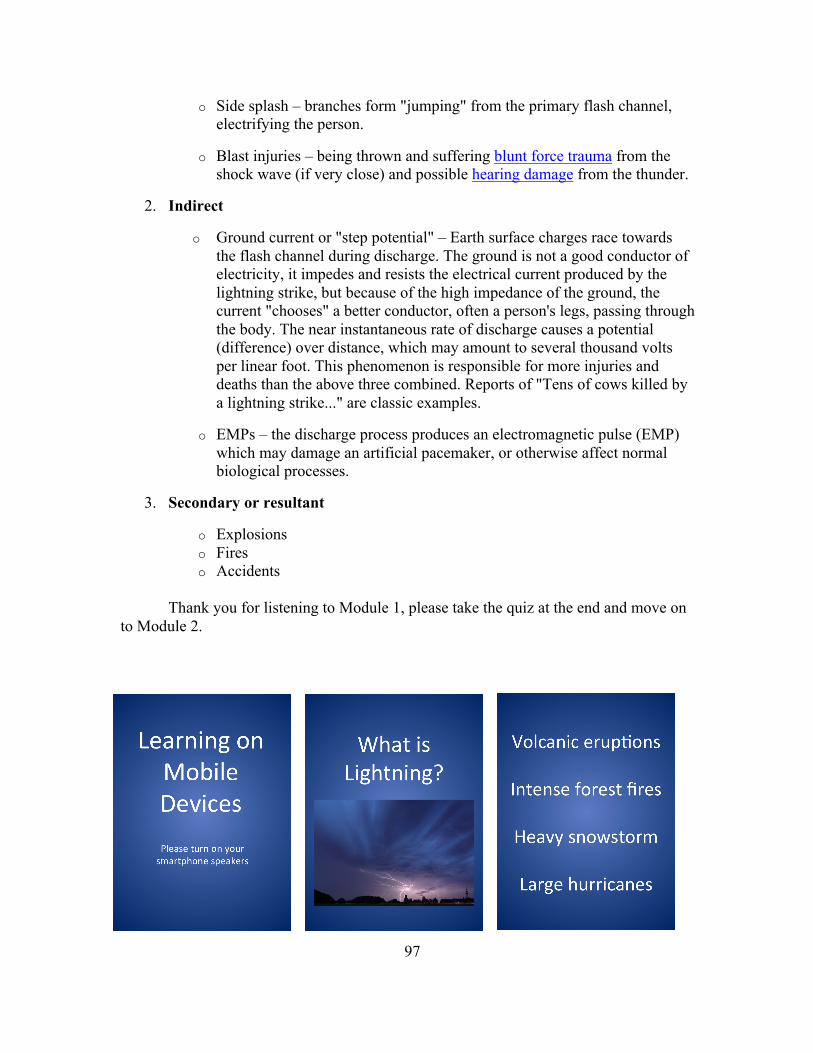
97
o Side splash – branches form "jumping" from the primary flash channel, electrifying the person.
o Blast injuries – being thrown and suffering blunt force trauma from the shock wave (if very close) and possible hearing damage from the thunder.
2. Indirect
o Ground current or "step potential" – Earth surface charges race towards the flash channel during discharge. The ground is not a good conductor of electricity, it impedes and resists the electrical current produced by the lightning strike, but because of the high impedance of the ground, the current "chooses" a better conductor, often a person's legs, passing through the body. The near instantaneous rate of discharge causes a potential (difference) over distance, which may amount to several thousand volts per linear foot. This phenomenon is responsible for more injuries and deaths than the above three combined. Reports of "Tens of cows killed by a lightning strike..." are classic examples.
o EMPs – the discharge process produces an electromagnetic pulse (EMP) which may damage an artificial pacemaker, or otherwise affect normal biological processes.
3. Secondary or resultant
o Explosions o Fires o Accidents
Thank you for listening to Module 1, please take the quiz at the end and move on
to Module 2.

98
Module 2 – Thunderstorm Formation Narrative:
Welcome to Module 2. Module 2 discusses the necessary ingredients for the formation of thunderstorms and lightning.
Thunderstorms provide the environment needed for lighting. Thunderstorms are very unstable systems. When a thunderstorm is created updrafts and downdrafts of air occur regularly and within close proximity. All thunderstorms require three ingredients for their formation:
• Moisture • Instability, and • A lifting mechanism
Moisture Moisture in the atmosphere comes from large bodies of water such as the ocean or
gulfs. The temperature of the water is also a factor in how much moisture is in the atmosphere. Evaporation is higher in warm ocean currents and therefore more moisture is released into the atmosphere. The warm Atlantic Ocean currents off the southeastern U.S. produce more moisture than the cool Pacific Ocean currents off the southwestern coast near Southern California. This helps explain why there is more rain in Florida than Southern California.

99
Instability To be unstable air must continue to rise if pushed upwards or continue sink if
pushed downwards. Unstable air masses have warm moist air near the earth’s surface and cold dry air above. If warm moist air continues to rise it will cool and some of the water vapor will condense forming clouds that are thunderstorms. Lift
The third element for thunderstorm creation is lift. Lift is the mechanism that moves air upward or downward. Lift is created from different air densities interacting. Warmer less dense air rises and cooler denser air sinks. Some of the sun’s heating of the earth’s surface is transferred to the air creating different air densities. Things that can cause differences in the warming of air are:
1. Landmasses 2. Bodies of water that tend to heat slower than landmasses 3. Dark surfaces like pavement also cause a difference in the warming of air, dark
surfaces absorb more light – since light is energy, the light absorbed by dark surfaces is emitted as heat
Thank you for listening to Module 2, please take the quiz at the end and move on to Module 3.

100
Module 3 – How lightning is formed in thunderstorms Narrative:
Welcome to Module 3. Module 3 discusses lightning formation in thunderstorms.
As the ice particles within a cloud (called hydrometeors) grow and interact they collide, fracture and break apart forming lightning. It is thought that the smaller particles tend to acquire positive charge, while the larger particles acquire more negative charge.
The smaller positively charged particles tend to rise while the larger negatively charged particles gravitate toward the bottom of clouds.
These particles tend to separate under the influences of updrafts and gravity until the upper portion of the cloud acquires a net positive charge and the lower portion of the cloud becomes negatively charged.
This separation of charge produces enormous electrical potential both within the cloud and between the cloud and ground. This can amount to millions of volts, and eventually the electrical resistance in the air breaks down and a flash begins. Lightning, then, sudden electrostatic discharge between positive and negative regions of a thunderstorm.
A lightning flash is composed of a series of strokes with an average of about four strokes per flash. The length and duration of each lightning stroke vary, but typically average about 30 microseconds. (The average peak power per stroke is about 1012 watts.)
The charged regions in the atmosphere temporarily equalize themselves through this discharge referred to as a strike. The discharge is considered a strike if it hits an object on the ground.
Although lightning is always accompanied by the sound of thunder, distant lightning may be seen but be too far away for the thunder to be heard.
Lightning does not always escape to the ground. Lighting can form
• intra-cloud lightning or IC which is lightning that stays within the cloud, • cloud to cloud lightning or CC which is lightning between two clouds,
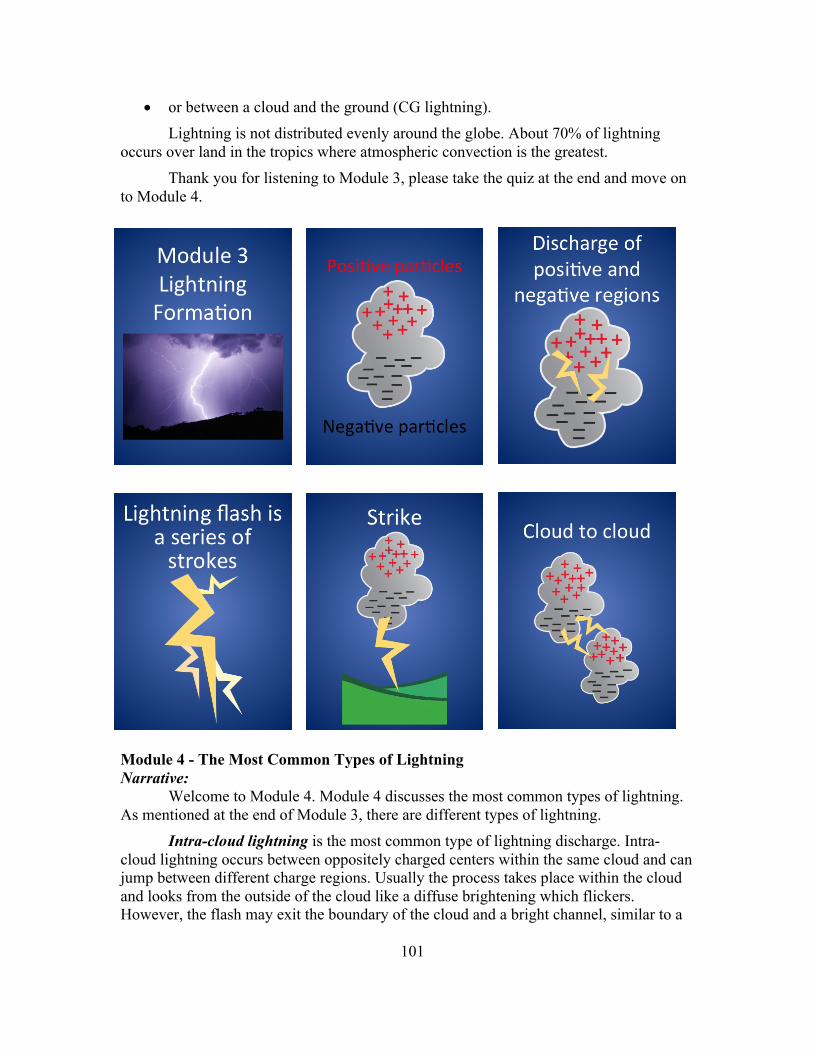
101
• or between a cloud and the ground (CG lightning). Lightning is not distributed evenly around the globe. About 70% of lightning
occurs over land in the tropics where atmospheric convection is the greatest. Thank you for listening to Module 3, please take the quiz at the end and move on
to Module 4.
Module 4 - The Most Common Types of Lightning Narrative:
Welcome to Module 4. Module 4 discusses the most common types of lightning. As mentioned at the end of Module 3, there are different types of lightning.
Intra-cloud lightning is the most common type of lightning discharge. Intra-cloud lightning occurs between oppositely charged centers within the same cloud and can jump between different charge regions. Usually the process takes place within the cloud and looks from the outside of the cloud like a diffuse brightening which flickers. However, the flash may exit the boundary of the cloud and a bright channel, similar to a
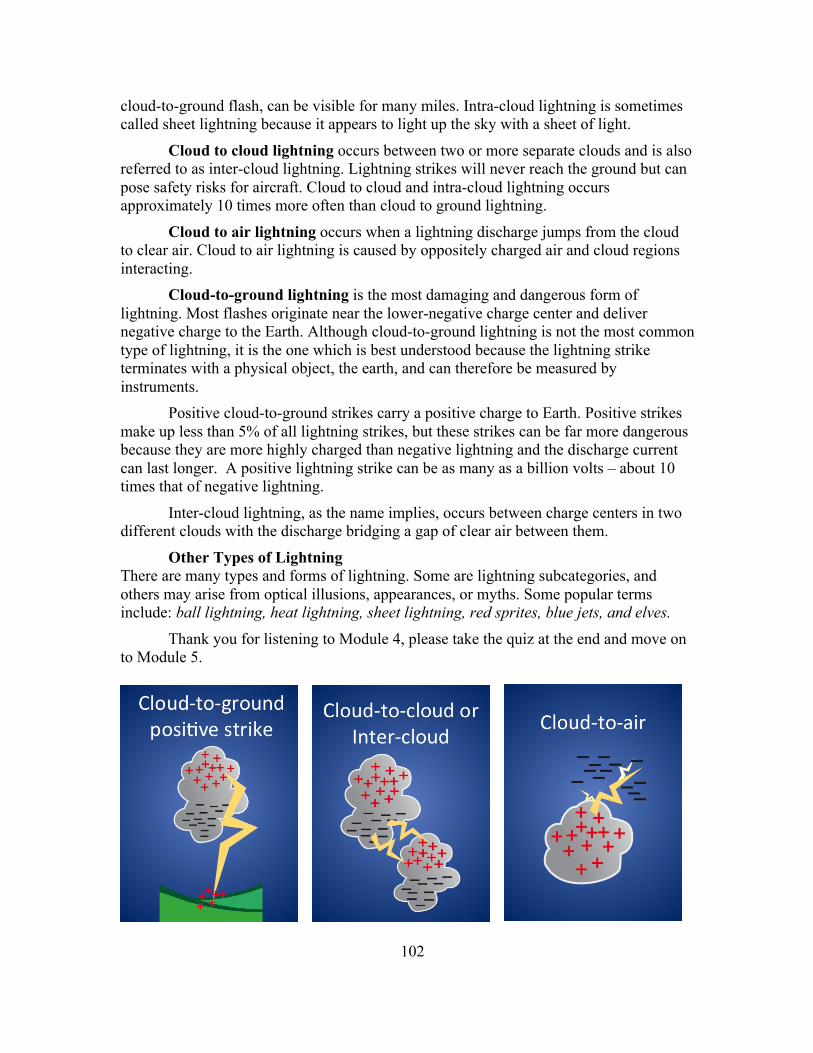
102
cloud-to-ground flash, can be visible for many miles. Intra-cloud lightning is sometimes called sheet lightning because it appears to light up the sky with a sheet of light.
Cloud to cloud lightning occurs between two or more separate clouds and is also referred to as inter-cloud lightning. Lightning strikes will never reach the ground but can pose safety risks for aircraft. Cloud to cloud and intra-cloud lightning occurs approximately 10 times more often than cloud to ground lightning.
Cloud to air lightning occurs when a lightning discharge jumps from the cloud to clear air. Cloud to air lightning is caused by oppositely charged air and cloud regions interacting.
Cloud-to-ground lightning is the most damaging and dangerous form of lightning. Most flashes originate near the lower-negative charge center and deliver negative charge to the Earth. Although cloud-to-ground lightning is not the most common type of lightning, it is the one which is best understood because the lightning strike terminates with a physical object, the earth, and can therefore be measured by instruments.
Positive cloud-to-ground strikes carry a positive charge to Earth. Positive strikes make up less than 5% of all lightning strikes, but these strikes can be far more dangerous because they are more highly charged than negative lightning and the discharge current can last longer. A positive lightning strike can be as many as a billion volts – about 10 times that of negative lightning.
Inter-cloud lightning, as the name implies, occurs between charge centers in two different clouds with the discharge bridging a gap of clear air between them.
Other Types of Lightning There are many types and forms of lightning. Some are lightning subcategories, and others may arise from optical illusions, appearances, or myths. Some popular terms include: ball lightning, heat lightning, sheet lightning, red sprites, blue jets, and elves.
Thank you for listening to Module 4, please take the quiz at the end and move on to Module 5.
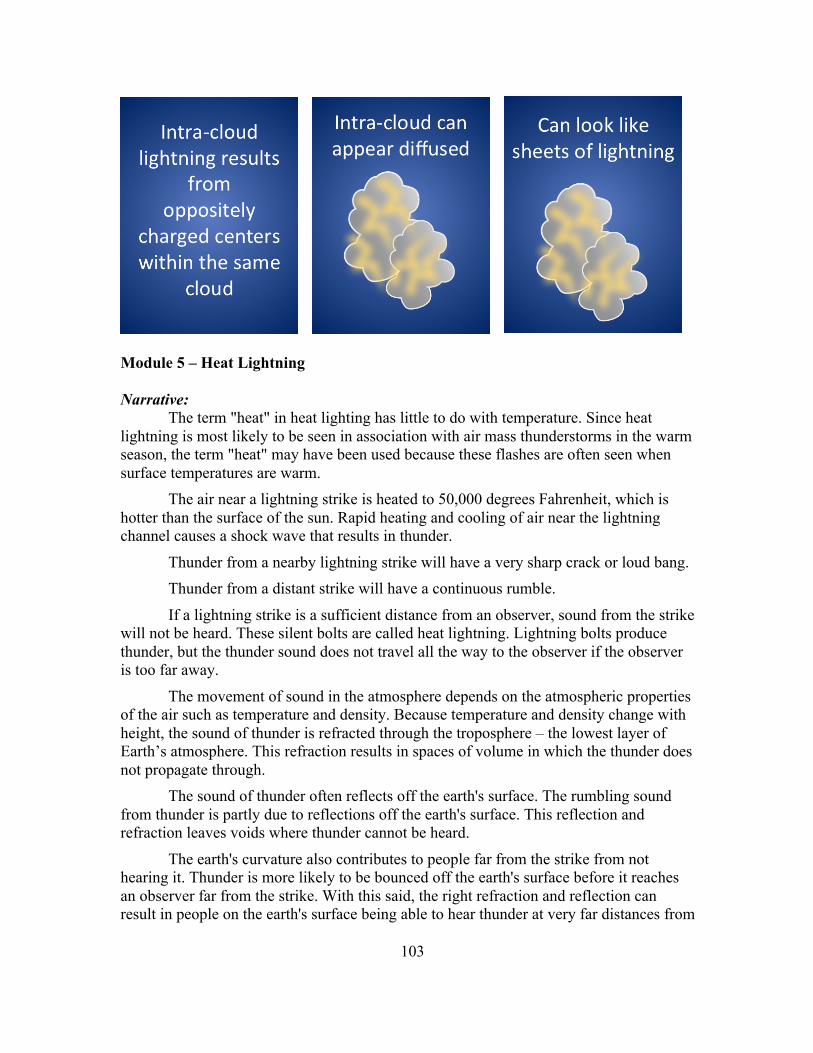
103
Module 5 – Heat Lightning
Narrative: The term "heat" in heat lighting has little to do with temperature. Since heat
lightning is most likely to be seen in association with air mass thunderstorms in the warm season, the term "heat" may have been used because these flashes are often seen when surface temperatures are warm.
The air near a lightning strike is heated to 50,000 degrees Fahrenheit, which is hotter than the surface of the sun. Rapid heating and cooling of air near the lightning channel causes a shock wave that results in thunder.
Thunder from a nearby lightning strike will have a very sharp crack or loud bang. Thunder from a distant strike will have a continuous rumble.
If a lightning strike is a sufficient distance from an observer, sound from the strike will not be heard. These silent bolts are called heat lightning. Lightning bolts produce thunder, but the thunder sound does not travel all the way to the observer if the observer is too far away.
The movement of sound in the atmosphere depends on the atmospheric properties of the air such as temperature and density. Because temperature and density change with height, the sound of thunder is refracted through the troposphere – the lowest layer of Earth’s atmosphere. This refraction results in spaces of volume in which the thunder does not propagate through.
The sound of thunder often reflects off the earth's surface. The rumbling sound from thunder is partly due to reflections off the earth's surface. This reflection and refraction leaves voids where thunder cannot be heard.
The earth's curvature also contributes to people far from the strike from not hearing it. Thunder is more likely to be bounced off the earth's surface before it reaches an observer far from the strike. With this said, the right refraction and reflection can result in people on the earth's surface being able to hear thunder at very far distances from

104
the storm. The reflection and refraction in the troposphere determines who hears the strike and who doesn't.
Thank you for listening to Module 5, please take the comprehensive quiz and the exit survey.

105
APPENDIX F
POST-INSTRUCTION SURVEY
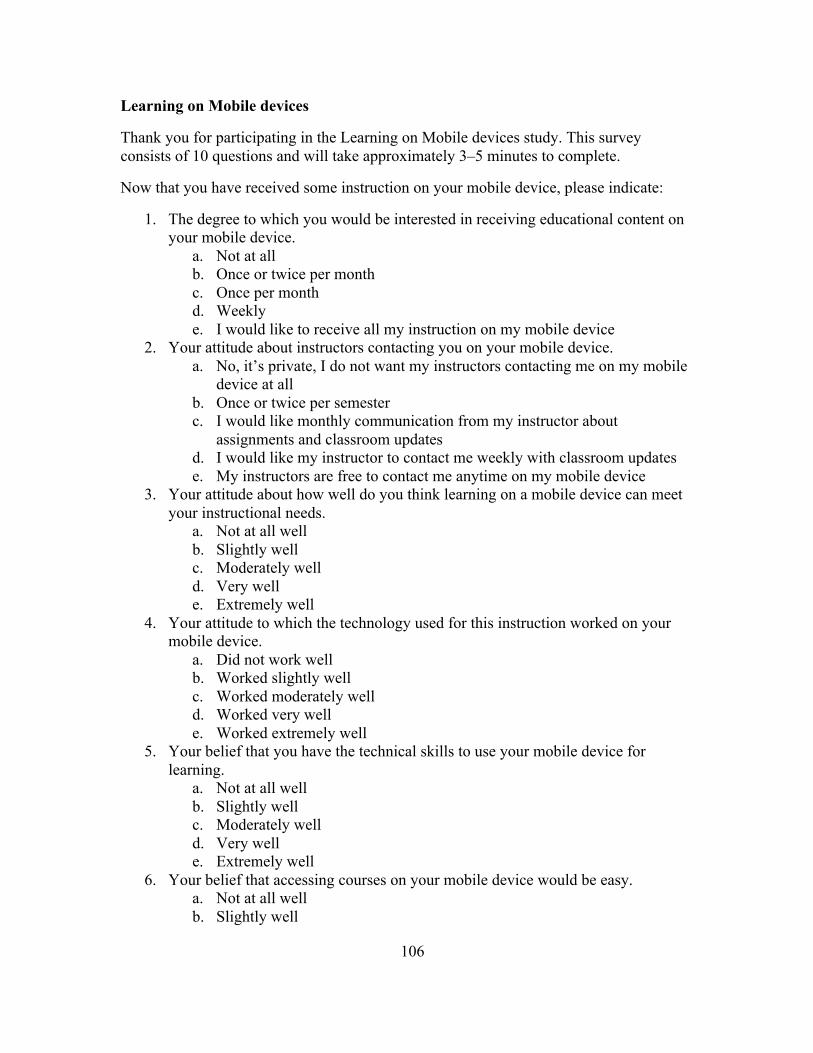
106
Learning on Mobile devices
Thank you for participating in the Learning on Mobile devices study. This survey consists of 10 questions and will take approximately 3–5 minutes to complete.
Now that you have received some instruction on your mobile device, please indicate:
1. The degree to which you would be interested in receiving educational content on your mobile device.
a. Not at all b. Once or twice per month c. Once per month d. Weekly e. I would like to receive all my instruction on my mobile device
2. Your attitude about instructors contacting you on your mobile device. a. No, it’s private, I do not want my instructors contacting me on my mobile
device at all b. Once or twice per semester c. I would like monthly communication from my instructor about
assignments and classroom updates d. I would like my instructor to contact me weekly with classroom updates e. My instructors are free to contact me anytime on my mobile device
3. Your attitude about how well do you think learning on a mobile device can meet your instructional needs.
a. Not at all well b. Slightly well c. Moderately well d. Very well e. Extremely well
4. Your attitude to which the technology used for this instruction worked on your mobile device.
a. Did not work well b. Worked slightly well c. Worked moderately well d. Worked very well e. Worked extremely well
5. Your belief that you have the technical skills to use your mobile device for learning.
a. Not at all well b. Slightly well c. Moderately well d. Very well e. Extremely well
6. Your belief that accessing courses on your mobile device would be easy. a. Not at all well b. Slightly well

107
c. Moderately well d. Very well e. Extremely well
7. Your belief that you would have more learning opportunities if your coursework were available on mobile devices.
a. Not at all b. Slightly more opportunities c. Moderately more opportunities d. More opportunities e. A lot more opportunities
8. Your belief that you would enjoy your courses more if instruction were available on mobile devices.
a. Not at all enjoyable b. Slightly more enjoyable c. Moderately more enjoyable d. Very much more enjoyable e. Extremely enjoyable
9. Your belief that having your instruction available on a mobile device would help you stay on-track with your coursework.
a. Not at all b. Slightly more on-track c. Moderately more on-track d. Very on-track e. Extremely on-track
10. Your belief that learning on mobile devices is the wave of the future. a. Not at all b. Maybe in five years c. Probably d. Definitely
11. Do you have any comments about learning on mobile devices that you would like to share?
a. Open-ended

108
APPENDIX G
ASSESSMENTS – COMPREHENSIVE QUIZ AND SCORING AND INDIVIDUAL
MODULE QUIZZES

109
Comprehensive quiz 10 questions – two from each module
Please answer all questions to the best of your ability based upon the information
provided each module.
Module 1 1. Direct lightning strikes are very dangerous to humans because: (please select the best
answer based upon the instruction) a. The person becomes part of the flash channel – 10 pt. b. Lighting can be hotter than the sun – 7 pt. c. Frequently medical assistance is not close by – 5 pt. d. There are more than 25 million lightning strikes per year in the U.S. – 3 pt. e. Because they can race along the surface of the earth – 0 pt.
2. Transfer question – An indirect strike can be very dangerous because:
Transfer question short answer – need to understand the why the relationship between the conductivity of the ground and other objects such as people. Answers should include concepts about:
a. The ground stores the energy from the lightning strike b. The ground is a good conductor of energy c. The current passes along the surface of the earth to a better conductor d. The current is absorbed by the earth and changes the surface area from
positive to negative
Module 2 1. Why might thunderstorms be less prevalent during winter months?
a. Cool dry air sinks – 5 pt. b. The earth is further from the sun – 0 pt. c. The air is more uniformly cool and dry – 10 pt. d. The moisture in the air freezes and becomes snow – 3 pt. e. There is more static electricity – 0 pt.
2. Transfer question – Why does the rise of warm moist air and the fall of cool dry air
create thunderstorms?
Transfer question short answer – need to understand the relationship between warm moist air and the formation of thunderstorms. Answers should include concepts about:
a. The different air densities cause instability b. Lift c. How lift and instability create thunderstorms

110
Module 3 1. Ice particles play a role in the formation of lightning because:
a. The ice particles become hail – 0 pt. b. The ice is a good conductor of electricity – 0 pt. c. The cloud mass becomes frozen – 5 pt. d. Ice particles carry a positive charge – 7 pt. e. The ice particles become both positively and negatively charged – 10 pt.
2. Transfer question – In a thunderstorm the upper portion of the cloud is positively charged, because?
a. Smaller particles have a positive charge and rise to the top of the cloud
Transfer question short answer – need to understand that the smaller positively charged particles rise to the top of clouds. Answers should include concepts about:
a. Smaller positively charged particles rise b. Heavier negative particles sink c. Ice particles can have both negative and positive charges d. The charges interact to create electricity
Module 4 1. Cloud-to-ground lightning primarily carries a negative charge back to earth because:
a. The lower areas of a thunderstorm are negatively charged – 7 pt. b. Positive charges pool near the surface of the earth – 7 pt. c. It is the most dangerous form of lightning – 3 pt. d. Most flashes originate near the lower-negative charge center – 10 pt. e. It terminates with a physical object – 5 pt.
2. Transfer question – Lightning might strike the ground instead of a nearby tree
because:
Transfer question short answer – need to understand that positive charges on the ground pool under thunderstorms and follow them around as the storm moves. Answers should include concepts about:
a. A positive charge on the ground attracts the negative charge from the cloud b. Positive charges on the ground pool under thunderstorms c. The opposite charges are attracted to each other d. Even though a tall object might be nearby, the charge attraction is greater
between the cloud and the ground
Module 5 1. Lightning can still be seen, even if you don’t hear thunder because:
a. Rapid heating and cooling of air near the lightning channel causes shock waves – 3 pt.

111
b. The curvature of the earth absorbs the sound – 5 pt. c. You are too far away to hear the thunder – 10 pt. d. It is possible to have thunder without lightning – 0 pt. e. The lightning is cloud-to-cloud lightning – 0 pt.
2. Transfer question – Why would counting after you see lightning and before you
hear thunder work to tell you how far away the storm is located?
Transfer question short answer – need to understand how sound and light travel. Answers should include concepts about:
a. Light travels faster than sound b. The atmosphere can absorb some of the sound c. Refraction and reflection of sound
Individual Module Quizzes Lightning Measures
Please answer all questions to the best of your ability based upon the information provided each module.
Module 1 1. According to the instruction, NASA research estimates that lightning strikes ground
in the United States approximately: a. 2,000 times per year b. 1.5 billion times per year c. 25 million times per year d. 50 times per year e. 50 times per day
2. According to the instruction, there are _ types of lightning strikes, and they are
a. direct, indirect, secondary, tertiary b. direct, indirect, secondary or resultant c. direct and indirect d. direct e. flash channel and direct
3. According to the instruction, a direct lightning strike can:
a. Pass right through a person without injuring them b. Kill hundreds of cows with a single strike c. Race along the surface of the earth d. Create “branches” that jump and strike people e. Won’t occur if you are wearing rubber soled shoes

112
4. According to the instruction, explosions, fires and accidents are most typical of:
a. Secondary or resultant strikes b. Indirect strikes c. Direct strikes d. Thunderstorms e. Flash channels
5. Short answer question. If you are outside during a storm what can you do to protect
yourself from a contact or side splash lightning strike? Answer should include concepts about:
a. Moving away from trees or tall objects b. Move away from metal objects
Module 2 1. According to the instruction, a thunderstorm would NOT be created if:
c. The weather is uniformly cool and clear d. The ocean currents are different temperatures e. Warm moist air rises f. Cool dry air sinks g. Cool air and warm air interact
2. According to the instruction, even though southern California and Florida are at a similar latitude Florida has more thunderstorms because:
h. It is closer to the equator i. California is in a drought j. Warm moist currents produce more moisture k. More moisture is released into the air when cool air rises l. California has more desert which creates drier air
3. According to the instruction, unstable air masses:
m. Are created uniformly over the earth’s surface n. Are cool at the base and warm at the top o. Are created from bodies of air with uniform density p. Are created when air is forced upwards or downwards q. Create lift
4. According to the instruction, lift is not likely to occur:
r. Near coastal regions s. On a cool overcast day

113
t. When pavement absorbs light u. Cooler air is less dense v. In summer
5. Short answer question. According to the instruction, what role might large paved
surfaces play in the creation of storms? Answer should include concepts about: w. Large paved surfaces absorbing energy from the sun x. Heat from pavement creating thermal changes y. Heat rising
Module 3 1. According to the instruction, lightning is formed:
a. When ice crystals collide within a cloud b. A positive charge in a cloud interacts with a negative charge on the earth c. An electrical discharge between positive and negative regions of a
thunderstorm d. A positive thunderstorm collides with a negative thunderstorm e. Positively charged ice crystals sink to the bottom of the cloud
2. According to the instruction, on average a lightning flash:
a. Lasts about 3 minutes b. Lasts about 3 seconds c. Has no average duration d. Has a single stoke per flash e. Lasts about 30 microseconds
3. According to the instruction, lightning:
a. Is more prevalent over land in the tropics where convection is greatest b. Is distributed evenly around the globe c. Occurs primarily in the northern and southern hemispheres over bodies of
land d. Is a result of positive charges dissipating e. Occurs primarily in the Arctic causing Northern Lights
4. According to the instruction, thunder:
a. Always accompanies lightning b. Always precedes lightning c. Always follows lightning d. Happens 5 seconds before a lightning strike e. Only accompanies lightning sometimes

114
5. Short answer question – If a cloud only has positively charged regions, why won’t
lightning be formed? Answer should include concepts about: a. It takes a positive and negative charge to create lightning b. Without charge interaction there is no electricity
Module 4 1. According to the instruction, the most common type of lightning is:
a. Cloud-to-ground lighting b. Intra-cloud lightning c. Silent lightning d. Stratospheric lightning e. Positive flash lightning
2. According to the instruction, cloud-to-ground lightning primarily:
a. Carries a negative charge back to earth b. Carries a positive charge back to earth c. Dissipates as it leaves the cloud d. Doesn’t happen during the winter months e. Is a result of intra-cloud lightning overflow
3. According to the instruction, cloud-to-air lightning is caused by:
a. Positive charges in clouds escaping to the air b. Positive and negative charges escaping the cloud c. Static electricity in the air d. A differential in the cloud and air temperature e. Opposite charged air cloud and cloud regions interacting
4. According to the instruction, a lightning strike can be as many as a billion volts in:
a. Any situation b. Negative lightning strikes c. Positive lightning strikes d. Cloud-to-cloud lightning e. Intra-cloud lightning
5. Short answer question – Why do clouds appear to flicker during storms? Answer should include concepts about:
a. Oppositely charged areas of clouds discharge within the cloud and create diffused brightening
b. Lightning can stay within a cloud and not branch out

115
Module 5 1. According to the instruction, heat lightning is:
a. Lightning on a very hot summer day b. Hotter than normal lightning c. Thunder without lightning d. Lightning with no audible associated thunder e. Lightning seen from a far distance
2. According to the instruction, the sound of thunder:
a. Often reflects off the earth’s surface b. Is refracted through the stratosphere c. Depends upon the type of lightning d. Gets canceled out when sound waves bounce off the earth's surface e. Is loudest in storms close to the surface of the earth
3. According to the instruction, thunder can be heard:
a. Only close to a storm b. Up to 50 miles away c. An average of 6 to 7 miles away d. Around the curvature of the earth e. About 5 seconds after a lightning strike
4. According to the instruction, thunder:
a. When far away sounds like a low rumble b. When far away sounds like a quiet clap c. That is nearby can be almost silent d. Happens as a result of the temperature of lightning being about 30,000
degrees Fahrenheit e. If audible means that a storm has already passed
5. Short answer question – Sound from thunder may not always be heard because?
Answer should include concepts about: a. The earth is curved b. Sound reflects and refracts through the atmosphere c. The movement of sound depends upon atmospheric properties

116
APPENDIX H
RESPONSES TO OPEN-ENDED COMMENT SECTION FROM
POST-INSTRUCTION SURVEY
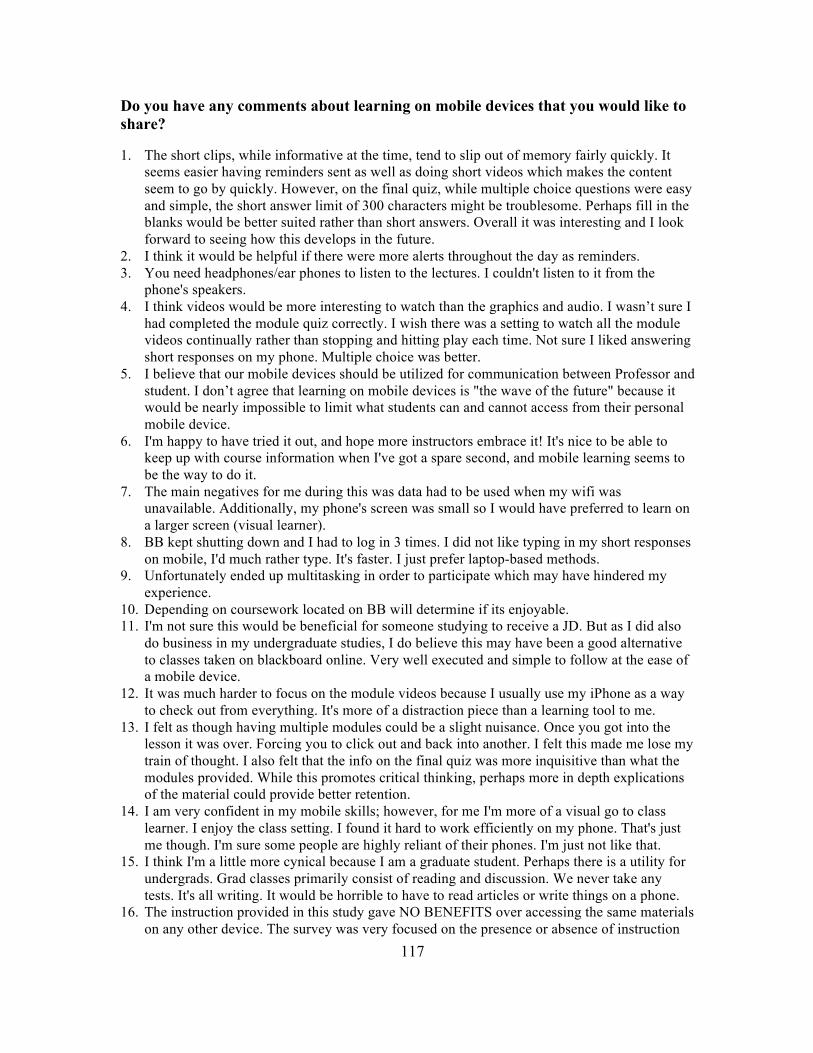
117
Do you have any comments about learning on mobile devices that you would like to share?
1. The short clips, while informative at the time, tend to slip out of memory fairly quickly. It seems easier having reminders sent as well as doing short videos which makes the content seem to go by quickly. However, on the final quiz, while multiple choice questions were easy and simple, the short answer limit of 300 characters might be troublesome. Perhaps fill in the blanks would be better suited rather than short answers. Overall it was interesting and I look forward to seeing how this develops in the future.
2. I think it would be helpful if there were more alerts throughout the day as reminders. 3. You need headphones/ear phones to listen to the lectures. I couldn't listen to it from the
phone's speakers. 4. I think videos would be more interesting to watch than the graphics and audio. I wasn’t sure I
had completed the module quiz correctly. I wish there was a setting to watch all the module videos continually rather than stopping and hitting play each time. Not sure I liked answering short responses on my phone. Multiple choice was better.
5. I believe that our mobile devices should be utilized for communication between Professor and student. I don’t agree that learning on mobile devices is "the wave of the future" because it would be nearly impossible to limit what students can and cannot access from their personal mobile device.
6. I'm happy to have tried it out, and hope more instructors embrace it! It's nice to be able to keep up with course information when I've got a spare second, and mobile learning seems to be the way to do it.
7. The main negatives for me during this was data had to be used when my wifi was unavailable. Additionally, my phone's screen was small so I would have preferred to learn on a larger screen (visual learner).
8. BB kept shutting down and I had to log in 3 times. I did not like typing in my short responses on mobile, I'd much rather type. It's faster. I just prefer laptop-based methods.
9. Unfortunately ended up multitasking in order to participate which may have hindered my experience.
10. Depending on coursework located on BB will determine if its enjoyable. 11. I'm not sure this would be beneficial for someone studying to receive a JD. But as I did also
do business in my undergraduate studies, I do believe this may have been a good alternative to classes taken on blackboard online. Very well executed and simple to follow at the ease of a mobile device.
12. It was much harder to focus on the module videos because I usually use my iPhone as a way to check out from everything. It's more of a distraction piece than a learning tool to me.
13. I felt as though having multiple modules could be a slight nuisance. Once you got into the lesson it was over. Forcing you to click out and back into another. I felt this made me lose my train of thought. I also felt that the info on the final quiz was more inquisitive than what the modules provided. While this promotes critical thinking, perhaps more in depth explications of the material could provide better retention.
14. I am very confident in my mobile skills; however, for me I'm more of a visual go to class learner. I enjoy the class setting. I found it hard to work efficiently on my phone. That's just me though. I'm sure some people are highly reliant of their phones. I'm just not like that.
15. I think I'm a little more cynical because I am a graduate student. Perhaps there is a utility for undergrads. Grad classes primarily consist of reading and discussion. We never take any tests. It's all writing. It would be horrible to have to read articles or write things on a phone.
16. The instruction provided in this study gave NO BENEFITS over accessing the same materials on any other device. The survey was very focused on the presence or absence of instruction

118
on a device, but what actually matters is whether that instruction makes use of any of the unique capabilities of a mobile device over a laptop or desktop. I prefer watching educational videos on my laptop because it has a larger screen, I can keep multiple videos open in difference tabs at the same time for reference, and keep a note-taking app open at the same time as the video for taking notes. My experience with mobile educational apps has been very negative. Blackboard has a horrible app, as does the eBook reader apps of most major textbook publishers. Merely "being available" on my mobile device is not enough. Instruction and materials need to make use of the strengths of mobile devices for it to be of any benefit.
17. Nice 18. I would be concerned how quizzes and tests would go. Also, note taking is a concern because
taking classes through my phone would mean being on the go. I think some retention is lost when trying to learn content from a mobile device. However, it would be convenient for small assignments and mandatory readings for class to use my device.
19. The videos did not load for me on the first or second day using ASU wifi, my home wifi, or my mobile data. I did not answer the quizzes because of this.
20. It would be nice that if we are learning on mobile devices if all other sounds and notifications on our phones would be silent. I know that while watching the videos, my email would sing which would lower the volume on the instructional video.
21. The short less than a minute lectures was bothersome to me. Combined for one unit hey may have made a two-minute lecture. And I think I'd have preferred to just watch the one. Although, I understand it may have been easier for phones to handle.
22. A notification when a new module or quiz is available would be helpful for staying on track. 23. Have calls, emails, and all other app notifications come us while trying to complete the
modules was distracting and not conducive to learning 24. Even though they are small, the videos take long time to load, making video watching
undesirable. 25. Some of the module quiz answer choices were confusing. 26. The interface in the Blackboard app is terrible-- just look at the app reviews. 27. Learning on mobile device was fascinating. However, I faced 1 problem that even on a
broadband connection the videos took a lot of time to buffer. I had to wait for the buffering a lot and that is why I was not able read the module 5
28. Maybe combining modules....or having less 29. It makes life easy and reduces on the stress of both the professors and the students. 30. I need alerts and reminders. Also, this app needs an update. Increase the resolution and make
it easier to respond 31. It's pretty interesting and can be convenient but maybe later on in the future 32. Mobile software used was glitchy (would freeze after every quiz). I did not feel as focused
because I am not used to have to use my phone to complete assignments, so it did not feel as important, but I could overcome this with some time and practice I believe. Overall it was interesting to experience this as I believe teaching and courses are going in this direction.
33. I think mobile devices would be a great tool to receive brief lectures, maybe review sessions. However, I don't really think they would be effective in learning in-depth, technical subjects. Perhaps adjusting the ways in which the material is presented may be beneficial
34. I feel like it would be more of a benefit if the questions were just multiple choice or true false so that you don't have to wait for the instructor to grade your answers and you can get them right away
35. Without using many push notifications to keep user aware I find this new use of mobile technology would be limited and cumbersome.
36. I had an issue with the final quiz. Once I had completed it, the app went black and I couldn't tell whether it submitted or not.

119
37. It might be that the voice in these modules was very monotone, but I don't believe we should be learning from our mobile devices just because it took a while for me to learn because I was too comfortable and that wouldn't happen in a classroom setting
38. I didn't learn much because my natural tendency while on my phone is to multitasking and only give it half the amount of attention that I should give.
39. Mobile device education is the future of the academics. It should be encouraged. 40. My primary issue is Blackboard's software, which is generally bad, and the lesson not
utilizing the uniquely useful features of a phone (e.g. touchscreen can be much more intuitive for spatial reasoning, so using a phone would be excellent for high school geometry, but not necessarily calculus). The lightning lessons were all videos which would be more convenient to watch on my computer anyways.
41. Having more notes on the lecture slides would have assisted me. 42. Sometimes you are easily distracted while watching these videos on the mobile device,
maybe due to a mail or other application's notifications. this distracts the students. 43. Love it 44. I am totally fine with online instruction. I think it can be really flexible and convenient.
However, after this study I think I would prefer to just stick with my laptop. I have a much better laptop than my phone so I prefer working on there. Using the phone proved to be much slower and not as intuitive. The Blackboard was slow and somethings were hard to access.
45. THANK YOU! 46. I feel that the learning experience wasn't terrible but it I wish the learning was more
engaging. I understand that there are limitations when it comes to the Blackboard however I wish there was more engagement with the videos. Maybe some animation for the info graphics portions of the videos. I also wish that there were tittle slides to differentiate the lessons. Everything seemed to be matching but that can get confusing if a user is wanting to go back and review as previous lesson.
47. For this project, I couldn't figure out why my sound wasn't working, turns out you need to turn on your notification sounds to hear it (Won't work on mute), might want to let users know this in the instructions!
48. There were several questions that I had some difficulty understanding and answering properly.
49. The inability to multitask or take notes during the lectures was unhelpful and the course material was viewable – I could hear the lectures but I couldn't see the graphics or what they were saying, which was very unhelpful.

120
APPENDIX I
INSTITUTIONAL REVIEW BOARD CONSENT

121
EXEMPTION GRANTED
Robert AtkinsonComputing, Informatics and Decision Systems Engineering, School of (CIDSE)480/[email protected]
Dear Robert Atkinson:
On 2/16/2016 the ASU IRB reviewed the following protocol:
Type of Review: Initial StudyTitle: Microlearning with Mobile Devices: Effects of
Distributed Presentation and the Testing Effect Investigator: Robert Atkinson
IRB ID: STUDY00003713Funding: None
Grant Title: NoneGrant ID: None
Documents Reviewed: • Recruitment email revised-2-10-16, Category: Recruitment Materials;• Study Surveys, Category: Measures (Survey questions/Interview questions /interview guides/focus group questions);• Study Quizes, Category: Measures (Survey questions/Interview questions /interview guides/focus group questions);• 503 revised 2-10-16, Category: IRB Protocol;• Study Comprehensive Quiz, Category: Measures (Survey questions/Interview questions /interview guides/focus group questions);• Microlearning consent revised 2-10-16, Category: Consent Form;
The IRB determined that the protocol is considered exempt pursuant to Federal Regulations 45CFR46 (2) Tests, surveys, interviews, or observation on 2/16/2016.