micromagneticsimulationsofspinelferriteparticles christine
TRANSCRIPT

arX
iv:1
005.
3169
v1 [
cond
-mat
.mtr
l-sc
i] 1
8 M
ay 2
010
Micromagnetic simulations of spinel ferrite particles
Christine C. Dantas and Adriana M. Gama
Divisao de Materiais (AMR), Instituto de Aeronautica e Espaco (IAE), Departamentode Ciencia e Tecnologia Aeroespacial (DCTA), Brazil
Abstract
This paper presents the results of simulations of the magnetization field ac
response (at 2 to 12 GHz) of various submicron ferrite particles (cylindricaldots). The ferrites in the present simulations have the spinel structure, ex-pressed here by M1−nZnnFe2O4 (where M stands for a divalent metal), andthe parameters chosen were the following: (a) for n = 0: M = { Fe, Mn,Co, Ni, Mg, Cu }; (b) for n = 0.1: M = { Fe, Mg } (mixed ferrites). Theseruns represent full 3D micromagnetic (one-particle) ferrite simulations. Wefind evidences of confined spin waves in all simulations, as well as a complexbehavior nearby the main resonance peak in the case of the M = { Mg, Cu} ferrites. A comparison of the n = 0 and n = 0.1 cases for fixed M reveals asignificant change in the spectra in M = Mg ferrites, but only a minor changein the M = Fe case. An additional larger scale simulation of a 3 by 3 particlearray was performed using similar conditions of the Fe3O4 (magnetite; n = 0,M = Fe) one-particle simulation. We find that the main resonance peak ofthe Fe3O4 one-particle simulation is disfigured in the corresponding 3 by 3particle simulation, indicating the extent to which dipolar interactions areable to affect the main resonance peak in that magnetic compound.
Keywords:
PACS: 75.78.Cd, 75.30.Ds, 75.47.Lx, 75.75.Jn, 76.50.+g
Email address: [email protected]; [email protected] (Christine C.Dantas and Adriana M. Gama)
Preprint submitted to Journal of Magnetism and Magnetic Materials May 30, 2018

1. Introduction
Ferrites (ferromagnetic oxides) present convenient dielectric and magneticproperties for microwave and millimeter-wave applications, considering theirrelatively large magnetic losses and resistivities [1]. It is well known thatseveral physical properties at sub-micron scales, such as the size and shapeof the particles in the system, their composition and concentration, includingtheir interactions, are important factors that shape the characteristics of themagnetic material in a sensitive manner [2, 3, 4]. The main interactionsamong these particles are the dipolar (or long range interactions) and thespin exchange interactions. The interplay between these interactions oftenlead to novel and complex magnetic phenomena. Therefore, in order to designmaterials appropriate to specific applications, a thorough understanding ofthese phenomena is needed.
Micromagnetism addresses the study of magnetism at sub-micron scalesin the continuum approximation, and its main theoretical equation is theso-called Landau-Lifshitz-Gilbert equation (LLG) [5, 6, 7, 8]. It describesthe magnetization vector field dynamics (the local precessional motion of themagnetization vector field), including a phenomenological damping term, un-der an “effective” magnetic field, representing various interactions amongstthe spins. Due to the fact that this is highly nonlinear vector partial dif-ferential equation, it is generally solved by numerical methods (analyticalsolutions can only be found in very few cases [8, 9, 10]).
Due to the advance of computer capabilities, micromagetic simulationshave been carried out with increasing validity, elucidating several complexmagnetic phenomena, but still with many open questions [11]. In particular,studies of the dynamics of confined spin waves in patterned arrays of mag-netic particles in thin films [12, 13, 14, 15, 16, 17] is of great interest andis the subject of the present investigation, in which ferrite particles are theconstituent elements. Although the literature on micromagnetic simulationsof ferromagnetic or permalloy particles is quite vast (see, e.g., Ref. [16] andreferences therein), possibly due to the fact that such a magnetic materialis able to support a reasonable range of magnetic structures (specially thevortex structure, relevant to magnetic recording systems), the literature spe-cific on ferrimagnetic or ferrite particle simulations is still somewhat scarce.An inspection of the OOMMF citation list on June 2009 [18] revealed morethan 750 papers that have used that simulator, in which only a few of themfocused on ferrimagnetic particles/films (e.g., Refs. [19, 20, 21]) or bilayers
2

(e.g., Ref. [22]). Zero-field absorption spectra of magnetite cubic particleshave been reported in Ref. [23]. This motivates our project to systemat-ically investigate the magnetization field ac response of various magneticcompounds (apart from permalloy) according to several physical properties,such as size and shape of the particles, their composition and concentration,inter-particle interactions, etc.
The main purpose of the present work is to study the absorption spectraand magnetization dynamics of full 3D micromagnetic simulations represent-ing submicron spinel ferrite (e.g., [1], [24] and references therein) particles(cylindrical dots). Several of these ferrites, already studied for many decades,are now being explored in recent advances in nanotechnology, specially inspintronics (e.g., Ref. [25] and references therein). It is well known thatthe saturation magnetization of several ferrites can be increased by a propercombination with the non-magnetic zinc ferrite. We have attempted to repro-duce qualitatively the effect of an addition of zinc content, in order to have apicture of its possible contributions to the resulting spectrum. In that case,we have focused on a small addition of zinc, which lies in the linear part ofthe the relation between saturation magnetization and zinc content [1]. Thisfirst exploration is intended as a basis for a future systematic numerical workexploring several material properties of ferrites of various types.
Another relevant analysis in the present work resulted from the perfor-mance of an additional larger scale simulation consisting of a 3 by 3 particlearray, in a similar fashion to our previous work with permalloy particles [26].It was performed using analogous conditions of the Fe3O4 one-particle sim-ulation. That larger simulation was performed with the aim of indicatingthe extent to which dipolar interactions are able to affect the spectrum char-acteristics in a ferrite patterned film, that is, one formed of closely spaceddots.
This paper is organized as follows. A summary of the time domain mi-cromagnetic simulation setups are given in Sec. II. In Sec. III, we describethe absorption spectra of the simulations and the equilibrium magnetizationfields and discuss the results, concluding in Sec. IV.
3

2. Materials and Methods
2.1. The Fundamental Equation of Micromagnetism and Spin Wave Phe-
nomena
The Landau-Lifshitz-Gilbert equation is a vector partial differential equa-tion for the magnetization vector ~M , defined as the sum of N individualmagnetic moments ~µj (j = 1, . . . , N), specified in a elementary volume dVat a position vector ~r within a magnetic system (particle). Being a contin-
uum limit expression, it assumes that the direction of ~M varies continuouslywith position [7]. The LLG equation describes the movement of the mag-
netization field ~M(~r, t) under the action of a external magnetic field ( ~Hext)
as precession movement of ~M around an effective magnetic field ( ~Heff), de-
fined as ~Heff ≡ −µ−10
∂Eeff
∂ ~M. It is assumed that Eeff embeds the energy
of an effective magnetic field, which is in turn generally expressed by thesum of four fields composing spin interactions of distinct origins, namely:Eeff = Eexch + Eanis + Emag + EZee (respectively: the exchange energy, theanisotropy energy, the magnetostatic or dipolar energy and the Zeeman or ex-ternal magnetic field energy). The resulting equilibrium state of that systemminimizes the total energy. Other physical parameters of the LLG equa-tion are: the saturation magnetization, Ms (determined by the temperature,here fixed throughout), the gyromagnetic ratio, γ, and a phenomenological(Gilbert) damping constant, α. The resulting dynamics is that in which the
magnetization vector precesses around the ~Heff field, loosing energy accord-
ing to the damping term, eventually leading to an alignment of ~M with ~Heff .The LLG equation is therefore written as:
d ~M(~r, t)
dt= −γ ~M(~r, t)× ~Heff −
γα
Ms
~M(~r, t)×[
~M(~r, t)× ~Heff
]
. (1)
The magnetization dynamics allows uniform and non-uniform (spatiallyvarying) precession movement within the system. An oscillating magneticfield Hac at a frequency ω0, applied perpendicularly to the magnetizationfield leads to a coupling of ~M and Hac, in which the energy will be absorbedby the system from the ac field. The ac field couples to uniform (leadingto main resonance peak) and to nonuniform (spin wave) modes[27, 28, 29].In the latter case, one notices that exchange and dipolar interactions maycontribute to the energy of these modes. According to the Kittel’s model
4

[30], additional resonances will be found at frequencies ωp = ω0+Dk2p, where
D is a function of the exchange interaction between adjacent spins, and kp isthe (quantized) wave vector corresponding to a given spin wave excitation.It has been noted (e.g., Ref. [31]) that the resonant peaks associated withthe exchange interactions are found at the left of the uniform resonancepeak, and that dipolar interactions would be generally independent of thesize of the system, leading to an interparticle dipolar coupling field (see, e.g.,Refs. [12, 26]). At a reasonably high signal level, they may exist significantcoupling between the uniform precession mode and spin wave modes, causingalterations on the main resonance line (e.g., broadening and lowering). Areview of confined spin waves can be found in Demokritov et al. [32].
2.2. Simulations Setup
The present work follows the general procedure described in our previouswork [26], where a similar analysis of permalloy cylindrical dots has beenperformed, based in the method outlined by Jung et al. [13]. We haveused the freely available integrator OOMMF (Object Oriented Micromag-netic Framework)[18] in order to numerically integrate the LLG equationand evolve the magnetization field of the ferrite particles. The particles werecircular dots with finite thickness, that is, cylindrical dots of 0.5µm of di-ameter and 85 nm of thickness. The chosen spinel ferrites for the presentsimulations (M1−nZnnFe2O4; M, a divalent metal), were the following: (a)for n = 0: M = { Fe, Mn, Co, Ni, Mg, Cu }; (b) for n = 0.1: M = { Fe,Mg }. Our simulations were performed in a method suitable for a qualitative
comparison with Brillouin light scattering spectroscopy measurements [33],noting that formally the strength of the Brillouin cross-section differs quan-titatively from the amplitude of the absorption spectrum. We describe thedetails of the simulations as follows.
In order to study the absorption as a function of frequency, an exter-nal magnetic field in the plane of the particle was applied, formed by twocomponents: a static (dc) magnetic field (Bdc ≡ µ0Hdc) of 100 mT in the ydirection, and a varying (ac) magnetic field (Bac ≡ µ0Hac) of small amplitude(1 mT) in the x direction:
Bac = (1− e−λt)Bac,0 cos(ωt), (2)
with the ac field frequency (f = ω/(2π)) ranging from 2 to 12 GHz, in stepsof 0.2 GHz (that is, 51 different OOMMF frequency runs were performed for
5

each ferrite simulation). We have discretized the time domain of the appliedBac field at intervals of 0.005 ns, which were used as inputs in the “field range”record of OOMMF (stepped linearly by the simulator). The simulationswere run up to 5 ns, resulting in 1000 outputs (dumps) for each of these 51frequency runs. An additional simulation involving a 3 by 3 array of particleswas performed using the same parameters and conditions of the Fe3O4 one-particle ferrite simulation, but running a smaller set of selected frequenciesaround the resonance peak, due to the high computational demand of thissimulation.
We list in Table 1 the main global parameters of the OOMMF, which werefixed for all sets of simulations. These global parameters were also adoptedfor the larger scale simulation (the 3 × 3 array). Note that the exchangestiffness has a fixed value in all simulations (of the order∼ 10−11 J/m). In thenext section we address in more detail this parameter in context of exchangelength effects. Table 2 lists particular data of the simulations, specifically thevalue of the saturation magnetization and anisotropy constant adopted foreach ferrite particle. We have extracted the data from Fig. 4.9 of Ref. [1],which presents the experimental values of the saturation magnetization ofmixed ferrites (in Bohr magnetons) according to the Zinc content (n value).Data was also extracted from Refs. [22] and [34] (c.f. Table A.1). Thesimulations were executed on a 3 GHz Intel Pentium PC running KuruminLinux, taken an average of ∼ 28 hours of computation for each set of one-particle simulations, whereas the 3×3 array simulation took about two weeksto be run.
2.3. Exchange stiffness considerations
In numerical micromagnetism, it is important to observe the restrictionthat, in order to obtain accurate results, the value of the computational cellsize should not exceed the exchange length (see, e.g. Ref. [10]), defined aslex =
√
2A/(µ0M2s ), where A is exchange stiffness of the material. Notice the
stronger dependence of lex to Ms than to A (e.g., a 10% smaller value for Awith Ms fixed implies a ∼ 5% decrease in the resulting lex, whereas the same10% reduction in Ms with A fixed implies a ∼ 23% increase in lex). The cellsize here adopted is 5 nm (enough for a meshing of O(100) magnetizationcells along the particle’s diameter), and therefore materials with lex abovethat limit are in accordance with the present numerical requirements.
Based on magnetoresistive measurements, Smith et al. [35] obtained theexchange stiffness for Permalloy within 10% error (ANiFe = 1.05×10⁻¹¹ J/m).
6

This method improves on previous estimates based on spin-wave ferromag-netic resonance spectra, which can give discrepancies of a factor of 2 aroundthe value ANiFe ∼ 1× 10⁻¹¹ J/m. From measurements of the domain width,Livingston [36] found for Fe-Nd-B magnets AFe−Nd−B = 1.1 × 10⁻¹¹ J/m,but this method depends on the measurement of the anisotropy constant K1(the quote value for AFe−Nd−B was increased by a ∼ 1.5 factor given a newmeasurement of K1, as mentioned in a note added in proof). Estimates for Acan also be obtained by a formula that includes the exchange integral J andother parameters (see, e.g., [37] for an estimate of the exchange stiffness of ananocrystalline Ni0.5Zn0.5 ferrite, although uncertainties are not quoted).
Given the experimental uncertainties, we have decided to adopt an ad-equate order of magnitude value for A (such that the resulting lex is abovethe computational cell of 5 nm), namely A ∼ 10−11 J/m. In particular, wehave fixed A = 1.2 × 10⁻¹¹ J/m, as usually quoted for magnetite (Ref. [19],but see e.g. Ref. [23] for a quoted value larger by a factor ∼ 3). Notice that,by the use of a global relation for ferrimagnetic polycrystals [38], namely,A(T ) = (kTc/a)(1 − T/Tc)
2, one can alternatively infer the A(T ) value forthe ferrites from the lattice constant (a) and Curie temperature (Tc) with∼< 20% precision. Using this relation and data collected from literature(see Refs. [39], [40], [41], and [42]), we find that the resulting values ofA(T ) at room temperature for all ferrites in the present work are well within∼ 20% of the presently adopted value of A = 1.2×10⁻¹¹ J/m; in other words,reasonably within current experimental uncertainties.
With the adopted value for A, we see that lex ∼ 8.2 nm for the (M = Fe,n = 0.1) ferrite (the highest Ms of the set) and lex ∼ 33.8 nm for the (M =Cu, n = 0) ferrite (the lowest Ms of the set). Hence the latter range for lexis above the cell size, in accordance with the numerical requirements. Noticethat, for the most critical cases (namely, M = Fe ferrites, with the highestMs values), one could ask how much an error in the corresponding A value isallowed for in order to still be in accordance with the numerical requirements(considering that the Ms value is correct). It results that a factor of ∼ 1/3(namely, a decrease in ∼ 33% in A) would result in lex <∼ 5 nm for the M =Fe ferrites. We conclude that the adopted value for A is acceptable for thepresent simulations.
However, it is important to understand how sensitive our simulations areto variations in A to the point that the final results could change appreciably.
7

We will investigate the effect of lower values of A1 in supplementary simula-tions to be discussed in the next section along with the main simulations
2.4. Calculation of the Spectra
For the spectra computation, we have also followed the general procedureoutlined in Ref. [13] (see also [26]). In order to obtain the absorption spectraof the ferrite particles, we proceeded as follows, for each simulation. The first1 ns of the averaged magnetization vector in the x direction, 〈 ~M〉x(t ≤ 1 ns),has been excluded, and the Fourier transform of the remaining time domaindata, 〈 ~M〉x(1 < t ≤ 5 ns), has been calculated. The amplitude of themaximum Fourier peak at each frequency run was then selected for providingthe absorpion at the respective frequency, hence building up the spectrum ofeach ferrite particle.
3. Results
3.1. Main Micromagnetic Simulations
In this section we outline the main results found in the present work. Amore detailed (qualitative) analysis will be offered in the next section.
Fig. 1 shows the resulting spline fit absorption spectra of the ferrite one-particle simulations for n = 0. It is observed that the ferrites with highersaturation magnetization (Ms) have their main resonance peaks at higherfrequencies. It is also possible to notice in each spectrum the presence ofsmall amplitude absorption peaks at the left of the main resonance peak;these small peaks appear to increase in amplitude for the ferrites with lowerMs. It is already pronounced in the M = Ni case, and results in a “double-like” peak in the case of the M = { Mg, Cu } ferrites (which have very similarMs). As already mentioned, resonant peaks associated with the exchangeinteractions are found at the left of the uniform (main) resonance peak (e.g.,Ref. [31]). Hence, the small peaks found in the spectra are probably confinedspin-wave excitations of the magnetization field of the particles.
Fig. 2 shows the spectrum of the simulation representing a Fe(1−n)ZnnFe2O4
(n = 0.1) mixed ferrite compared with that of n = 0 (Fe3O4). It can be seen
1Clearly, for a fixed Ms, lower values of A are of more interest than higher values, sincethe latter are “safe” with respect to the numerical requirements for lex, according to ourconsiderations.
8

that the main peak in the mixed ferrite is slightly moved to higher frequen-cies. Fig. 3 shows the comparative result for the Mg(1−n)ZnnFe2O4 mixedferrite. This is a more complex case. Clearly, peak A (n = 0 case), whichis quite pronounced, lowers in amplitude significantly in the correspondingn = 0.1 case (peak C), whereas peak B appears to be modified into peak D,which is at a higher amplitude and frequency.
In Figs. 4 and 5 (top panel), the simulation output “snapshots” of themagnetization vector field related to the peaks of interest of the M = {Cu,Mg } ferrites are shown. At each peak, the snapshots were chosen (restrictedto t > 3 ns) at two points of the ac field cycle (ωt = π/2 for the snapshot atright, and ωt = 3π/2 for the one at left of those figures). The varying pixeltonalities of the particle’s snapshots correspond to different values of the xcomponent of the magnetization field, which was subsampled to show anarrow for the average of 9 vectors per cell element. Both simulations showsimilar results due a close Ms value for these ferrites. It is clear that thepronounced peak at the left of the spectra (in both these cases) is of a differentnature from the one at right: in the former peak, the magnetization field inthe center of the particle is mostly static and aligned with the direction of thedc field; the response of the magnetization field is limited to small oscillationsof the (nonuniform) magnetization near the edges. The corresponding peakat right present instead a quasi-uniform behaviour.
In both panels of Fig. 5, which refer to a comparison between the n = 0and n = 0.1 cases for fixed M = Mg, one is able to contrast the snapshotsof each of the peaks of interest as a function of the zinc content addition.Clearly, the peaks at left (A, C) show a different magnetization field be-haviour than the right ones (B, D), as already pointed out in previously.Since the zinc addition is here implemented in a qualitative manner, thisresult must be interpreted as a general trend.
Fig. 6 shows the snapshots of the magnetization vector field at the mainresonance peak of each of the one-particle ferrite simulations of Fig. 1 (n =0). In the case of the M = { Mg,Cu } ferrites, the snapshots were selectedfrom the peaks at the right of their spectra (see Figs. 4 and 5 for peaksB and D), given that they show a similar nature with respect to the mainresonance peaks of the other ferrites, as already pointed out. It is observeda systematic change in the magnetization field response as a function of the
saturation magnetization of the ferrite (which increases to the left in Fig. 6).This systematic change is revealed in terms of a higher overall amplitude ofresponse for higher Ms as well as an increasingly important presence of small
9

oscillations about a nonuniform static magnetization distribution. Fig. 7 isa similar figure to the previous one, but presents instead the snapshots ofthe simulations with addition of zinc content (n = 0.1 runs) as compared totheir n = 0 counterparts. We will discuss these results in more detail in thenext section.
Fig. 8 shows the absorption spectrum of the Fe3O4 3 × 3 particles (ar-ray) simulation superposed to the corresponding single particle simulation.Clearly, the main resonance peak of the Fe3O4 one-particle simulation is dis-figured in the corresponding 3 by 3 particle simulation. There are now 3resolved peaks approximately within the region of the single main peak ofthe one-particle simulation counterpart, and these peaks increase in ampli-tude for higher frequencies, but never reach the same amplitude of the mainpeak of one-particle run. This figure should provide some indication of theextent to which dipolar interactions are able to affect the main resonancepeak in that magnetic compound. This result is compatible with that of Ref.[43] for cylindrical Permalloy 3 × 3 dot arrays, in which the fundamentalmode is found to be split into three modes.
Fig. 9 shows the corresponding snapshots of the magnetization vectorfield at each of the three peaks identified in the previous figure, concerningthe 3 by 3 array simulation. Snapshots number 3 (panel at the right ofthat figure) should be compared with that of Fig. 6, M = Fe one-particlesimulation. There are several issues to be observed in the 3 by 3 arraysimulation, which will be addressed in more detail in the next section.
3.2. Supplementary Micromagnetic Simulations
As mentioned on Sec. 2.3, we report on additional simulations performedin order to evaluate the impact of smaller values of the exchange stiffnessconstant, A, on our results. As explained in that section, it is interesting toanalyse that impact for the well-known M = Fe ferrite (magnetite). In otherwords, we have artifically lowered the A value for that one-particle ferritemodel by a factor 1/3 (simulation labeled “S1”) and by 20% (“S2”), see Ta-ble 3. Notice that the S1 run brings lex ∼ 5 nm (cell size), and therefore isexpected to bring noticeable change in the results (all other parameters re-mained fixed). Indeed, as Fig. 10 shows, there is a decrease in the amplitudeof the main peak as A decreases. Otherwise, the resonance frequency andother minor modes at the left of the main peak show little variation. Thissuggests that, in addition to the preliminary considerations already expressedin Sec. 2.3, our results are qualitatively robust.
10

In order to verify the sensitiveness of the appearance of the “three peaks”found in the 3×3 particles simulation with respect to a change in some specificparameter, we have run additional 3×3 simulations with the same parametersof the original one, except for a change in some parameter of our choice. Dueto the fact that these array simulations are computationally demanding, sothat a fine-grain covering of the parameter space is prohibitive at this time,we have limited our analysis to a small set of additional simulations in orderto infer possible trends. Also, we have limited the simulations to the 5.0 -7.0 GHz frequency range, in steps of 0.2 GHz. Table 3 lists the parameterchanged in these simulations (labelled “S3” to “S7”).
Fig. 11 shows the resulting spectra of the additional 3 × 3 simulations.The “Reference” spectrum is that resulted from the original 3×3 run, that is,the same as shown in Fig. 8 (the spectrum with “three peaks”, as indicated).We have also presented a re-analysis of that original simulation by selectingthe last 2 ns of the remaining time domain data, 3 < t ≤ 5 ns, for thecalculation of the Fourier transform (instead of the 1 < t ≤ 5 ns data; seeSec. 2.4). This selects a clearer steady state condition. We see that (toppanel of Fig. 11) the form of the spectrum is practically unchanged, exceptin amplitude, which is decreased.
A lower value of A (“S3”) also produces a smaller amplitude spectrum,with the overall form maintained (except perhaps for the first, smaller peakat left), which is the same result as the one-particle cases (see Fig. 10). Ahigher value for Ms (“S4”) results in significant distortion of the referencespectrum, namely: a decrease in amplitude of the peaks, and the first, smallerpeak at left is not seen in the range of frequencies simulated. An anisotropyconstant K1 set to zero (“S5”; Fig. 11, bottom panel) shows no significantchange in the spectrum. On the other hand, the spectrum resulting from alarger damping constant (factor of 10) misses entirely the three peaks. Thisis interesting in the light of our previous work, where the same dampingconstant was used, and no splitting of the main peak was found for thePermalloy 3 × 3 particles run (see discussions in [26]), although a splittingwas indicated in Ref. [43]. Our present analysis thus confirm that a largerdamping parameter possibly explains the difference in the previous results.Finally, the spectrum of the “S7” run (model B3 of [26]), where the dots“touch” each other, shows a different spectrum as compared to the referencesimulation (which in turn has 0.122µm of interparticle spacing). However, asplitting of the main resonance mode is also visible.
11

4. Discussion
The elucidation of peculiar features in the absorption spectra of ferriteparticles must take into account recent interpretations on the nature and roleof the spin-wave modes. Modes with nodal planes parallel to the magneti-zation are associated with high frequency modes, whereas modes with nodalplanes perpendicular to the magnetization can exhibit frequencies lower andhigher than the quasi-uniform mode, and their presence mainly depends onthe number of nodes and the equilibrium between the dipolar and exchangeinteraction effects (see, e.g., Ref. [31]). In the present work, we are inter-ested in the overall qualitative magnetization field ac response of variousferrite cylindrical dots according to the micromagnetic numerical predictionsfor these systems, in order to have a basis for a more detailed subsequentinvestigation. For definiteness, we list here three possible collective ac re-sponses of the magnetization field according to the following criteria [12]:
• “Quasi-uniform” behavior (QU): the motion of each arrow is approxi-mately the same to that of its neighbors, except for the regions aroundthe edge of the particle;
• “Spin-wave” behavior (SW): the arrows exhibit small oscillations abouta nonuniform static magnetization distribution;
• “Edge-like” behavior (ED): the magnetization field in the center of theparticle is mostly static and aligned with the direction of the dc field;the response of the magnetization field is limited to small oscillationsof the (nonuniform) magnetization near the edges – these modes maybe influenced by the dipolar field coming from another particle placednearby.
The observed characteristics of the absorption spectra as linked to a visualinspection of the magnetization fields at resonant peaks of interest can beclassified under those criteria, a subject to which we address now.
A general trend (n = 0 cases) can be seen by comparing the spectraof Fig. 1 with the corresponding snapshots of Fig. 6. The nature of theresonance peaks based on the appearance of the snapshots can be inferred,which we list below:
• A remarkable feature is that the main resonance peak in all these sim-ulations seem to be of a similar nature and follow a systematic pattern,
12

namely: an increase in amplitude response (in the central body of theparticle) and the presence of small oscillations about a nonuniformstatic magnetization distribution (SW) – both effects as a function ofa larger saturation magnetization. In the most extreme case, M = Fe,one can see clearly the presence of nonuniformity in the magnetic fieldoscillation.
• The anisotropy constant K1 appears to play a minor (but noticeable)role to affect the above-mentioned trend. For example, let us comparethe M = Co ferrite with its two “neighbours” (in terms of Ms value),namely: M = Mn and M = Ni (c.f. Fig. 6). If one focuses on the pixeltonalities (a measure of the magnetization amplitude), the M = Coferrite shows a smaller extent in tonality of the central region (whereinthe amplitude of the magnetization field is larger) as compared withthose of the M = Mn (which has a close, but larger value of Ms) andM = Ni (lower Ms) ferrites. It would be expected from the above-mentioned trend (an increase in amplitude magnetization response inthe central body of the particle) that such an extent in tonality for theM = Co ferrite would be of intermediate size (between the M = Mn andM = Ni ones). The fact that this is not observed points to a relatively“easier” alignment of the magnetization with the external field in theM = Co ferrite case. A more systematic study fixing Ms and varyingK1, however, was not performed, and more study is needed to confirmthese general trends.
It is specially interesting to observe the snapshots in the cases of the“double-peaks” seen in the compounds M = { Cu, Mg } (Figs. 4 and 5, toppanel), where the pronounced peak at right of the spectrum (in both cases)presents an “edge-like” behaviour (ED). Such materials will probably showcomplex spectra in a properly manufactured patterned film, in which“edge-like” modes may be significantly influenced by the dipolar field arising fromanother particle placed nearby (depending on the interparticle spacing andpossibly other factors). We observe that these “edge-like” effects are smaller
for higher saturation magnetizations. For instance, a comparison betweenthe n = 0 and n = 0.1 case (M = Mg; Figs. 5 and 7 ) clearly shows thiseffect (note that the n = 0.1 ferrite has a larger value of Ms than that ofn = 0, for a fixed M).
A comparison between Figs. 2, 5 and 7 allow us to qualitatively infer howpeaks of interest possibly morph from one to another as the zinc content
13

is added in the ferrite particle. For the case M = Fe, the nonuniformity(SW), as expressed by the pixel tonality distribution, tends to increase inamplitude for n = 0.1 (or larger Ms), specially in the central body of theparticle. Similarly, for the M = Mg case, “edge-like” effects (ED) decrease
in amplitude and extent for n = 0.1 (compare snapshots related to peaks Aand C of Fig. 7). For the quasi-uniform modes (peaks B and D of Fig. 7) amore uniform magnetization field oscillation (QU) in the central the body ofthe particle is found for the n = 0.1 case. These effects qualitatively explainthe observed transformation of the corresponding spectra.
A note is necessary at this point. The n = 0.1 simulations were intendedas preliminar test-cases for a more systematic subsequent work. In Ref. [44],for example, an experimental study on the overall energy absorption behav-ior of Mn-Zn mixed ferrites in the frequency range of 8 to 12 GHz for variouschemical compositions is presented. A clear understanding of the behaviourshown in that work from the point of view of the magnetic absorption dy-namics would be desirable. It would be interesting to analyse and comparethe corresponding numerical predictions with experimental results in orderto allow for predictions and guidance for specific applications2. The presenttest-cases clearly show that such an analysis is feasible.
The results for the absorption spectrum of the Fe3O4 3×3 particles (array)simulation is very interesting and follows a previous investigation that wehave performed on similar permalloy arrays [26]. As already mentioned, themain resonance peak of the Fe3O4 one-particle simulation is disfigured inthe corresponding 3 by 3 particle simulation, resulting in 3 resolved peaksapproximately within the region of the original single main peak. Such afeature is not observed in the permalloy (Ms = 8.0×10⁵ [A/m]) 3 by 3 arraysimulation of our previous work (c.f. Fig. 4, the simulation A0 – one-particlerun – compared with A1 – 3 by 3 array run – of that paper, Ref. [26]).A reasonable explanation for not finding the splitting of the main mode inour previous work is due to a larger damping factor used in that work, assuggested here by our supplementary simulations analysis (Sect. 3.2). Asimilar splitting was found and discussed in Ref. [43]. There are, however,similarities between the present and previous results, which we will address
2Although the literature on ferrites is extremely vast, it has proven somewhat difficultin the course of this work to find adequate papers to which the present results could bedirectly compared.
14
now.
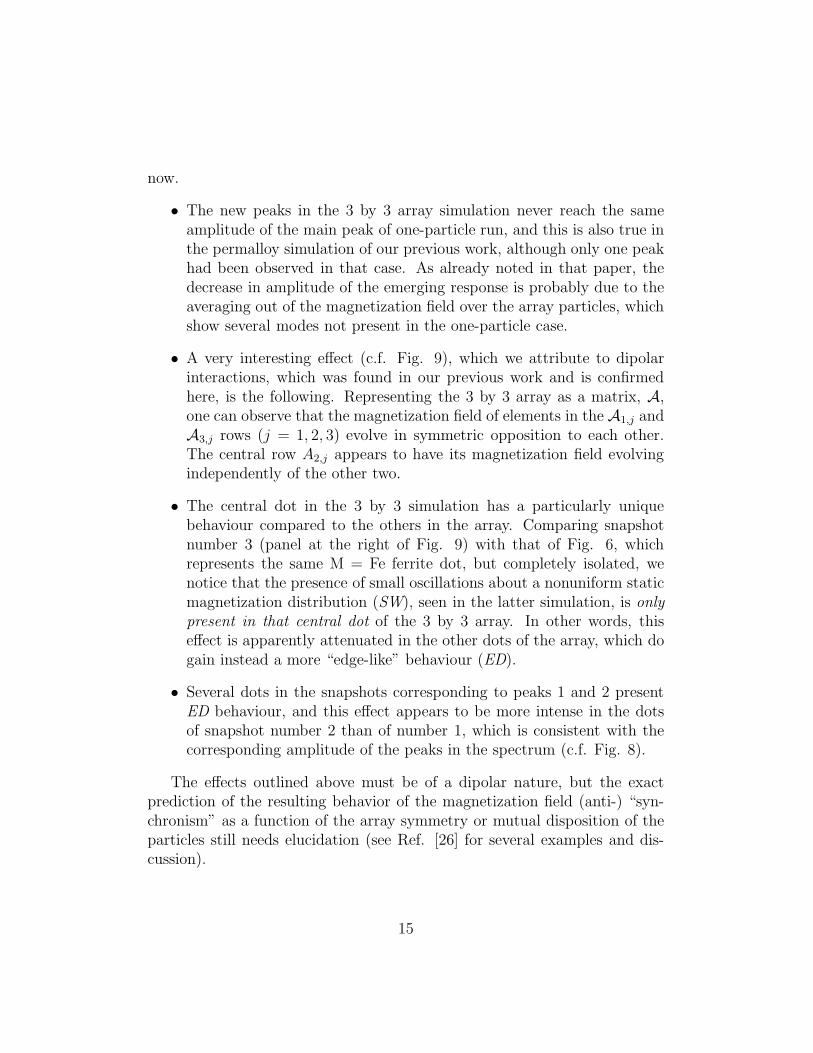
• The new peaks in the 3 by 3 array simulation never reach the sameamplitude of the main peak of one-particle run, and this is also true inthe permalloy simulation of our previous work, although only one peakhad been observed in that case. As already noted in that paper, thedecrease in amplitude of the emerging response is probably due to theaveraging out of the magnetization field over the array particles, whichshow several modes not present in the one-particle case.
• A very interesting effect (c.f. Fig. 9), which we attribute to dipolarinteractions, which was found in our previous work and is confirmedhere, is the following. Representing the 3 by 3 array as a matrix, A,one can observe that the magnetization field of elements in the A1,j andA3,j rows (j = 1, 2, 3) evolve in symmetric opposition to each other.The central row A2,j appears to have its magnetization field evolvingindependently of the other two.
• The central dot in the 3 by 3 simulation has a particularly uniquebehaviour compared to the others in the array. Comparing snapshotnumber 3 (panel at the right of Fig. 9) with that of Fig. 6, whichrepresents the same M = Fe ferrite dot, but completely isolated, wenotice that the presence of small oscillations about a nonuniform staticmagnetization distribution (SW), seen in the latter simulation, is onlypresent in that central dot of the 3 by 3 array. In other words, thiseffect is apparently attenuated in the other dots of the array, which dogain instead a more “edge-like” behaviour (ED).
• Several dots in the snapshots corresponding to peaks 1 and 2 presentED behaviour, and this effect appears to be more intense in the dotsof snapshot number 2 than of number 1, which is consistent with thecorresponding amplitude of the peaks in the spectrum (c.f. Fig. 8).
The effects outlined above must be of a dipolar nature, but the exactprediction of the resulting behavior of the magnetization field (anti-) “syn-chronism” as a function of the array symmetry or mutual disposition of theparticles still needs elucidation (see Ref. [26] for several examples and dis-cussion).
15

5. Conclusion
In the present paper we have reported on a set of 3D micromagneticsimulations of cylindrical dots supposed here to represent submicron spinelferrite particles excited by an external periodic magnetic field. We have anal-ysed the resulting absorption spectra and the magnetization field behaviorat modes of interest, limited to the timespan covered in the simulations (5ns). We have identified the nature of confined spin waves and small oscilla-tions of the (nonuniform) magnetization in the absoption spectra through aninspection of the magnetization field at extreme amplitudes of the cycle. Aqualitative analysis of the magnetization field behaviour for all simulationswas given.
The absorption spectra of ferrite particles may present complex behaviornearby the main resonance peaks, specially in the cases of M = { Mg, Cu }ferrites. It is inferred that a significant change in the absorption spectrumcan be achieved as the zinc content is added in M = Mg ferrites, but this isunlikely in the M = Fe case, at least for a change from n = 0 to n = 0.1.A study of a larger scale simulation of a 3 by 3 particle array with similarconditions of the M = Fe one-particle one shows that the resonance peak ofthe one-particle ferrite simulation is replaced by a “triple” peak or otherwisedisfigured in agreement with Ref. [43]. We confirm our previous result thatthere is indeed a magnetization field (anti-) “synchronism” effect in the array.This study permitted us to infer the extent which dipolar interactions areable to affect the main resonance peaks in such ferrite particles.
We aim to perform additional numerical studies to analyse the role ofconfined spin oscillations in various ferrimagnetic particles and arrays withdifferent physical conditions in a future work.
6. Acknowledgments
We thank the referee for useful suggestions. We would also like to thankthe attention and technical support of Dr. Michael J. Donahue in the initialphases of this project. We also wish to acknowledge the support of Dr.Mirabel C. Rezende and FINEP/Brazil.
16

Table 1: Main parameters set to the OOMMF simulator, fixed for all simulations in thepresent work.
Simulation Parameter/Option Parameter Value/Option
Exchange stiffness [J/m] 1.2× 10⁻¹¹
Anisotropy Type cubicFirst Anisotropy Direction (x,y,z) (1 1 1)Second Anisotropy Direction (x,y,z) (1 0 0)Damping constant 0.005Gyromagnetic ratio [m/(A.s)] 2.21× 10⁵
Particle thickness [nm] 85.0Particle diameter [µm] 1 0.5Cell size [nm] 5.0Demagnetization algorithm type magnetization constant in each cellSaturation magnetization [A/m] see Table 2
1There is a small difference in the case of the 3×3 array simulation. Due to constraintsin the drawing of the array (bitmap image to be used as input for the simulator), individualparticles turned out to have 0.552µm of diameter each, with 0.122µm of interparticlespacing, therefore fitting in an exact square of 1.9µm by 1.9µm. It is necessary that theinput bitmap size is set as an integer multiple of the cell size.
17

Table 2: Particular parameter values for each ferrite simulation
Simulation (M,n) Ms [×105 A/m] K1 [×104 J/m3] Note
(Fe,0.0) 5.00 −1.10 single particle(Fe,0.1) 5.48 −1.10 single particle(Fe,0.0) 5.00 −1.10 3 by 3 array of particles(Mn,0.0) 4.14 −0.28 single particle(Co,0.0) 3.98 27.00 single particle(Ni,0.0) 2.70 −0.69 single particle(Mg,0.0) 1.39 −1.50 single particle(Mg,0.1) 2.14 −1.50 single particle(Cu,0.0) 1.35 −0.60 single particle
18

Table 3: Supplementary simulation data
Simulation Parameter that has been modified Note
S1 A = 0.40× 10⁻¹¹ [J/m] single particleS2 A = 0.96× 10⁻¹¹ [J/m] single particleS3 A = 0.40× 10⁻¹¹ [J/m] 3 by 3 array of particlesS4 Ms = 7.5× 10⁵ [A/m] 3 by 3 array of particlesS5 K1 = 0 [J/m3] 3 by 3 array of particlesS6 damping const. = 0.05 3 by 3 array of particlesS7 Model B3 of Ref. [26] 3 by 3 array of particles
19

Figure 1: Absorption spectra of single ferrite particle simulations. Curves were arbitrarilydislocated for better comparison. Each ferrite spectrum is labelled by its divalent metal M(all cases here with n = 0), and organized in order of saturation magnetization, such thatthe upper curve is from the highest Ms. The spectral curves were obtained from spline fitsof the discrete simulation results (performed at frequencies from 2 to 12 GHz, sampled atintervals of 0.2 GHz). Possible spin-wave excitations to the left of main resonance peakscan be seen.
20

Figure 2: The spectrum of the simulation representing a Fe(1−n)ZnnFe2O4 (n = 0.1) ferritecompared with that of n = 0 (Fe3O4).
21

Figure 3: Same of previous figure, but for the Mg(1−n)ZnnFe2O4 ferrite. Labels A, B, Cand D mark peaks of interest.
22

Figure 4: “Snapshots” of the magnetization vector field for the CuFe2O4 ferrite, at tworesonance peaks, as indicated. At each peak, the snapshots were chosen (restricted tot > 3 ns) at two points of the ac field cycle (ωt = π/2 for the snapshot at right, andωt = 3π/2 for the one at left). The varying pixel tonalities of the particle’s snapshotscorrespond to different values of the x component of the magnetization field (subsampledto show an arrow for the average of 9 vectors per cell element).
23

Figure 5: Same as the previous figure, but for the Mg(1−n)ZnnFe2O4 ferrite. Top panel:n = 0. Bottom panel: n = 0.1.
24

Figure 6: “Snapshots” of the magnetization vector field for the ferrites presented in Fig. 1,taken at their main resonance peaks, labelled by its divalent metal M (all cases here withn = 0). Saturation magnetization increases to the left. In the case of the M = { Mg,Cu }ferrites, the snapshots were selected from the peaks at right of their spectra (see Figs. 4and 5, and the corresponding explanation in the text). As previously, the snapshots weretaken at two points of the ac field cycle (ωt = π/2 for upper snapshot, and ωt = 3π/2 forthe lower one).
25

Figure 7: Same of previous figure, but now snapshots refer for the simulations with additionof zinc content (n = 0.1 runs) as compared to their n = 0 counterparts. Labels A, B, Cand D refer to corresponding peaks in Figs. 3 or 5.
26

Figure 8: Comparison between the absorption spectrum of the Fe3O4 single particle sim-ulation (thin line) with that of the 3 × 3 particles (array) simulation (thick line). Filledsquares mark the selected frequencies performed for the 3 × 3 simulation (the associatedcurve is a spline fit to the corresponding data).
27
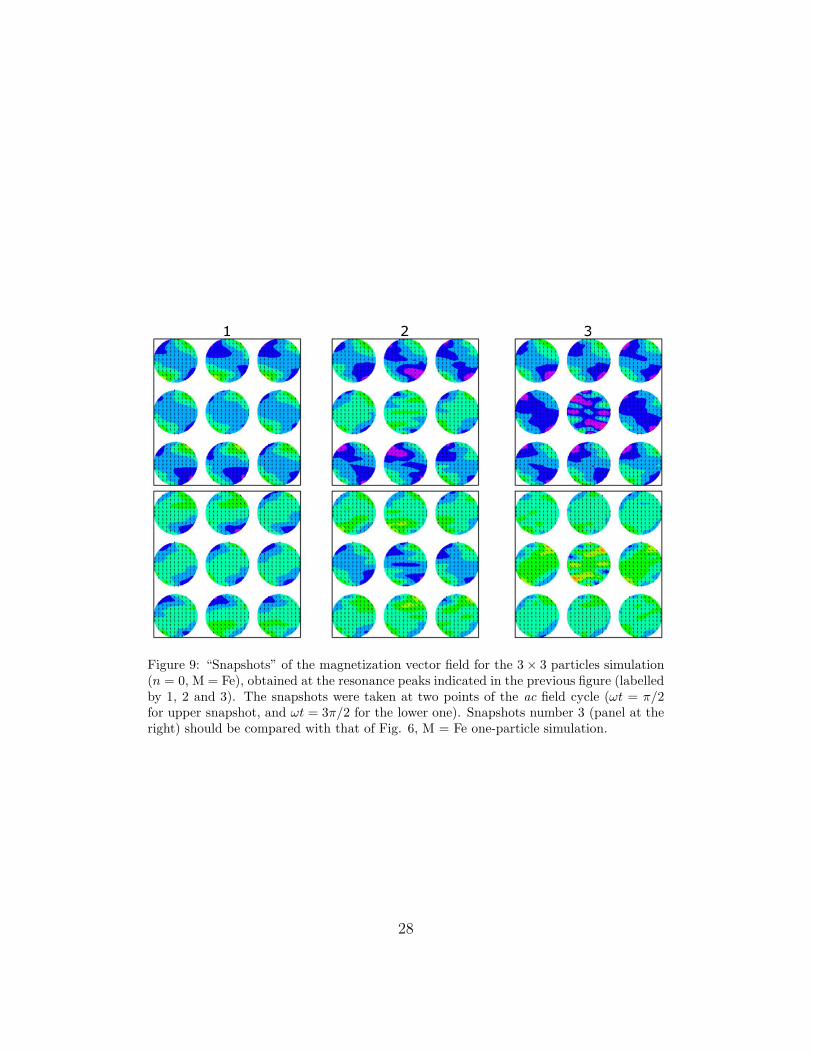
Figure 9: “Snapshots” of the magnetization vector field for the 3× 3 particles simulation(n = 0, M = Fe), obtained at the resonance peaks indicated in the previous figure (labelledby 1, 2 and 3). The snapshots were taken at two points of the ac field cycle (ωt = π/2for upper snapshot, and ωt = 3π/2 for the lower one). Snapshots number 3 (panel at theright) should be compared with that of Fig. 6, M = Fe one-particle simulation.
28

2 4 6 8 10 12
Freq. [GHz]
0
10
20
30
40
50
60
70
Absorp
tion [
arb
. units]
Reference
S1
S2
Figure 10: Comparison of the absorption spectra of a single ferrite particle (M = Fe;magnetite), labeled as “Reference” in the figure, with additional simulations “S1” and“S2”. The latter runs had their stiffness parameter A artifically lowered the by a factor1/3 (“S1”) and by 20% (“S2”) in relation to the reference model.
29

2 3 4 5 6 7 8
Frequency [GHz]
0
10
20
30
40
Absorp
tion [
arb
. units]
Reference
Reference - cut after 3ns
S3
S4
3 x 3
2 3 4 5 6 7 8
Frequency [GHz]
0
10
20
30
40
Absorp
tion [
arb
. units]
Reference
S5
S6
S7
3 x 3
Figure 11: Comparison of the absorption spectra of a 3 × 3 ferrite (M = Fe; magnetite)particles simulation, labeled as “Reference” in the figure, with additional simulations “S3”to “S7”, as listed in Table 3 and explained in the text.
30
References
[1] R. F. Soohoo, Theory and Application of Ferrites, Prentice-Hall, Inc.,1960.
[2] T. Hyeon, Chemical synthesis of magnetic nanoparticles, Chem. Com-mun. (2003) 927–934.
[3] M. Blanco-Mantecon, K. O’Grady, Interaction and size effects in mag-netic nanoparticles, Journal of Magnetism and Magnetic Materials 296(2006) 124–133. doi:10.1016/j.jmmm.2004.11.580.
[4] R. Malik, S. Annapoorni, S. Lamba, P. Sharma, A. Inoue, Competingmagnetic interactions in nickel ferrite nanoparticle clusters: Role of mag-netic interactions, Journal of Applied Physics 104 (6) (2008) 064317–+.doi:10.1063/1.2982278.
[5] E. Landau, L. & Lifshitz, On the theory of the dispersion of magneticpermeability in ferromagnetic bodies, Physik. Z. Sowjetunion.
[6] T. L. Gilbert, A lagrangian formulation of the gyromagnetic equationof magnetization field, Phys. Rev.
[7] W. F. Brown, Micromagnetics, Interscience Publishers, 1963.
[8] A. Aharoni, Introduction to the Theory of Ferromagnetism, Oxford Sci-ence Publications, 1996.
[9] B. Bertotti, C. Serpico, I. Mayergoyz, Nonlinear magnetization dynamicsunder circularly polarized field, Physical Review Letters.
[10] M. d’Aquino, Nonlinear magnetization dynamics in thin-films andnanoparticles, Doctorate Thesis in Electrical Engineering, UniversitaDegli Studi di Napoli, Italia.
[11] A. Aharoni, Micromagnetics: past, present and future, Physica B.
[12] S. Jung, B. Watkins, L. Delong, J. B. Ketterson, V. Chan-drasekhar, Ferromagnetic resonance in periodic particle arrays, Phys.Rev. B 66 (13) (2002) 132401–+. arXiv:arXiv:cond-mat/0109307,doi:10.1103/PhysRevB.66.132401.
31

[13] S. Jung, J. B. Ketterson, V. Chandrasekhar, Micromagnetic calculationsof ferromagnetic resonance in submicron ferromagnetic particles, Phys.Rev. B 66 (13) (2002) 132405–+. doi:10.1103/PhysRevB.66.132405.
[14] C. Yu, M. J. Pechan, W. A. Burgei, G. J. Mankey, Lateral standing spinwaves in permalloy antidot arrays, Journal of Applied Physics 95 (2004)6648–6650. doi:10.1063/1.1687554.
[15] G. Gubbiotti, G. Carlotti, T. Okuno, M. Grimsditch, L. Giovannini,F. Montoncello, F. Nizzoli, Spin dynamics in thin nanometric ellip-tical Permalloy dots: A Brillouin light scattering investigation as afunction of dot eccentricity, Phys. Rev. B 72 (18) (2005) 184419–+.doi:10.1103/PhysRevB.72.184419.
[16] M. Bailleul, R. Hollinger, C. Fermon, Microwave spectrum of squarePermalloy dots: Quasisaturated state, Phys. Rev. B 73 (10) (2006)104424–+. doi:10.1103/PhysRevB.73.104424.
[17] O. Bottauscio, M. Chiampi, A. Manzin, Micromagnetic numerical analy-sis of magnetization processes in patterned ferromagnetic films, Journalof Applied Physics 105 (7) (2009) 070000–+. doi:10.1063/1.3072376.
[18] M. Donahue, D. Porter, OMMF User’s Guide, Version 1.0, http://math.nist.gov/oommf/,Interagency Report NISTIR 6376, National Institute of Standards andTechnology, Gaithersburg, MD.URL http://math.nist.gov/oommf/
[19] M. Ziese, R. Hohne, P. Esquinazi, P. Busch, Micromagnetic studies ofmagnetite films using µ-Hall sensor arrays, Phys. Rev. B 66 (13) (2002)134408–+. doi:10.1103/PhysRevB.66.134408.
[20] M. Ziese, R. Hohne, H. C. Semmelhack, K. H. Han, P. Esquinazi, K. Zim-mer, Magnetic and magnetotransport properties of magnetite films withstep edges, Journal of Magnetism and Magnetic Materials 279 (2004)331–342. doi:10.1016/j.jmmm.2004.02.001.
[21] Y. Zhanga, Z. Rena, Y. Fua, X. Yuana, Y. Zhai, An investigation onthe behavior of fine-grained magnetite particles as a function of sizeand surface modification, Journal of Physics and Chemistry of Solids 70(2008) 505–509.
32

[22] M. Zieze, et al., Size and shape dependence of the exchange-bias fieldin exchange-coupled ferrimagnetic bilayers, Eur. Phys. J. B 45 (2005)223–230.
[23] C. Vaast-Paci, L. Leylekian, Numerical simulations of iso-lated particles susceptibilities: effects of shape and size, Jour-nal of Magnetism and Magnetic Materials 237 (2001) 342–361.doi:10.1016/S0304-8853(00)01362-7.
[24] C. M. B. Henderson, J. M. Charnock, D. A. Plant, Cation occupan-cies in Mg, Co, Ni, Zn, Al ferrite spinels: a multi-element EXAFSstudy, Journal of Physics Condensed Matter 19 (7) (2007) 076214.doi:10.1088/0953-8984/19/7/076214.
[25] Z. Szotek, W. M. Temmerman, D. Kodderitzsch, A. Svane,L. Petit, H. Winter, Electronic structures of normal andinverse spinel ferrites from first principles, Phys. Rev. B74 (17) (2006) 174431. arXiv:arXiv:cond-mat/0608168,doi:10.1103/PhysRevB.74.174431.
[26] C. C. Dantas, L. A. de Andrade, Micromagnetic simulations of small ar-rays of submicron ferromagnetic particles, Physical Review B 78 (2008)024441.
[27] M. Plihal et al., Spin wave signature in the spin polarized electron energyloss spectrum of ultrathin fe films: Theory and experiment, Phys. Rev.Lett.
[28] I. Neudecker et al., Modal spectrum of permalloy disks excited by in-plane magnetic fields, Phys. Rev. B 73 (2006) 134426–+.
[29] K. Baberschke, Why are spin wave excitations all important in nanoscalemagnetism?, Physica Status Solidi (b) 245 (2007) 174–181.
[30] C. Kittel, Excitation of Spin Waves in a Ferromagnet bya Uniform rf Field, Physical Review 110 (1958) 1295–1297.doi:10.1103/PhysRev.110.1295.
[31] J. Jorzick, et al., Quantized spin wave modes in micron size magneticdisks, J. Appl. Phys. 87 (2000) 5082.
33

[32] S. O. Demokritov, B. Hillebrands, A. N. Slavin, Brillouin light scatteringstudies of confined spin waves: linear and nonlinear confinement, Phys.Rep. 348 (2001) 441–489.
[33] J. G. Dil, Brillouin scattering in condensed matter, Rep. Prog. Phys. 45(1982) 285–334.
[34] D. Sellmyer, R. Skomski, Advanced Magnetic Nanostructures, Springer,1906.
[35] N. Smith, D. Markham, D. Latourette, Magnetoresistive measurementof the exchange constant in varied-thickness permalloy films, Journal ofApplied Physics 65 (1989) 4362–4365. doi:10.1063/1.343273.
[36] J. D. Livingston, Magnetic domains in sintered Fe-Nd-B magnets, Jour-nal of Applied Physics 57 (1985) 4137–4139. doi:10.1063/1.334644.
[37] Y. Liu, T. Qiu, Microstructure and magnetic characteristicsof nanocrystalline Ni0.5Zn0.5 ferrite synthesized by a sprayingcoprecipitation method, Chinese Physics 16 (2007) 3837–3842.doi:10.1088/1009-1963/16/12/047.
[38] M. Goyot, A. Globus, Determination of the domain wall energy and the exchange constant from hysteresis in ferrimagnetic polycrystals,JOURNAL DE PHYSIQUE - Colloque C1, Tome 38 4 (1977) C1–157.URL http://dx.doi.org/10.1051/jphyscol:1977131
[39] A. Goldman, Modern Ferrite Technology, 2nd. Ed., Springer Sci-ence+Business Media, Inc, 2006.
[40] H. Kronmuller, E. Parkin, S., Handbook of Magnetism and AdvancedMagnetic Materials, Wiley-Interscience, 2007.
[41] W. von Aulock, Handbook of Microwave Ferrite Materials, AcademicPress, 1965.
[42] X. Zuo, A. Yang, C. Vittoria, V. G. Harris, Computational study of cop-per ferrite (CuFe2O4), Journal of Applied Physics 99 (8) (2006) 08M909.doi:10.1063/1.2170048.
34

[43] G. Gubbiotti, M. Madami, S. Tacchi, G. Carlotti, T. Okuno,Normal mode splitting in interacting arrays of cylindrical permal-loy dots, Journal of Applied Physics 99 (8) (2006) 080000–+.doi:10.1063/1.2150806.
[44] A. M. Gama, M. C. Rezende, The relationship between Mn-Zn ferriteswith different iron ion contents and the absorption energy in X-band,Proceedings of the IEEE 01 (2005) 322–325.
35