microsoft azure security and audit log management
TRANSCRIPT

Microsoft Azure Security
and Audit Log
Management
Microsoft Azure Security and Audit Log Management
P A G E | 02
Abstract
The security logs in Microsoft® Azure™ Cloud Services (which provides Platform as a Service or PaaS) and
Virtual Machines (which provides Infrastructure as a Service or IaaS) contain vital information that can
provide intelligence and powerful insights into the following security issues:
Policy violations
Internal and external threats
Regulatory compliance
Network, host, and user activity anomalies
This whitepaper provides an introduction for generating, collecting, and analyzing security logs from
services hosted on Azure, and it can help you gain security insights into your Azure deployments. The
scope of this white paper is limited to applications and services built and deployed in Azure and that are
using the Windows Server® operating system.
Audience This document focuses on generating, and collecting security logs from services that are deployed in
Azure. It is intended for information technology (IT) professionals and security analysts who deal with
information asset management on a daily basis, including those responsible for their organization’s
security and compliance efforts. This work might comprise their main duties or be part of a broader
cloud IT management role. This document will be most useful to individuals who are already familiar
with how Azure functions from a broad perspective and are looking to increase their knowledge of tools
and technologies for security log analysis and monitoring.
Note Certain recommendations contained herein may result in increased data, network, or compute
resource usage, and increase your license or subscription costs.
Published November 2014
Copyright information
This document is provided "as-is." Information and views expressed in this document, including URL and other Internet Web site
references, may change without notice. Some examples are for illustration only and are fictitious. No real association is intended or
should be inferred.
This document does not provide you with any legal rights to any intellectual property in any Microsoft product. You may copy and use
this document for your internal, reference purposes.
2014 Microsoft Corporation. All rights reserved.

Microsoft Azure Security and Audit Log Management
P A G E | 03
1 TABLE OF CONTENTS
1 Table of Contents .................................................................................................................................. 3
2 Introduction .......................................................................................................................................... 4
3 Log Generation ...................................................................................................................................... 5
4 Log Collection ........................................................................................................................................ 7
4.1 Security event data collection with Windows Event Forwarding ................................................. 7
4.2 Security data collection by using Azure Diagnostics ..................................................................... 7
4.2.1 Security data collection from Azure Virtual Machines by using Azure Diagnostics .................. 9
4.2.1.1 Set up a new Instance of Log Collection Pipeline on a virtual machine ........................... 9
4.2.1.2 Update existing log collection pipeline with new configuration on a virtual machine .. 13
4.2.2 Security data collection from Azure Cloud Services by using Azure Diagnostics .................... 16
4.2.2.1 Set up new instance of log collection pipeline on a cloud service.................................. 16
4.2.2.2 Update existing log collection pipeline in a cloud service with a new configuration ..... 21
4.2.2.3 Security event distribution and spike detection ............................................................. 24
4.2.2.4 IIS log collection and processing by using HDInsight ...................................................... 25
4.2.3 Security log collection recommendations ............................................................................... 28
5 Exporting Security Logs to another system ........................................................................................ 29
6 Azure Active Directory reports ........................................................................................................... 29
7 Azure Operation Logs .......................................................................................................................... 29
8 Appendix ............................................................................................................................................. 30
8.1 Azure Diagnostics supported data sources ................................................................................. 30
9 References and Further Reading......................................................................................................... 30
Microsoft Azure Security and Audit Log Management
P A G E | 04
2 INTRODUCTION
Azure enables customers to perform security event generation and collection from Azure IaaS and PaaS
roles to central storage in their subscriptions. Customers can then use HDInsight to aggregate and
analyze the collected events. In addition, these collected events can be exported to on-premises security
information and event management (SIEM) systems for ongoing monitoring.
For more information, see HDInsight.
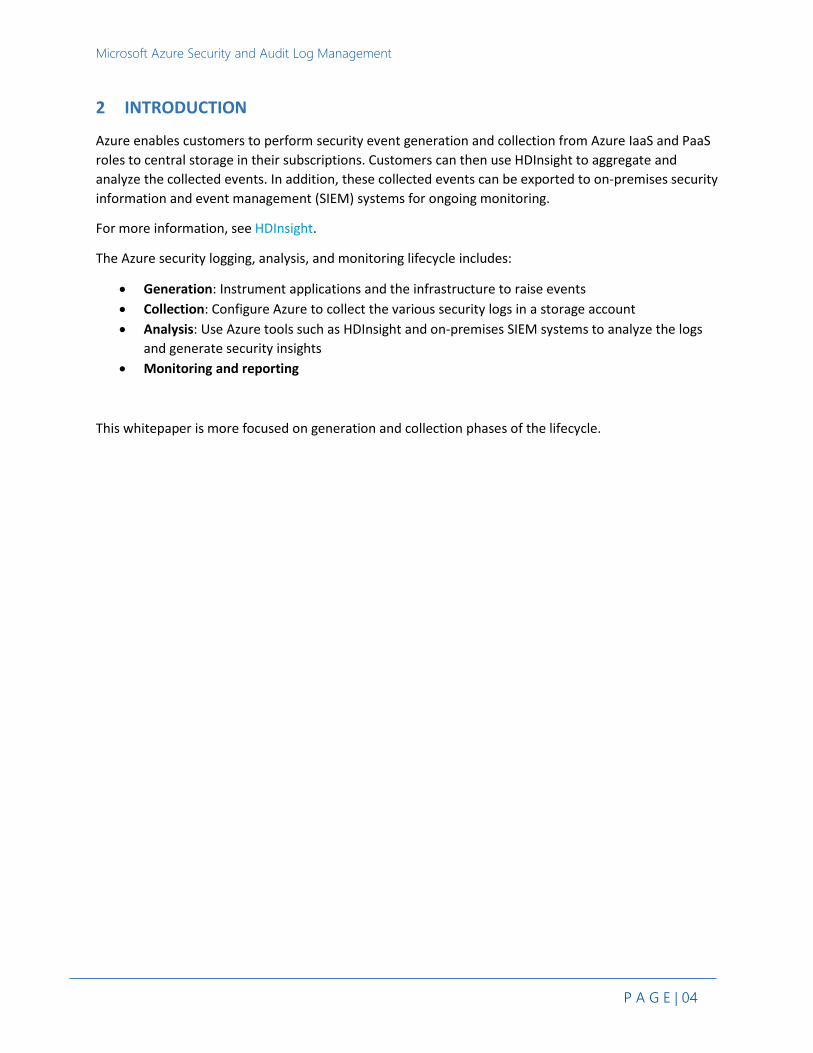
The Azure security logging, analysis, and monitoring lifecycle includes:
Generation: Instrument applications and the infrastructure to raise events
Collection: Configure Azure to collect the various security logs in a storage account
Analysis: Use Azure tools such as HDInsight and on-premises SIEM systems to analyze the logs
and generate security insights
Monitoring and reporting
This whitepaper is more focused on generation and collection phases of the lifecycle.

Microsoft Azure Security and Audit Log Management
P A G E | 05
3 LOG GENERATION
Security events are raised in the Windows Event Log for the System, Security, and Application channels
in virtual machines. To ensure that events are logged without potential data loss, it is important to
appropriately configure the size of the event log. Base the size on the number of events that auditing
policy settings generate and the event collection policies defined. For more information, see Planning
for security audit monitoring and management.
Note When using Windows Event Forwarding (WEF) or Azure Diagnostics (explained in the Log
Collection section) to pull logs from Cloud Services or Virtual Machines, consider the potential impacts
of system outages. For example, if your WEF environment goes down for some time, you either need to
make sure the log size is big enough to account for a longer time duration, or be prepared for possible
log data loss.
For Cloud Services applications that are deployed in Azure and virtual machines created from the Azure
Virtual Machines Gallery, a set of operating system security events are enabled by default. Customers
can add, remove, or modify events to be audited by customizing the operating system audit policy. For
more information, see Security Policy Settings Reference.
You can use the following methods to generate additional logs from operating system (such as audit
policy changes) and Windows components (such as IIS):
Using Group Policy to roll out policy settings for virtual machines in Azure that are domain-
joined.
Using Desired State Configuration (DSC) to push and manage policy settings. For more
information, see Azure PowerShell DSC
Using Service Deployment role startup code to roll out settings for Cloud Services (PaaS
scenario)
Configuring Azure role startup tasks enables code to run before a role starts. You can define a startup
task for a role by adding the Startup element to the definition of the role in the service definition file, as
show in the following example. For more information, see Run Startup Tasks in Azure.
The task file that is to be run as a Startup task (EnableLogOnAudit.cmd in the following example) needs
to be included in your build package. If you are using Visual Studio, add the file to your cloud project,
right-click the file name, click Properties, and then set Copy to output Directory to Copy always.
Example: Role startup task to enable log on and log off audit
<Startup> <Task commandLine="EnableLogOnAudit.cmd" executionContext="elevated" taskType="simple" /> </Startup>
Contents of EnableLogOnAudit.cmd:
@echo off auditpol.exe /set /category:"Logon/Logoff" /success:enable /failure:enable Exit /B 0
Microsoft Azure Security and Audit Log Management
P A G E | 06
Auditpol.exe used in the previous example is a command-line tool included in Windows Server®
operating system that allows you to manage audit policy settings. For more information, see Auditpol.
In addition to generating Windows event logs, various Windows operating system components can be
configured to generate logs that are important for security analysis and monitoring. For example,
Internet Information Services (IIS) logs and http.err logs are automatically generated for web roles, and
they can be configured for collection. These logs provide valuable information that can be used to
identify unauthorized access or attacks against your web role. For more information, see Configure
Logging in IIS and Advanced Logging for IIS – Custom Logging.
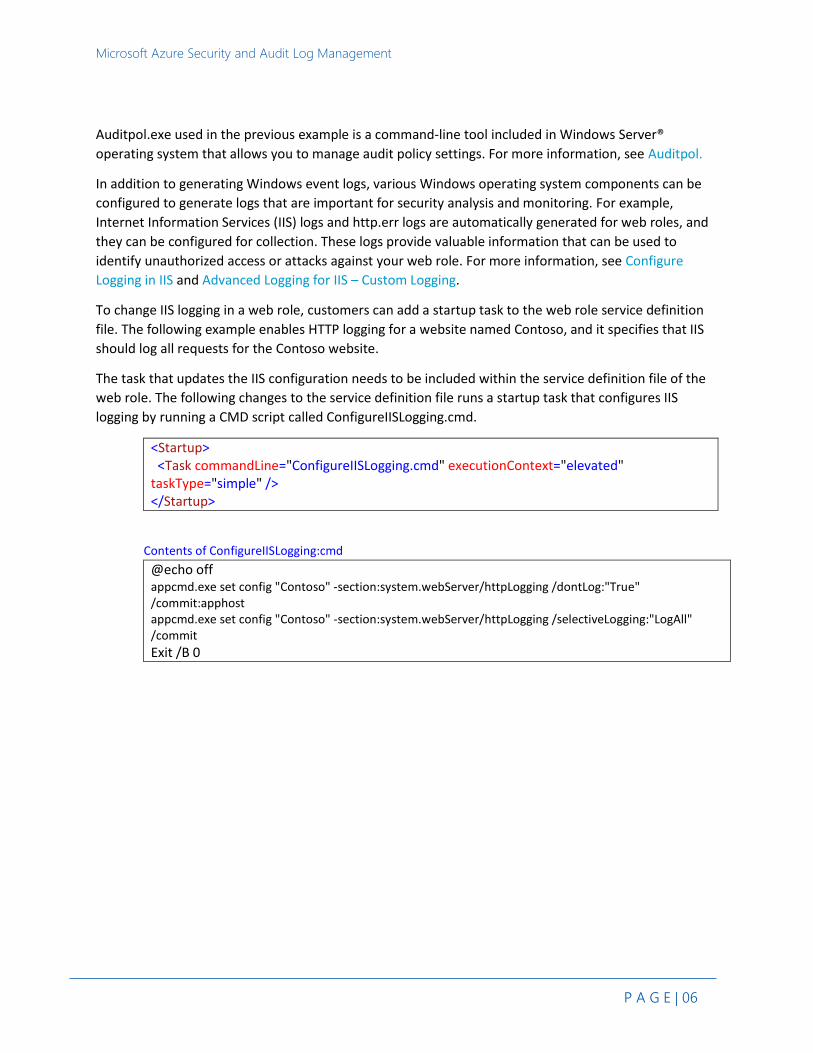
To change IIS logging in a web role, customers can add a startup task to the web role service definition
file. The following example enables HTTP logging for a website named Contoso, and it specifies that IIS
should log all requests for the Contoso website.
The task that updates the IIS configuration needs to be included within the service definition file of the
web role. The following changes to the service definition file runs a startup task that configures IIS
logging by running a CMD script called ConfigureIISLogging.cmd.
<Startup> <Task commandLine="ConfigureIISLogging.cmd" executionContext="elevated" taskType="simple" /> </Startup>
Contents of ConfigureIISLogging:cmd
@echo off appcmd.exe set config "Contoso" -section:system.webServer/httpLogging /dontLog:"True" /commit:apphost appcmd.exe set config "Contoso" -section:system.webServer/httpLogging /selectiveLogging:"LogAll" /commit
Exit /B 0
Microsoft Azure Security and Audit Log Management
P A G E | 07
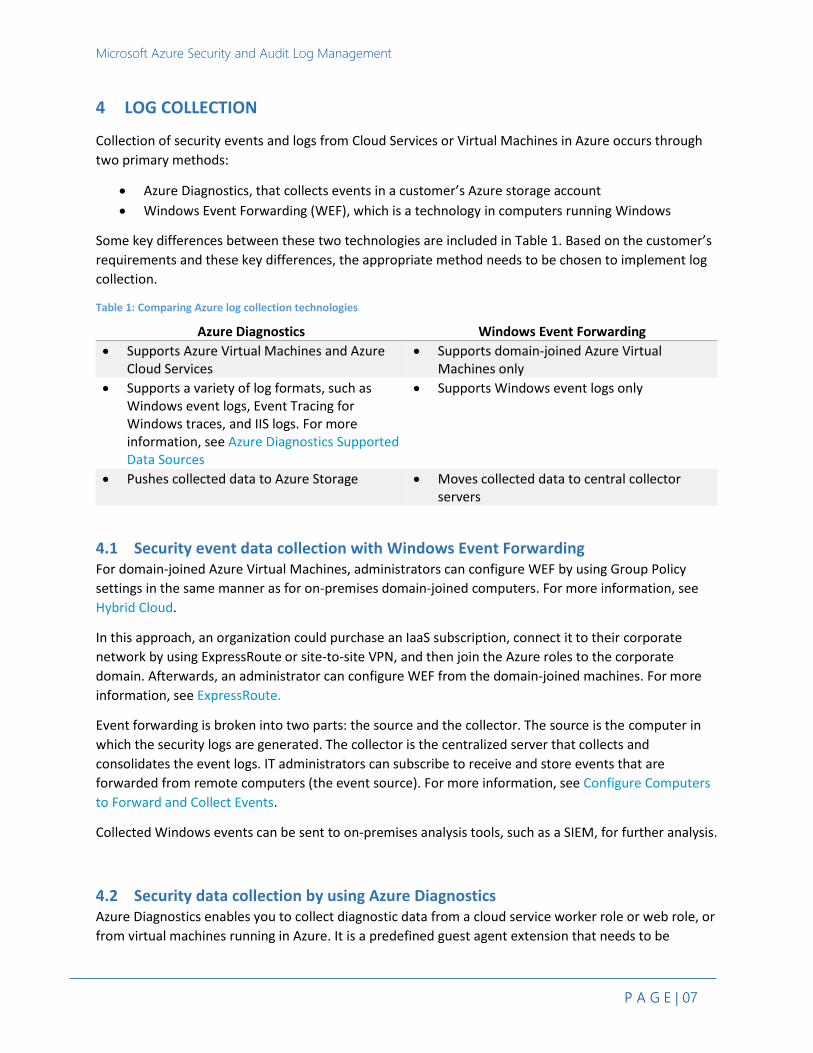
4 LOG COLLECTION
Collection of security events and logs from Cloud Services or Virtual Machines in Azure occurs through
two primary methods:
Azure Diagnostics, that collects events in a customer’s Azure storage account
Windows Event Forwarding (WEF), which is a technology in computers running Windows
Some key differences between these two technologies are included in Table 1. Based on the customer’s
requirements and these key differences, the appropriate method needs to be chosen to implement log
collection.
Table 1: Comparing Azure log collection technologies
Azure Diagnostics Windows Event Forwarding
Supports Azure Virtual Machines and Azure Cloud Services
Supports domain-joined Azure Virtual Machines only
Supports a variety of log formats, such as Windows event logs, Event Tracing for Windows traces, and IIS logs. For more information, see Azure Diagnostics Supported Data Sources
Supports Windows event logs only
Pushes collected data to Azure Storage Moves collected data to central collector servers
4.1 Security event data collection with Windows Event Forwarding For domain-joined Azure Virtual Machines, administrators can configure WEF by using Group Policy
settings in the same manner as for on-premises domain-joined computers. For more information, see
Hybrid Cloud.
In this approach, an organization could purchase an IaaS subscription, connect it to their corporate
network by using ExpressRoute or site-to-site VPN, and then join the Azure roles to the corporate
domain. Afterwards, an administrator can configure WEF from the domain-joined machines. For more
information, see ExpressRoute.
Event forwarding is broken into two parts: the source and the collector. The source is the computer in
which the security logs are generated. The collector is the centralized server that collects and
consolidates the event logs. IT administrators can subscribe to receive and store events that are
forwarded from remote computers (the event source). For more information, see Configure Computers
to Forward and Collect Events.
Collected Windows events can be sent to on-premises analysis tools, such as a SIEM, for further analysis.
4.2 Security data collection by using Azure Diagnostics Azure Diagnostics enables you to collect diagnostic data from a cloud service worker role or web role, or
from virtual machines running in Azure. It is a predefined guest agent extension that needs to be
Microsoft Azure Security and Audit Log Management
P A G E | 08
enabled and configured for data collection. A customer's subscription can include pushing the data to
Azure Storage.
The data is encrypted in-transit (by using HTTPS). The examples provided in this document are using
Azure Diagnostics 1.2. We recommend that you upgrade to version 1.2 or higher for security data
collection. For more information, see Collect Logging Data by Using Azure Diagnostics.
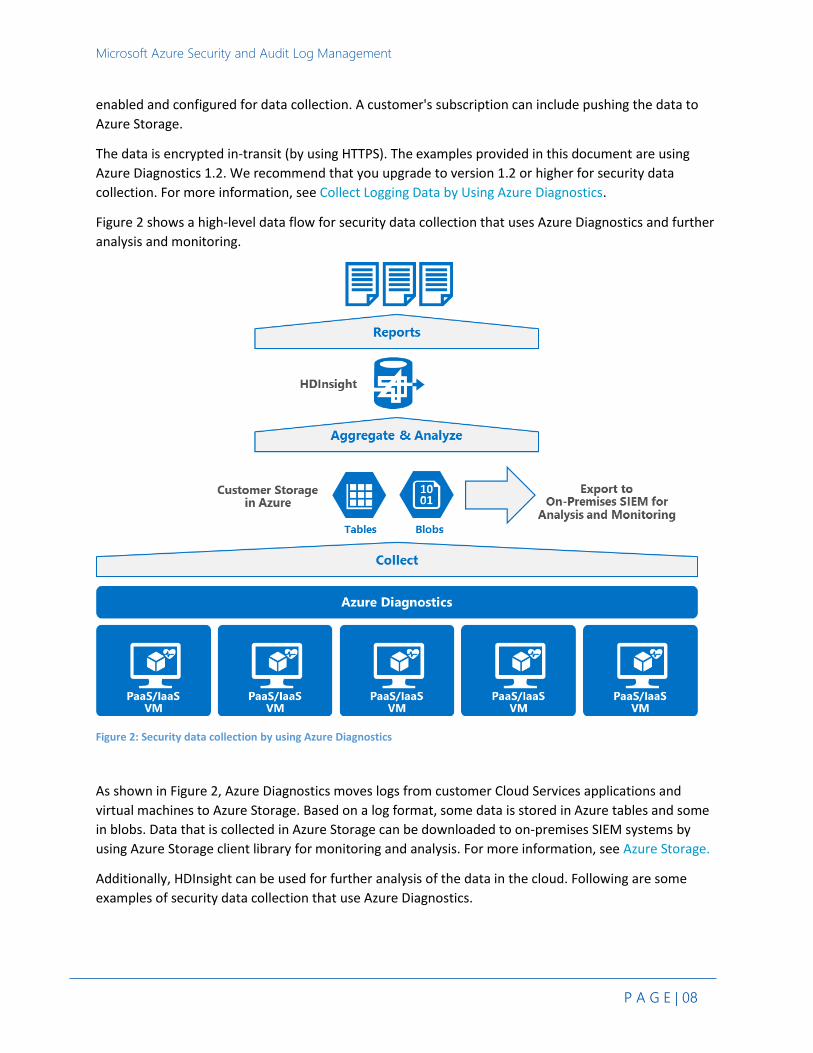
Figure 2 shows a high-level data flow for security data collection that uses Azure Diagnostics and further
analysis and monitoring.
Figure 2: Security data collection by using Azure Diagnostics
As shown in Figure 2, Azure Diagnostics moves logs from customer Cloud Services applications and
virtual machines to Azure Storage. Based on a log format, some data is stored in Azure tables and some
in blobs. Data that is collected in Azure Storage can be downloaded to on-premises SIEM systems by
using Azure Storage client library for monitoring and analysis. For more information, see Azure Storage.
Additionally, HDInsight can be used for further analysis of the data in the cloud. Following are some
examples of security data collection that use Azure Diagnostics.
Microsoft Azure Security and Audit Log Management
P A G E | 09
4.2.1 Security data collection from Azure Virtual Machines by using Azure Diagnostics The following examples use Azure Diagnostics 1.2 and Azure PowerShell® cmdlets to enable security
data collection from Virtual Machines. The data is collected from virtual machines on a scheduled
interval (that is configurable) and pushed to Azure Storage within a customer’s subscription.
In this section, we will walk through two log collection scenarios using Azure Diagnostics:
1. Set up a new instance of security log collection pipeline on a Virtual Machine.
2. Update an existing security log collection pipeline with a new configuration on a Virtual
Machine.
4.2.1.1 Set up a new Instance of Log Collection Pipeline on a virtual machine
In this example, we set up a new instance of a security log collection pipeline that uses Azure
Diagnostics, and we detect logon failure events (event IDs 4624 and 4625) from the virtual machines.
You can implement the following steps from your development environment, or you can use a Remote
Desktop session through Remote Desktop Protocol (RDP) to the node in the cloud.
Step 1: Install the Azure PowerShell SDK
The Azure PowerShell SDK provides cmdlets to configure Azure Diagnostics on Azure Virtual Machines.
The necessary cmdlets are available in Azure PowerShell version 0.8.7 or later. For more information,
see How to install and configure Azure PowerShell.
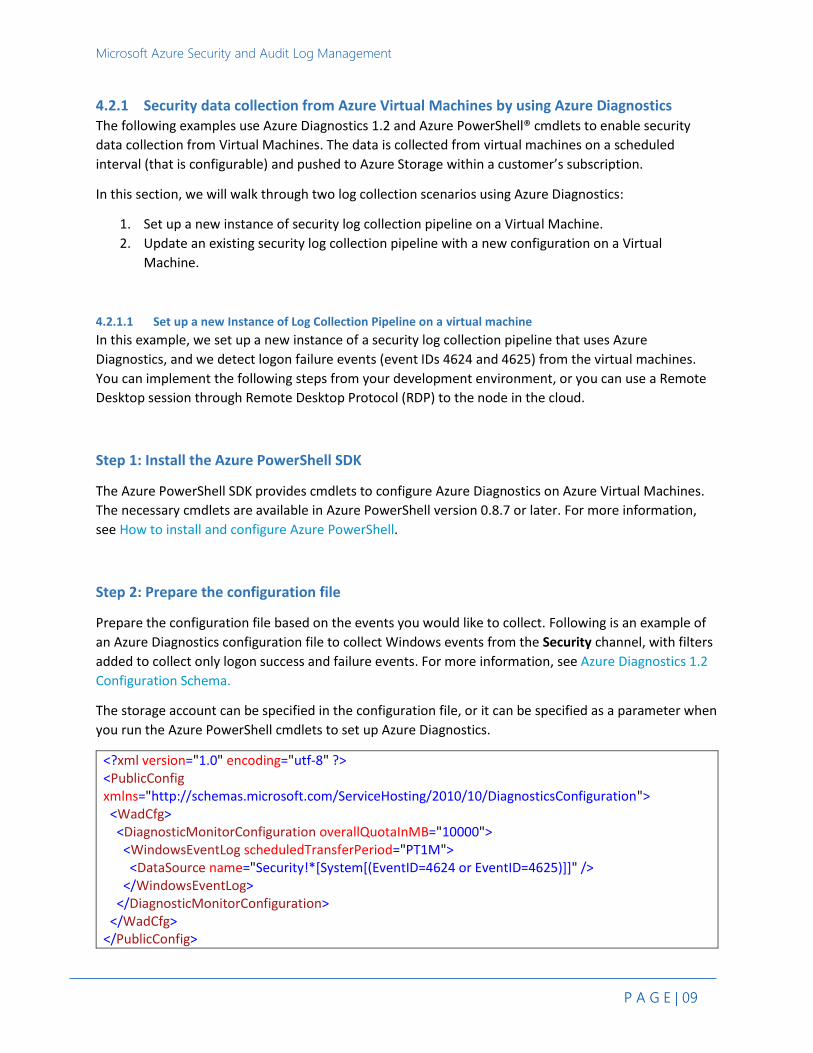
Step 2: Prepare the configuration file
Prepare the configuration file based on the events you would like to collect. Following is an example of
an Azure Diagnostics configuration file to collect Windows events from the Security channel, with filters
added to collect only logon success and failure events. For more information, see Azure Diagnostics 1.2
Configuration Schema.
The storage account can be specified in the configuration file, or it can be specified as a parameter when
you run the Azure PowerShell cmdlets to set up Azure Diagnostics.
<?xml version="1.0" encoding="utf-8" ?> <PublicConfig xmlns="http://schemas.microsoft.com/ServiceHosting/2010/10/DiagnosticsConfiguration"> <WadCfg> <DiagnosticMonitorConfiguration overallQuotaInMB="10000"> <WindowsEventLog scheduledTransferPeriod="PT1M"> <DataSource name="Security!*[System[(EventID=4624 or EventID=4625)]]" /> </WindowsEventLog> </DiagnosticMonitorConfiguration> </WadCfg> </PublicConfig>
Microsoft Azure Security and Audit Log Management
P A G E | 010
When you save the previous contents as an XML file, set the encoding to UTF-8. Table 2 lists some key
attributes to note in the configuration file.
Table 2: Azure Diagnostics configuration file attributes
Attribute Description
overallQuotaInMB The maximum amount of local disk space that can be consumed by Azure Diagnostics (value is configurable).
scheduledTransferPeriod The interval between scheduled transfers to Azure Storage, rounded up to the nearest minute.
Name In WindowsEventLog, this attibute is the XPath query that describes the Windows events to be collected. You can filter the data collection by adding a filter such as Event ID, Provider Name, or Channel.
All Windows Event log data is moved to a table named WADWindowsEventLogsTable. Currently, Azure
Diagnostics does not support renaming the table.
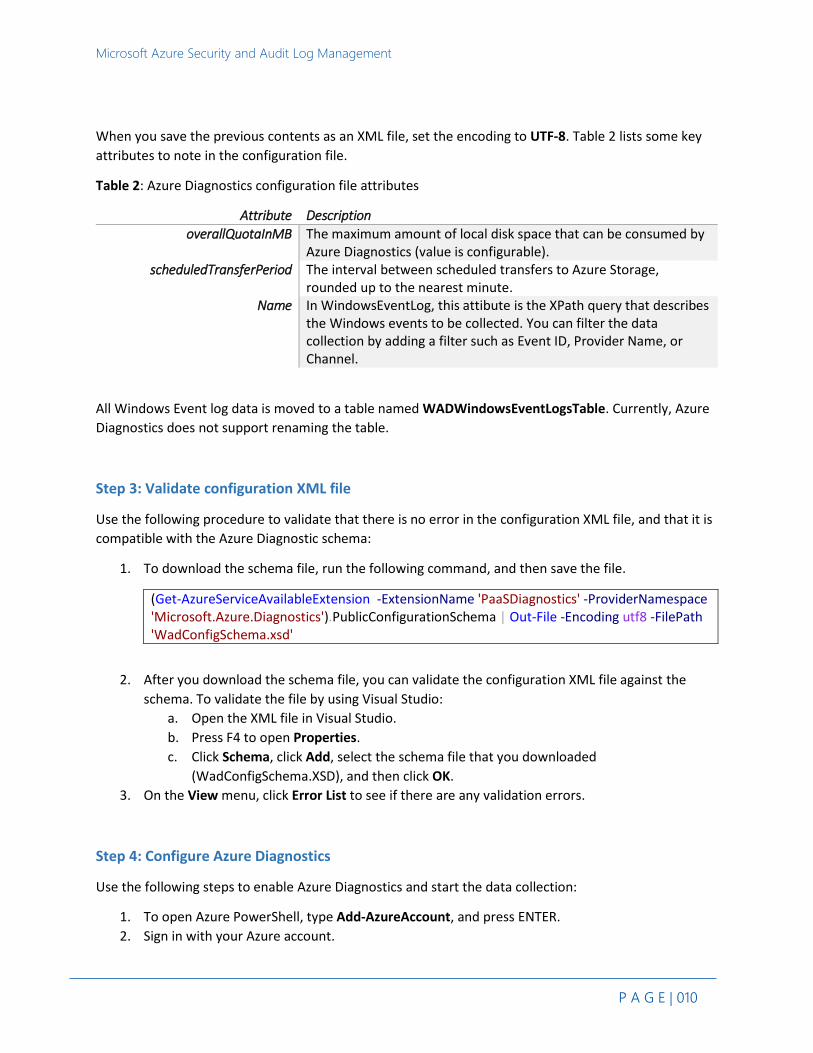
Step 3: Validate configuration XML file
Use the following procedure to validate that there is no error in the configuration XML file, and that it is
compatible with the Azure Diagnostic schema:
1. To download the schema file, run the following command, and then save the file.
(Get-AzureServiceAvailableExtension -ExtensionName 'PaaSDiagnostics' -ProviderNamespace 'Microsoft.Azure.Diagnostics').PublicConfigurationSchema | Out-File -Encoding utf8 -FilePath 'WadConfigSchema.xsd'
2. After you download the schema file, you can validate the configuration XML file against the
schema. To validate the file by using Visual Studio:
a. Open the XML file in Visual Studio.
b. Press F4 to open Properties.
c. Click Schema, click Add, select the schema file that you downloaded
(WadConfigSchema.XSD), and then click OK.
3. On the View menu, click Error List to see if there are any validation errors.
Step 4: Configure Azure Diagnostics
Use the following steps to enable Azure Diagnostics and start the data collection:
1. To open Azure PowerShell, type Add-AzureAccount, and press ENTER.
2. Sign in with your Azure account.
Microsoft Azure Security and Audit Log Management
P A G E | 011
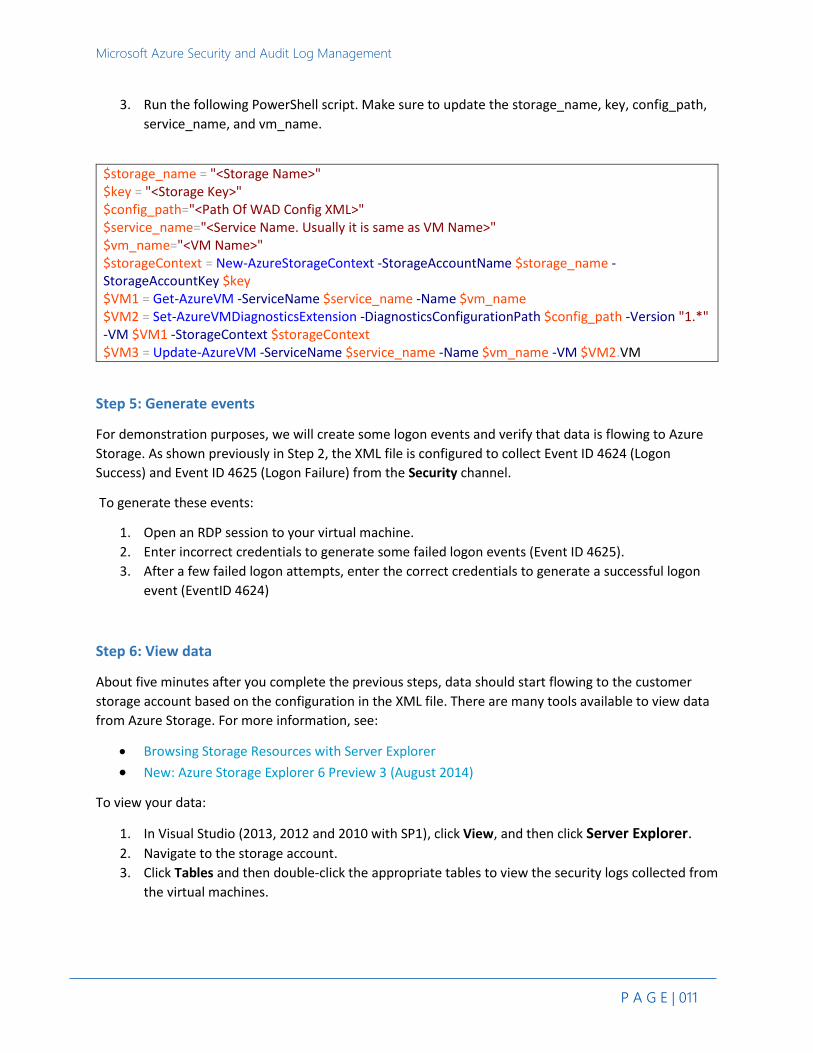
3. Run the following PowerShell script. Make sure to update the storage_name, key, config_path,
service_name, and vm_name.
$storage_name = "<Storage Name>" $key = "<Storage Key>" $config_path="<Path Of WAD Config XML>" $service_name="<Service Name. Usually it is same as VM Name>" $vm_name="<VM Name>" $storageContext = New-AzureStorageContext -StorageAccountName $storage_name -StorageAccountKey $key $VM1 = Get-AzureVM -ServiceName $service_name -Name $vm_name $VM2 = Set-AzureVMDiagnosticsExtension -DiagnosticsConfigurationPath $config_path -Version "1.*" -VM $VM1 -StorageContext $storageContext $VM3 = Update-AzureVM -ServiceName $service_name -Name $vm_name -VM $VM2.VM
Step 5: Generate events
For demonstration purposes, we will create some logon events and verify that data is flowing to Azure
Storage. As shown previously in Step 2, the XML file is configured to collect Event ID 4624 (Logon
Success) and Event ID 4625 (Logon Failure) from the Security channel.
To generate these events:
1. Open an RDP session to your virtual machine.
2. Enter incorrect credentials to generate some failed logon events (Event ID 4625).
3. After a few failed logon attempts, enter the correct credentials to generate a successful logon
event (EventID 4624)
Step 6: View data
About five minutes after you complete the previous steps, data should start flowing to the customer
storage account based on the configuration in the XML file. There are many tools available to view data
from Azure Storage. For more information, see:
Browsing Storage Resources with Server Explorer
New: Azure Storage Explorer 6 Preview 3 (August 2014)
To view your data:
1. In Visual Studio (2013, 2012 and 2010 with SP1), click View, and then click Server Explorer. 2. Navigate to the storage account.
3. Click Tables and then double-click the appropriate tables to view the security logs collected from
the virtual machines.
Microsoft Azure Security and Audit Log Management
P A G E | 012
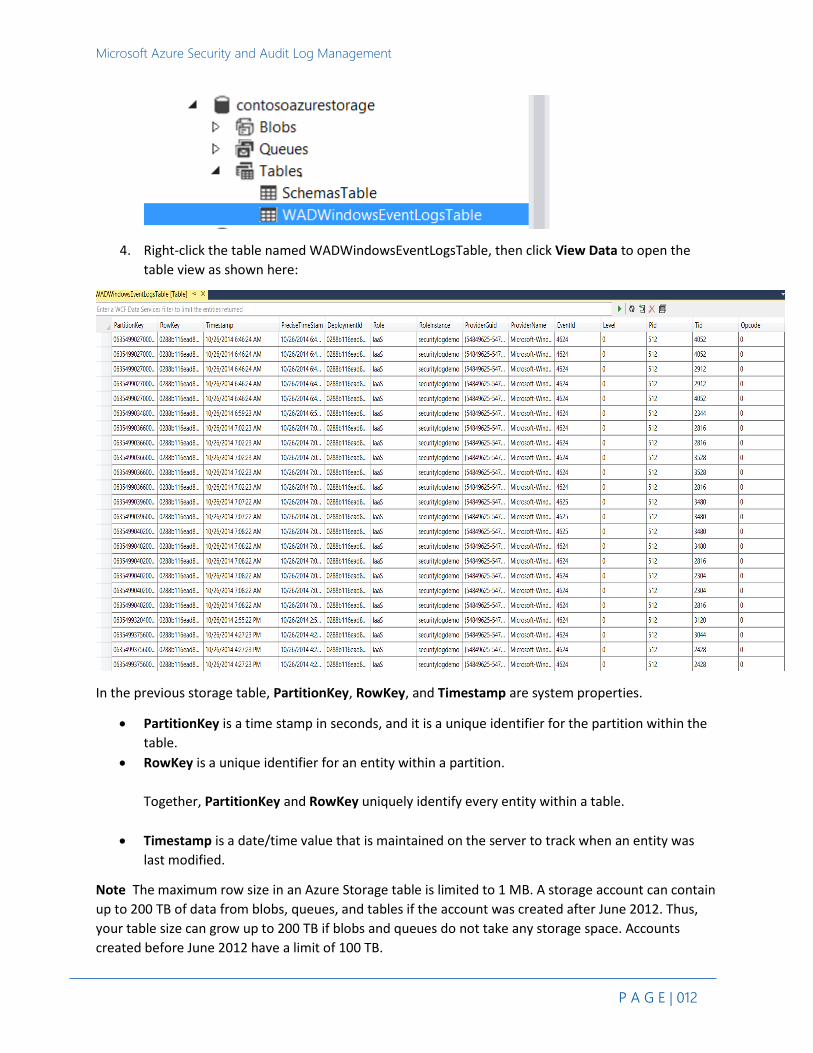
4. Right-click the table named WADWindowsEventLogsTable, then click View Data to open the
table view as shown here:
In the previous storage table, PartitionKey, RowKey, and Timestamp are system properties.
PartitionKey is a time stamp in seconds, and it is a unique identifier for the partition within the
table.
RowKey is a unique identifier for an entity within a partition.
Together, PartitionKey and RowKey uniquely identify every entity within a table.
Timestamp is a date/time value that is maintained on the server to track when an entity was
last modified.
Note The maximum row size in an Azure Storage table is limited to 1 MB. A storage account can contain
up to 200 TB of data from blobs, queues, and tables if the account was created after June 2012. Thus,
your table size can grow up to 200 TB if blobs and queues do not take any storage space. Accounts
created before June 2012 have a limit of 100 TB.
Microsoft Azure Security and Audit Log Management
P A G E | 013
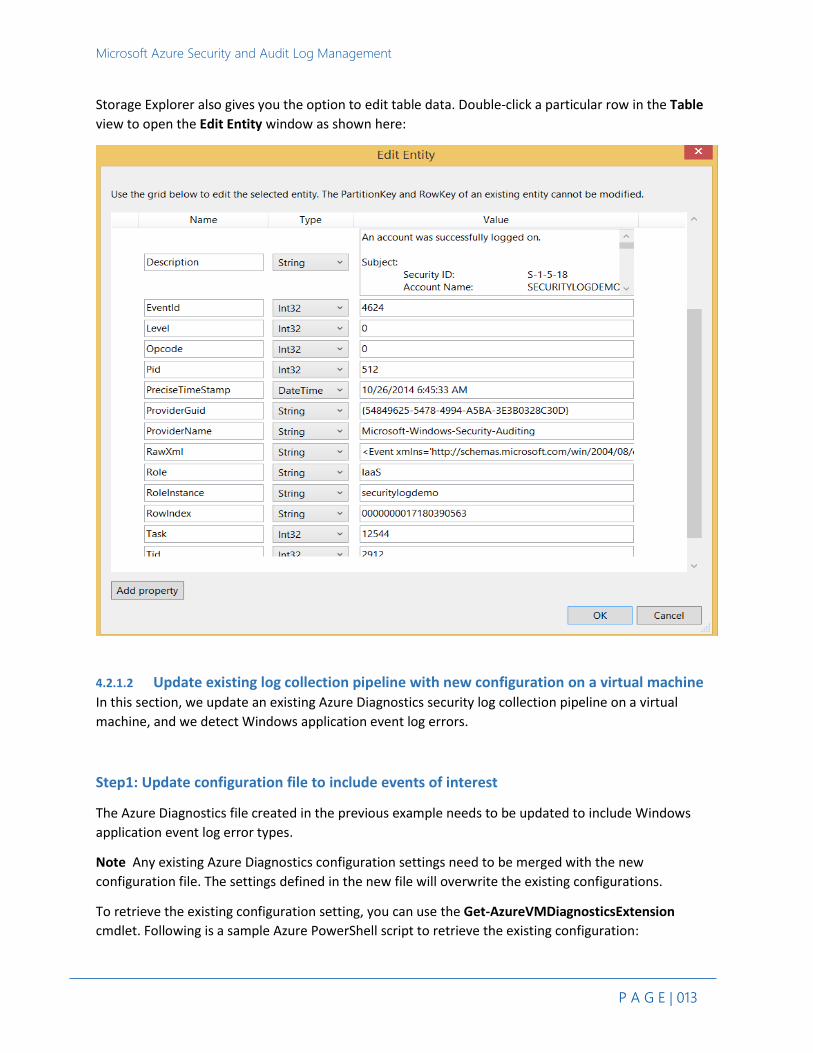
Storage Explorer also gives you the option to edit table data. Double-click a particular row in the Table
view to open the Edit Entity window as shown here:
4.2.1.2 Update existing log collection pipeline with new configuration on a virtual machine
In this section, we update an existing Azure Diagnostics security log collection pipeline on a virtual
machine, and we detect Windows application event log errors.
Step1: Update configuration file to include events of interest
The Azure Diagnostics file created in the previous example needs to be updated to include Windows
application event log error types.
Note Any existing Azure Diagnostics configuration settings need to be merged with the new
configuration file. The settings defined in the new file will overwrite the existing configurations.
To retrieve the existing configuration setting, you can use the Get-AzureVMDiagnosticsExtension
cmdlet. Following is a sample Azure PowerShell script to retrieve the existing configuration:
Microsoft Azure Security and Audit Log Management
P A G E | 014
$service_name="<VM Name>" $VM1 = Get-AzureVM -ServiceName $service_name $config = Get-AzureVMDiagnosticsExtension -VM $VM1 | Select -Expand PublicConfiguration | % {$_.substring($_.IndexOf(':"')+2,$_.LastIndexOf('",')-$_.IndexOf(':"')-2)} [System.Text.Encoding]::UTF8.GetString([System.Convert]::FromBase64String($config))
Update the Azure Diagnostics configuration to collect Windows application event log errors and critical
events as follows:
<?xml version="1.0" encoding="utf-8" ?> <PublicConfig xmlns="http://schemas.microsoft.com/ServiceHosting/2010/10/DiagnosticsConfiguration"> <WadCfg> <DiagnosticMonitorConfiguration overallQuotaInMB="10000"> <WindowsEventLog scheduledTransferPeriod="PT1M"> <DataSource name="Application!*[System[(Level =2)]]" /> <DataSource name="Security!*[System[(EventID=4624 or EventID=4625)]]" /> </WindowsEventLog> </DiagnosticMonitorConfiguration> </WadCfg> </PublicConfig>
Validate the configuration file by using the same steps as shown in Step 3 of Section 4.2.2.1.
Step 2: Update Azure Diagnostics to use new configuration file
Use the Set-AzureVMDiagnosticsExtension and Update-AzureVM cmdlets to update the configuration as shown in Step 4 of Section 4.2.1.1.
Step 3: Verify configuration settings
Run the following command to verify that the configuration settings have been updated:
$service_name="<VM Name>" $VM1 = Get-AzureVM -ServiceName $service_name Get-AzureVMDiagnosticsExtension -VM $VM1
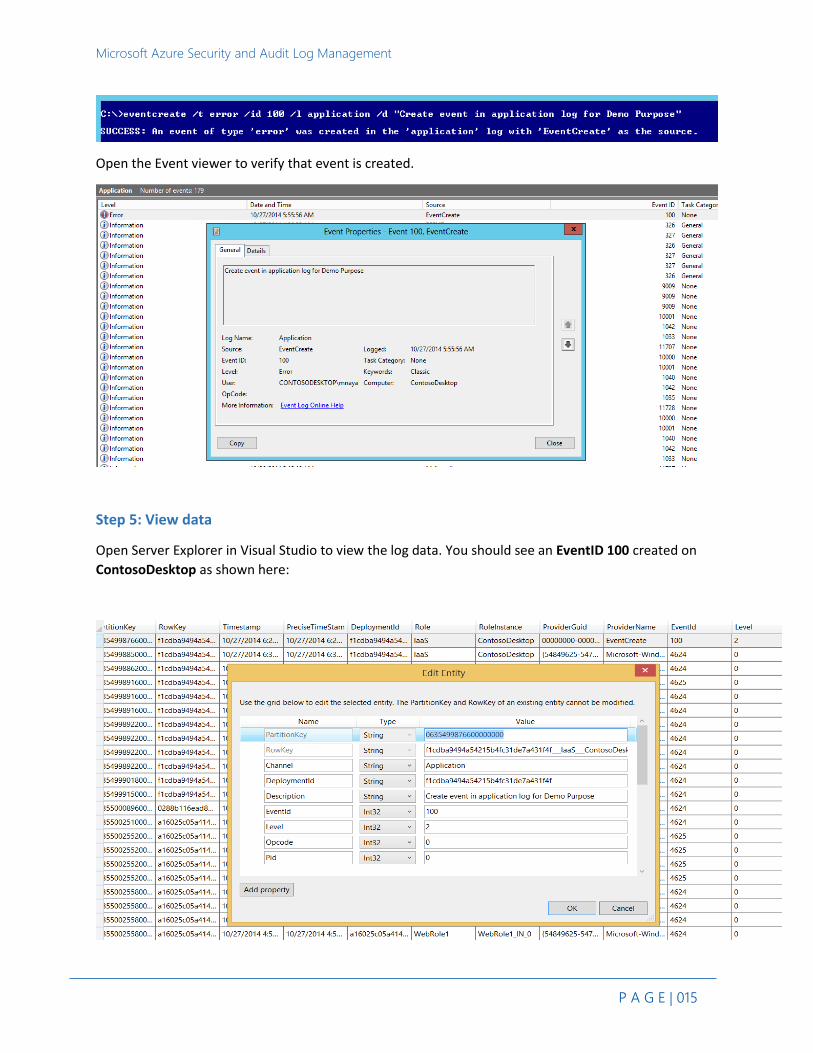
Step 4: Generate events
For this example, run the following command to generate an application event log of the type Error:
eventcreate /t error /id 100 /l application /d "Create event in application log for Demo Purpose"
Microsoft Azure Security and Audit Log Management
P A G E | 015
Open the Event viewer to verify that event is created.
Step 5: View data
Open Server Explorer in Visual Studio to view the log data. You should see an EventID 100 created on
ContosoDesktop as shown here:
Microsoft Azure Security and Audit Log Management
P A G E | 016
4.2.2 Security data collection from Azure Cloud Services by using Azure Diagnostics We will now use Azure Diagnostics to explore the same two log collection scenarios from Azure Cloud
Services as in the previous Virtual Machines (IaaS) section:
1. Set up a new instance of security log pipeline in a cloud service.
2. Update an existing log collection pipeline with a new configuration in a cloud service.
The step-by-step walkthrough in this section includes:
1. Build a cloud service.
2. Configure the cloud service for security log collection by using Azure Diagnostics.
3. Illustrate the generation and collection of security events on the Cloud Service:
a. Add an administrator to a local group with an elevation of privilege. b. New process creation
4. Update an existing log collection pipeline in a cloud service:
a. Enable auditing of host firewall events (as an example of network security events) by
using Auditpol.
b. Configure firewall audit data to be collected, and show the collected events in the
customer storage account.
5. Show Windows security event distribution and spike detection. 6. Configure the collection of IIS logs and verify the data.
All of the events and logs are collected into a customer storage account in Azure. The events can be
viewed and exported by the customer to on-premises SIEM systems. They can also be aggregated and
analyzed by using HDInsight.
4.2.2.1 Set up new instance of log collection pipeline on a cloud service
In this example, we set up a new instance of a security log collection pipeline that uses Azure
Diagnostics, and we detect user addition to a local group, and new process creation events on a cloud
service instance.
Step 1: Create a cloud service (web role) and deploy
1. On your development computer, launch Visual Studio 2013. 2. Create a new cloud service project (our example uses ContosoWebRole). 3. Select the ASP.NET web role. 4. Select the MVC project. 5. In Solution Explorer, click Roles, then double-click the web role (WebRole1) to open the
Properties window. 6. On the Configuration tab, clear the Enable Diagnostics check box to disable the version of
Azure Diagnostics that ships with Visual Studio 2013.
Microsoft Azure Security and Audit Log Management
P A G E | 017
7. Build your solution to verify that you have no errors. 8. Open the file WebRole1/Controllers/HomeController.cs. 9. Add the following method to enable the sample application to log HTTP status code 500 as a
sample IIS log event (this will be used in the IIS example later):
public ActionResult StatusCode500() { throw new InvalidOperationException("Response.StatusCode is 500"); }
10. Right-click the name of the cloud service project, and click Publish.
Step 2: Prepare the configuration file
We will now prepare the Azure Diagnostics configuration file to add the events that can help detect the
following situations:
New user addition to a local group
New process creation
<?xml version="1.0" encoding="UTF-8"?> <PublicConfig xmlns="http://schemas.microsoft.com/ServiceHosting/2010/10/DiagnosticsConfiguration"> <WadCfg> <DiagnosticMonitorConfiguration overallQuotaInMB="25000"> <WindowsEventLog scheduledTransferPeriod="PT1M"> <DataSource name="Security!*[System[(EventID=4732 or EventID=4733 or EventID=4688)]]" /> </WindowsEventLog> </DiagnosticMonitorConfiguration> </WadCfg> </PublicConfig>
Step 3: Validate configuration XML file Follow the same validation process as described in Step 3 of Section 4.2.1.
Microsoft Azure Security and Audit Log Management
P A G E | 018
Step 4: Configure Azure Diagnostics
Run the following Azure PowerShell script to enable Azure Diagnostics (make sure to update the
storage_name, key, config_path, and service_name).
$storage_name = "<storage account name>" $key = " <storage key>" $config_path="<path to configuration XML file>" $service_name="<Cloud Service Name>" $storageContext = New-AzureStorageContext -StorageAccountName $storage_name -StorageAccountKey $key Set-AzureServiceDiagnosticsExtension -StorageContext $storageContext -DiagnosticsConfigurationPath $config_path -ServiceName $service_name
To verify that your service has the latest diagnostic configuration, run the following Azure PowerShell command:
Get-AzureServiceDiagnosticsExtension -ServiceName <ServiceName>
Step 5: Generate events
To generate events:
1. To start a Remote Desktop session to your cloud service instance, in Visual Studio, open Server
Explorer, right-click the role instance, and click Connect using Remote Desktop. 2. Open an elevated command prompt and run the following commands to create a local
administrator account on the virtual machine:
net user contosoadmin <enterpassword> /add net localgroup administrators contosoadmin /add
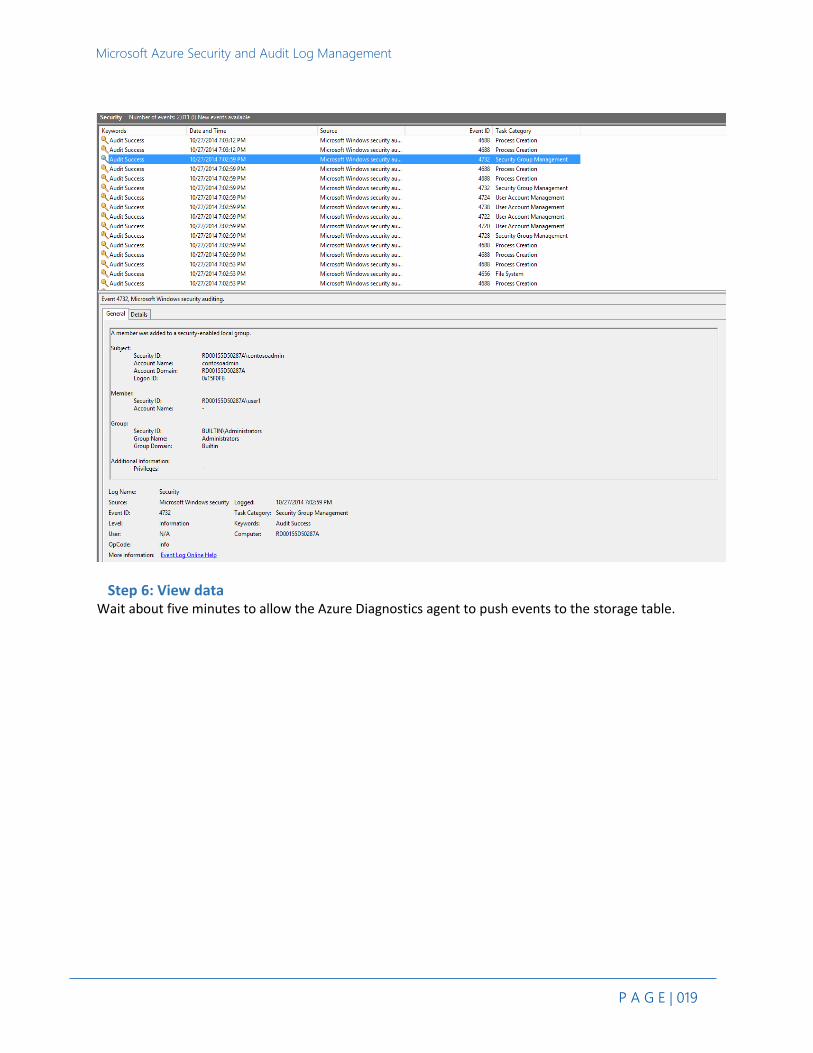
3. Open Event Viewer, open the Security channel, and notice that an Event 4732 has been created,
as shown here:
Microsoft Azure Security and Audit Log Management
P A G E | 019
Step 6: View data Wait about five minutes to allow the Azure Diagnostics agent to push events to the storage table.
Microsoft Azure Security and Audit Log Management
P A G E | 020
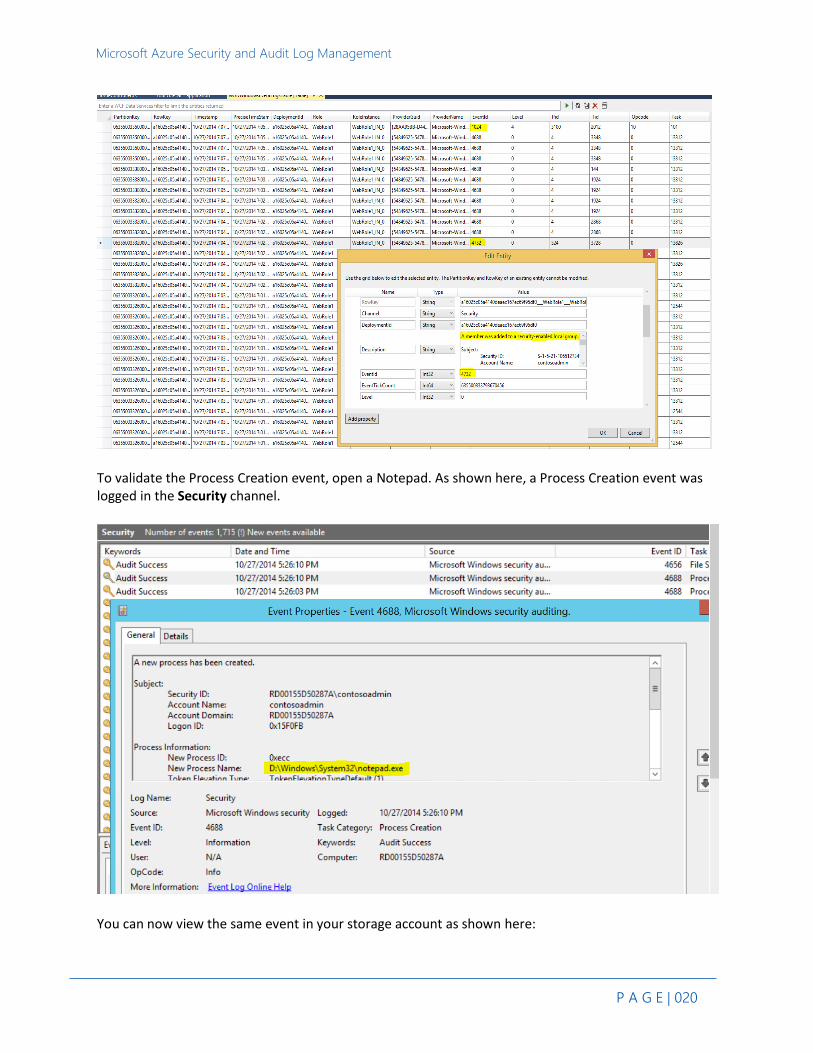
To validate the Process Creation event, open a Notepad. As shown here, a Process Creation event was logged in the Security channel.
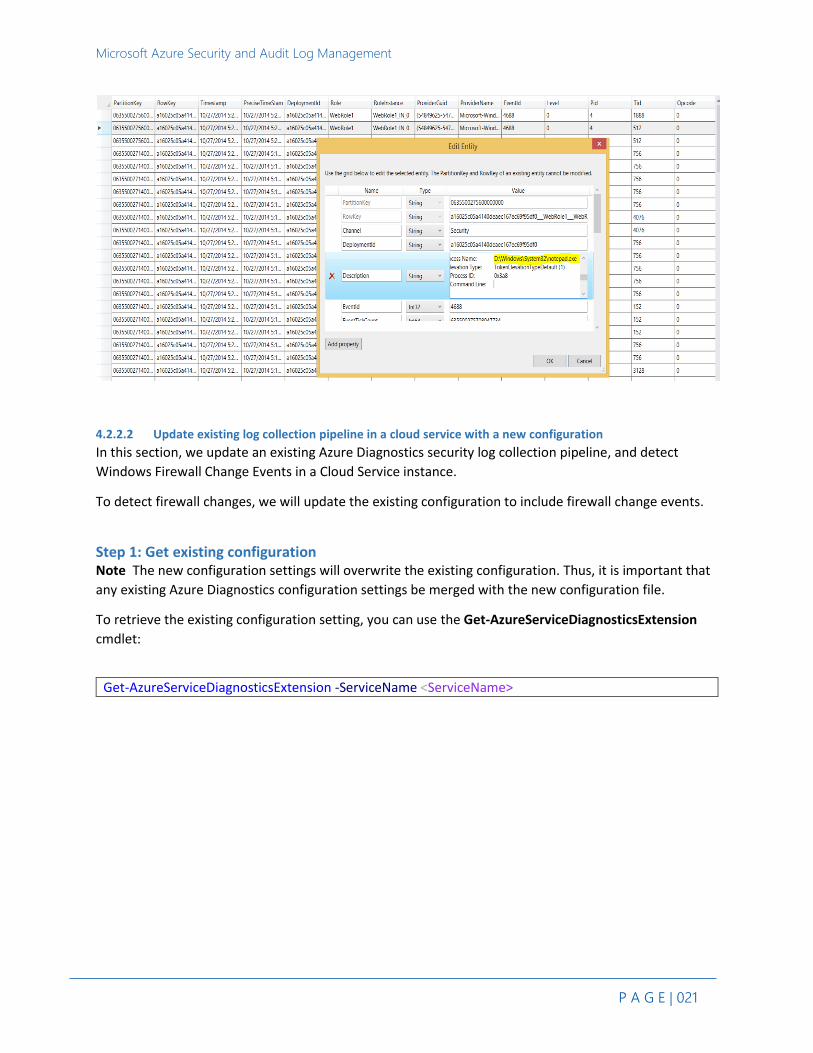
You can now view the same event in your storage account as shown here:
Microsoft Azure Security and Audit Log Management
P A G E | 021
4.2.2.2 Update existing log collection pipeline in a cloud service with a new configuration
In this section, we update an existing Azure Diagnostics security log collection pipeline, and detect
Windows Firewall Change Events in a Cloud Service instance.
To detect firewall changes, we will update the existing configuration to include firewall change events.
Step 1: Get existing configuration Note The new configuration settings will overwrite the existing configuration. Thus, it is important that
any existing Azure Diagnostics configuration settings be merged with the new configuration file.
To retrieve the existing configuration setting, you can use the Get-AzureServiceDiagnosticsExtension
cmdlet:
Get-AzureServiceDiagnosticsExtension -ServiceName <ServiceName>
Microsoft Azure Security and Audit Log Management
P A G E | 022
Step 2: Update configuration XML to include firewall events
<?xml version="1.0" encoding="UTF-8"?> <PublicConfig xmlns="http://schemas.microsoft.com/ServiceHosting/2010/10/DiagnosticsConfiguration"> <WadCfg> <DiagnosticMonitorConfiguration overallQuotaInMB="25000"> <WindowsEventLog scheduledTransferPeriod="PT1M"> <DataSource name="Security!*[System[(EventID=4732 or EventID=4733 or EventID=4688)]]" /> <DataSource name="Security!*[System[(EventID >= 4944 and EventID <= 4958)]]" /> </WindowsEventLog> </DiagnosticMonitorConfiguration> </WadCfg> </PublicConfig>
Validate the XML contents by using the same validation process as described in Step 3 of
Section 4.2.1.
Step 3: Update Azure Diagnostics to use new configuration Run the following Azure PowerShell script to update Azure Diagnostics to use the new configuration
(make sure to update the storage_name, key, config_path, and service_name with your cloud service
information).
Remove-AzureServiceDiagnosticsExtension -ServiceName <ServiceName> -Role <RoleName> $storage_name = "<storage account name>" $key = " <storage key>" $config_path="<path to configuration XML file>" $service_name="<Cloud Service Name>" $storageContext = New-AzureStorageContext -StorageAccountName $storage_name -StorageAccountKey $key Set-AzureServiceDiagnosticsExtension -StorageContext $storageContext -DiagnosticsConfigurationPath $config_path -ServiceName $service_name
To verify that your service has the latest diagnostic configuration, run the following Azure PowerShell command:
Get-AzureServiceDiagnosticsExtension -ServiceName <ServiceName>

Microsoft Azure Security and Audit Log Management
P A G E | 023
Step 4: Enable firewall events
1. Open a Remote Desktop session to your cloud service instance. 2. Open an elevated command prompt and run the following command:
auditpol.exe /set /category:"Policy Change" /subcategory:"MPSSVC rule-level Policy Change" /success:enable /failure:enable
Step 5: Generate events 1. Open Windows Firewall, and click Inbound Rules.
2. Click Add New Rule, and then click Port.
3. In the Local Ports field, type 5000, and then click Next three times.
4. In the Name field, type Test5000, and then click Finish.
5. Open Event Viewer, open the Security channel, and notice that an Event ID 4946 has been created
as shown here:
Microsoft Azure Security and Audit Log Management
P A G E | 024
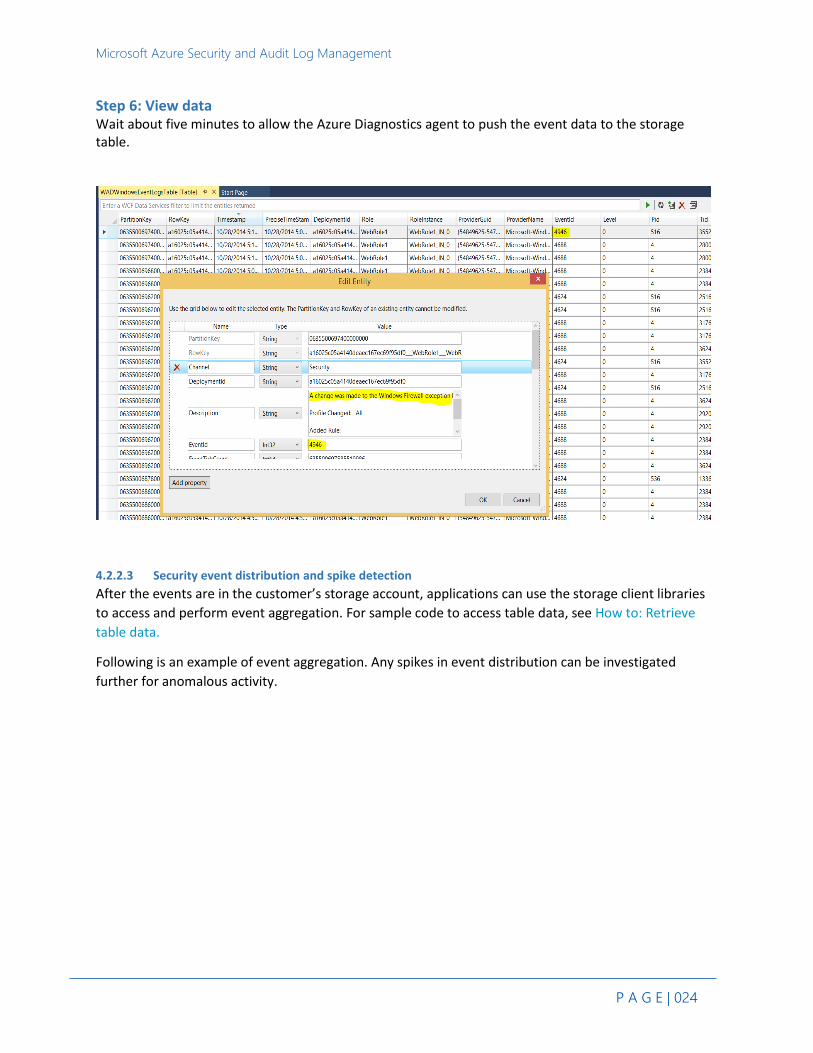
Step 6: View data Wait about five minutes to allow the Azure Diagnostics agent to push the event data to the storage table.
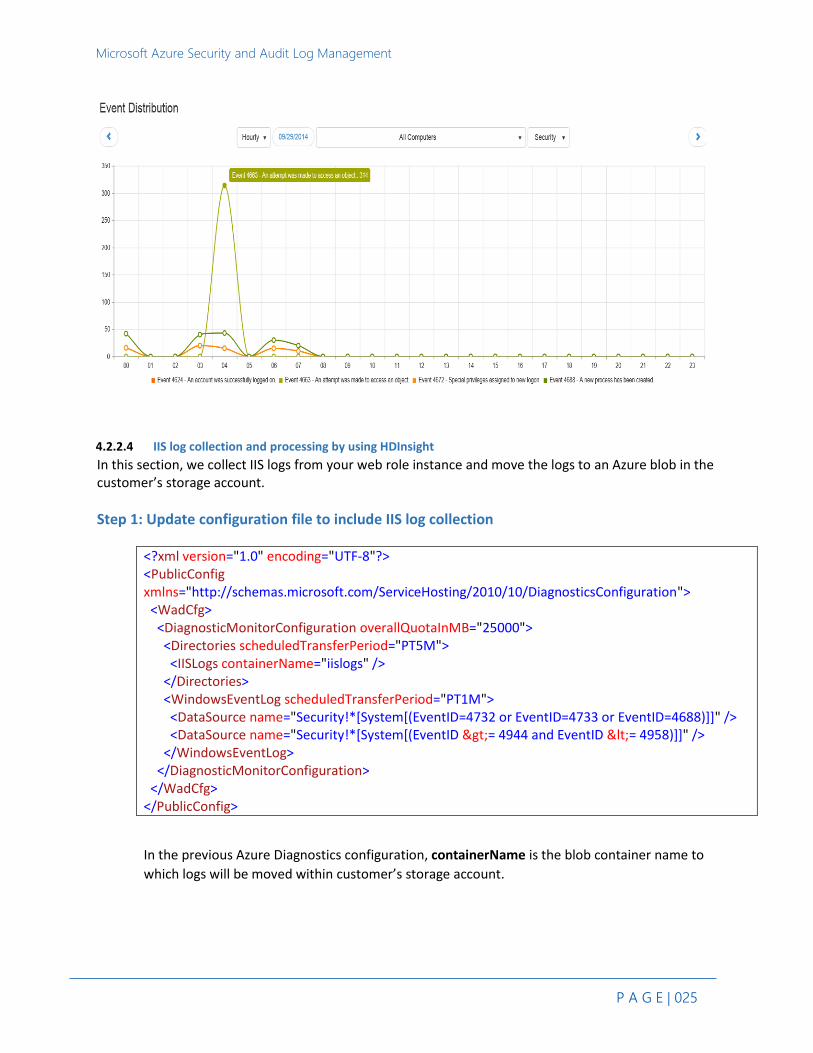
4.2.2.3 Security event distribution and spike detection
After the events are in the customer’s storage account, applications can use the storage client libraries
to access and perform event aggregation. For sample code to access table data, see How to: Retrieve
table data.
Following is an example of event aggregation. Any spikes in event distribution can be investigated
further for anomalous activity.
Microsoft Azure Security and Audit Log Management
P A G E | 025
4.2.2.4 IIS log collection and processing by using HDInsight
In this section, we collect IIS logs from your web role instance and move the logs to an Azure blob in the customer’s storage account.
Step 1: Update configuration file to include IIS log collection
<?xml version="1.0" encoding="UTF-8"?> <PublicConfig xmlns="http://schemas.microsoft.com/ServiceHosting/2010/10/DiagnosticsConfiguration"> <WadCfg> <DiagnosticMonitorConfiguration overallQuotaInMB="25000"> <Directories scheduledTransferPeriod="PT5M"> <IISLogs containerName="iislogs" /> </Directories> <WindowsEventLog scheduledTransferPeriod="PT1M"> <DataSource name="Security!*[System[(EventID=4732 or EventID=4733 or EventID=4688)]]" /> <DataSource name="Security!*[System[(EventID >= 4944 and EventID <= 4958)]]" /> </WindowsEventLog> </DiagnosticMonitorConfiguration> </WadCfg> </PublicConfig>
In the previous Azure Diagnostics configuration, containerName is the blob container name to
which logs will be moved within customer’s storage account.
Microsoft Azure Security and Audit Log Management
P A G E | 026
Validate the XML contents by using the same validation process as described in Step 3 of
Section 4.2.1.
Step 2: Update Azure Diagnostics to use a new configuration Run the following Azure PowerShell script to update Azure Diagnostics to use the new configuration
(make sure to update the storage_name, key, config_path, and service_name with your cloud service
information).
Remove-AzureServiceDiagnosticsExtension -ServiceName <ServiceName> -Role <RoleName> $storage_name = "<storage account name>" $key = " <storage key>" $config_path="<path to configuration XML file>" $service_name="<Cloud Service Name>" $storageContext = New-AzureStorageContext -StorageAccountName $storage_name -StorageAccountKey $key Set-AzureServiceDiagnosticsExtension -StorageContext $storageContext -DiagnosticsConfigurationPath $config_path -ServiceName $service_name
To verify that your service has the latest diagnostic configuration, run the following Azure PowerShell
command:
Get-AzureServiceDiagnosticsExtension -ServiceName <ServiceName>
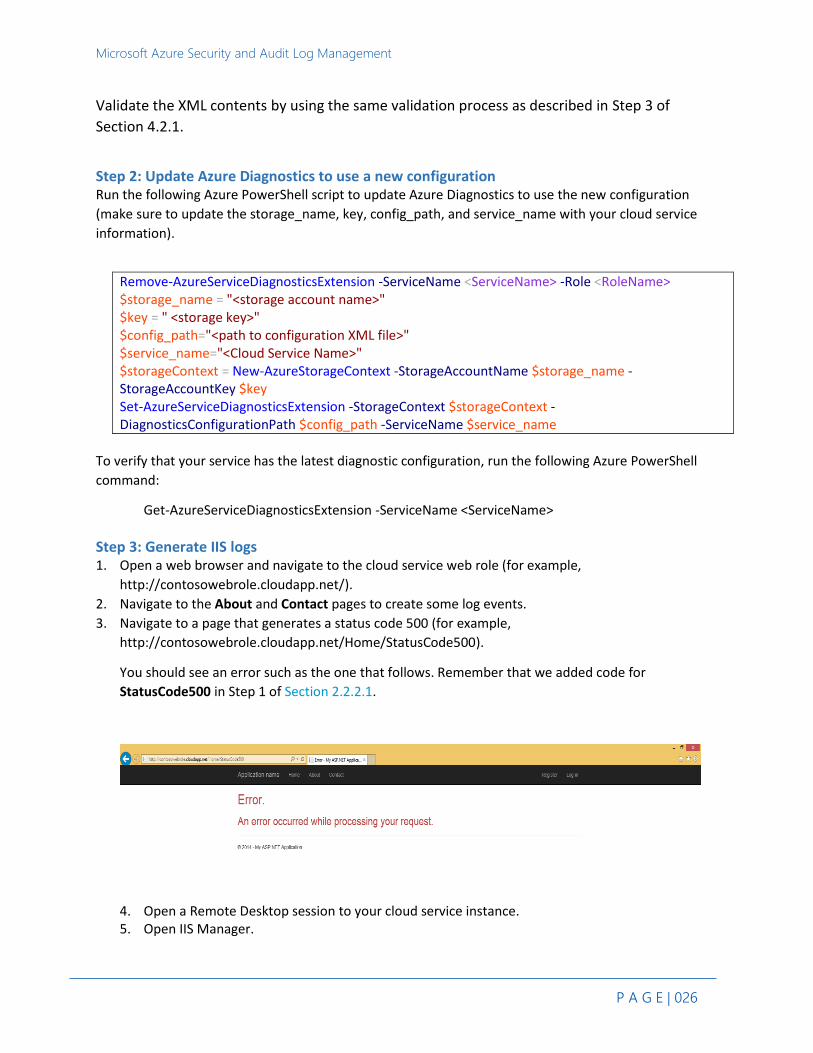
Step 3: Generate IIS logs 1. Open a web browser and navigate to the cloud service web role (for example,
http://contosowebrole.cloudapp.net/).
2. Navigate to the About and Contact pages to create some log events.
3. Navigate to a page that generates a status code 500 (for example,
http://contosowebrole.cloudapp.net/Home/StatusCode500).
You should see an error such as the one that follows. Remember that we added code for
StatusCode500 in Step 1 of Section 2.2.2.1.
4. Open a Remote Desktop session to your cloud service instance. 5. Open IIS Manager.
Microsoft Azure Security and Audit Log Management
P A G E | 027
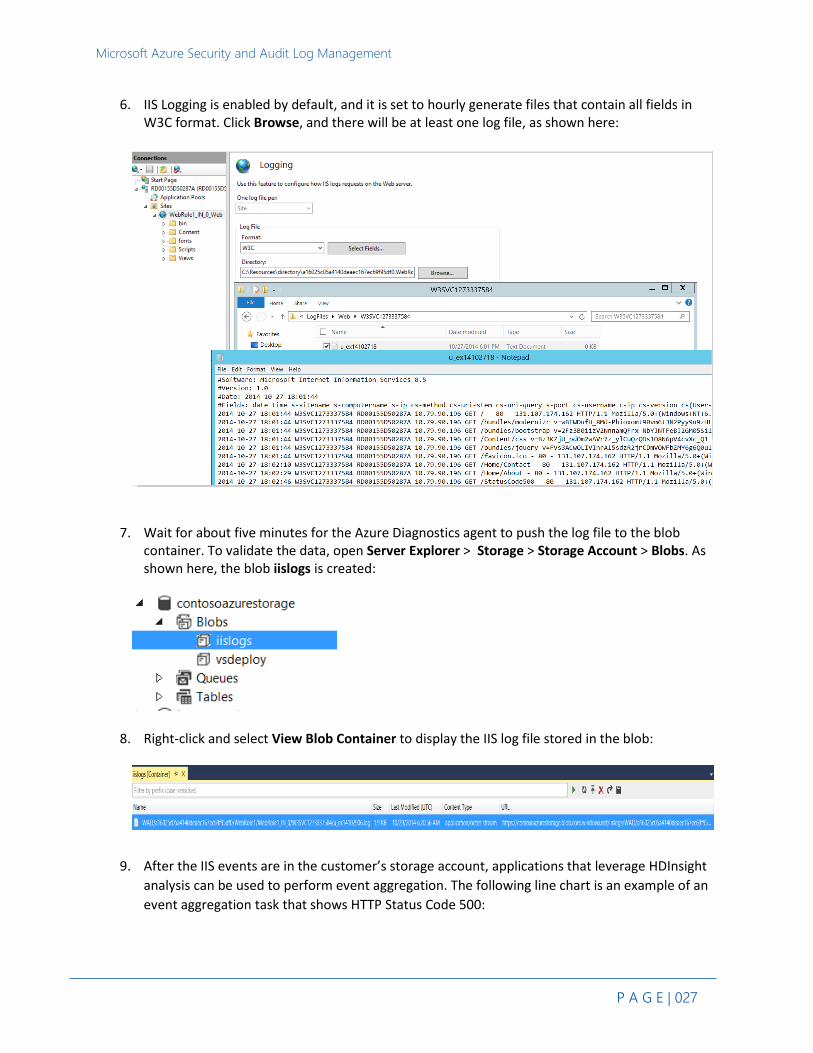
6. IIS Logging is enabled by default, and it is set to hourly generate files that contain all fields in W3C format. Click Browse, and there will be at least one log file, as shown here:
7. Wait for about five minutes for the Azure Diagnostics agent to push the log file to the blob container. To validate the data, open Server Explorer > Storage > Storage Account > Blobs. As shown here, the blob iislogs is created:
8. Right-click and select View Blob Container to display the IIS log file stored in the blob:
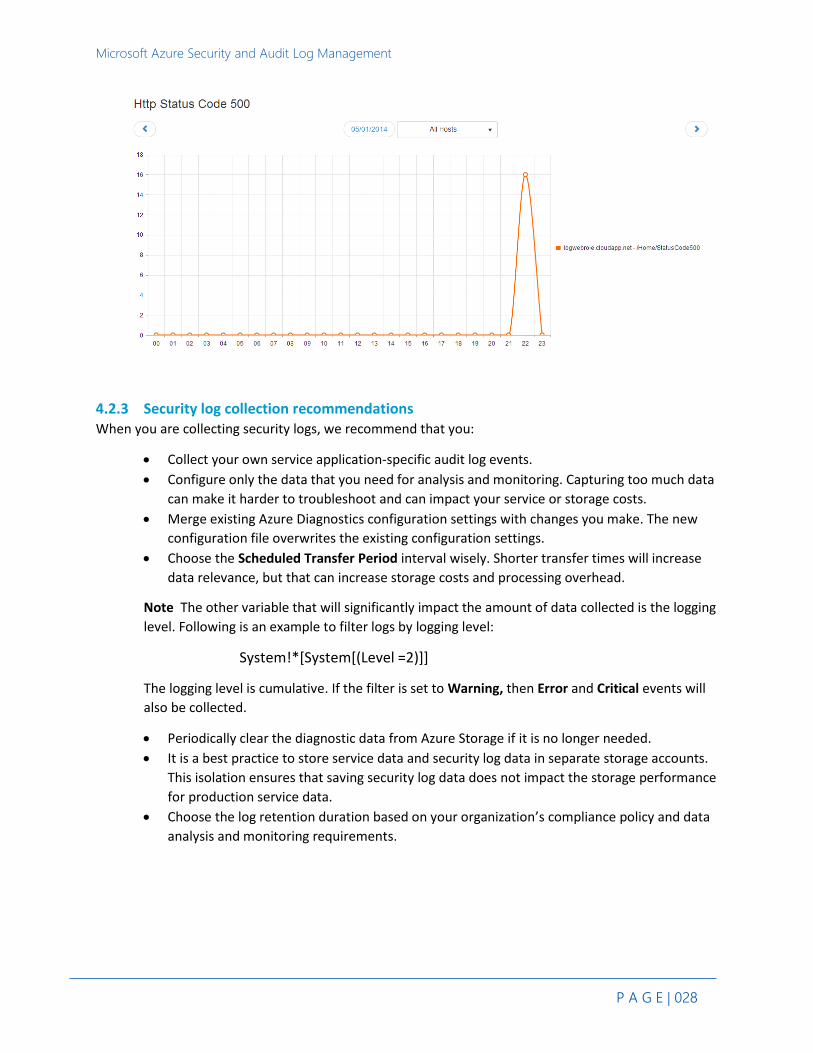
9. After the IIS events are in the customer’s storage account, applications that leverage HDInsight
analysis can be used to perform event aggregation. The following line chart is an example of an
event aggregation task that shows HTTP Status Code 500:
Microsoft Azure Security and Audit Log Management
P A G E | 028
4.2.3 Security log collection recommendations When you are collecting security logs, we recommend that you:
Collect your own service application-specific audit log events.
Configure only the data that you need for analysis and monitoring. Capturing too much data
can make it harder to troubleshoot and can impact your service or storage costs.
Merge existing Azure Diagnostics configuration settings with changes you make. The new
configuration file overwrites the existing configuration settings.
Choose the Scheduled Transfer Period interval wisely. Shorter transfer times will increase
data relevance, but that can increase storage costs and processing overhead.
Note The other variable that will significantly impact the amount of data collected is the logging
level. Following is an example to filter logs by logging level:
System!*[System[(Level =2)]]
The logging level is cumulative. If the filter is set to Warning, then Error and Critical events will
also be collected.
Periodically clear the diagnostic data from Azure Storage if it is no longer needed.
It is a best practice to store service data and security log data in separate storage accounts.
This isolation ensures that saving security log data does not impact the storage performance
for production service data.
Choose the log retention duration based on your organization’s compliance policy and data
analysis and monitoring requirements.

Microsoft Azure Security and Audit Log Management
P A G E | 029
5 EXPORTING SECURITY LOGS TO ANOTHER SYSTEM
You can download blob data by using the Azure Storage Client Library, and then export it to your on-
premises system for processing. For sample code to manage blob data, see How to use Blob Storage
from .NET.
Similarly, you can download security data stored in Azure tables by using the Azure Storage Client
Library. To learn more about accessing data that is stored in tables, see How to use Table Storage from
.NET.
6 AZURE ACTIVE DIRECTORY REPORTS
Azure Active Directory® (Azure AD) includes a set of security, usage, and audit log reports that provide
visibility into the integrity and security of your Azure AD tenant. For example, Azure AD has the
capability to automatically analyze user activity and surface anomalous access, and then make it
available through customer-visible reports.
These reports are available through the Azure Management Portal under Active Directory > Directory.
Some of these reports are free, and others are offered as part of an Azure AD Premium edition. For
more information about Azure AD reports, see View your access and usage reports.
7 AZURE OPERATION LOGS
Logs for key operations related to your Azure subscription resources are also available through the
Operation Logs feature in the Azure management portal.
To view the Operation Logs, open the Azure management portal, click Management Services, and then
click Operation Logs.
Microsoft Azure Security and Audit Log Management
P A G E | 030
8 APPENDIX
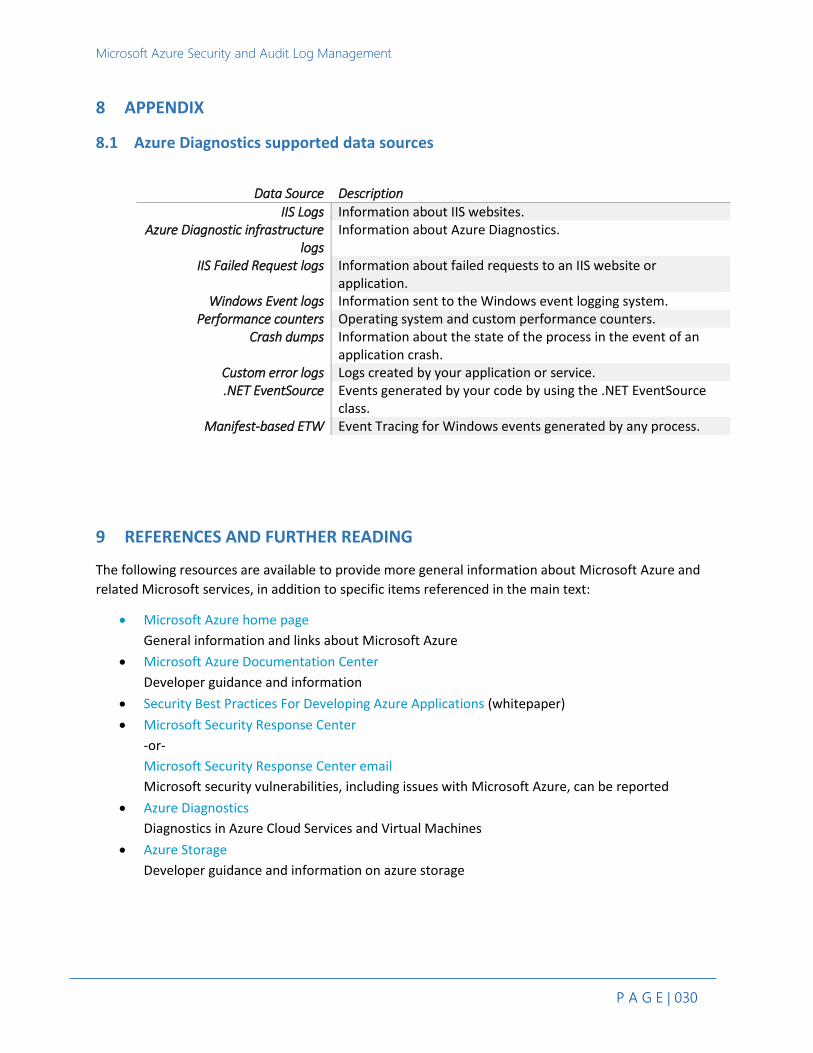
8.1 Azure Diagnostics supported data sources
Data Source Description
IIS Logs Information about IIS websites. Azure Diagnostic infrastructure
logs Information about Azure Diagnostics.
IIS Failed Request logs Information about failed requests to an IIS website or application.
Windows Event logs Information sent to the Windows event logging system. Performance counters Operating system and custom performance counters.
Crash dumps Information about the state of the process in the event of an application crash.
Custom error logs Logs created by your application or service. .NET EventSource Events generated by your code by using the .NET EventSource
class. Manifest-based ETW Event Tracing for Windows events generated by any process.
9 REFERENCES AND FURTHER READING
The following resources are available to provide more general information about Microsoft Azure and
related Microsoft services, in addition to specific items referenced in the main text:
Microsoft Azure home page
General information and links about Microsoft Azure
Microsoft Azure Documentation Center
Developer guidance and information
Security Best Practices For Developing Azure Applications (whitepaper)
Microsoft Security Response Center
-or-
Microsoft Security Response Center email
Microsoft security vulnerabilities, including issues with Microsoft Azure, can be reported
Azure Diagnostics
Diagnostics in Azure Cloud Services and Virtual Machines
Azure Storage
Developer guidance and information on azure storage