microwave dielectric heating of fluids in microfluidic...
TRANSCRIPT

Chapter 8
© 2012 Rao et al., licensee InTech. This is an open access chapter distributed under the terms of the Creative Commons Attribution License (http://creativecommons.org/licenses/by/3.0), which permits unrestricted use, distribution, and reproduction in any medium, provided the original work is properly cited.
Microwave Dielectric Heating of Fluids in Microfluidic Devices
Mulpuri V. Rao, Jayna J. Shah, Jon Geist and Michael Gaitan
Additional information is available at the end of the chapter
http://dx.doi.org/10.5772/53881
1. Introduction
The science of designing, manufacturing and formulating processes involving fluidic devices having dimensions down to micrometers is known as microfluidics. In the last two decades, in the areas of chemical and biochemical sciences, there has been a great interest towards using microfluidic systems, which are popularly known as micro-total analysis systems (μ-TAS) (Manz et al., 2010) or lab-on-a-chip systems. These systems improve analytical performance and also facilitate incorporating various functions of distributed systems on a single-chip instead of having a separate device for each function (Reyes et al., 2002). Temperature control inside microfluidic cells is often required in a variety of on-chip applications for enhanced results, without significantly affecting the temperatures of other building blocks of the μ-TAS. This is a big challenge because the microfluidic devices on the chip need to be selectively heated.
2. Need for heating microfluidic devices
Heat energy has been in use for stimulating (increasing) chemical and biochemical reactions (reaction rates), which otherwise proceed slowly under ambient conditions. Rapid, selective, and uniform heating of fluid volumes ranging from a few microliters to as low as a few nanoliters is vital for a wide range of microfluidic applications. For example, DNA amplification by polymerase chain reaction (PCR) is critically dependent on rapid and precise thermo-cycling of reagents at three different temperatures between 50 °C and 95 °C. Another important and related application, temperature induced cell lysing, necessitates fluid temperature in the vicinity of 94 °C. Other potential applications of heating in a microchip format include organic/inorganic chemical synthesis (Tu., 2011), the investigation of reaction kinetics, and biological studies, to name a few.

The Development and Application of Microwave Heating 180
A number of conduction-based heating approaches have been reported for microfluidic systems that include embedded resistive heaters, peltier elements, or joule heating under electro-osmotic and pressure driven flow conditions. Generally speaking, these methods require physical contact or close proximity between a fluid and a heated surface to transfer heat from that surface to the fluid. In microfluidic devices, when the fluid volumes approach nanoliters, heating rates will be potentially limited by the added thermal mass of the substrates used for heat transfer, and not by the fluid volume. The transfer of heat in such manner can also result in heating of large, undesired substrate areas creating spatial limitations for integration of multiple analysis functions on a single substrate. Additionally, the implementation of these heating methods will be limited to high thermal diffusivity substrates, such as silicon and glass, to maximize heat transfer rates. However, such substrates due to their high cost and complexity of the fabrication process are unsuitable for use in disposable devices. Due to a number of inherent problems associated with contact-mediated temperature cycling, a number of research groups have focused on the development of non-contact heating approaches. These non-contact heating approaches include heating based on hot air cycling, heating based on IR light, laser-mediated heating, halogen lamp-based heating, induction heating, and heating based on microwave irradiation. Hot air based heating method utilizes rapidly switching air streams of the desired temperature and transfer of air onto either polypropylene tubes or glass capillaries. However, the control and application of hot air streams on micro-fabricated integrated systems may not be easily accomplished without an impact on other structures or reactions to be executed on the chip. An inexpensive tungsten lamp as an IR source for rapidly heating small volumes of solution in a microchip format can potentially limit the heating efficiency when applied to microchips with smaller cross-section because the tungsten lamp is a non-coherent and non-focused light source leading to a relatively large focus projection. Other light based heating methods have been demonstrated for microfluidic heating, but such systems, generally speaking, require lenses and filters to eliminate wavelengths that could interfere with the reaction, and accurate positioning of the reaction mixture at the appropriate focal distance from the lamp, which further complicates their implementation.
Microwave dielectric heating is a candidate to address these issues. Most chemical and biochemical species are mainly comprised of water or solvated in water. Water is a very good absorber of microwave energy in the frequency range 0.3 GHz – 300 GHz. Due to this reason, microwave dielectric heating has been exploited for over five decades for heating and cooking fluids and food items containing water molecules (Brodie., 2011). It is also a very good candidate for implementing the heating function in chemical and biochemical reactions as well.
3. Advantages of microwave dielectric heating of microfluidic devices
Advantages of microwave dielectric heating include its preferential heating capability and non-contact delivery of energy. The first advantage stems from the fact that the microwave energy can be directly delivered to the microfluid sample with little or no absorption from

Microwave Dielectric Heating of Fluids in Microfluidic Devices 181
the substrate material (glass, PDMS). The latter advantage facilitates not only the faster heating rates but also the faster cooling rates. These characteristics of microwave dielectric heating allow the application of heat-pulse approaching a delta function, because the heating stops at the moment the microwave power is turned off. This aspect of microwave heating has been used by (Fermer et al., 2003) and (Orrling et al., 2004) for high-speed polymerase chain reactions. The mechanisms of chemical reactions assisted by microwave heating have been found to conform close to theory yielding much more reliable end-products (Zhang et al., 2003; Whittaker et al., 2002; Gedye et al., 1998; Langa et al., 1997). The chemical reactions assisted by the microwave heating have also been performed at much lower temperatures compared to the conventional heating methods (Bengtson et al., 2002; Fermer et al., 2003). Localized microwave heating of fluids has also been demonstrated in the systems having silicon field-effect-transistors in the vicinity of microfluids (Elibol et al., 2008; Elibol et al., 2009).
Enhanced thermo-cycling rates and reduced reaction times compared to conventional techniques can be achieved because of the inertialess nature of microwave heating. Microwave-mediated thermocycling has been demonstrated for DNA amplification application (Kempitiya et al., 2009; Marchiarullo et al., 2007; Sklavounos et al., 2006). Heating can also be made spatially selective by confining the electromagnetic fields to specific regions of the microfluidic network. Further, the dielectric properties of the fluid can also be exploited to deliver heat using signal frequency as a control parameter in addition to the power.
Microwave heating is also very attractive than other alternatives for obtaining spatial temporal temperature gradients for a variety of on-chip applications, including investigation of thermophoresis (Duhr et al., 2006), control and measurement of enzymatic activity (Arata et al., 2005; Mao et al., 2002; Tanaka et al., 2000), investigation of the thermodynamics (Baaske et al., 2007; Mao et al., 2002), chemical separation (Buch et al., 2004; Huang et al., 2002; Ross et al., 2002; Zhang et al., 2007), and of the kinetics characterizing molecular associations (Braun et al., 2003; Dodge et al., 2004). Most techniques for generating on-chip temperature gradients integrate Joule heating elements to conduct heat into microchannels/microchambers (Arata et al., 2005; Buch et al., 2004, Selva et al., 2009). However, temporal control is limited by the heat capacity of the microfluidic device and thermal coupling of the device to the heating elements. It is easy to locally and rapidly generate temperature gradients within microchannels using the pattern of the microwave electric field intensity of a standing wave. The temperature distribution in the channel fluid is proportional to the time average of the square of the microwave electric field, which contains a sinusoidal component in the presence of a standing wave in the transmission line used to couple microwaves to the fluid in the microchannel. Using microwaves, a nonlinear sinusoidally shaped gradient along a channel of several millimeter length with a quasilinear temperature gradient can be achieved within a second (Shah et al., 2010) . The electric field distribution can also be controlled via the operating frequency and input power, which provides flexibility in changing the temperature profile for different specimens, reactions or applications.

The Development and Application of Microwave Heating 182
4. Mechanism of dielectric heating of water-based fluids
4.1. Physical viewpoint
The water molecule has a permanent dipole (the central oxygen atom is electronegative compared to the hydrogen atoms, which are covalently bonded to the oxygen atom) and tends to align itself with an applied electric field. The resistance experienced by the water dipole molecule in aligning itself with the applied electric field is directly related to the intermolecular forces (hydrogen bonds formed by the oxygen atom of one water molecule with the hydrogen atoms of other water molecules) it encounters. Under an influence of sinusoidal applied electric field at a microwave frequency, the ensemble of water dipole molecules experience a rotational torque, in orienting themselves with the electric filed. The rotation caused by the applied field is constantly interrupted by collisions with neighbors. This process results in hydrogen bond breakage and the energy associated with the hydrogen bonds gets translated into the kinetic energy of the rotating dipoles. The higher the angular velocity of a rotating molecule, the higher the angular momentum, and consequently the higher is the kinetic energy. Thus, intermolecular collisions lead to friction, which causes dielectric heating. Dielectric heating is quantified by the imaginary part (ε'') of the dielectric constant. The value of ε'' (also called as the dielectric loss factor) depends on the frequency. As the frequency increases from the MHz range into the GHz range, the rotational torque exerted by the electric field increases; consequently, the angular velocity of the rotating dipoles increases, resulting in an increase in the value of ε''.
4.2. Mathematical viewpoint
The orientation of the molecular dipoles in response to the applied electric field results in the displacement of the charges, which generates displacement current according to the Maxwell-Ampere law. Dielectric heating is the result of interaction between the displacement current and the applied electric field. At low frequencies (MHz range) the molecular dipoles are able to follow the changes in polarity of the applied electric field (E). Thus, even though a displacement current (I) is generated, it is 90˚ out of phase with the applied electric field, resulting in a E × I = E・I・cos(90˚) = 0. Thus, no dielectric heating occurs at such frequencies. At frequencies ≥ 0.5 GHz, the molecular dipoles cannot keep pace with the rapidly changing polarity of the applied electric field, and hence the displacement current acquires a component, I・sinδ, in phase with the applied electric field, where δ is the phase lag between the applied electric field and molecular dipole orientation. This results in a E × I = E・I・cos(90˚- δ) ≠ 0, and consequently dielectric heating. At very high frequencies (≥ 50 GHz), the field changes too quickly for the molecular dipoles to orient significantly, hence, the displacement current component in phase with the applied electric field vanishes. Consequently, the extent of dielectric heating decreases at high frequencies.
4.3. Dependence on ionicity of the fluid and temperature
The absorption depth of microwave power for liquid water in the 2 – 25 GHz region is few to several tens of centimeters (Jackson et al., 1975). Since the microchannels are typically 5 –

Microwave Dielectric Heating of Fluids in Microfluidic Devices 183
10 μm in depth, the electric field intensity is more or less constant throughout the microchannel.
The microwave power absorbed per unit volume in a dielectric material is given by:
2
vP E (1)
where
2 ''of (2)
is the dielectric conductivity of the material, f is the frequency in Hz,εo is the permittivity of free space, ε'' is the imaginary part of the complex permittivity of the material (which depends on the frequency and temperature), and E is the electric field strength in V/m within the material. The ε'' is given by:
2 2'' [ /( ] 1)s (3)
where, τ is the relaxation time, ω = 2πf is the angular frequency, εs is the static field permittivity, and ε∞ is the optical domain permittivity at frequencies much greater than the relaxation frequency (1/τ). The ε'' value first increases with increasing frequency reaching a peak value, before it starts decreasing with a further increase in frequency.
Figure 1. Experimental values for the permittivity and total loss factor as a function of frequency for aqueous KCl solutions of differing ionic concentrations (adapted from Gabriel et al., 1998).
The ions dissolved in water influence the rotational ability of the water molecules that are in close proximity to them. Under an external field, the mobile ions collide with the nearby water molecules transferring their kinetic energy to the water molecules, which is given out

The Development and Application of Microwave Heating 184
as heat. The ε'' value, and consequently the dielectric conductivity, increase with increasing ionic strength at low frequencies, but interestingly, as shown in Figure 1, it becomes relatively independent of ion concentration of solution over a small region of microwave frequencies. Therefore, such solutions can be heated with microwaves of this frequency regime independently of their ionic strength. This characteristic of microwave dielectric heating is particularly advantageous when the salt concentration of the solution is not a known priori as would be a common case.
The water temperature also affects the microwave dielectric heating mechanism. With an increase in the water temperature, the strength and the extent of the hydrogen bonding network in water decreases, because more hydrogen bonds are already broken at a high temperature. This lowers the ε'' value and consequently a decrease in dielectric heating. It means the water becomes a poorer absorber of microwave power with increasing temperature, shifting the ε'' (or σ or Pv) versus frequency curve to higher frequencies. This can be an advantage when a steady temperature needs to be maintained.
4.4. Model of temperature gradient generation in microfluidic channel using microwaves
The power density in a dielectric material upon exposure to alternating electromagnetic field is given by (Woolley et al., 1996)
’’ 20 |€ € |P E (4)
where ω is the angular excitation frequency, €o is the vacuum permittivity, €’’ is the loss factor and E is the electric field strength in volts per meter within the material. For a wave traveling in the z-direction on a transmission line, the phasor representation of the total electric field is the sum of contributions from two separate components, the forward wave and the reflected wave, as described below:
| |, | | jkz j t jkz j p j tE z t E e e E e e e (5)
where jk = α + jβ, E+ is the amplitude of the forward wave, k is the complex propagation constant, E− is the amplitude of the reflected wave, θp is the phase angle between the reflected and forward waves, α is the attenuation constant that describes the rate of decay of microwave power per unit length, z is the distance along the direction of propagation and β is the phase constant (change in phase per unit length) (Ramo et al., 1993). The time averaged power density (P) is proportional to E(z, t)·E(z, t)∗. Thus, we can compute the temperature profile of the fluid in the microchannel according to
2 2 2 2 ( | | )2 2 ,z zpT a e b e abcos z (6)
where T is the fluid temperature due to microwave heating. This simplified model describes several key features of microwave-induced temperature gradients. The dielectric properties

Microwave Dielectric Heating of Fluids in Microfluidic Devices 185
of the transmission medium are non-homogeneous due to the presence of the microchannel resulting in impedance mismatch at the boundaries of the microchannel. The constructive and destructive interference caused by impedance mismatch between the forward and reflected waves at these boundaries generate a standing wave in the electric field and a corresponding stationary temperature field within the microchannel. The shape and magnitude of the temperature field depends on the microchannel geometry, the position of the microchannel relative to the transmission line, the frequency of operation and the input power. The rate of decay of the temperature field is governed by the transmission-line attenuation factor α, which is a function of the transmission-line geometry and the frequency-dependent loss factors of the transmission line materials. Hence, the higher the operating frequency of the microwave electric field, the lower the wavelength of the temperature field producing more peaks and valleys in the spatial temperature profile; and the higher the attenuation constant, the higher the average slope in the temperature field from the front to the back of the channel. Rest of the chapter focuses on macroscale and microscale types of microwave applicators for microfluidic heating applications.
5. Macroscale microwave applicators for microfluidic heating
The use of microwave heating has been demonstrated for a variety of applications including drug discovery, isolation of DNA, and heating of biological cells. Macro-scale microwave applicators were commonly utilized for the delivery of microwave power to sample contained in the plastic reaction tubes.
For microwave heating using a macroscale X-band rectangular waveguide, a slot is machined into one of the walls of the waveguide to allow the introduction of a microfluidic device, as shown in Figure 2. The position of the slot is chosen such that the microchip is placed perpendicular to the direction of the field propagation to maximize coupling of microwave power to fluid. The fluidic channel is micromachined into PMMA substrate using a milling machine. The channel enclosure is accomplished via thermal lamination technique with PP film. A traveling wave tube amplifier, capable of amplifying the input power up to 30 W over the 8 GHz to 18 GHz frequency range, coupled to a microwave signal generator is used to provide the desired microwave power; and a thermocouple inserted into the PMMA substrate is used to measure the fluid temperature. Further details of the system are given elsewhere (Shah, 2007b).
Thermo-cycling of de-ionized water between 60 °C and 95 °C is accomplished by this system, as shown in Figure 3. As mentioned earlier, DNA amplification by PCR relies on temperature cycling of the reaction mixture through three different temperatures between 50 °C and 95 °C. It means this system is suitable for DNA amplification by PCR. When a 20 W microwave power was applied the average heating rate of this system can be as high as 6 °C/s and the cooling rate 2.2 °C/s for a fluid volume of about 70 μL.
These values are better than what was accomplished (Figure 4) using a conventional metal block-based thermocycler whose heating and cooling rates are less than 1.7 °C/s. The results of Figure 3 confirm that microwave heating is a viable alternative for on-chip microfluidic

The Development and Application of Microwave Heating 186
systems, and that it can be used to obtain superior thermocycling rates compared to those obtained with conventional macroscale thermocyclers.
Figure 2. A schematic of an x-band rectangular waveguide heating system.
Figure 3. On-chip thermocycling of de-ionized water obtained using rectangular waveguide heating system.
BOPP film Thickness: ~ 30 µm
Xband waveguide22.7mm ID
10.0mm ID
Wav
egui
de –
to -
coax
Wav
egui
de –
to -
coax
Thermocouple
Propagation of the microwaves
PMMA chip Thickness: 1.7mm
Microfluidic well Depth: 1mm
BOPP film Thickness: ~ 30 µm
Xband waveguide22.7mm ID
10.0mm ID
Wav
egui
de –
to -
coax
Wav
egui
de –
to -
coax
Thermocouple
Propagation of the microwaves
PMMA chip Thickness: 1.7mm
Microfluidic well Depth: 1mm

Microwave Dielectric Heating of Fluids in Microfluidic Devices 187
Figure 4. Thermocycling of de-ionized water using macroscale conventional thermocycler. The PCR tubes were used to hold 25 μL of fluid. The average heating rate for this system was 1.69 °C/s and the cooling rate was 1.36 °C/s.
6. Microscale microwave applicators for microfluidic heating
In recent years the interest in microwave heating lie in integrating miniaturized microwave heating elements, in the form of transmission lines, with microfluidic channels for on-chip heating applications. In one such case, microwave power can be delivered to an elastomeric microfluidic channel via an integrated thin-film coplanar waveguide (CPW) two-conductor transmission line. The rest of the chapter focuses on the work our group has done on this topic in the past 10 years.
6.1. Coplanar waveguide to deliver microwave power to the microfluidic channel
A schematic of a prototype coplanar waveguide (CPW) coupled with the microfluidic channel is shown in Figure 5. Typical dimensions are given in Figure 6. In this system a defined poly(dimethylsiloxane) (PDMS) microfluidic channel is aligned in the gap between the signal plane and one of the ground planes. The reason for choosing the CPW for delivering the microwave power to the microfluidic channel is that it can be easily formed on a substrate using a lift-off lithography process and its planar nature allows for easy integration with the microfluidic channels. The planar geometry also allows fabrication of an array of these devices on a common substrate with high yield, which later can be separated into individual devices.
The dimensions of the center conductor, the gap between the center conductor and the ground plane, the thickness and effective dielectric constant of the substrate determine the characteristic impedance (ZO) and effective dielectric constant of the line. Since, the CPW is a two-conductor transmission line with different dielectrics above and below the device plane, it supports a quasi-TEM mode as well as surface wave modes (Riaziat et al., 1990). The surface wave modes lead to energy transfer from the guided wave into the substrate leading

The Development and Application of Microwave Heating 188
to the attenuation of the guided wave. The CPW design solution is optimized to avoid all potential problems associated with the surface waves in choosing the substrate thickness less than the dielectric substrate wavelength, λd (Riaziat et al., 1990). For the design features shown in Figure 6, the substrate thickness is one-sixth of the λd value. The conductor loss in CPW is inversely proportional to the skin depth and metallization thickness. This leads to increased conductor attenuation with increasing microwave frequency and decreasing conductor thickness, however, the effect of conductor thickness on the conductor attenuation is not as dramatic as that of frequency. For a glass substrate, the dielectric attenuation (Gupta et al., 1996) is very insignificant compared to the conductor attenuation and can be ignored.
Figure 5. Schematic of coplanar waveguide (in orange) coupled with the microchannel structure (in pink)
Figure 6. Schematic of a cross-section of a coplanar waveguide (CPW) transmission line integrated with a poly(dimethylsiloxane) (PDMS) microchannel for microwave dielectric heating of fluids. The CPW conductors are 1.5 cm long; the signal conductor is 140 μm wide and it is separated by a 25 μm gap on either side from 300 μm wide ground conductors. The microchannel consists of a trapezoidal cross section defined by a silicon template and it is 7 μm deep, 25 μm wide at the bottom, and 3.62 mm long.

Microwave Dielectric Heating of Fluids in Microfluidic Devices 189
The CPW conductors are formed of Cr/Au on the substrate using standard lift-off lithography metallization process. Thickness of the CPW conductors is increased by electroplating of Au. A trapezoidal cross-section PDMS microfluidic channel is defined by using a silicon template. The PDMS is poured into the silicon master and cured for 4 hours at 65 ˚C for this purpose. The PDMS structure is then detached from the silicon master and holes are punched into the PDMS structure for creating fluid inlet and outlet for the channel. The PDMS microchannel is then carefully aligned and attached by contact adhesion in the lateral direction over the gap between the signal-ground metal lines of the CPW. For maximum electric field coupling, the width of the PDMS microchannel is made equal to the CPW signal-ground metal spacing. According to computer simulations about 50% of the electric field is contained within 10 microns from the CPW surface. Hence, the depth of the microchannel should be designed accordingly to couple as much of the electric field as possible to the microfluid in the channel.
Microwave power is applied at the input port of the CPW using a signal generator. The frequency of the microwaves can be varied for optimum coupling of the microwave power to the microfluid. S-parameters of the system are measured for empty channel case and also for liquids of varying ionic concentrations. The fluid temperature is obtained by measuring the temperature dependent fluorescence intensity of a dilute fluorophore dye added to the fluid and comparing it to the calibrated fluorescence intensity at a known temperature. Rhodamyne B is used as the dye solution for this purpose.
6.2. Integrated microfluidic device for generating microwave-induced temperature gradients using a microstrip waveguide configuration
Figure 7 shows a cross-sectional schematic and a picture of the microwave-heated microfluidic device for generating temperature gradients. The devices are fabricated using an adhesive copper tape on cyclic olefin copolymer (COC) using photolithographic procedures. A CNC milling machine is used to cut the substrate material to precise chip dimensions and to carve out the microchannel and the fluidic access ports. For the device in Figure 7 the microchannel is 340 μm wide, 7 mm long and is machined all the way through a 300 μm thick COC substrate. The channel is positioned 1 cm away from the front of the device. The signal line is 370 μm wide and 5 cm long. The signal line and the ground plane are patterned on the copper tape after the tape is fixed on the top and bottom surfaces of the COC substrate. The tape has a 40 μm thick acrylic adhesive on a 35 μm thick copper foil. The acrylic adhesive serves as a cover plate for the microchannel and isolates the fluid from the copper electrodes. A slit, 100 μm wide and 2 cm long, is formed in the ground plane to allow optical detection of the fluid for temperature measurement. The dimensions of the microchannel, the transmission-line and the slit were determined from electromagnetic simulations performed using Sonnet Software. The slit is designed to run parallel to the microchannel, and it is positioned in the middle of the microchannel (Figure 7(b)) with a photolithographic process. Such positioning allows for spatially resolved, optical fluid-temperature measurements throughout the length of the microchannel and laterally in the middle of the channel. Two 2.4 mm end-launch connectors are mounted on the device

The Development and Application of Microwave Heating 190
(Figure 7(a)) to convert from the microstrip geometry to the coaxial geometry of the test equipment.
Figure 7. (a) A picture of the integrated microfluidic device for generating microwave-induced temperature gradients. (b) A cross-sectional view of the microwave heating device.
The method described here for fabricating conductors is easily transferable to other microfluidic substrates such as glass and PDMS. Furthermore, the one-step method for conductor fabrication obviates the need for electroplating, which is typically required following thin-film deposition to achieve sufficient conductor thickness. This method also provides easy bonding of the top and bottom cover plates to create enclosed channel structures, which has proven challenging for thermoplastic materials (Shah et al., 2006). In contrast to previously published reports (Shah et al., 2007a; Booth et al., 2006; Facer et al., 2001), the transmission line structure isolates the fluid from the metal conductors making these devices suitable for a variety of biochemical applications in which reagent contamination due to electrolysis or corrosion is undesirable.
6.3. Temperature measurement equations for Rhodamine B dye solution in the context of microfluidics
The temperature-sensitive nature of molecular fluorescence is suitable for measurement of temperature in small volume fluids like in microfluidic channels (Lou et al., 1999; Gallery et al., 1994; Sakakibara et al., 1993; Ali et al., 1990; Kubin et al., 1982). The temperature measurement is based on measuring fluorescence intensity ratios. The fluorescence intensity is typically measured at a known reference temperature, which is later used to normalize the intensity measured after heating the medium to an unknown temperature. The temperature is extracted by substituting the normalized intensity into a calibration curve. For lab-on-a-chip application,

Microwave Dielectric Heating of Fluids in Microfluidic Devices 191
the use of dilute solutions of a temperature-sensitive fluorescent dye, particularly Rhodamine B (RhB), has become very popular for optical measurement of temperature distributions. The RhB is a water-soluble fluorescent compound with an absorption peak at 554 nm, an emission peak at 576 nm, and a temperature dependent fluorescence quantum yield (Ferguson et al., 1973). In addition to high temperature sensitivity, its other properties such as negligible pressure sensitivity and nominal pH-independent absorption (above a pH value of 6) are attractive for measuring temperatures in microfluidic channels with high spatial and temporal resolution (Ross et al., 2001). The RhB solution has been employed: to examine in-channel temperature and flow profiles at a T-shaped microchannel intersection during electrokinetic pumping (Erickson et al., 2003) and to characterize the temperature field resulting from resistive microheaters embedded in a poly(dimethylsiloxane) (PDMS) microchip (Fu et al., 2006). Even though the RhB has been primarily used for temperature measurement in aqueous environment, the absorbed RhB dye molecules in a PDMS thin film can be used for whole chip temperature measurement (Samy et al., 2008). The calibration equations used for computing temperature using fluorescent dyes relate the fluorescence intensity at an unknown temperature to the intensity at only one particular reference temperature. Such relations are not directly usable to applications requiring a different reference or initial temperature. The existing single-dye calibration equations have been generalized for extending their use to fluorescence intensity data normalized to reference temperatures other than those for which the original calibration equations were derived (Shah et al., 2009). Two methods have been described in detail: one is approximate, while the other, based on solution of a cubic equation, is an accurate mathematical treatment that does not incur errors beyond those already inherent in the calibration equations.
6.3.1. Generalization of RHODAMINE B temperature equations
Let S(T) represent the signal received from a fluorescence detection system observing a small volume of fluorescent species at temperature T and let IRT(T) = S(T)/S(RT) represent the fluorescence intensity ratio normalized to the signal measured at nominal room temperature (RT).
[RhB](mmol/L)
[buffer](mmol/L) pH A0
(°C) A1
(°C) A2
(°C) A3
(°C) T0
(°C) RT (°C)
Ross et al. 0.1 20 9.4 132 -250 220 -79 23 22 Fu et al. 0.05 25 8.5 149.15 -317.84 323.41 -131.84 22.88 23.5 Samy et al. 1.0,5.0 none N/A 141.53 -250.25 228.02 -96.904 22.39 23
Table 1. Properties of Different RhB Solutions Used by Three Different Authors for Fluorescence-Based Temperature Measurements.
The fluorescence intensity acquired from an image captured at an elevated temperature, S(T), is normalized by the intensity acquired from an image captured at nominal room temperature, S(RT), to obtain IRT(T) = S(T)/S(RT). The temperature is then obtained by a least-squares adjustment of the constants in the equation

The Development and Application of Microwave Heating 192
2 30 1 2 3 RT RT RTT A A I T A I T A I T (7)
to fit the measured IRT(T) for different values of T.
Table 1 includes the values of A0 to A3 that were reported by Fu et al., 2006; Ross et al., 2010; and Samy et al., 2008. The temperatures T0 given by eqn. 7 when IRT(T) = 1.0, as well as the RT used by each of the authors for normalization purposes are also shown in Table 1. These temperatures differ slightly from the normalized temperatures used by the different authors because their calibration equations were not constrained to produce RT when the intensity ratio was 1.0.
Figure 8. Comparison of the relative fluorescence-intensity versus temperature calibrations published by Fu et al., 2006 (─); Ross et al., 2010 (--); and Samy et al., 2008 (┅┅), for different rhodamine B chemistries
The calibration curves from all three authors are compared in Figure 8. The general trend of all three curves is similar. The difference between the curve of Samy et al., 2008 and the other two authors can be explained by the different physical medium and local environment used in the measurements.
6.3.2. Generalized calibration equation
Measurement of fluorescence intensity at a reference temperature in the vicinity of 23°C, for normalization purposes, is not always possible. For example, in applications requiring rapid temperature cycling of fluidic solutions the cycling temperatures of interest might be significantly different from 23 °C. In these situations, it is useful to calculate the fluorescence intensity ratio at a convenient reference temperature, T1, in the temperature range of interest as
1 1 / 1T TI I T S T S T (8)
While it might appear plausible to use IT1 (T) in eqn. 7 instead of IRT(T) and then add (T1 − T0) to the result to estimate the temperature, this process will add some additional error to the calculated temperatures obtained based on the calibration equations of Fu et al., 2006; Ross

Microwave Dielectric Heating of Fluids in Microfluidic Devices 193
et al., 2010; and Samy et al., 2008 (Shah et al., 2009). The additional error introduced by this procedure is zero when T0 = T1 and larger than ±1 °C in certain temperature regions for some values of T1 for all three calibration equations.
With a different approach, it was possible to eliminate all additional error except that inherent to the calibration equations themselves. For this approach, the normalized fluorescence intensity is generalized by rewriting it as
1
11
1( )RT T RT
S T S T S TI T I T I T
S RT S T S RT (9)
where T1 is any convenient known reference temperature. Therefore, if IT1(T) data have been measured where T1 is not the reference temperature used in deriving the calibration equation, then IRT(T) can be calculated for use in eqn. 8 from eqn. 9, where IRT(T1) can be obtained from the real solution(Terry et al., 1979) of the cubic equation
3 23 1 2 1 1 1 0 10 RT RT RTA I T A I T A I T A T (10)
with the values of An as listed in Table 1 and
1 1
2 3 31
33 2
21 3 2
23
( ) ( )3
3
9
RTA
I T R D R DA
D Q R
A A AQ
A
and
2 3
1 2 3 0 1 3 23
3
9 27 2
54
A A A A T A AR
A
(11)
When IRT(T) is calculated from eqn. 9 with measured IT1(T) data and IRT(T1) obtained from the solution to eqn. 10 that is given in eqn. 11, no error is introduced into the result beyond that already inherent in eqn. 7. A treatment similar to that described above can be applied to generalize calibration equations based on linear (Gallery et al., 1994) and second order polynomial (Erickson et al., 2003) fits to normalized I(T) data to a convenient reference temperature.
6.4. Device characterization
Experiments were performed to evaluate the performance of the CPW devices for heating in the microchannel environment. The device is characterized for its frequency response in order to obtain absorption ratios with empty and fluid-filled microchannels. The fluid temperature is measured at various microwave frequencies. The results obtained from the

The Development and Application of Microwave Heating 194
first experiment are used to derive a power absorption model to find the distribution of the incident microwave power in different absorbing structures of the device.
The CPW device frequency response is characterized by scattering (S) parameter measurements. The S-parameters relate the forward and reflected traveling waves in a transmission medium and can be used to understand the power flow as a function of frequency. The S-parameters are used in conjunction with the conservation of energy to model absorption of microwave power and to predict the fluid temperature based on the absorbed power. The predicted temperature is then fitted to the measured temperature to determine heating efficiency. The experiments for the results presented below were performed with deionized (DI) H2O and with fluids of two different salt concentrations: 0.9% NaCl solution and 3.5% NaCl solution.
6.4.1. S-parameter measurements
The amplitude of the reflection coefficients (S11) and transmission coefficients (S21) from 0.3 GHz to 40 GHz for the device with an empty channel as well as for the fluid-filled channels are shown in Figure 9(a) and Figure 9(b), respectively. In comparison with the empty channel device, S11 is reduced for the device with fluid-filled channel and it approaches that of an empty channel for frequencies above 10.5 GHz. The decrease in S11 of the fluid-filled devices below 10.5 GHz which indicate good impedance matching conditions are apparently fortuitous. The S11 is also found to be almost independent of the ionic concentration of the fluid. The localized peak and trough features observed in the S11 are likely interference effects due to reflections at the probe-CPW interfaces and the CPW/air-CPW/fluid interfaces (Facer et al., 2001). The S21, as seen from Figure 9(b), decreases with

Microwave Dielectric Heating of Fluids in Microfluidic Devices 195
Figure 9. (A) Measured reflection coefficients ( |S11| )of the device. (B) Measured transmission coefficients ( |S21| )of the device. (■) Empty microchannel, (●) microchannel filled with deionized H2O, (▲) microchannel filled with 0.9 % NaCl, (♦) microchannel filled with 3.5% NaCl.
increasing frequency for the devices with both the empty and fluid-filled channels. It is believed that the apparent low transmission coefficient of the empty-channel device is likely due to the smaller than optimum thickness of the CPW conductors (0.5 μm). The difference in S21 between the empty and fluid-filled channels becomes more pronounced at higher frequencies (> 5 GHz). The S21 of the fluid-filled devices is smaller compared to the empty-channel device due to the additional attenuation caused by the absorption of the microwave energy in the water.
Figure 10 shows percent absorption ratios (the fraction of the incident power absorbed by the device) as a function of frequency for the devices with empty and fluidfilled microchannels. The absorption ratio, A, is calculated from the S-parameter data shown in Figure 9 and using the equation: A = 1 – R – T where R (the reflection coefficient) = │S11│, T (the transmission coefficient) = │S21│, and Sij (dB) = 10 log10│Sij│. It should be noted that the absorption ratio is dependent on the position of the microchannel over the length of the waveguide. In other words, S21 would not equal to S12 and the device would function as a non-reciprocal two-port network unless the microchannel is precisely centered over the length of the waveguide. The absorption ratio obtained for the device with empty channel (■) is due to ohmic dissipation in the thin-film CPW, which can be modeled by an attenuation constant, αcpw, which corresponds to 2.86 dB/cm at 10 GHz. The attenuation constant of PDMS is assumed to be negligible because of the relatively low values of loss tangent (the ability of a material to convert stored electrical energy into heat) at microwave frequencies (Tiercelin et al., 2006). An increase in A observed with increasing frequency for the empty channel device (■) is expected from the dependence of skin depth on frequency. The absorption ratio for the fluid filled devices (•, ▲, and ♦) is greater for all frequencies

The Development and Application of Microwave Heating 196
measured in comparison with the empty channel device (■), due to microwave absorption in water and also ionic absorption in the ionic solutions. The data also exhibit a dependence of A on ionic concentration at lower frequencies as would be expected due to ionic conductivity, while the data at higher frequencies show that A is approximately independent of ionic concentration as would be expected due to dielectric conductivity. This trend is in agreement with theory (Wei et al., 1990).
Figure 10. The percent absorption ratios (the fraction of the incident microwave power absorbed by the device) as a function of frequency. The absorption ratio, A, was calculated from the measured transmission and reflection coefficients using A = 1 – R – T. (■) Empty microchannel, (●) microchannel filled with deionized H2O, (▲) microchannel filled with 0.9% NaCl, (♦) microchannel filled with 3.5% NaCl.
6.4.2. Power absorption model
It seems from Figure 10 that the simplest approximation to the fraction of the incident microwave power absorbed in the fluid is the difference between the power absorbed by the full-channel and empty-channel devices (for the case of water-filled device, AH2O – Aempty in Figure 10). However, various microwave power absorption models described in (Geist et al., 2007) show that this simple approximation greatly underestimates the actual fraction of incident microwave power absorbed in the fluid. For this reason, a simple model, alpha absorption model, is chosen to extract the fraction of the incident power absorbed in the fluid. This model is also used to differentiate microwave heating of the fluid from conductive heating due to ohmic heating of the CPW conductors. As shown in Figure 11, the model is constructed by assuming that the PDMS completely covers the CPW and by partitioning the CPW into three regions: a center region that interacts with the fluid in the

Microwave Dielectric Heating of Fluids in Microfluidic Devices 197
Figure 11. Top view of a CPW integrated with an elastometric microchannel consisting of three regions, center region with the microchannel and the two end regions without the microchannel.
microchannel and two end regions that have no microchannel over them. The lengths of each of the three regions are defined by the center region, Z2, 0.36 cm long and two end regions, Z1 and Z3, each 0.57 cm long. The reflectance at the interface between the regions is assumed to be negligible, and the transmission coefficient, T, is modeled as follows:
1 2 322 2 221 cpw cpw cpww
z z zzT R e e e e (12)
The derivation of this equation is based on exponential attenuation of microwave power in the direction of propagation where the rate of decay with distance is described by the attenuation constant, α. Because of the presence of water in the center region, it should be noted that the attenuation due to water, αw, is added to the attenuation due to CPW, αcpw. Eqn. 12 is then used to derive αcpw and αw as follows. First, αcpw is derived for the empty channel device by setting αw equal to zero into eqn. 12 and substituting the measured values of T and R for the empty channel device. Next, this value of αcpw is substituted into eqn. 12 along with the measured values of Tf and Rf, which are T and R for the water filled device, respectively. The resulting equation is solved for αw, which is found to be 3.68 dB/cm at 10 GHz. The absorption ratio for the central region of the water filled channel, A2, is calculated as
1 22 2( ) 2 (1 ) ( ) (1 )cpw cpw wz z
fA R e e (13)
Finally, the absorption ratios of the water, Aw, and CPW conductors, Am2 , in the center region are calculated by eqn. 14 and eqn. 15, respectively.
2w
wcpw w
A A
(14)
2 2m wA A A (15)

The Development and Application of Microwave Heating 198
Figure 12. The distribution of the incident microwave power in different absorbing structures of deionized H2O filled device as obtained from the alpha absorption model. Tf, Rf are the transmission and reflection coefficients of the water-filled device, respectively; Am, Am2, Aw are the absorption ratio of the CPW conductors, the absorption ratio of the CPW conductors in the region with the microchannel, and the absorption ratio of the water, respectively.
Eqns 12 through 15 are first order approximations. For impedance matched conditions, the equations show that Aw is dependent of position of the microchannel along the length of the CPW with a maximum occurring at the source end because the transmitted power attenuates exponentially along the transmission line. Further, Aw decreases exponentially along the length of the microchannel. Therefore, there is a design tradeoff between the microchannel length, its position relative to the source, and the frequency of operation to obtain a uniform temperature rise and efficient absorption of microwave power. Figure 12 shows the distribution of the incident microwave power in different absorbing structures of deionized H2O filled device. It shows that Aw increases with frequency in agreement with theory because the power absorbed by water per unit volume is proportional to fε '' as calculated from Franks (Franks, F., 1972) . It also shows that the absorption by the metal in the central region (Am2) competes with the absorption by the water (Aw). At low frequencies (< 3.5 GHz), Am2 is slightly higher than Aw. The difference between the two becomes negligible as the frequency increases further, and Aw starts to dominate as the frequency exceeds approximately 8 GHz. This can be explained by the differences in the attenuation constants. For instance, αw is 1.3 times as high as αcpw at 10 GHz. It can be observed from Figure 12 that the fraction of the incident power absorbed by the CPW conductors, Am, is noticeably high over the entire frequency range measured. This results in ohmic heating of the CPW conductors, which is also expected to contribute to the temperature rise of the fluid. However, based on the incident power absorbed by the CPW conductors in the center
Microwave Dielectric Heating of Fluids in Microfluidic Devices 199
region, Am2, a worst-case first order analytic calculation (Carslaw et al., 1959) of the contribution of the metal heating to water heating shows that the power dissipated in the CPW contributes less than 20 % of the total heating observed in the microchannel.
6.4.3. Temperature measurements
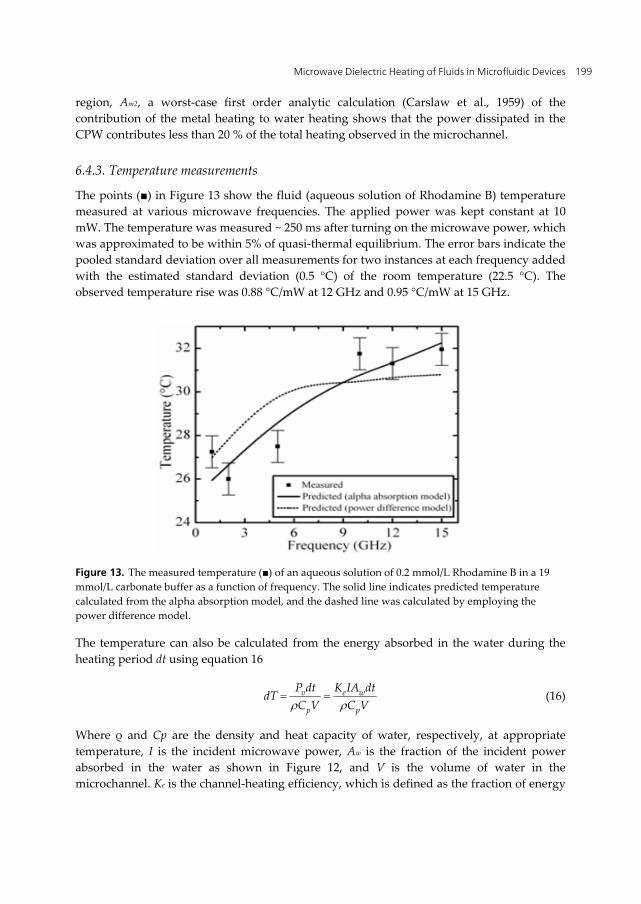
The points (■) in Figure 13 show the fluid (aqueous solution of Rhodamine B) temperature measured at various microwave frequencies. The applied power was kept constant at 10 mW. The temperature was measured ~ 250 ms after turning on the microwave power, which was approximated to be within 5% of quasi-thermal equilibrium. The error bars indicate the pooled standard deviation over all measurements for two instances at each frequency added with the estimated standard deviation (0.5 °C) of the room temperature (22.5 °C). The observed temperature rise was 0.88 °C/mW at 12 GHz and 0.95 °C/mW at 15 GHz.
Figure 13. The measured temperature (■) of an aqueous solution of 0.2 mmol/L Rhodamine B in a 19 mmol/L carbonate buffer as a function of frequency. The solid line indicates predicted temperature calculated from the alpha absorption model, and the dashed line was calculated by employing the power difference model.
The temperature can also be calculated from the energy absorbed in the water during the heating period dt using equation 16
v e w
p p
P dt K IA dtdT
C V C V (16)
Where ρ and Cp are the density and heat capacity of water, respectively, at appropriate temperature, I is the incident microwave power, Aw is the fraction of the incident power absorbed in the water as shown in Figure 12, and V is the volume of water in the microchannel. Ke is the channel-heating efficiency, which is defined as the fraction of energy

The Development and Application of Microwave Heating 200
absorbed in the water during the time dt that remains in the water. The rest of the energy absorbed in the water during the time dt is conducted into the substrate. The value of Ke cannot be easily obtained from the geometry and thermal properties of the channel and substrate due to the unknown contact thermal resistance (Kapitza resistance) between the water and the hydrophobic surface of the substrate (Barrat et al., 2003). Rather than attempt to calculate the value of Ke, it was adjusted in a least-squares fit of the predictions of eqn. 16 to the measured data points (■) in Figure 13. The solid line in Figure 13 indicates the predicted temperature calculated using Aw obtained from Figure 12 (alpha absorption model), and the dashed line indicates the predicted temperature calculated using Aw obtained from the power difference model (AH2O – Aempty). It is clear from the results of fitting the predictions of the two different absorption models that the alpha absorption model provides a better fit to the measured data. Further, the heating efficiency obtained from the alpha absorption model indicates that only 5 % of the total heat (time integral of the absorbed power) was stored in the fluid while the rest was lost to the surroundings (PDMS and glass). Because the ratio of stored heat to lost heat increases with decreasing heating time, it is possible to confine most of the heat to the fluid and heat it to a higher temperature by increasing the microwave power and decreasing the heating period simultaneously.
6.4.4. Nonlinear temperature gradients
The choice of COC and Cu tape for the microfluidic cell (Figure 7) offers several advantages for producing ntegrated microfluidic devices for microwave heating. The high glass transition temperature of COC (Tg = 136 °C) as well as its chemical compatibility with acids, alcohols, bases and polar solvents make it suitable for photolithographic procedures. While the low thermal conductivity of COC (0.135 W m−1 K−1) has a negative impact for contact heating approaches, it offers a significant advantage for direct volumetric-based heating strategies by minimizing undesired heat losses, so that a larger fraction of the incident power is contained in the fluid during heating. Additionally, the low dielectric constant (εr = 2.35) and the low loss factor (tan δ ∼1·10−4 at 10 GHz) of COC make it suitable for high-frequency applications. The use of electro-deposited Cu compared to metal alloys as in the low-melt solder fill technique (Koh et al., 2003) e.g. a combination of indium-bismuth-tin alloy (Yang et al., 2002) for forming the transmissionline electrodes permits high-frequency operation of the devices due to the high electrical conductivity (σCu ∼5.51×10⁵ S cm−1,
σIn-alloy = 0.19×10⁵ S cm−1) of Cu. On the other hand, if the conductor thickness (which is 35 μm in the device of Figure 7) exceed the thickness (3δ = 2 μm at 10 GHz for Cu, where δ is the skin depth) needed to sufficiently suppress ohmic losses due to the skin effect, then the greater-than-required thickness of Cu (33 μm in this case) acts as a thermal heat sink, limiting the maximum achievable temperature in the microchannel.
An electromagnetic simulation of a geometrical structure similar to that shown in Figure 7(a) was performed using Sonnet Software with nominal properties for copper, acrylic, COC and water. The design parameters were varied to optimize microwave power absorption in the fluid since absorption governs the maximum attainable temperature. A trade-off relation

Microwave Dielectric Heating of Fluids in Microfluidic Devices 201
was found to exist between the power absorbed in the fluid and the ratio of the channel height to the total substrate thickness (the sum of cover plates and COC thickness). A smaller channel height to substrate thickness ratio reduced the absorbed power for a given fluid volume and incident microwave power. The coupling of the microwave power from the amplifier (less than, but approximately equal to 1W) to the transmission line and the microchannel was characterized theoretically and experimentally by measuring the reflection coefficient (S11) and the transmission coefficient (S21) and by calculating the absorption ratio (A = 1 − |S11| |S21|), which describes the fraction of the incident power absorbed by the device, where Sij (dB) = 10 log10|Sij|.
Figure 14 shows the simulated and measured absorption ratios for the empty-channel and water filled device. Close agreement is found in both the amplitude and shape for the full-channel device, but only in shape for the empty-channel device with the correlation coefficient of 0.98 for the empty-channel device and 0.96 for the water filled device. The amplitude deviation in the experimental absorption ratio for the empty-channel device can be attributed to imperfections in the as-fabricated conductor. However, this difference is much smaller for the water-filled device apparently because fluid absorption dominates the absorptive process. The S-parameter information was also used to select frequencies where large sinusoidally shaped temperature gradients were expected. Specifically, it was found that constructive interference exists between the traveling and reflected waves at a frequency corresponding to local maxima in the absorption ratio curve for the water-filled
Figure 14. Comparison between simulated and measured absorption ratios, the fraction of the incident microwave power absorbed by the device, as a function of frequency. The simulated and measured responses are compared for the empty channel as well as the water-filled device. The curves are constructed from S-parameter data according to A = 1 - |S11| - |S21|, where S11 is the reflection coefficient and S21 is the transmission coefficient. The upper dotted line is simulated full channel response, the upper solid line is measured full channel response, the lower solid line is measured empty channel response, and the lower dotted line is the simulated empty channel response.

The Development and Application of Microwave Heating 202
device. The absorbed power increases with increasing frequency, and the peaks in the absorbed power exist at a variety of frequencies (Figure 14). However, the amplitude of the absorbed power at the peaks for frequencies lower than 12 GHz is significantly smaller than that at 12 GHz and above. Here, the results of temperature measurements at the lowest (12 GHz) and highest (19 GHz) frequencies that gave relatively large peaks in the absorption ratio data are shown.
Figure 15 shows the experimental temperature profile for the excitation frequency of 19 GHz. The curve in Figure 15 was constructed by using the calibration curve of Rhodamine B dye to convert the fluorescence intensity into temperature. A nonlinearly modulated profile extending along the length of the microchannel was observed. The temperatures measured at different positions was compared with the model of temperature gradient generation by performing nonlinear least-squares fitting of equation 6 to the measured data points using Origin software (solid line in Figure 15) and a good agreement (R2 = 0.98) was found. The parameter estimates and the associated standard errors are listed in Table 2.
12 GHz 19 GHz Value SD Value SD
a (V mm-1) 6.986 0.051 6.31 0.024 b (V mm-1) 0.501 0.041 -0.281 0.017 β (deg mm-1) 29.11 0 46.35 0.974 θp (deg) 264.8 3.25 154.1 7.071 α (mm-1) 0.015 0.002 0.01 0.001
Chi-square 1.193 - 0.257 - R2 0.975 - 0.981 -
Table 2. Results from nonlinear least-squares fitting of the temperature gradient model (equation 6) to the measured data points shown in Figures 15 and 16 for one device. A standard error of zero indicates that this value was fixed during the fit.
12 GHz 19 GHz Mean Average SD Mean Average SD
a (V mm-1) 6.912 0.049 6.427 0.035 b (V mm-1) 0.502 0.04 0.092 0.025 β (deg mm-1) 29.106 0.04 46.123 1.833 θp (deg) 259.4 3.229 193.6 14.22 α (mm-1) 0.011 0.002 0.012 0.002
Chi-square 1.142 - 0.712 - R2 0.971 - 0.923 -
Table 3. The average and standard deviations of the fitting parameters extracted from nonlinear least-squares fitting of measured temperature gradient data to the theoretical model shown in equation (6). A standard deviation of zero indicates that this value was fixed during the fit as described in the text.

Microwave Dielectric Heating of Fluids in Microfluidic Devices 203
Figure 15. The measured temperature versus distance along the microchannel of an aqueous solution of 0.2 mmol L-1 Rhodamine B in a 19 mmol L-1 carbonate buffer at the microwave excitation frequency of 19 GHz. The solid line represents a theoretical temperature fit to the measured data points shown by squares. The measurement frequency was selected based on a local maximum in A for the full channel device. At 19 GHz, S11 = 0.040, S21 = 0.343 and A = 0.617 for the full channel device.
Figure 16. The measured temperature of an aqueous solution of 0.2 mmol L-1 Rhodamine B in a 19 mmol L-1 carbonate buffer as a function of position along the microchannel at the microwave excitation frequency of 12 GHz. The solid line represents a theoretical temperature fit to the data points shown by squares. The measurement frequency was selected based on a local minimum in S11 (not shown here) and a local maximum in A for the full channel device. At 12 GHz, S11 = 0.063, S21 = 0.490 and A = 0.447 for the full channel device.

The Development and Application of Microwave Heating 204
For a given geometrical structure, the nonlinear temperature profile (Figure 15) can be altered by changing the frequency of the microwave signal. This is demonstrated in Figure 16, which shows the spatial temperature profile obtained for 12 GHz excitation frequency. Here, a nonlinear profile representing a sinusoidal wave extending along the length of the microchannel was observed. The data also resulted in a quasilinear temperature gradient with a slope of 7.3 °C mm−1 along a 2 mm distance. Linear temperature gradients with comparable slopes have been used for DNA mutation detection (Bienvenue et al., 2006), phase transition measurements in phospholipid membranes (Saiki et al., 1986), single-nucleotide polymorphism (SNP) analysis (Baker., 1995) and continuous-flow thermal gradient PCR (Liu et al., 2007). As before, nonlinear least-squares fitting of the theoretical model (solid line in Figure 16) to the experimental data shows good agreement (R2 = 0.98). Due to limitations of the temperature gradient model, the fit to the 12 GHz data was not able to estimate the attenuation constant, α, with reasonable uncertainty because of multicollinearity (all of the coefficients of the covariance matrix were >0.8). Therefore, the fit to 12 GHz data by fixing β (Table 2) has been performed. The value of β was obtained from the fit to 19 GHz data by assuming that dispersion was negligible and scaling appropriately for the ratio of the two frequencies. One noteworthy application of a rapid, nonlinear temperature (electric field) gradient is electric field gradient focusing (EFGF) of charged molecules. It has been suggested theoretically that the peak capacity and resolution of EFGF and other related methods, such as TGF (Lagally et al., 2004), could be increased by using a nonlinear field (temperature) gradient provided that the first portion of the gradient is steep, the following section is shallow and that the sample components can be moved from the first portion to the second after focusing in the first portion (Chaudhari et al., 1998; Yoon et al., 2002). To demonstrate the efficacy of the technique for generating temperature gradients, measurements on several different devices were performed. The general shape of the temperature gradient curve was found to reproduce well for all of the measurements. The statistical deviations shown in Table 3 come primarily from variations in the geometrical dimensions of the device introduced during the fabrication process. Even though Rhodamine B dye was used successfully to demonstrate the presence of temperature gradients, accurate generation of the temperature gradient profile warrants improvements to the temperature detection method. In fact, a number of researchers have reported the specific absorption of Rhodamine B in PDMS substrates (Pal et al., 2004; Kopp et al., 1998 ). For the present device structure, the Rhodamine B was found to absorb into acrylic adhesive resulting in temperatures that were representative of channel surface rather than that of the bulk fluid. Additionally, after repeated use the absorption resulted in non-uniform fluorescence intensity across the length of the microchannel indicating that the absorption was non-uniform in space, which limits the reusability of the devices. Hence, these results demonstrate that while the method for generating spatial temperature gradients is robust as shown from the repeated measurements and low statistical error (Table 3), the frequent use of devices results in the channel surface becoming saturated with Rhodamine B dye limiting their overall use.
It should be possible to prevent the absorption of Rhodamine B dye on the microchannel surface by modifying those surfaces with appropriate surface treatments as is typically done

Microwave Dielectric Heating of Fluids in Microfluidic Devices 205
for analyte separations in microfluidic devices (Schneegass et al., 2001). Further, a two-step process could be utilized to eliminate potential interactions of Rhodamine B dye with chemicals of interest. As the first step, a set of devices would be used with a dye solution to calibrate the temperature difference versus the microwave power characteristic of the device, and an identical device would be later used without the dye solution for performing biological or chemical studies. Alternatively, an electronic temperature sensor such as a thermocouple or resistance thermometer could be integrated into the device at a convenient reference location along the channel for optical calibration. Figure 17 plots the temperature as a function of time at one location along the microfluidic channel for a 1 s duration pulse of approximately 1 W of microwave power applied to the device. Substantially, more power (about 1 W from the amplifier) was required to raise the temperature of the fluid to 46 ◦C in 1 s than would be required to hold it at this temperature for an additional second as might be required in practical applications. It would be much easier to add feedback control of the microwave power if the temperature at a reference location was measured electronically rather than optically even if Rhodamine B or some other fluorescent dye was compatible with the other chemicals in the microchannel.
Figure 17. Transient temperature response of the integrated microfluidic device. A temperature of 46 0C was obtained at some locations in the microchannel with 1W of microwave power at the output of power amplifier for 1s. The fact that the temperature did not reach a steady state value in this time shows that considerably less power would be required to hold the temperature constant for a second. The addition of feedback control and a higher power amplifier would facilitate higher temperatures, a faster rate of increase in temperature, as well as the capability to hold the fluid temperature constant for a short period of time without raising the device temperature significantly.
Finally, the growing concern that exposure to microwaves can be harmful to living cells may limit the ability to operate highly integrated lab-on-a-chip devices containing living microorganisms in conventional microwave ovens. On the other hand, the microwave field decreases rather rapidly away from a properly designed microscale microwave generator,
The Development and Application of Microwave Heating 206
potentially allowing live organisms and microwave transducers to co-exist on a lab-on-a-chip device. The approach explained to establish temperature gradients appears to be especially well suited for thermal gradient focusing methods for analyte separations of cell metabolites in lab-on-a-chip devices. Other potential applications of integrated microwave heaters include cell lysis and PCR (Liu et al., 2002), as mentioned previously. The localized nature of on-chip microwave heating means that separate microwave heaters optimized for these different tasks could also co-exist on a single lab-on-a-chip device. Therefore, it is believed that the technique outlined here will facilitate the application of microfluidics to other biological and chemical applications requiring spatial temperature gradients as well as to temperature gradient generation.
7. Conclusions
The ability to rapidly and selectively control temperature within microchannel environment is crucial for many fluidic applications including high-efficiency PCR and temperature induced cell lysing. In this chapter, localized microwave dielectric heating of fluids at micrometer scale geometry using integrated planar microwave transmission line as a power source has been presented. The measured temperature increases with increasing frequency is in agreement with theory. The device offers several advantages. It is simple, easy to use and fabricate. The planar structure of the transmission line used as a power source lends itself to easy integration with the microchannel and allows for optical integration of the microchannel with widely used fluorescence microscopy techniques. The performance of the CPW for heating could be substantially improved by: applying high power pulses over shorter heating times, using a lower thermal diffusivity substrate than glass, and increasing the gap width and thickness of the CPW conductors.
A microwave power absorption model to understand power distribution through the device and to differentiate microwave heating of the fluid from conductive heating of the fluid because of microwave power absorption in thin-film CPW conductors has been presented. Based on the fitting of the experimental data using the power absorption model, it can be stated that the temperature rise of fluid is predominantly due to the absorbed microwave power. It is believed that this model can be useful for evaluating the performance of various complex and lossy transmission line configurations, such as CPW or microstrip lines, for heating fluid in the microchannel environment. Tt is believed that the microwave dielectric heating approach will be of particular use in rapid thermocycling applications and will lead to new applications exploiting heating in microfluidic environment. Such heaters are potentially very useful for single use, disposable, and integrated microfluidic systems.
The integrated microwave microstrip transmission line is also very attractive to generate temperature gradients rapidly and selectively in a microfluidic device. The shape of the temperature profile can be adjusted by varying the microwave excitation frequency and the amplitude of the profile can be adjusted by varying the microwave power. With this technique, the temperature gradients can be established locally and selectively by positioning the transmission line in the region of interest over the fluidic network. This

Microwave Dielectric Heating of Fluids in Microfluidic Devices 207
device offers several advantages. Because the heating elements are integrated with the microchannel, this device offers a portable platform for generating spatial temperature gradients. The device is simple, easy to integrate and use with microfluidic channels, and allows for high frequency operation. The heating elements are easy to fabricate and the fabrication method is transferable to other microfluidic substrates. Reducing the thickness of the copper electrodes would provide larger temperature changes within the microchannel. This approach can be scaled for high throughput studies by fabricating multiple transmission lines in parallel. This approach to establish temperature gradients would be especially well suited for field gradient focusing methods for analyte separations. It will also facilitate the application of microfluidics to a multitude of other biological and chemical applications requiring spatial temperature gradients.
Author details
Mulpuri V.Rao Department of Electrical and Computer Engineering, George Mason University,Fairfax, VA, USA
Jayna J. Shah National Institute of Standards and Technology, Semiconductor Electronics Division, Gaithersburg, MD, USA Presently at: Raytheon Company, Dallas, TX, USA
Jon Geist and Michael Gaitan National Institute of Standards and Technology, Semiconductor Electronics Division, Gaithersburg, MD, USA
Acknowledgement
Authors acknowledge the contributions of Siddarth Sundaresan in the early part of this work on microwave dielectric heating of microfluidic devices.
8. References
Adnadjevic, B., JOvanovic, J. The Effect of Microwave heating on the Isothermal Kinetics of Chemicals reaction and Physicochemical Processes. In: Advances in Induction and Microwave heating of Mineral and Organic Materials. Intech; 2011
Arata, H. F., Rondelez, Y., Noji, H., Fujita, H.(2005). Temperature alternation by an on-chip microheater to reveal enzymatic activity of beta-galactosidase at high temperatures. Analytical Chemistry, Vol. 77, pp. 4810–4814
Ali, M. A., Moghaddasi, J., Ahmed, S. A. (1990). Examination of temperature effects on the lasing characteristics of rhodamine cw dye lasers. Applied Optics, vol. 29, pp. 3945-3949.
Baaske, P., Duhr, S., Braun, D. (2007). Melting curve analysis in a snapshot. Applied Physics Letters, Vol. 91, pp. 133901 1 – 3

The Development and Application of Microwave Heating 208
Baker, D.R., Capillary Electrophoresis, John Wiley & Sons, Inc; 1995 Barrat, J. L.; Chiaruttini, F. (2003). Kapitza resistance at the liquid-solid interface. Molecular
Physics, Vol. 101, pp. 1605-1610. Bengtson, A., Hallberg, A., Larhed, M. (2002). Fast Synthesis of Aryl triflates with controlled
microwave heating. Organic Letters, Vol. 4, No. 7, pp. 1231-1233 Bienvenue, J.M., Duncalf, N., Marchiarullo, D., Ferrance, J.P., Landers, J.P.(2006). Microchip-
Based Cell Lysis and DNA Extraction from Sperm Cells for Application to Forensic Analysis . Journal of Forensic Science, Vol. 51, pp. 266-273.
Brodie, G., Microwave Heating in Moist Materials. In: Advances in Induction and Microwave Heating of Mineral and Organic Materials. InTech; 2011, pp. 553
Booth, J. C., Mateu, J., Janezic, M., Baker-Jarvis, J., Beall, J. A. (2006). Broadband permittivity measurements of liquid and biological samples using microfluidic channels. IEEE MTT-S International, Microwave Symposium. pp. 1750-1753
Braun, D., Libchaber, A. (2003). Lock-in by molecular multiplication. Applied Physics Letters, Vol. 83, pp. 5554–5556
Buch, J. S., Kimball, C., Rosenberger, F., Highsmith, W. E., DeVoe, D. L., Lee, C. S. (2004). DNA mutation detection in a polymer microfluidic network using temperature gradient gel electrophoresis. Analytical Chemistry, Vol. 76, pp. 874–881.
Carslaw, H. S.; Jaeger, J. C. (1959). Conduction of heat in solids. 2nd edition. Oxford University Press, Oxford.
Chaudhari, A. M., Woudenberg, T. M., Albin, M., Goodson, K. E., (1998). Transient liquid crystal thermometry of microfabricated PCR vessel arrays. Journal of Microelectromechanical Systems, vol. 7, pp. 345-355
Dodge, A., Turcatti, G., Lawrence, I., de Rooij, N.F., Verpoorte, E. (2004). A microfluidic platform using molecular beacon-based temperature calibration for thermal dehybridization of surface-bound DNA. Analytical Chemistry, Vol. 76, pp. 1778–1787
Duhr, S., Braun, D., (2006). Why molecules move along a temperature gradient. Proceedings of National Academy of Sciences, USA, Vol. 103, pp. 19678–19682
Elibol, O.H., Reddy, B., Bashir, R. (2008). Localized heating and thermal characterization of high electrical resistivity silicon-on-insulator sensors using nematic liquid crystals. Applied Physics Letters, Vol. 93 131908
Elibol, O.H., Reddy, B., Bashir, R. (2009). Localized heating on silicon field effect transistors: device fabrication and temperature measurements in fluid. Lab Chip, Vol. 9. pp 2789-2795
Erickson, D.; Sinton, D.; Li, D. Q. (2003). Joule heating and heat transfer in poly(dimethylsiloxane) microfludic systems. Lab on a Chip, Vol. 3, pp. 141–149
Facer, G. R., Notterman, D. A., Sohn, L. L. (2001). Dielectric spectroscopy for bioanalysis: From 40 Hz to 26.5 GHz in a microfabricated wave guide. Applied Physics Letter, Vol. 78 pp. 996– 998

Microwave Dielectric Heating of Fluids in Microfluidic Devices 209
Ferguson, J.; Mau, A. W. H. (1973). Spontaneous and stimulated emission from dyes. Spectroscopy of the neutral molecules of acridine orange, proflavine and rhodamine B. Australian Journal of Chemistry. Vol. 26, pp. 1617–1624
Fermer, C., Nilsson, P., Larhead, M. (2003). Microwave-assisted high speed PCR. European Journal of Pharmaceutical Sciences, Vol. 18, pp. 129-132
Franks, F. Water: a comprehensive treatise: The physics and physical chemistry of water. Plenum Press: 1972
Fu, R.; Xu, B.; Li, D. (2006). Study of temperature field in microchannels of a PDMS chip with embedded local heater using temperature-dependent fluorescent dye. International Journal of Thermal Sciences. Vol. 45, pp. 841–847
Gallery, J.; Gouterman, M.; Callis, J.; Khalil, G.; McLachlan, B.; Bell, J. (1994). Luminescent thermometry for aerodynamic measurements. Review of Scientific Instruments. Vol. 65, pp. 712–720
Gabriel, C., Gabriel, S., Grant, E. H., Halstead, B. S. J., Mingos, D. M. P. (1998). Dielectric parameters relevant to microwave dielectric heating. Chemical Society Review, Vol. 27, pp. 213-224
Gedye, R.N., Wei, J.B. (1998). Rate enhancement of organic reactions by microwave at atmospheric pressure. Canadian Journal of Chemistry, Vol. 76, pp. 525-532.
Geist, J.; Shah, J.; Rao, M. V.; Gaitan, M. (2007). Microwave power absorption in Low-Reflectance, Complex, Lossy Transmission Lines. Journal of Research of the National Institute of Standards and technology, Vol. 112, pp. 177-189
Gupta, K.C. Microstrips Lines and Slotlines, Artech House; 1996 Huang, T. M., Pawliszyn, J. (2002). Microfabrication of a tapered channel for isoelectric
focusing with thermally generated pH gradient. Electrophoresis, Vol. 23, pp. 3504–3510 Jackson, J.D. Classical Electrodynamics, John Wiley & Sons; 1975 Kempitiya, A., Borca-Tasciuc, D.A., Mohamed, H.S., Hella, M.M. (2009). Localized
microwave heating in microwells for parallel DNA amplification applications Applied Physics Letters, Vol. 94 064106
Koh, C. G., Tan, W., Zhao, M, Q., Ricco, A. J., Fan, Z. H. (2003). Integrating polymerase chain reaction, valving and electrophoresis in a plastic device for bacterial detection. Analytical Chemistry, vol. 75, pp. 4591-4598
Kopp, M. U., De Mello, A. J., Manz, A. (1998). Chemical Amplification: Continuous-Flow PCR on a Chip. Science, Vol. 280 pp. 1046 –1048.
Kubin, R. F., Fletcher, A.N., (1982). Fluorescence quantum yields of some rhodamine dyes. Journal of Luminescence, Vol. 27, pp. 455-462
Lagally, E.T., Mathies, R.A. (2004). Integrated genetic analysis Microsystems. Journal of Physics D: Applied Physics, Vol. 37, pp. R245-R261.
Langa, F.; de la Cruz, P.; de la Hoz, A.; Diaz-Ortiz, A.; Diez-Barra, E. (1997). Microwave irradiation: more than just a method for accelerating reactions. Contemporary Organic Synthesis, Vol. 4, pp. 373-386.

The Development and Application of Microwave Heating 210
Liu, J., Enzelberger, M., Quake, S.R. (2002) A Nanoliter Rotary Device for Polymerase Chain Reaction. Electrophoresis, Vol. 23, pp. 1531-1536
Liu, P., Seo, T.S., Beyor, N., Shin, K.J., Scherer, J.R., and Mathies, R.A. (2007). Integrated portable polymerase chain reaction-capillary electrophoresis microsystem for rapid forensic short tandem repeat typing. Analytical Chemistry, Vol. 79, pp. 1881–1889.
Lou, J. F., T. M. Finegan., P. Mohsen., T. A. Hatton., P. E. Laibinis. (1999). Fluorescence-based thermometry: Principles and applications. Rev Analytical Chemestry, Vol. 18, pp. 235-284
Manz, A., Graber, N., Widmer, H.M. (2010). Miniaturized total chemical analysis systems: A Novel concept of chemical sensing. Senosors and Actuators B-Chemical, Vol. 1 pp. 244-248Mao, H. B., Yang, T. L., Cremer, P. S. (2002). A microfluidic device with a linear temperature gradient for parallel and combinatorial measurements. Journal of American Chemical Society, Vol. 124, pp. 4432–4435
Mao, H. B., Holden, M. A., You, M., Cremer, P. S. (2002). Reusable platforms for high-throughput on-chip temperature gradient assays. Analytical Chemistry, Vol. 74, pp. 5071–5075
Marchiarullo, D. J., Sklavounos, A., Barker, N.S., Landers, J. P. (2007). Microwave-mediated microchip thermocycling: pathway to an inexpensive, handheld real-time PCR instrument. 11th Int. Conf. on Miniaturized Systems for Chemistry and Life Sciences
Orrling, K., Nilsson, P., Gullberg, M., Larhed, M. (2004). An efficient method to perform milliliter- scale PCR utilizing highly controlled microwave themocycling. Chemical Communication, Vol. 7, pp. 790-791
Pal, R., Yang, M., Johnson, B.N., Burke, D.T., Burns, M.A. (2004). Phase change microvalve for integrated devices. Analytical Chemistry, Vol. 76, pp. 3740-3748
Ramo, S., Whinnery, J. R. Duzer, V. T. (1993). Fields and Waves in Communication Electronics 3rd edition (Hoboken, NJ: Wiley)
Reyes, D.R., Iossifidis, D., Auroux, P.A., Manz, A. (2002). Micro total analysis systems.1. Introduction, theory and technology. Analytical Chemistry, Vol. 74, pp. 2623-2636
Riaziat, M., Center, V. R., Alto, P. (1990). Propogation modes and dispersion characteristics of coplanar waveguides. IEEE transactions on Microwave Theory and Techniques, Vol. 38, pp. 245-251.
Ross, D.; Gaitan, M.; Locascio, L. E. (2001). Temperature measurement in microfluidic systems using a temperature-dependent fluorescent dye. Analytical Chemistry, Vol. 73, pp. 4117–4123
Ross, D., Locascio, L. E. (2002). Microfluidic temperature gradient focusing. Analytical Chemistry, Vol. 74, pp. 2556–2264
Saiki, R.K., Bugawan, T.L., Horn, G.T., Mullis, K.B., Erlich, H.A. (1986). Analysis of enzymatically amplified beta-globin and HLA-DQ alpha DNA with allele-specific oligonucleotide probes. Nature, Vol. 324, pp. 163–166.
Sakakibara, J., Hishida, K., maeda, M. (1993). Measurements of thermally stratified pipe flow using image-processing techniques. Experiments in Fluids, Vol. 16, pp. 82-96.

Microwave Dielectric Heating of Fluids in Microfluidic Devices 211
Samy, R.; Glawdel, T.; Ren, C. L. (2008). Method for microfluidic whole-chip temperature measurement using thin-film poly (dimethylsiloxane)/rhodamine B. Analytical Chemistry, Vol. 80, pp. 369–375
Schneegass, I., Brautigam, R., kohler, J.M. (2001). Miniaturized flow-through PCR with different template types in a silicon chip thermocycler. Lab on a Chip, Vol. 1, pp. 42-49
Selva, B., Marchalot, J., Jullien, M.C., (2009). An optimized resistor pattern for temperature gradient control in microfluidics. Journal of Micromechanics and Microengineering, Vol. 19, 065002
Shah, J.,Geist, J., Locascio, L. E., Gaitan, M., Rao, M.V., Vreeland, W. N. (2006). Capillarity induced solvent-actuated bonding of polymeric microfluidic devices. Analytical Chemistry, Vol. 78, pp. 3348–3353
Shah, J. J., Sundaresan, S.G., Geist, J., Reyes, R.D., Booth, J.C. Rao. M. V., Gaitan, M. (2007). Microwave dielectric heating of fluids in an integrated microfluidic device. Journal of Micromechanics and Microengineering. Vol. 17, pp. 2224–2230
Shah. JJ. Microfluidic devices for forensic DNA Analysis. PhD thesis. George Mason University, Fairfax; 2007
Shah, J., G., Gaitan, M., Geist, J. (2009). Generalized temperature measurement equations for rhodamine B dye solution and its application to microfludics. Analytical Chemistry, Vol. 81, pp. 8260-8263
Shah, J., Geist, J., Gaitan, M. (2010). Microwave-induced adjustable nonlinear temperature gradients in microfludic devices. Journal of Micromechanics and Microengineering, Vol. 20, 105025
Sklavounos, A., Marchiarullo, D. J., Barker, S.L.R., Landers, J. P., barker, N. S. (2006). Efficient miniaturized systems for microwave heating on microdevices. Proceeding Micro Total Analysis Systems
Tanaka, Y., Slyadney, M.N., Hibara, A., Tokeshi, M., Kitamori, T. (2000). Non-contact photothermal control of enzyme reactions on a microchip by using a compact diode laser. Journal of. Chromatography.A, Vol. 894, pp. 45–51
Terry, S.C., Jerman, J.H., Angell, J.B. (1979). A gas chromatographic air analyzer fabricated on a silicon wafer. IEEE Transactions on Elecron Devices, Vol. 26, pp. 1880-1886
Tiercelin, N.; Coquet, P.; Senez, V.; Sauleau, R.; Fujita, H. (2006). Polydimethylsiloxane membranes for millimeter-wave planar ultra flexible antennas. Journal of Micromechanics and Microengineering, Vol. 16, pp. 2389-2395.
Whittaker, A.G., Mingos, D.M.P. (2002). Synthetic reactions using metal powders under microwave irradiation. Journal of the Chemical Society Vol. 21, pp. 3967-3970
Wei, Y. Z.; Sridhar, S. (1990). Journal of Chemical Physics, Vol. 92, pp. 923-928 Woolley, A.T., Hadley, D., Landre, P., deMello, A.J., Mathies, R.A., Northrup, M.A. (1996).
Functional Integration of PCR Amplification and Capillary Electrophoresis in a Microfabricated DNA Analysis Device. Analytical Chemistry, Vol. 68, pp. 4081-4086
Yang, J.N., Liu, Y.J., Rauch, C.B., Stevens, R.L., Liu, R.H., Lenigk, R., Grodzinski, P., (2002). High sensitivity PCR assay in plastic micro reactors. Lab on a Chip, Vol. 2, pp. 179-187

The Development and Application of Microwave Heating 212
Yoon, D.S., Lee, Y,S., Lee, Y., Cho, H.J., Sung, S,W., Oh, K.W., Cha, J., Lim, G. (2002). Precise temperature control and rapid thermal cycling in a micromachined DNA polymerase chain reaction chip. Journal of Micromechanic Microengineering, vol. 12, pp. 813-823
Zhang, H. D., Zhou, J., Xu, Z.R., Song, J., Dai, J., Fang, J., Fang, Z.L. (2007). DNA mutation detection with chip-based temperature gradient capillary electrophoresis using a slantwise radiative heating system. Lab on a Chip, Vol. 7, pp. 1162–1170