migration situation between hungary and ukraine Áron kincses hungarian central statistical office...
TRANSCRIPT
Migration situation Migration situation betweenbetween Hungary Hungary and and
UkraineUkraine
Áron Kincses Hungarian Central Statistical Office
Dr. Dávid Karácsonyi Geographical Research Institute of Hungarian Academy of Sciences
Migration Challenges to the Visegrad Countries from Eastern EuropeBudapest, 19 October, 2009
Historical overview of the Hungarian international
migration statistics• During the years of isolation migration statistics did not
exist at all. The situation changed fundamentally at the end of the 1980s when the political system changed. Hungary became a transit country to the west as well as a final destination for immigrants.
• The need for a comprehensive and consolidated information system on migration was expressed at different levels of political and economic decision-making, public administration and civil society at the beginning of the 1990s.
• The HCSO started to compile the international migration statistics with using the administrative data bases containing related information.
• The first data was published in 1993.
Data sources of migration
• The data base on migration dataset of Hungarian Central Statistical Office (HCSO), Office of Immigration and Nationality (Ministry of Interior) and Hungarian Tax and Financial Control Administration was used.
• Foreigners meant a foreign citizen having a residence permit, an immigration permit or a settlement permit who stayed in Hungary on 1 January of the given year.
• The migration processes have been examined by destination, place of origin, age-groups, educational attainments and share of taxpayer in this study. The studied spatial distribution level is NUTS3. We shall give more spatial distribution details where it is relevant. We could isolate three educational levels: a lower (ISCED 1-2), a middle (ISCED 3-4), and a higher (ISCED 5-7).
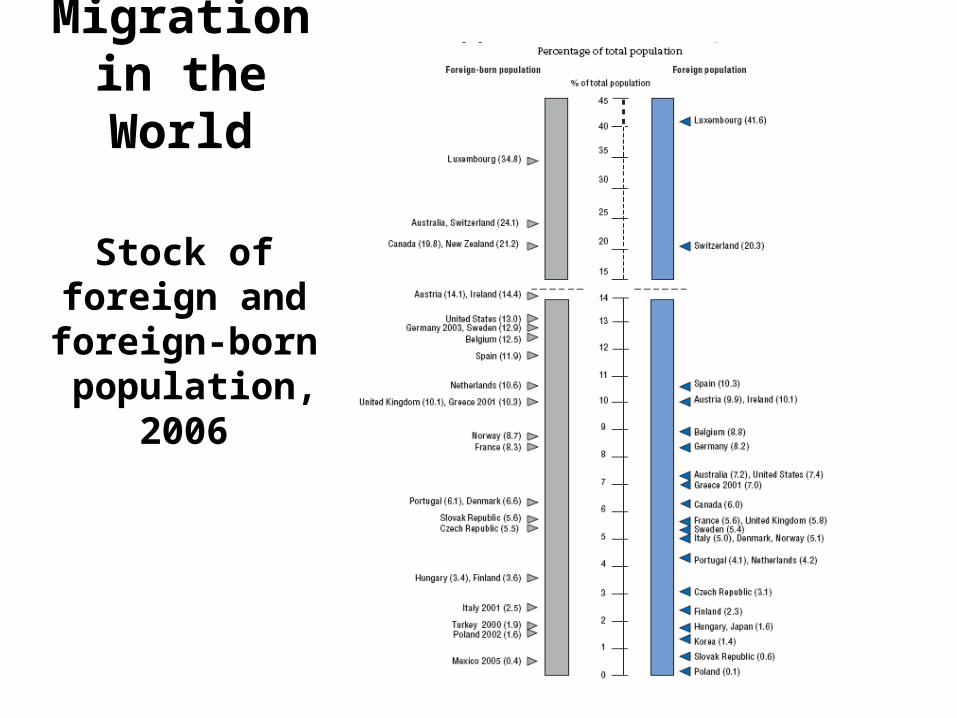
Migration in the World
Stock of foreign and foreign-
born population,
2006
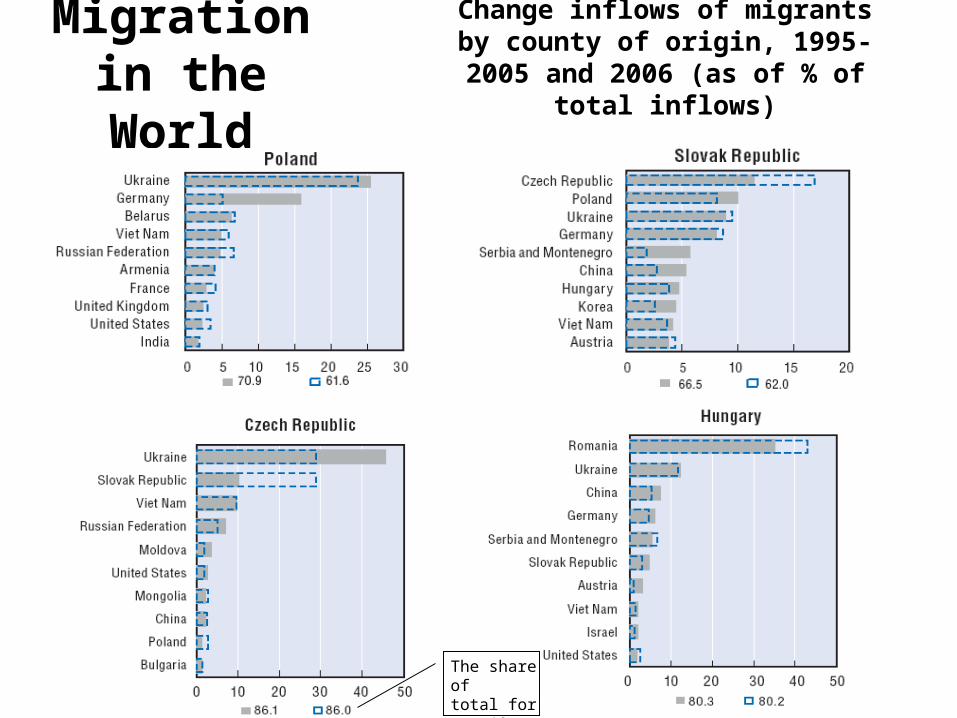
Change inflows of migrants by county of origin, 1995-2005 and 2006 (as of % of
total inflows)
Migration in the World
The share of total for top 10 country
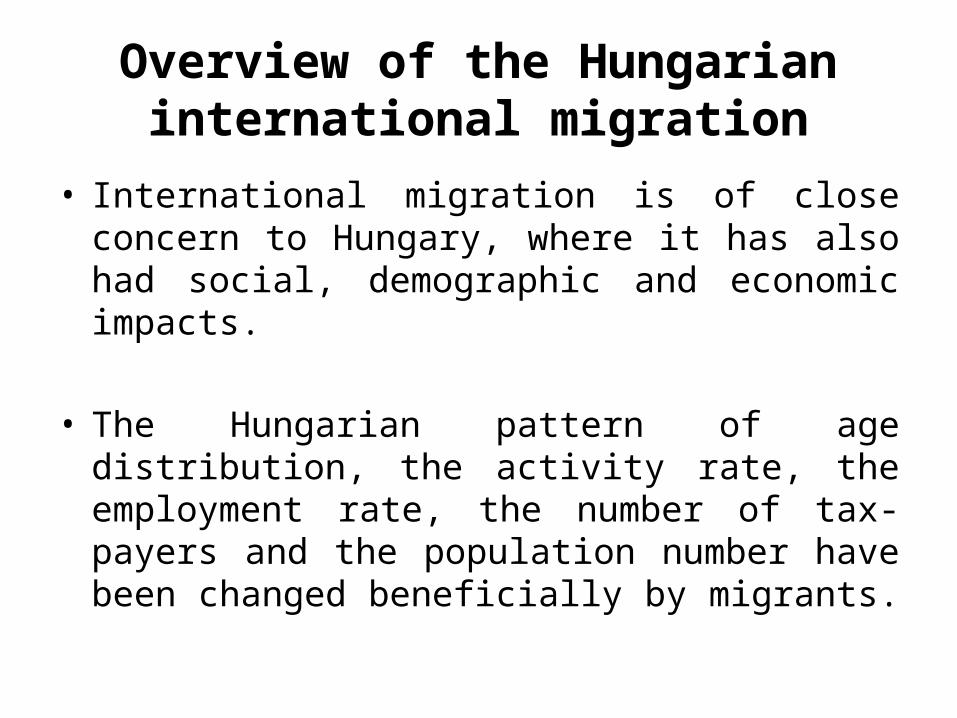
Overview of the Hungarian international migration
• International migration is of close concern to Hungary, where it has also had social, demographic and economic impacts.
• The Hungarian pattern of age distribution, the activity rate, the employment rate, the number of tax-payers and the population number have been changed beneficially by migrants.
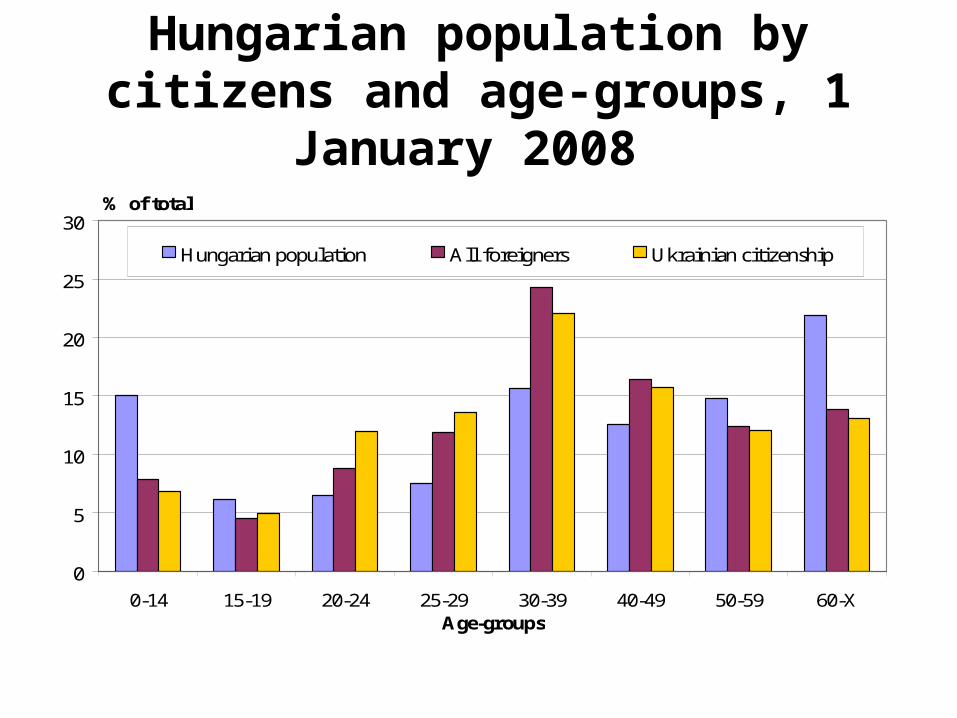
Hungarian population by citizens and age-groups, 1
January 2008
0
5
10
15
20
25
30
0-14 15-19 20-24 25-29 30-39 40-49 50-59 60-XAge-groups
% of total
Hungarian population All foreigners Ukrainian citizenship
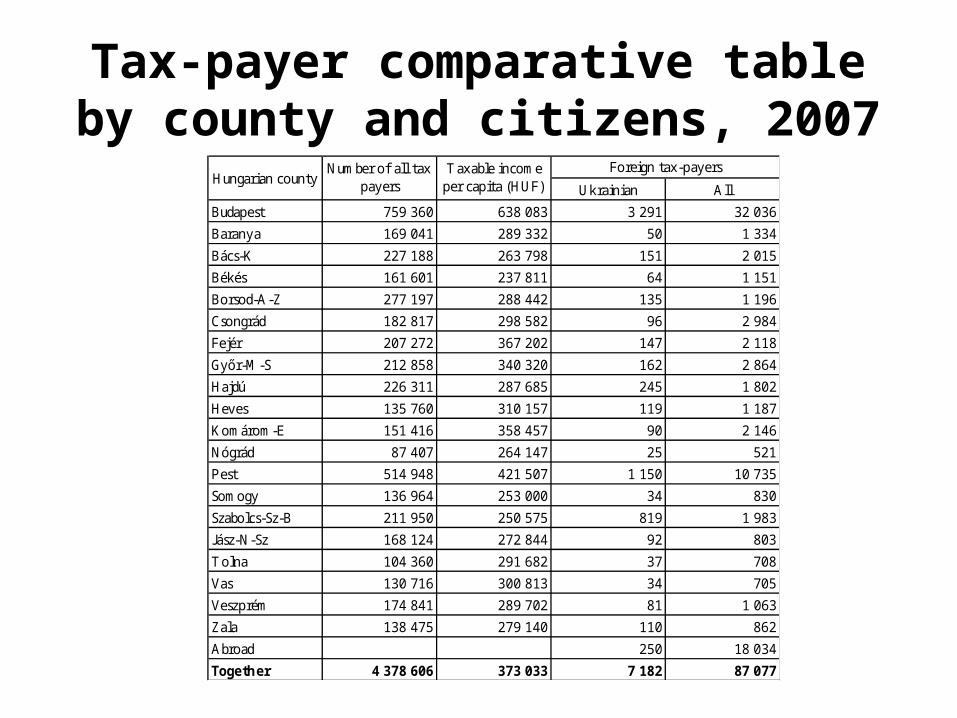
Tax-payer comparative table by county and citizens, 2007
Ukrainian All
Budapest 759 360 638 083 3 291 32 036
Baranya 169 041 289 332 50 1 334
Bács-K 227 188 263 798 151 2 015
Békés 161 601 237 811 64 1 151
Borsod-A-Z 277 197 288 442 135 1 196
Csongrád 182 817 298 582 96 2 984
Fejér 207 272 367 202 147 2 118
Győr-M-S 212 858 340 320 162 2 864
Hajdú 226 311 287 685 245 1 802
Heves 135 760 310 157 119 1 187
Komárom-E 151 416 358 457 90 2 146
Nógrád 87 407 264 147 25 521
Pest 514 948 421 507 1 150 10 735
Somogy 136 964 253 000 34 830
Szabolcs-Sz-B 211 950 250 575 819 1 983
Jász-N-Sz 168 124 272 844 92 803
T olna 104 360 291 682 37 708
Vas 130 716 300 813 34 705
Veszprém 174 841 289 702 81 1 063
Zala 138 475 279 140 110 862
Abroad 250 18 034
Toge the r 4 378 606 373 033 7 182 87 077
Hungarian countyNumber of all t ax
payersT axable income
per capita (HUF)Foreign tax-payers
Foreign citizens in Hungary
• Since the beginning of the 1990’s, there has been a positive balance in international migration in Hungary. Of the 174 697 foreign people resident in Hungary on 1st January 2008 (1,7% of total population), 40% of them are Romanian, 10% of them are Ukrainian respectively Serbian citizens. Their share has increased, and their spatial concentration has decreased a bit in Hungary. So there are about 17 000 Ukranian people residents in Hungary, and I have to make note of it, that since 1993, 10 299 Ukranian people have similarly become Hungarian citizens (97% of them Hungarian-speaking).
• The one of the most considerable group of foreign population is the Ukrainain citizens in Hungary. That’s why important to know what kind of features and spatial impacts characterize the international migration between these two neighbouring countries. We are going to examine the migration system from Ukraine to Hungary.
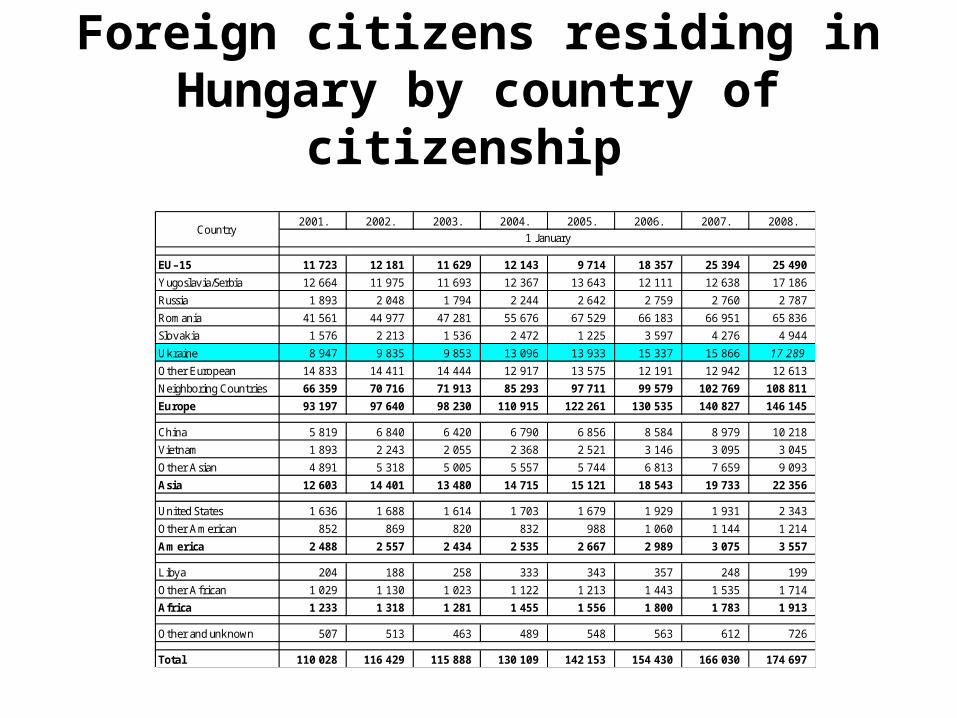
Foreign citizens residing in Hungary by country of
citizenship 2001. 2002. 2003. 2004. 2005. 2006. 2007. 2008.
EU–15 11 723 12 181 11 629 12 143 9 714 18 357 25 394 25 490
Yugoslavia/Serbia 12 664 11 975 11 693 12 367 13 643 12 111 12 638 17 186
Russia 1 893 2 048 1 794 2 244 2 642 2 759 2 760 2 787
Romania 41 561 44 977 47 281 55 676 67 529 66 183 66 951 65 836
Slovakia 1 576 2 213 1 536 2 472 1 225 3 597 4 276 4 944
Ukraine 8 947 9 835 9 853 13 096 13 933 15 337 15 866 17 289
Other European 14 833 14 411 14 444 12 917 13 575 12 191 12 942 12 613
Neighboring Count ries 66 359 70 716 71 913 85 293 97 711 99 579 102 769 108 811
Europe 93 197 97 640 98 230 110 915 122 261 130 535 140 827 146 145
China 5 819 6 840 6 420 6 790 6 856 8 584 8 979 10 218
Vietnam 1 893 2 243 2 055 2 368 2 521 3 146 3 095 3 045
Other Asian 4 891 5 318 5 005 5 557 5 744 6 813 7 659 9 093
Asia 12 603 14 401 13 480 14 715 15 121 18 543 19 733 22 356
United States 1 636 1 688 1 614 1 703 1 679 1 929 1 931 2 343
Other American 852 869 820 832 988 1 060 1 144 1 214
Am e rica 2 488 2 557 2 434 2 535 2 667 2 989 3 075 3 557
Libya 204 188 258 333 343 357 248 199
Other African 1 029 1 130 1 023 1 122 1 213 1 443 1 535 1 714
Africa 1 233 1 318 1 281 1 455 1 556 1 800 1 783 1 913
Other and unknown 507 513 463 489 548 563 612 726
Total 110 028 116 429 115 888 130 109 142 153 154 430 166 030 174 697
Country1 January
Ukrainian citizens in Hungary
• As we can see, the effects of neighbouring countries are powerful and have gradually increased. The Ukranian – Hungarian migration relationships are traditionally strong. The most affected Hungarian settlements are Budapest (6243 person), Nyíregyháza (1010), Debrecen (579), Kisvárda (279) and Miskolc (210); and such counties are Budapest (6243), Szabolcs-Szatmár-Bereg (4179), Pest (2139) and Hajdú-Bihar (823), where more than 77% of migrants live.
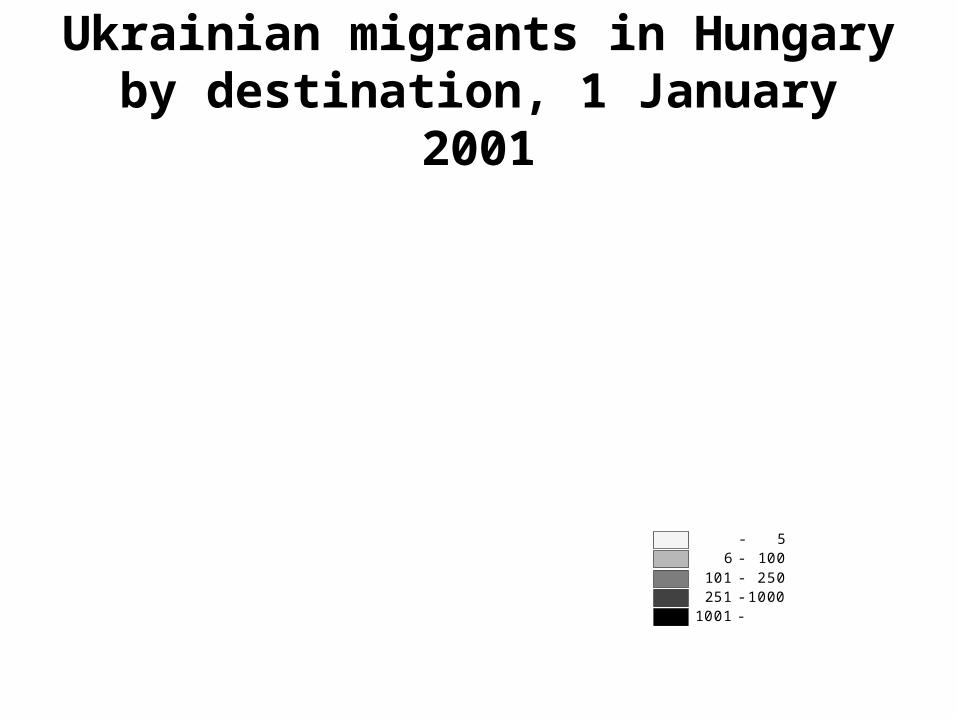
Ukrainian migrants in Hungary by destination, 1 January 2001
- 5 6 - 100 101 - 250 251 - 10001001 -
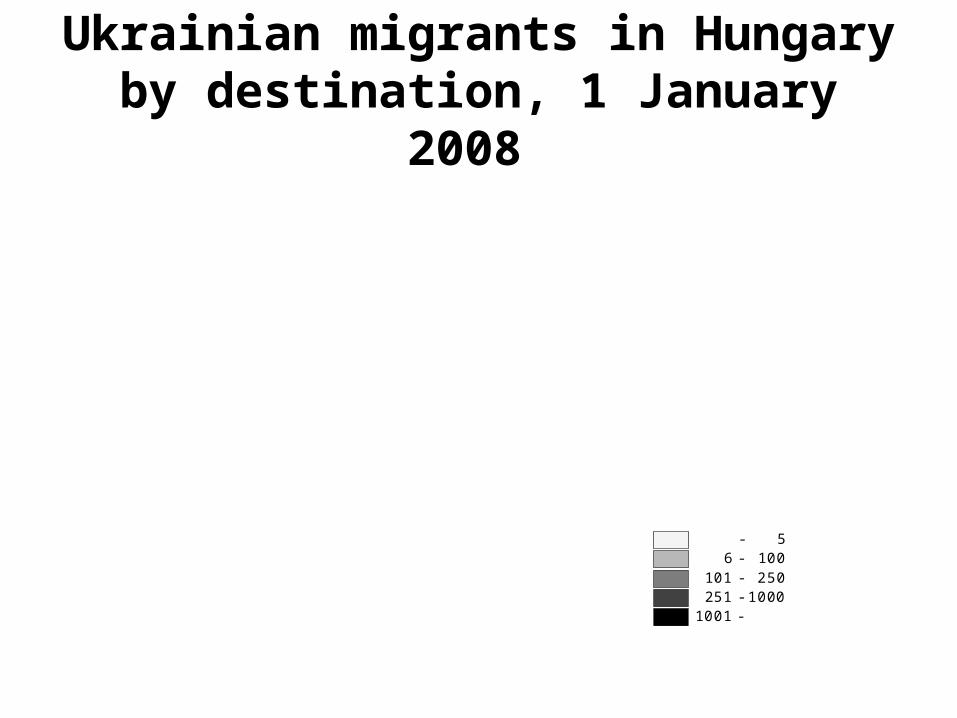
Ukrainian migrants in Hungary by destination, 1 January 2008
- 5 6 - 100 101 - 250 251 - 10001001 -
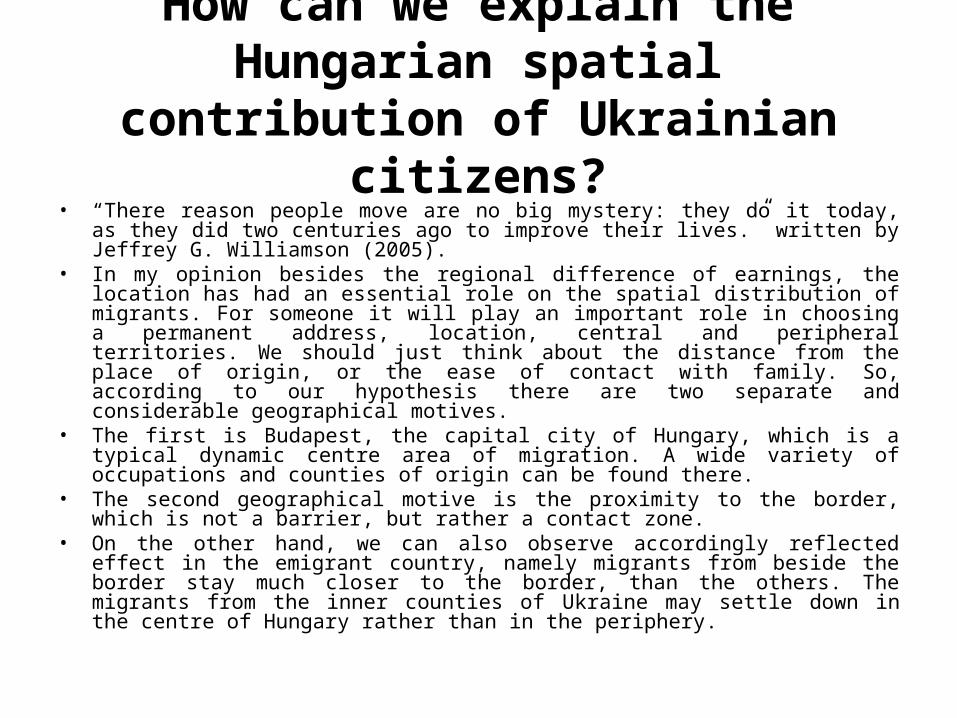
How can we explain the Hungarian spatial
contribution of Ukrainian citizens?
• “There reason people move are no big mystery: they do it today, as they did two centuries ago to improve their lives.” written by Jeffrey G. Williamson (2005).
• In my opinion besides the regional difference of earnings, the location has had an essential role on the spatial distribution of migrants. For someone it will play an important role in choosing a permanent address, location, central and peripheral territories. We should just think about the distance from the place of origin, or the ease of contact with family. So, according to our hypothesis there are two separate and considerable geographical motives.
• The first is Budapest, the capital city of Hungary, which is a typical dynamic centre area of migration. A wide variety of occupations and counties of origin can be found there.
• The second geographical motive is the proximity to the border, which is not a barrier, but rather a contact zone.
• On the other hand, we can also observe accordingly reflected effect in the emigrant country, namely migrants from beside the border stay much closer to the border, than the others. The migrants from the inner counties of Ukraine may settle down in the centre of Hungary rather than in the periphery.
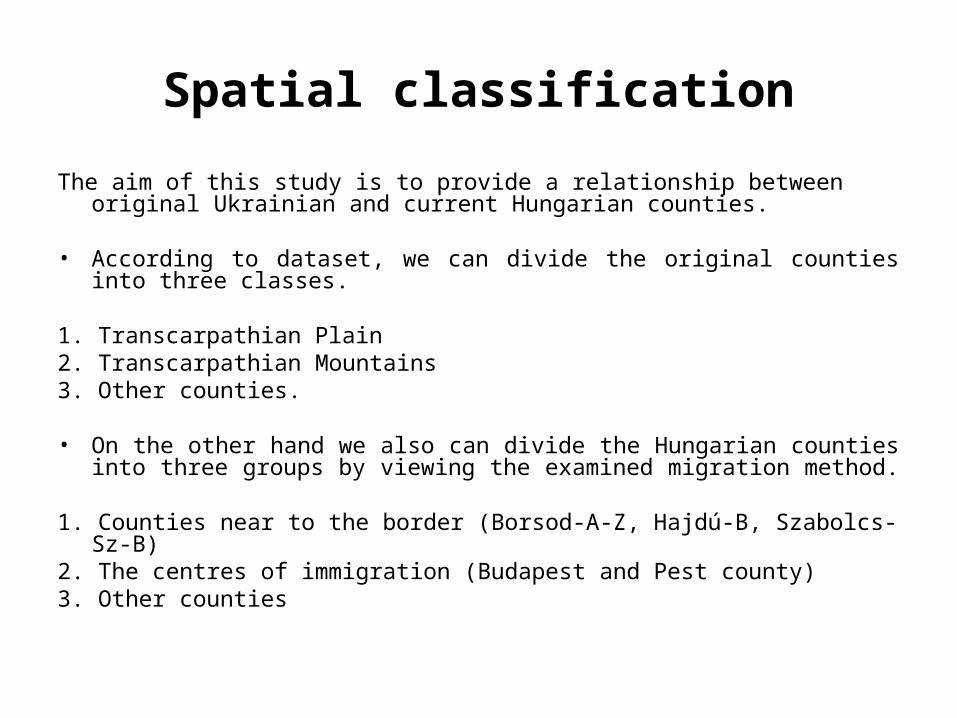
Spatial classification
The aim of this study is to provide a relationship between original Ukrainian and current Hungarian counties.
• According to dataset, we can divide the original counties into three classes.
1. Transcarpathian Plain 2. Transcarpathian Mountains 3. Other counties. • On the other hand we also can divide the Hungarian counties into three
groups by viewing the examined migration method.
1. Counties near to the border (Borsod-A-Z, Hajdú-B, Szabolcs-Sz-B)2. The centres of immigration (Budapest and Pest county)3. Other counties
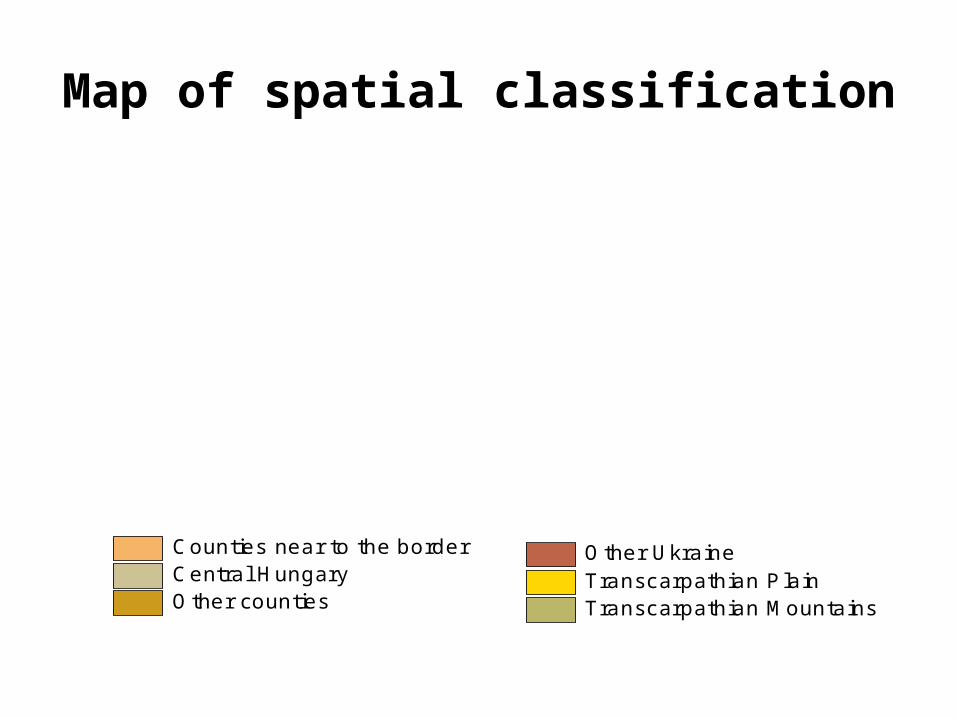
Map of spatial classification
Other UkraineTranscarpathian Plain Transcarpathian Mountains
Counties near to the border Central HungaryOther counties
Spatial distributions
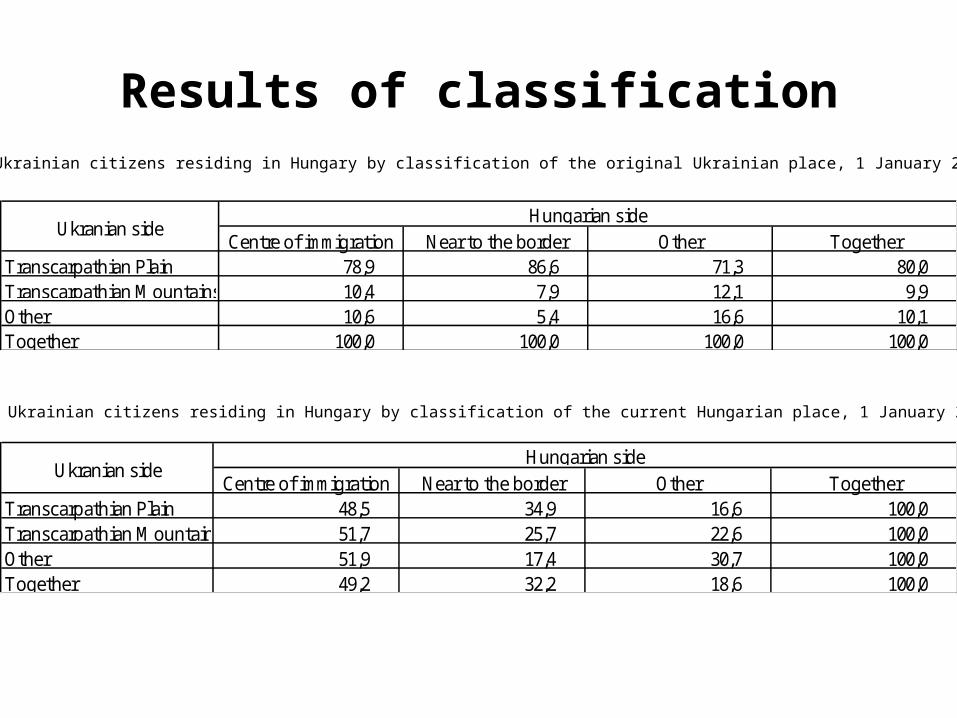
• It is important to note that between Transcarpathian Plan and Central Hungary there are strong migration flows (40% of all migrants). So this migration phenomenon is quite concentrated. Using the above classification, we can point out that Ukrainian people who now live near to the border, come in greatest number from proximity to border of Ukrainian side (86,6%). But most of the Ukrainian migrants, whose birthplace near to the border, have stayed in centre of Hungary (48,5%). Budapest and Pest County are chosen very likely by other immigrants independently of place of origin.
Results of classification
Centre of immigration Near to the border Other TogetherTranscarpathian Plain 78,9 86,6 71,3 80,0Transcarpathian Mountains 10,4 7,9 12,1 9,9Other 10,6 5,4 16,6 10,1Together 100,0 100,0 100,0 100,0
Hungarian s ideUkranian s ide
Centre of immigration Near to the border Other TogetherTranscarpathian Plain 48,5 34,9 16,6 100,0Transcarpathian Mountains 51,7 25,7 22,6 100,0Other 51,9 17,4 30,7 100,0Together 49,2 32,2 18,6 100,0
Hungarian s ideUkranian s ide
Distribution of Ukrainian citizens residing in Hungary by classification of the original Ukrainian place, 1 January 2008
Distribution of Ukrainian citizens residing in Hungary by classification of the current Hungarian place, 1 January 2008
Detailed examinations-1
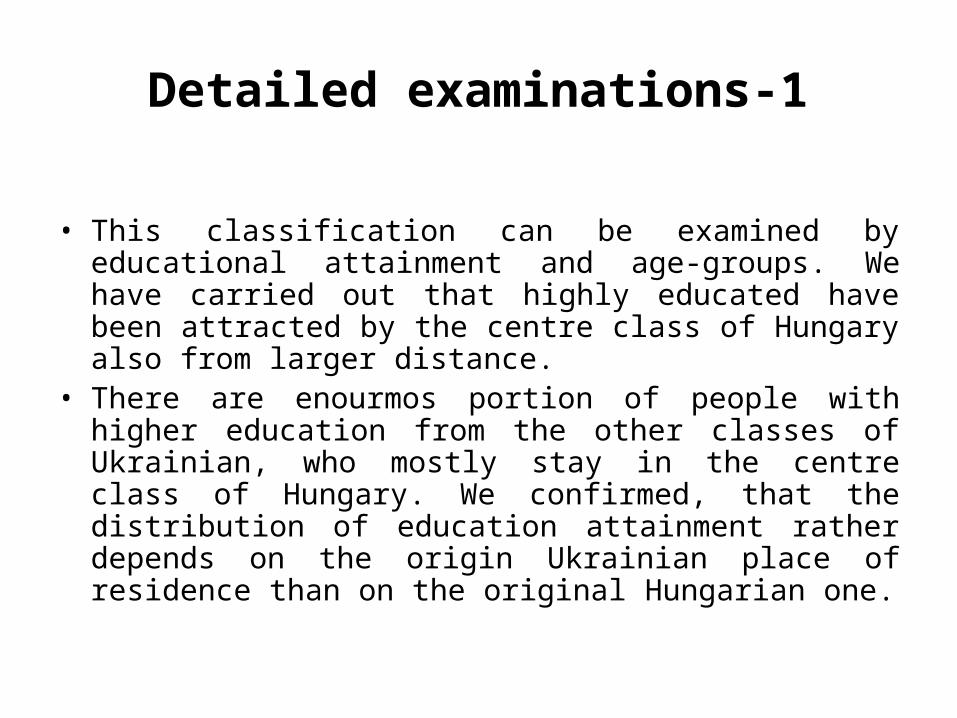
• This classification can be examined by educational attainment and age-groups. We have carried out that highly educated have been attracted by the centre class of Hungary also from larger distance.
• There are enourmos portion of people with higher education from the other classes of Ukrainian, who mostly stay in the centre class of Hungary. We confirmed, that the distribution of education attainment rather depends on the origin Ukrainian place of residence than on the original Hungarian one.
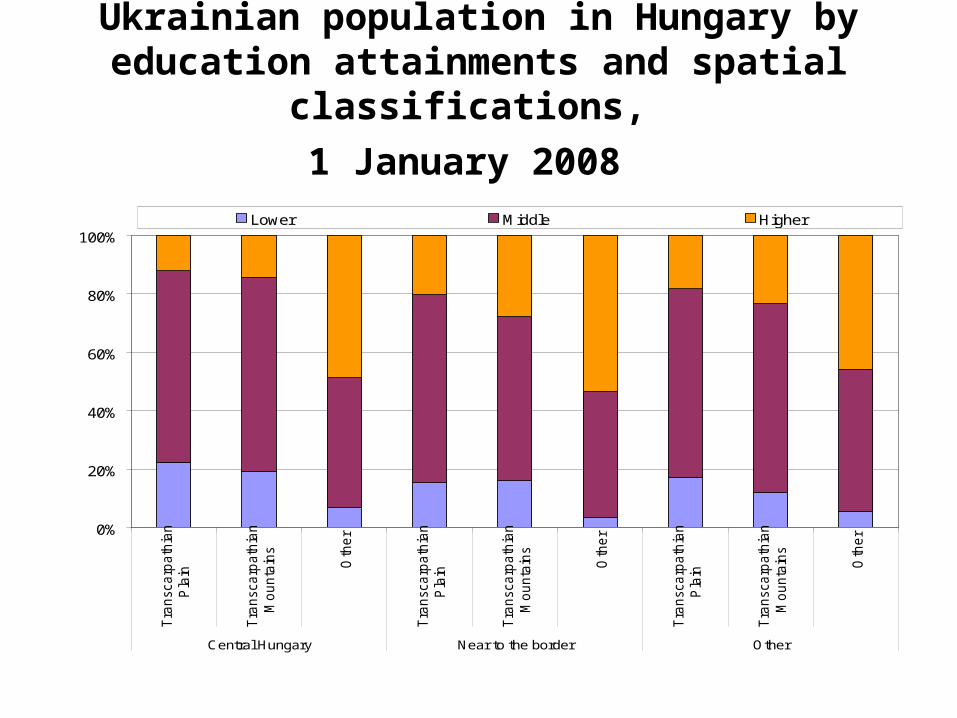
Ukrainian population in Hungary by education attainments and spatial
classifications,
1 January 2008
0%
20%
40%
60%
80%
100%
Tra
nscarp
ath
ian
Pla
in
Tra
nscarp
ath
ian
Mounta
ins
Oth
er
Tra
nscarp
ath
ian
Pla
in
Tra
nscarp
ath
ian
Mounta
ins
Oth
er
Tra
nscarp
ath
ian
Pla
in
Tra
nscarp
ath
ian
Mounta
ins
Oth
er
Central Hungary Near to the border Other
Lower Middle Higher
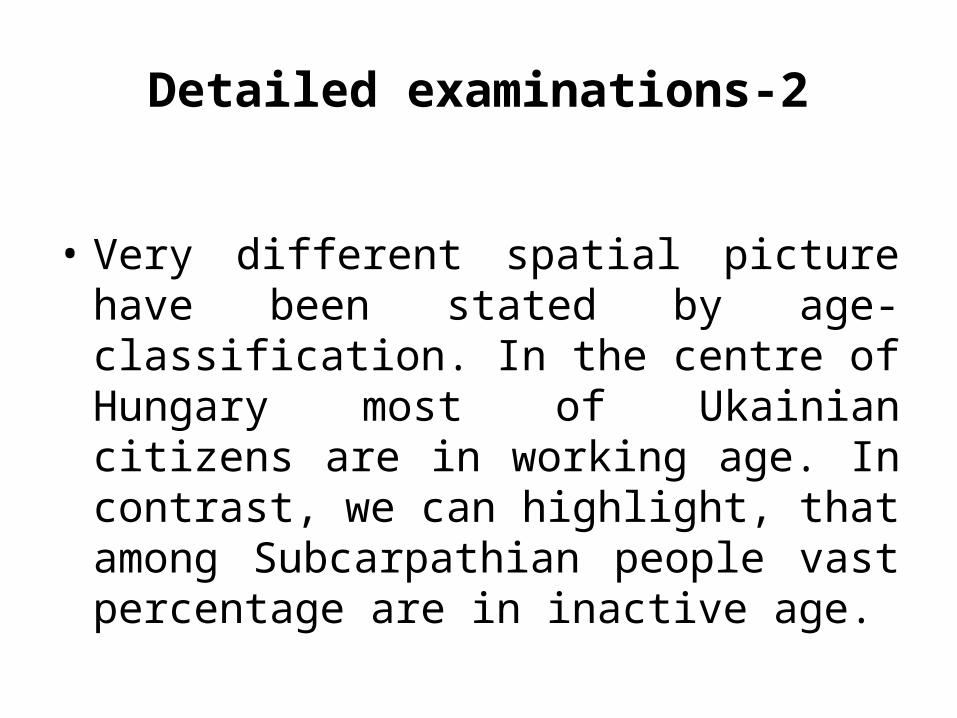
Detailed examinations-2
• Very different spatial picture have been stated by age-classification. In the centre of Hungary most of Ukainian citizens are in working age. In contrast, we can highlight, that among Subcarpathian people vast percentage are in inactive age.
Ukrainian population in Hungary by age-groups and spatial classifications,
1 January 2008
0%
20%
40%
60%
80%
100%
Tra
nscarp
ath
ian
Pla
in
Tra
nscarp
ath
ian
Mounta
ins
Oth
er
Tra
nscarp
ath
ian
Pla
in
Tra
nscarp
ath
ian
Mounta
ins
Oth
er
Tra
nscarp
ath
ian
Pla
in
Tra
nscarp
ath
ian
Mounta
ins
Oth
er
Central Hungary Near to the border Other
00-18 19-24 25-39 40-49 50-59 60- X
Data source: Derzhkomstat, www.ukrstat.gov.ua, Author: Dávid Karácsonyi
Demographical and migration situation in Ukraine
-12,0
-10,0
-8,0
-6,0
-4,0
-2,0
0,0
2,0
4,0
6,0
8,0
1990
1991
1992
1993
1994
1995
1996
1997
1998
1999
2000
2001
2002
2003
2004
2005
2006
2007
0,0
2,0
4,0
6,0
8,0
10,0
12,0
14,0
16,0
18,0
< natural change< balance of international migration< total changecrude birth rate >crude death rate (-) >
°% °%
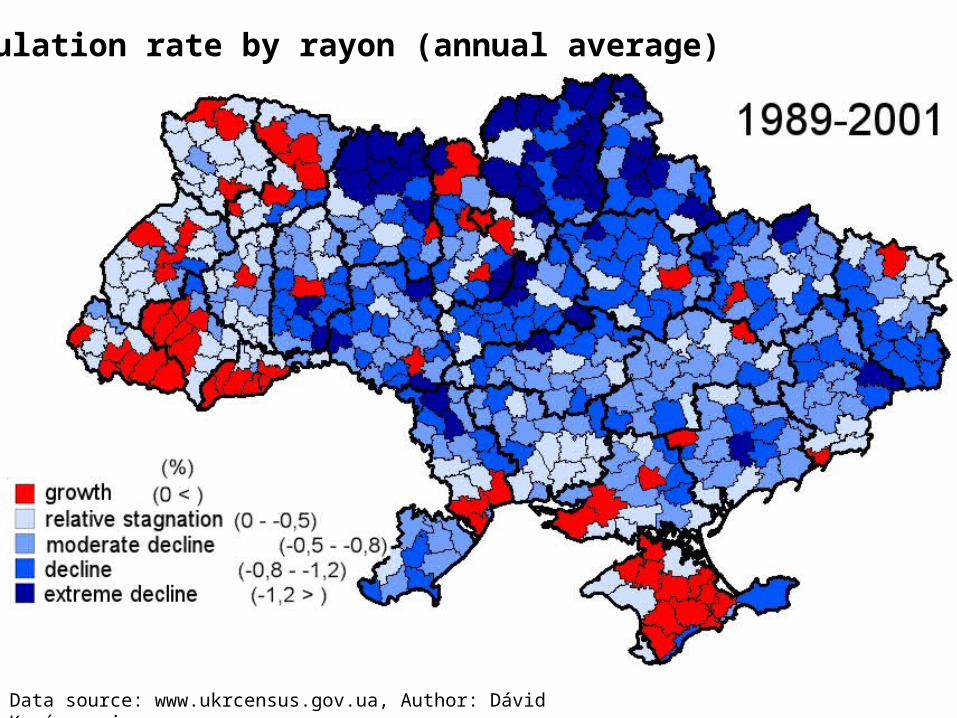
Population rate by rayon (annual average)
Data source: www.ukrcensus.gov.ua, Author: Dávid Karácsonyi
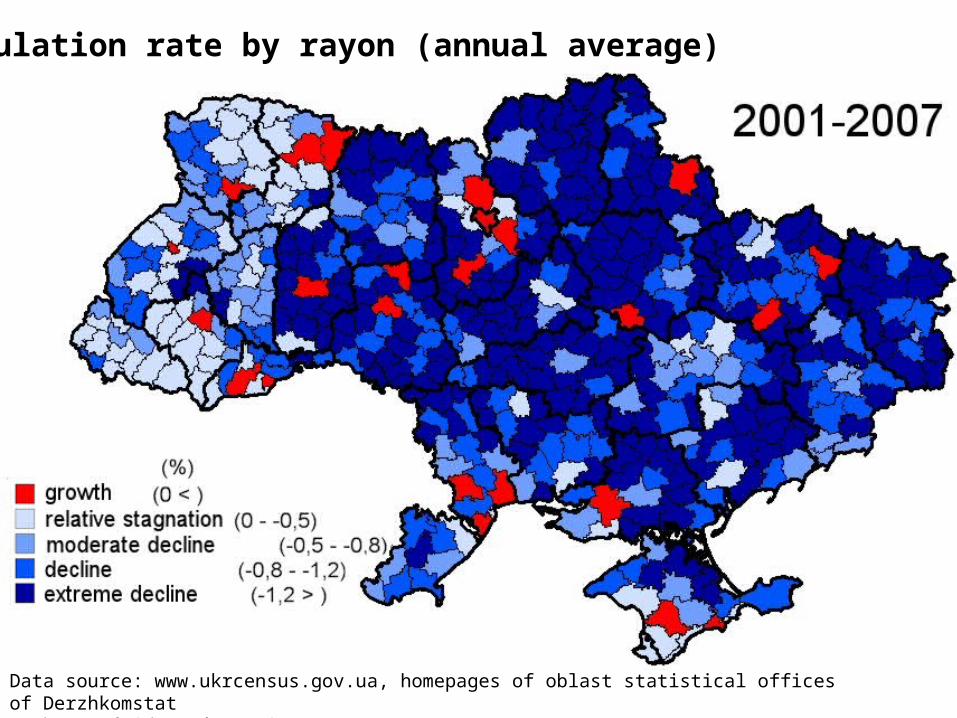
Population rate by rayon (annual average)
Data source: www.ukrcensus.gov.ua, homepages of oblast statistical offices of DerzhkomstatAuthor: Dávid Karácsonyi
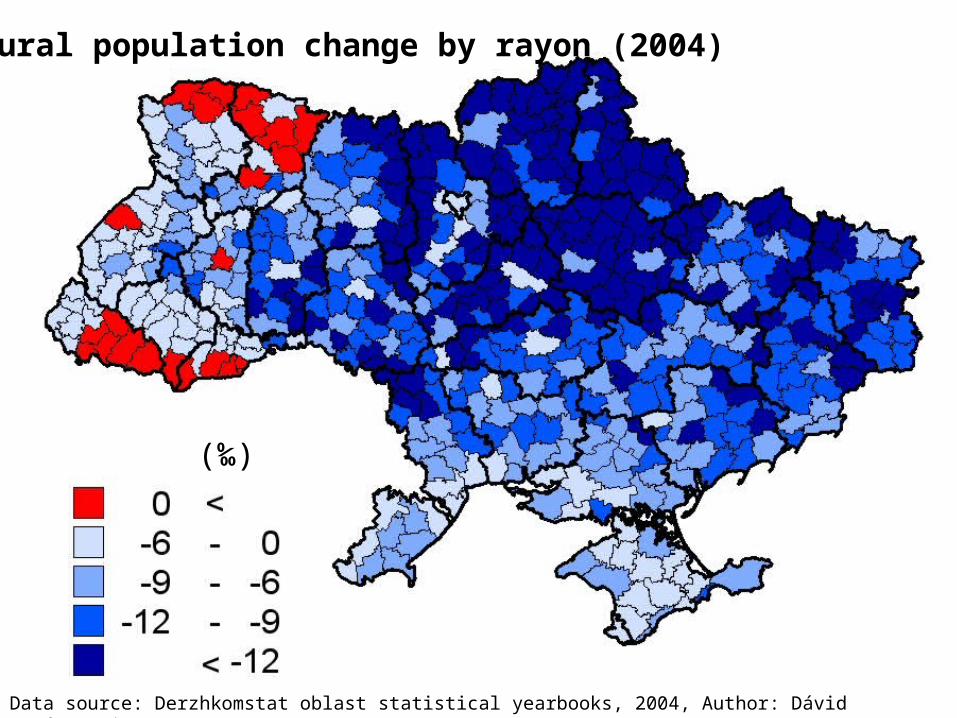
Natural population change by rayon (2004)
Data source: Derzhkomstat oblast statistical yearbooks, 2004, Author: Dávid Karácsonyi
(‰)
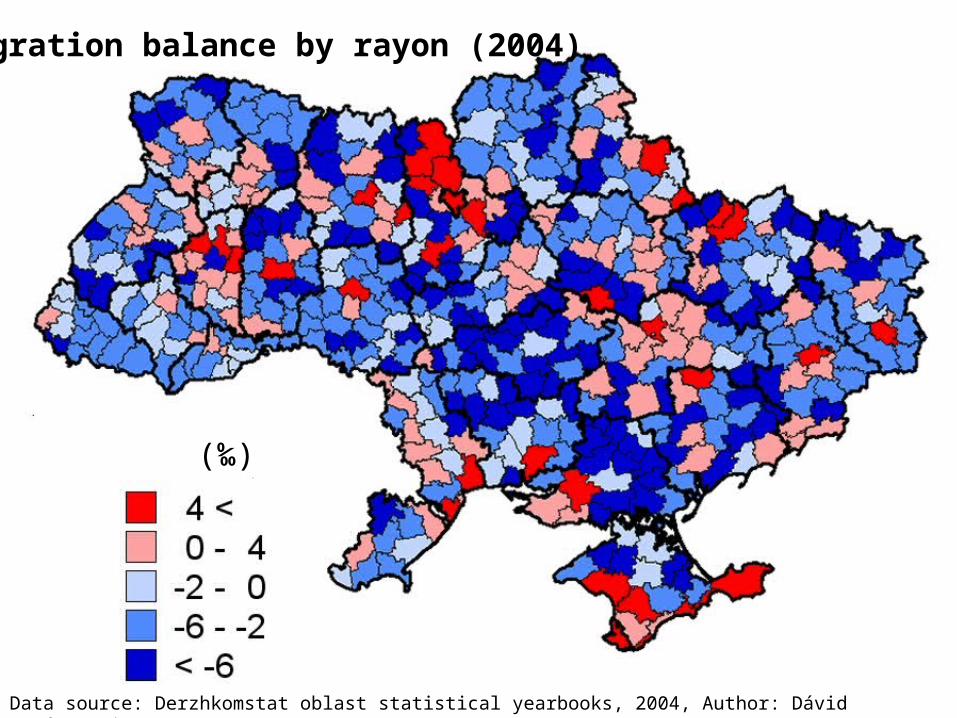
Migration balance by rayon (2004)
Data source: Derzhkomstat oblast statistical yearbooks, 2004, Author: Dávid Karácsonyi
(‰)
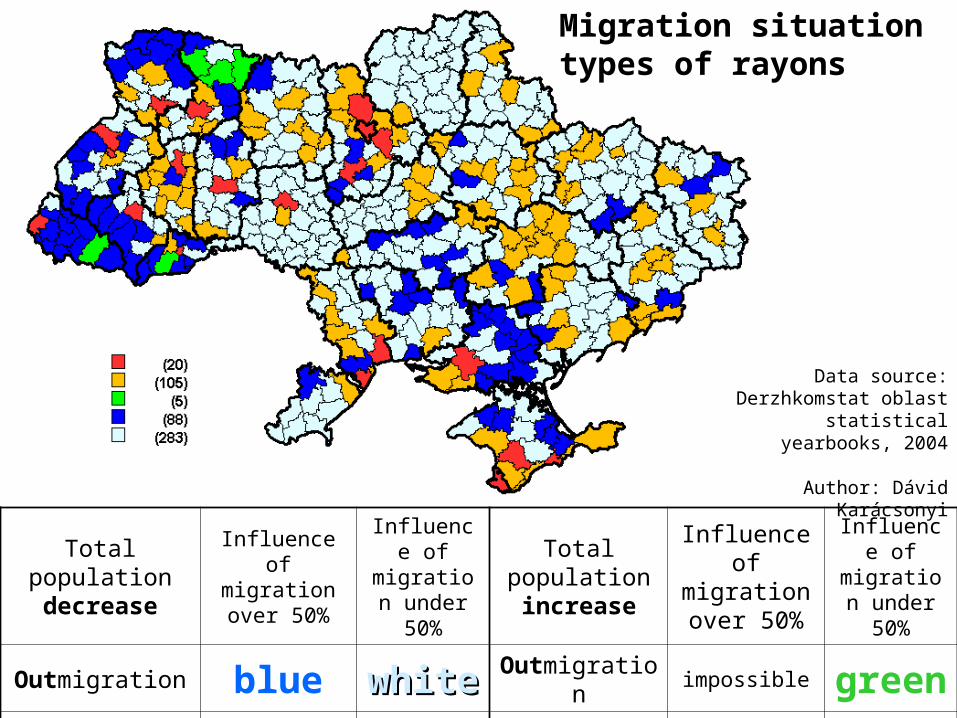
Total population decrease
Influence of migration over
50%
Influence of migration
under 50%
Total population increase
Influence of migration over 50%
Influence of migration
under 50%
Outmigration blue whitewhite Outmigration impossible green
Inmigration impossible orange Inmigration red no such unit
Data source: Derzhkomstat oblast
statistical yearbooks, 2004
Author: Dávid Karácsonyi
Migration situation types of rayons
Data source: www.ukrcensus.gov.ua, Author: Dávid Karácsonyi
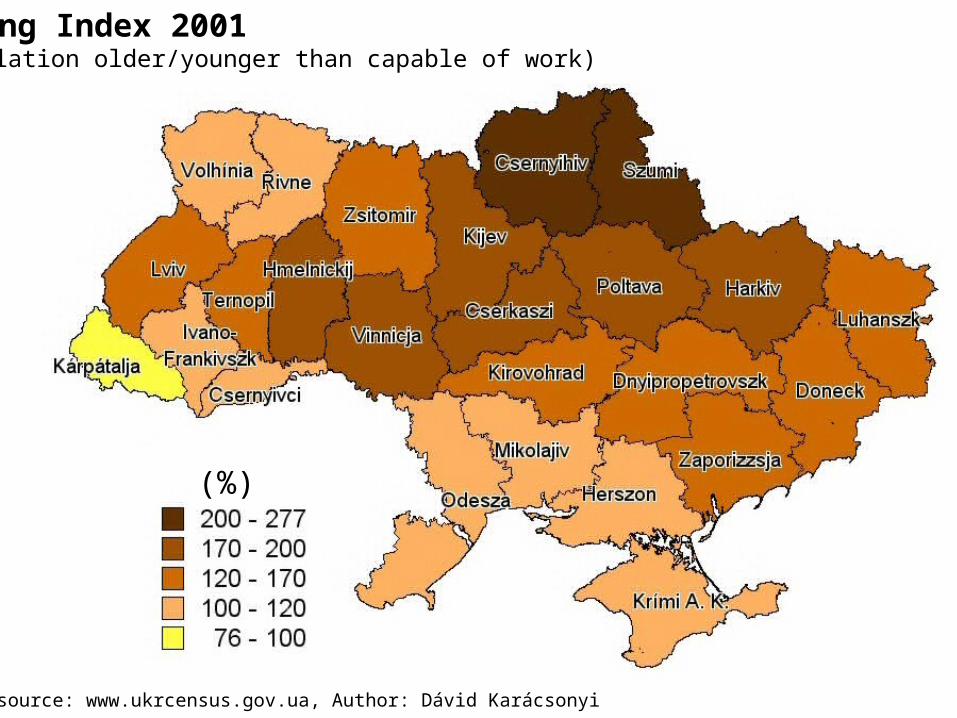
Ageing Index 2001(population older/younger than capable of work)
(%)
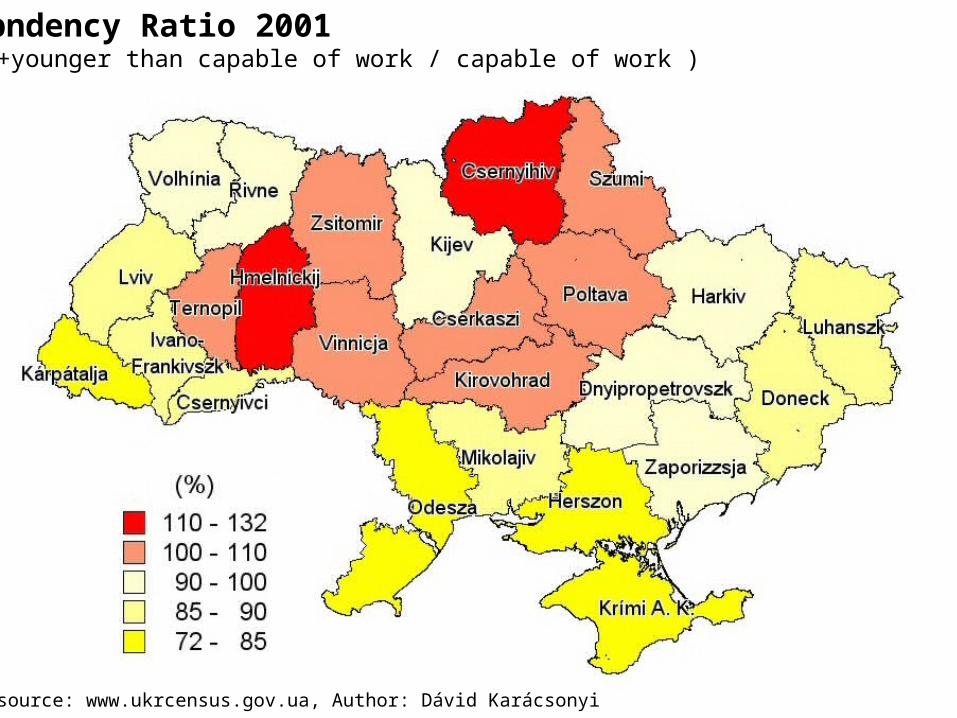
Denepndency Ratio 2001(older+younger than capable of work / capable of work )
Data source: www.ukrcensus.gov.ua, Author: Dávid Karácsonyi
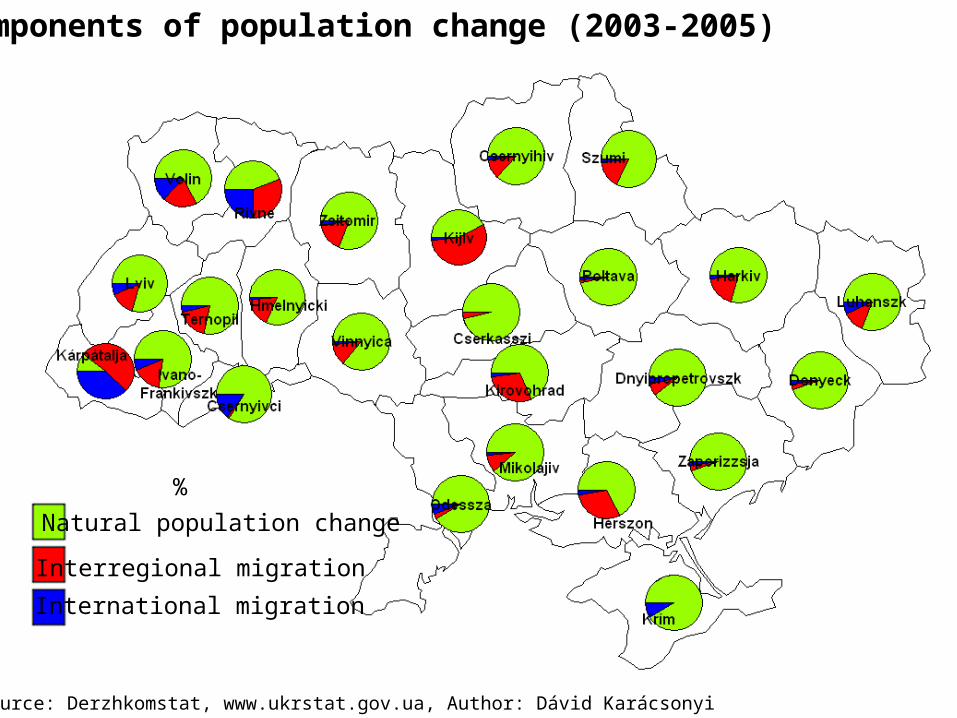
Components of population change (2003-2005)
Natural population change
Interregional migration
International migration
Data source: Derzhkomstat, www.ukrstat.gov.ua, Author: Dávid Karácsonyi
%
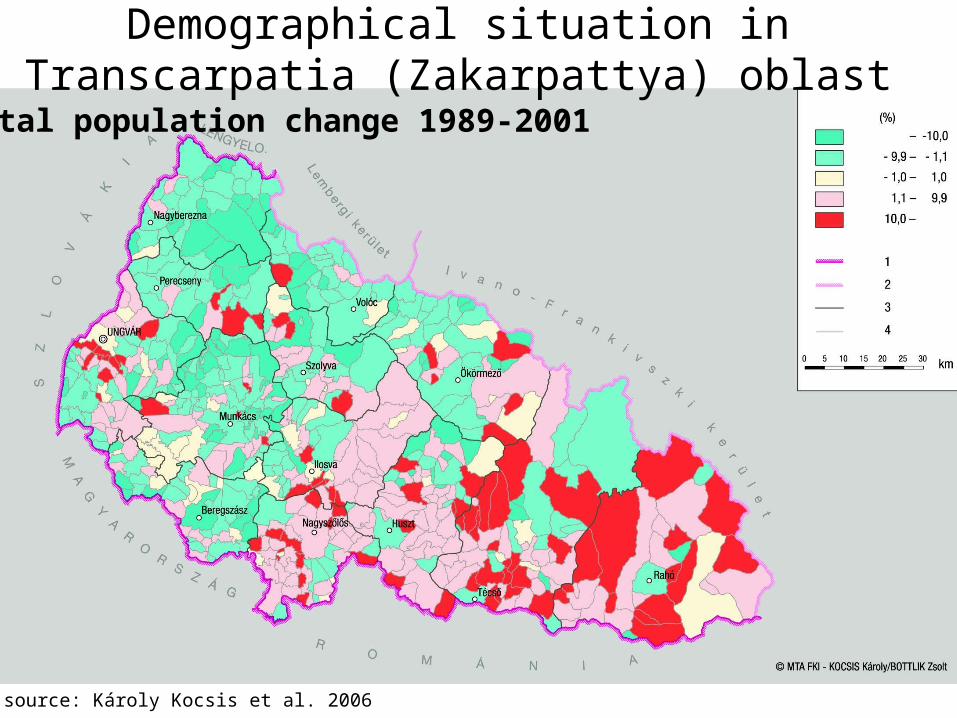
Total population change 1989-2001
Map source: Károly Kocsis et al. 2006
Demographical situation in Transcarpatia (Zakarpattya) oblast
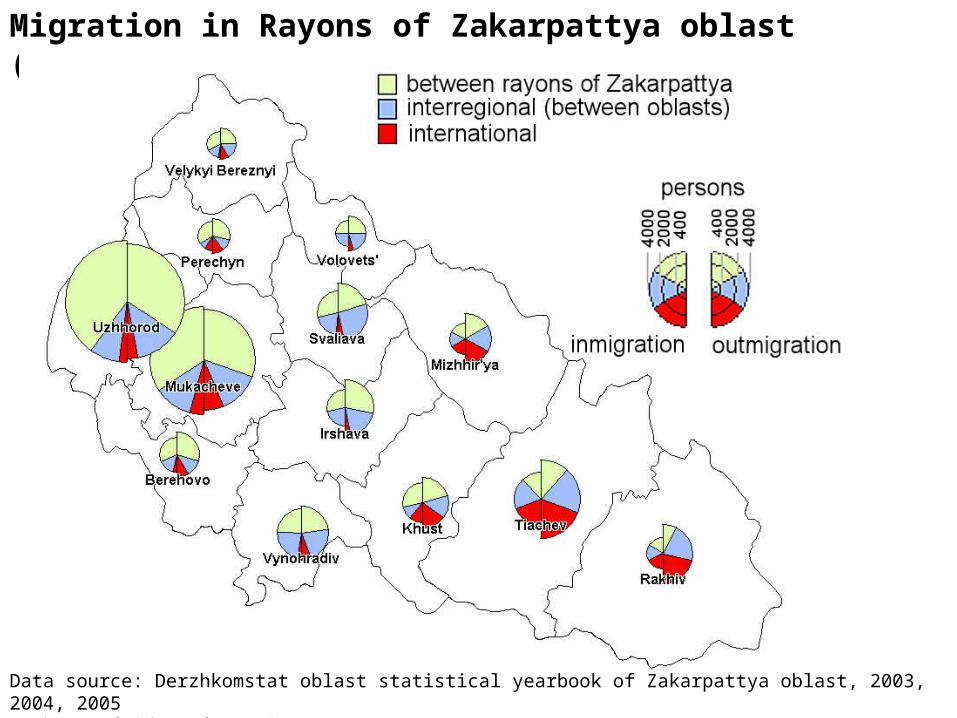
Migration in Rayons of Zakarpattya oblast (2003-2005)
Data source: Derzhkomstat oblast statistical yearbook of Zakarpattya oblast, 2003, 2004, 2005 Author: Dávid Karácsonyi
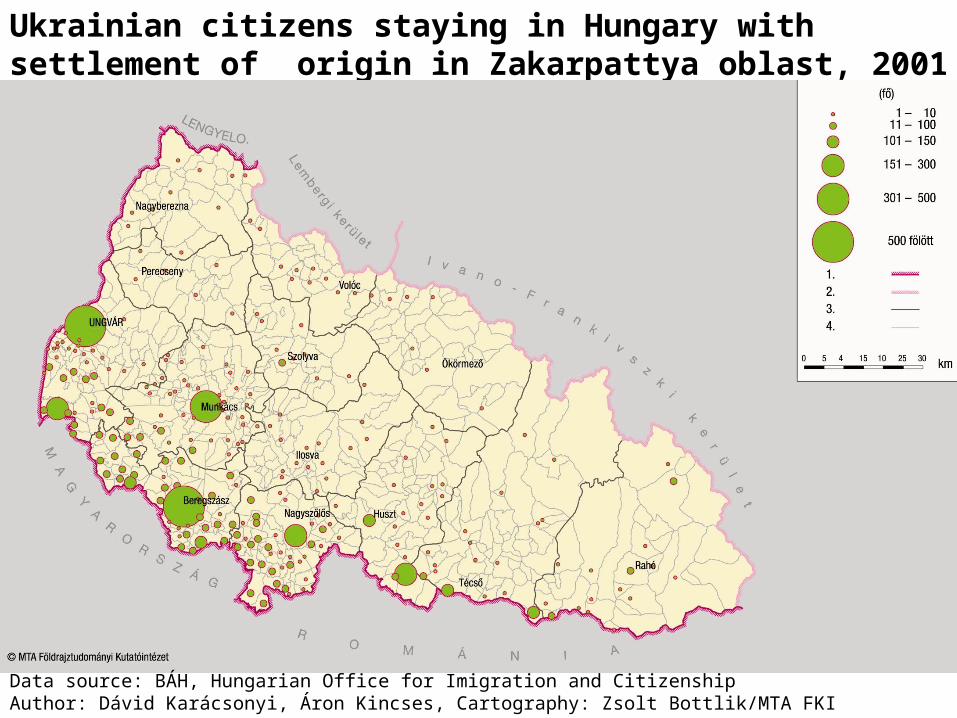
Ukrainian citizens staying in Hungary with settlement of origin in Zakarpattya oblast, 2001
Data source: BÁH, Hungarian Office for Imigration and CitizenshipAuthor: Dávid Karácsonyi, Áron Kincses, Cartography: Zsolt Bottlik/MTA FKI
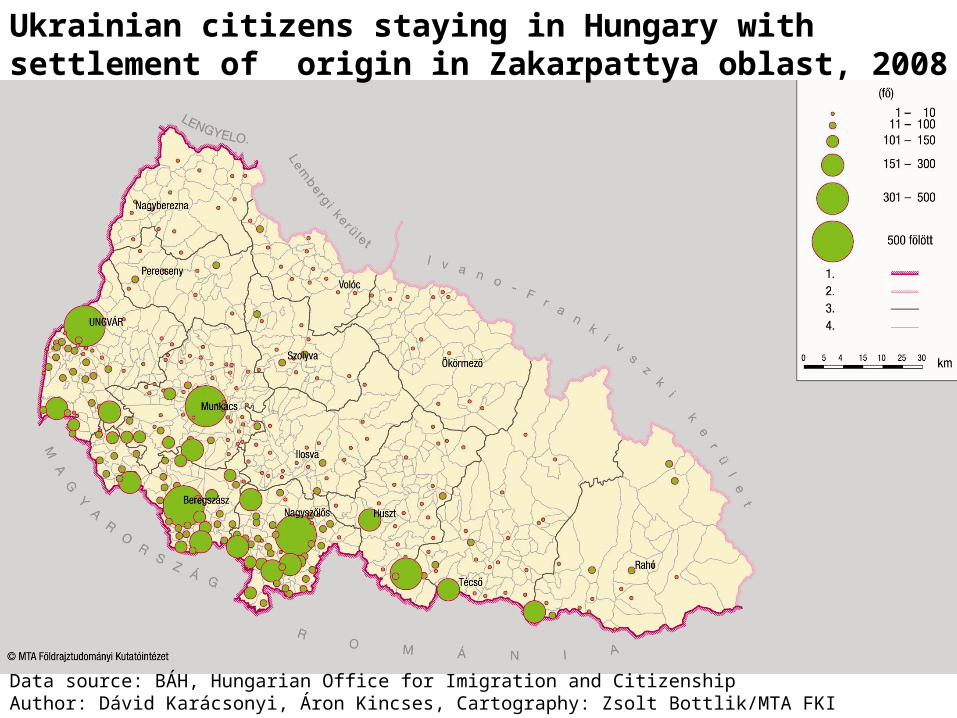
Ukrainian citizens staying in Hungary with settlement of origin in Zakarpattya oblast, 2008
Data source: BÁH, Hungarian Office for Imigration and CitizenshipAuthor: Dávid Karácsonyi, Áron Kincses, Cartography: Zsolt Bottlik/MTA FKI

Ratio of ethnic Ukrainian population, 1989
Map source: Károly Kocsis et al. 2006
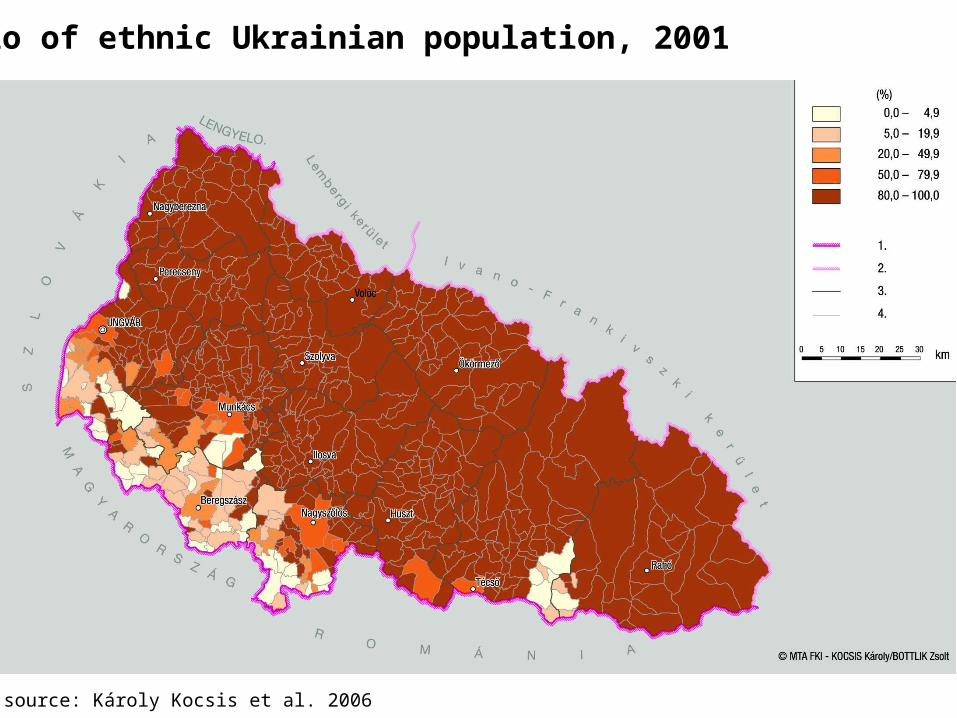
Ratio of ethnic Ukrainian population, 2001
Map source: Károly Kocsis et al. 2006
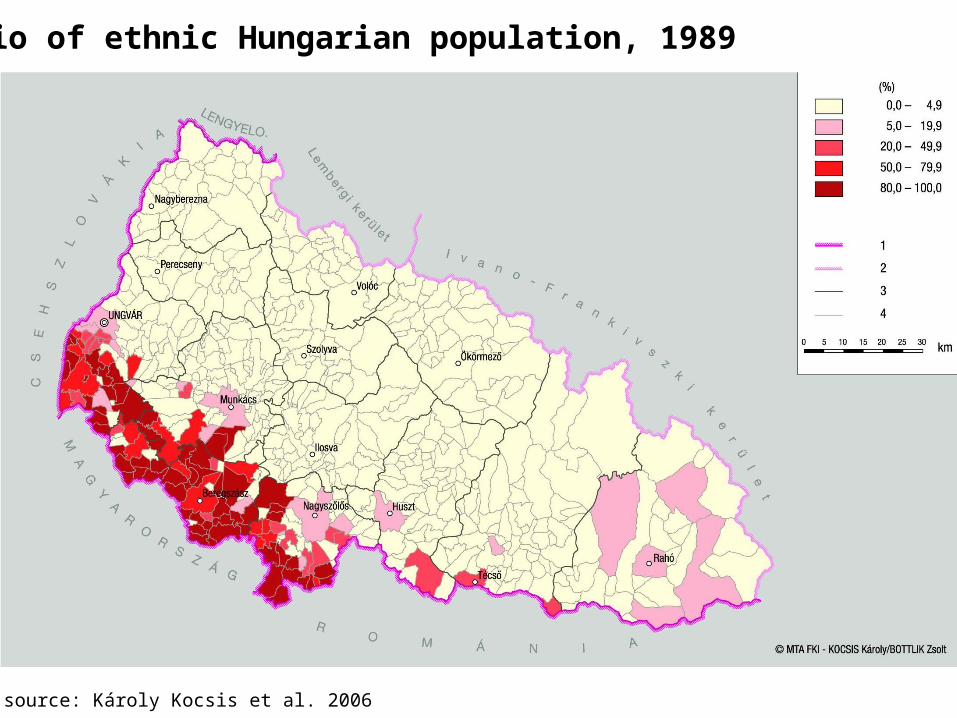
Ratio of ethnic Hungarian population, 1989
Map source: Károly Kocsis et al. 2006
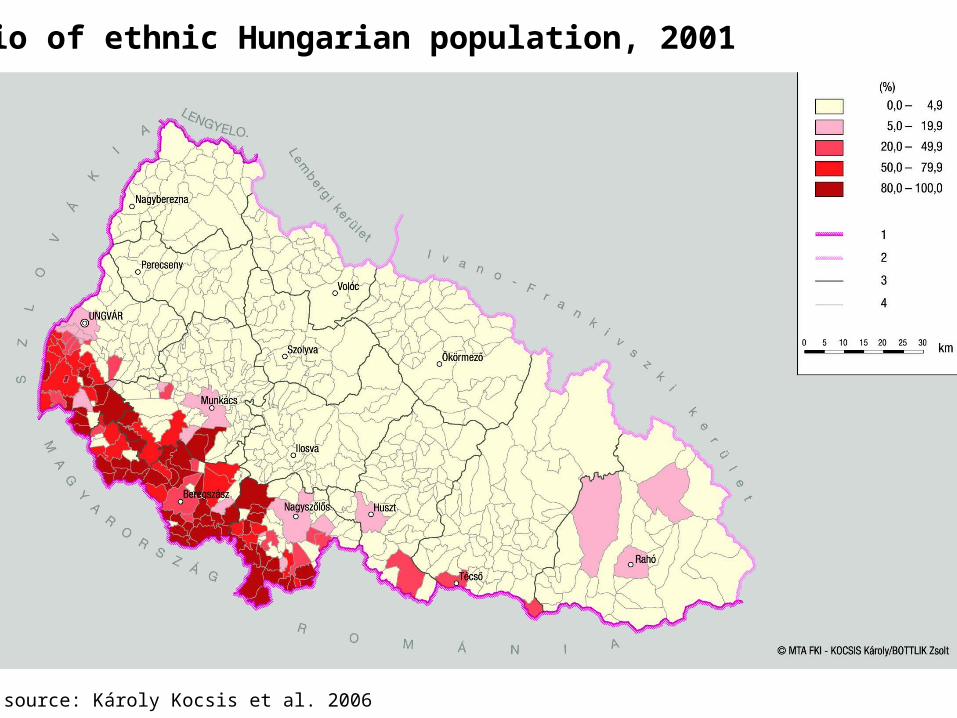
Ratio of ethnic Hungarian population, 2001
Map source: Károly Kocsis et al. 2006
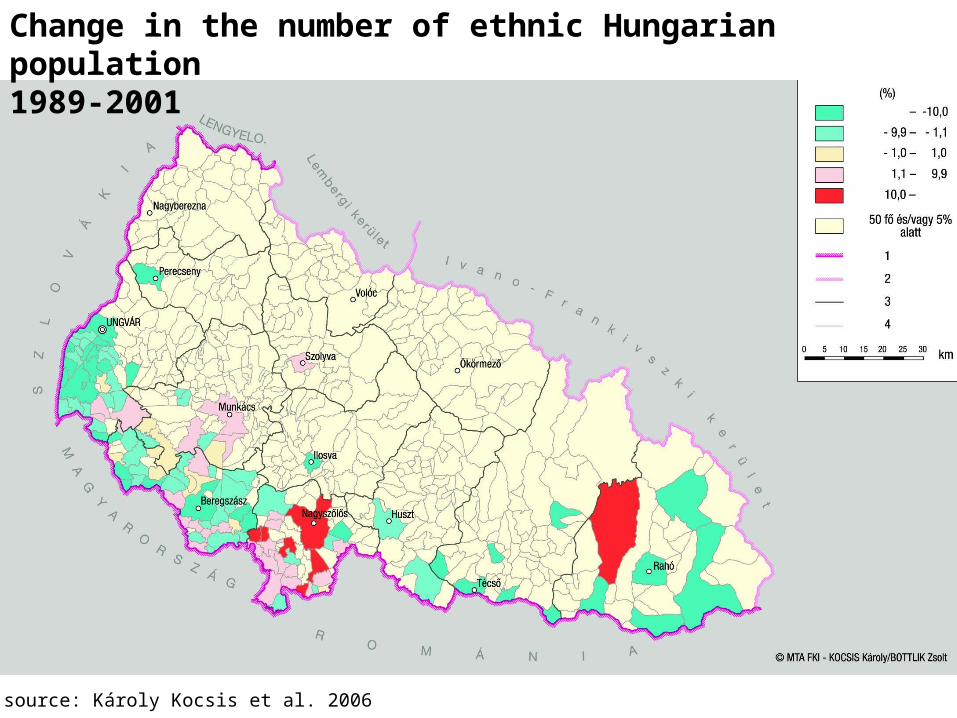
Change in the number of ethnic Hungarian population 1989-2001
Map source: Károly Kocsis et al. 2006
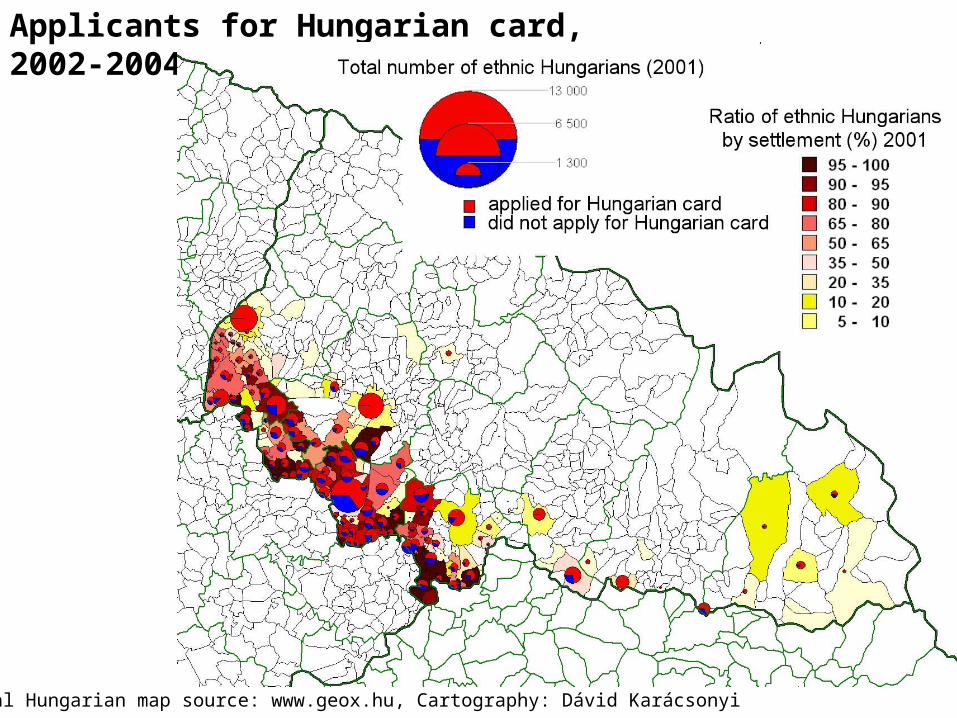
Applicants for Hungarian card, 2002-2004
Original Hungarian map source: www.geox.hu, Cartography: Dávid Karácsonyi
Thank you very much for your attention!Thank you very much for your attention!Köszönjük a szíves figyelmüket!Köszönjük a szíves figyelmüket!Большое спасибо за ваше внимание!Большое спасибо за ваше внимание!