milk marketing and production -...
TRANSCRIPT
Milk production and marketing
Part 2: Product quality and processing
Introduction ............................................................................... 2
Quality of the case study product .............................................. 3
What is ‘quality’? ..............................................................................3
Production factors that affect quality ................................................6
Testing farm product quality ...................................................... 7
How is the raw product quality tested? ............................................7
Quality information feedback to the farmer ....................................20
Importance of product specifications ....................................... 21
Understanding the market place ....................................................21
Raw and processed product specifications....................................24
Processing the raw product..................................................... 26
Processing milk ..............................................................................26
Following processing pathways .....................................................29
Problems meeting product specifications.......................................31
Value Adding........................................................................... 32
Value adding on the farm ...............................................................32
Value adding during processing.....................................................33
Summary................................................................................. 34
Suggested answers................................................................. 35
Exercises – Part 2 ................................................................... 38
Milk marketing and production 1

Introduction Introduction In this second part of Milk marketing and production you will use milk as an example to develop an understanding of the determinants of quality of a farm product. You will also examine how consumer demand for a processed product affects product specifications and informs the processes of value adding of the raw agricultural product into various forms.
This part contributes towards an understanding of Outcomes H3.1, H3.2 and H3.3 from the Agriculture Stage 6 HSC Course. The syllabus can be found on the Board of Studies, NSW website at http://www.boardofstudies.nsw.edu.au
2 Part 2: Product quality and processing
Quality of the case study product Quality of the case study product
At the end of a production period (harvest) the farm manager will have an output in the form of a raw agricultural product to sell or process. Markets or contracts for this farm product may well have been organised well before the product was harvested. The farm manager aims at maximising profits by manipulating two facets:
• quantity
• quality.
While quantity of a farm product is easy to see, for example tonnes of wheat, number of stems of blooms, litres of milk, quality is sometimes more difficult to appreciate and measure.
What is ‘quality’? Quality is a term used to indicate the desirability and/or acceptability of an animal or plant product. The criteria used to gauge acceptability depend on the type of agricultural commodity and its end use. For example fruit used for juicing or canning may have external blemishes that would be unacceptable to a fresh fruit consumer. One criterion for wheat quality is percentage protein. Pasta is made from high protein wheat (14%) while cakes and biscuits are made from wheat with a protein level of 9%.
You are a consumer of agricultural commodities. As such you have certain expectations about the quality of the products you consume. You have certain standards or criteria, that you expect products to meet in order for you to accept them. If you buy off milk, mouldy bread or smelly, slimy ham you would take them back or throw them out.
Quality criteria that a milk consumer is likely to find important are:
• palatability (taste)
• shelf life (how long it lasts before it goes off)
• purity (no contamination)
• nutritional value.
Milk marketing and production 3

List the criteria that you consider important for your farm case study product to be of high quality.
_________________________________________________________
_________________________________________________________
_________________________________________________________
_________________________________________________________
_________________________________________________________
Palatability Consumers expect milk to have a certain taste and texture. However, the taste of milk can be affected by a number of factors.
In production, the consumption by cows of certain plants, such as fireweed (Senecio sp.), can cause the milk to be tainted.
During processing, incorrect pasteurisation can cause protein in the milk to be denatured and so the taste will be altered.
During storage, milk readily picks up flavours from other foods.
Shelf life Shelf life refers to the length of time the processed product will last before it ‘goes off’.
Shelf life can be defined as the time after processing during which a product remains suitable for human consumption, especially the time a food remains palatable and acceptable to consumers.
Freedom from contamination
If milk is contaminated with bacteria, it is bad for the consumer because
• fats in milk protect microbes from stomach acids
• milk and other liquids pass through the stomach quickly, so microbes are not exposed to stomach acids for very long.
Bacterial growth can cause milk to ‘go off’ and is also a potential source of bacterial diseases. These diseases can cause serious symptoms in those people that contract them, which is why all commercial milk processed in NSW is pasteurised.
4 Part 2: Product quality and processing
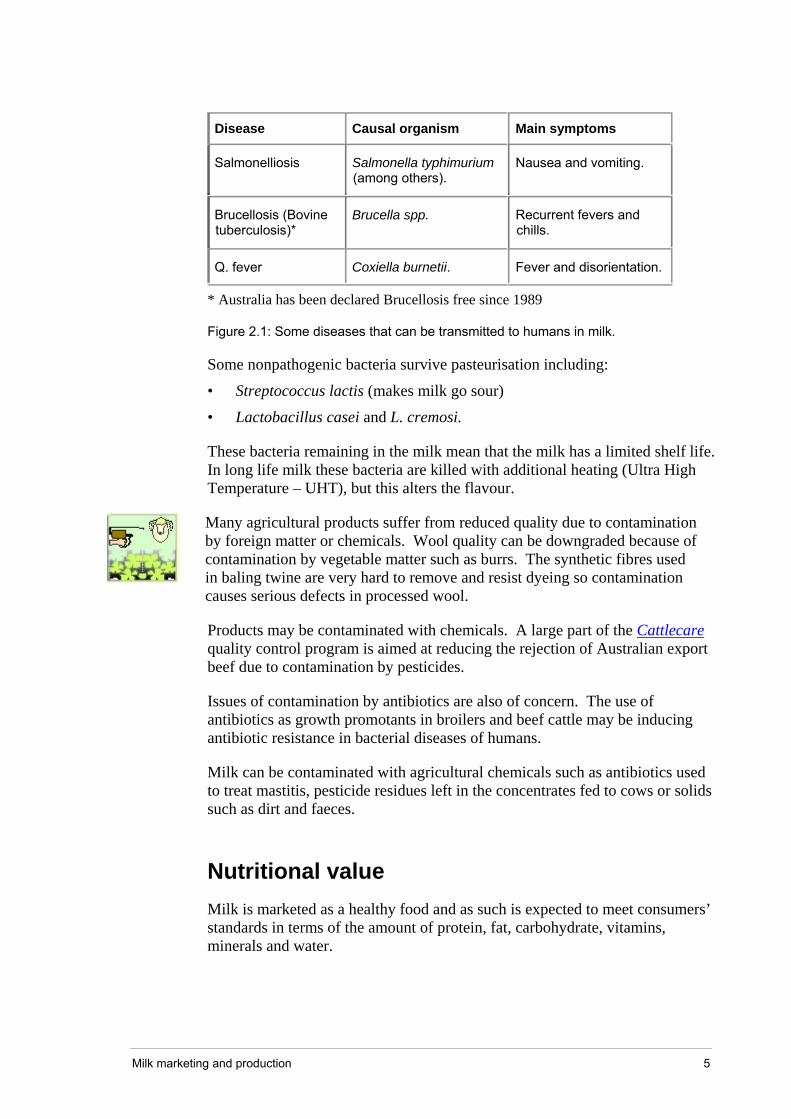
Disease Causal organism Main symptoms
Salmonelliosis Salmonella typhimurium (among others).
Nausea and vomiting.
Brucellosis (Bovine tuberculosis)*
Brucella spp. Recurrent fevers and chills.
Q. fever Coxiella burnetii. Fever and disorientation.
* Australia has been declared Brucellosis free since 1989
Figure 2.1: Some diseases that can be transmitted to humans in milk.
Some nonpathogenic bacteria survive pasteurisation including:
• Streptococcus lactis (makes milk go sour)
• Lactobacillus casei and L. cremosi.
These bacteria remaining in the milk mean that the milk has a limited shelf life. In long life milk these bacteria are killed with additional heating (Ultra High Temperature – UHT), but this alters the flavour.
Many agricultural products suffer from reduced quality due to contamination by foreign matter or chemicals. Wool quality can be downgraded because of contamination by vegetable matter such as burrs. The synthetic fibres used in baling twine are very hard to remove and resist dyeing so contamination causes serious defects in processed wool.
Products may be contaminated with chemicals. A large part of the Cattlecare quality control program is aimed at reducing the rejection of Australian export beef due to contamination by pesticides.
Issues of contamination by antibiotics are also of concern. The use of antibiotics as growth promotants in broilers and beef cattle may be inducing antibiotic resistance in bacterial diseases of humans.
Milk can be contaminated with agricultural chemicals such as antibiotics used to treat mastitis, pesticide residues left in the concentrates fed to cows or solids such as dirt and faeces.
Nutritional value Milk is marketed as a healthy food and as such is expected to meet consumers’ standards in terms of the amount of protein, fat, carbohydrate, vitamins, minerals and water.
Milk marketing and production 5
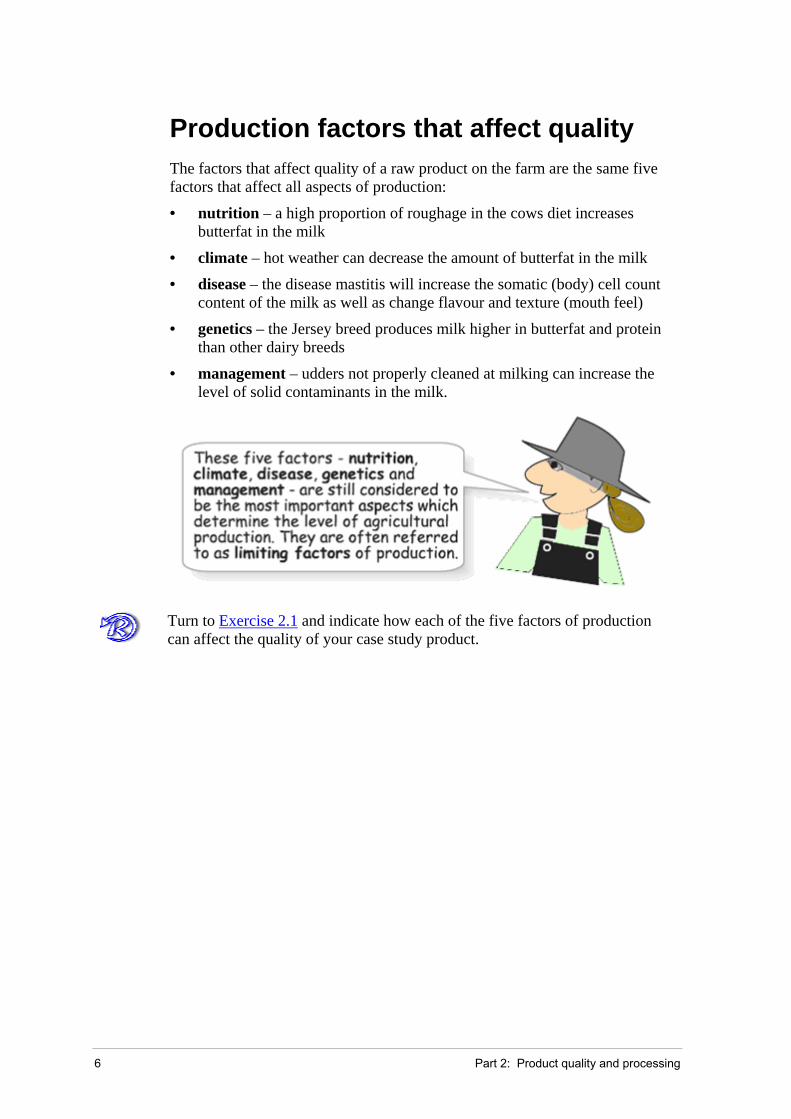
Production factors that affect quality The factors that affect quality of a raw product on the farm are the same five factors that affect all aspects of production:
• nutrition – a high proportion of roughage in the cows diet increases butterfat in the milk
• climate – hot weather can decrease the amount of butterfat in the milk
• disease – the disease mastitis will increase the somatic (body) cell count content of the milk as well as change flavour and texture (mouth feel)
• genetics – the Jersey breed produces milk higher in butterfat and protein than other dairy breeds
• management – udders not properly cleaned at milking can increase the level of solid contaminants in the milk.
Turn to Exercise 2.1 and indicate how each of the five factors of production can affect the quality of your case study product.
6 Part 2: Product quality and processing

Testing farm product quality Testing farm product quality Many farm products are destined for further processing into consumable commodities. Before they enter the processing phase these raw products are tested for component quality. For example, grains may be tested for percentage protein, wool for fineness and beef for percentage marbling. In addition all these farm products are tested for contamination by undesirable factors such as weed seeds (grain), plastic baling twine (wool) and chemical residues (export meat).
Ensuring output quality is a vital part of the farming process. It can make the difference between premium payments and no payments at all if the farm product is grossly contaminated.
A large part of the processing of milk for commercial consumption involves measuring and altering the quality of the milk received from the farm to satisfy consumer tastes.
Testing for the quality of raw milk is performed for a number of reasons.
• Testing serves to help a dairy producer identify problems in the production of milk that, if minimized, could help improve profits.
• Testing helps quality control personnel (in dairy plants and regulatory agencies) to monitor milk quality assuring that the final product on the shelf meets the public’s expectations for a safe and nutritious food.
• Testing raw milk for its components ensures that it is suitable for further processing into dairy products.
How is raw product quality tested? You will now be examining the types of testing done on raw milk before it is used in the dairy factory for processing into whole milk or other dairy products. Different commodities require different testing procedures. Your farm case study product will have different quality criteria and will require different methods of testing.
Before fresh raw milk is pumped into the bulk tankers from the farm vat, the dairy plant representative (most often the truck driver) takes samples from the farm’s bulk tank.
Milk marketing and production 7

Milk samples are collected carefully to ensure that they accurately represent the milk in the tank. To make sure this happens, the milk in the tank is agitated beforehand and the sample collected in a way that does not contaminate the milk. The sample is taken under aseptic, that is sanitary conditions, so that it can be used for any test.
Milk samples must be identified clearly and correctly.
• The date and time of collection are recorded as there are some tests that cannot be performed if there is a delay in submission. The most sensitive is the bacterial count, which looks at the total number of bacteria in the milk. With time, the number of bacteria increases so a delayed sample will show a higher count than was originally in the bulk tank. The maximum time between collection at the bulk tank and analysis in the laboratory is 36 hours. If the sample is received after that time the work will still be done but the results cannot be used for official purposes.
• The temperature of the milk sample at pickup and during transportation is also important to record. If the temperature exceeds 4°C then the rate of bacterial growth will increase, producing an incorrect result. Milk received in the lab that is above 4°C will be tested but the results will not be considered official.
Milk quality cannot be improved after it leaves the farm. Dilution or processing will not make good milk out of bad. Poor quality milk from one farm spoils all of the milk in a tanker load, and maybe all milk received at a plant. Prevention is the only way to assure milk of good quality and flavour.
At the dairy processing plant, the milk samples are analysed. Two types of tests are conducted:
• milk component tests to identify levels of butterfat and protein
• milk contaminant tests to identify things that should not be in the milk.
Analysing milk components
Analysing milk components is done for the benefit of producers. There are no regulations requiring a specific level of any of these components (butterfat and protein) in the raw product. However, farmers are paid a premium for milk high in these two components.
Read the following excerpt from an interview with Barry, a dairy farmer on the north coast of NSW.
My brother Peter and I operate a dairy farm, supplying milk to the local Norco factory at Raleigh. We are paid on an over and under basis. The base level of payment is currently 34 cents per litre. This is for milk with a butterfat percentage of 3.9 and a protein percentage of 3.2. If the protein or butterfat percentages are above this, then we get a payment above the 34
8 Part 2: Product quality and processing

cents per litre. If percentages are below 3.9 or 3.2 we get less than 34 cents per litre.
Answer the following questions using the milk payment table in figure 1.5 and the information provided by Barry.
1 Identify the per litre return from figure 1.5 for milk with a base level of 3.95% butterfat and 3.15% protein (minimum desired standard).
_____________________________________________________
2 Identify the price paid to farmers on the north coast in winter 2003 for the same quality of milk.
_____________________________________________________
3 Outline the impact that this price difference might have on the ability of farmers to operate their businesses.
_____________________________________________________
_____________________________________________________
_____________________________________________________
_____________________________________________________
Check your answers.
Analysing for milk contaminants Analysis for any contamination of the milk assists the milk processor to maintain a high quality of product. The analysis can also be used as feedback for the farmer to modify farming practices and so avoid demerits, fines or rejection of their milk.
Sensory evaluation
Most of the tests conducted on milk quality are objective, quantitative tests using standardized scientific procedures. However, there is one important subjective, qualitative test that needs to be conducted. This is the smell/taste test. First grade milk must be free of abnormal odours or flavours.
Freezing point test
Milk is routinely tested for added water, using the freezing point test. It should be remembered when looking at freezing temperature of milk, we are looking at values below 0. The addition of water will bring the freezing point closer to 0o C. The freezing limit for cow’s milk in NSW is -0.517°C.
Less than honest producers may add water to the milk in order to increase the volume. Honest producers may accidentally add water to milk by failing to
Milk marketing and production 9
completely drain the milking system after the wash-up and sanitation procedure following the previous milking. Farms that have a several-hour period between milkings, and leave residues of milky water in the system will increase levels of bacteria in the next milking.
Testing for antibiotics and antimicrobial chemical residues
The measurement of antibiotics, or other unnatural substances, that may be present in the raw milk is becoming increasingly important. When milking cows are treated with registered antibiotics according to the manufacturer’s recommendations, or in accordance with veterinary advice, there will not be any measurable level in the milk. However, if the animal is treated and its milk not withheld for the period recommended then a whole bulk tank and even a tanker truck can be tested positive.
Legally, most antimicrobial drug residues are not tolerated in milk. A few have legally allowed limits but they are so small they are measured in parts per million. Any milk that is found to contain antibiotics is dumped and no further milk picked up from that farm until the tank tests negative.
Levels of antibiotic and iodine (an antimicrobial agent) permissible for farmers supplying Norco on the north coast of NSW at April 2003 were:
• antibiotics – milk is rejected if levels are greater than 0.003 μg/ml (Penicillin G equivalents)
• iodine – desired level not greater than 500μg/l
– price paid to farmer per litre is lowered if 3 or more consecutive monthly results are greater than 500μg/l.
Pesticide residue analysis
Another residue tested for is pesticides. Chemicals used to treat animals for parasitic infection such as ticks, flukes and roundworms have a withholding period clearly stated on the label. If milk is harvested before this period expires, residues may be present.
Milk is rejected if pesticide residues are detected that are above the Maximum Residue Limit (MRL) set by government regulations.
Testing for bacteria
A standard plate count is a measurement of the total number of living bacteria present in a millilitre (ml) of milk. As there are numerous different kinds of bacteria in milk other more specific tests can be used if problems need to be resolved. High counts are usually due to poor cleaning and sanitizing of milking equipment as well as inadequate cooling of the milk.
10 Part 2: Product quality and processing

Standards for one processor are:
• the result must show less than or equal to 50 000 colony forming units per ml
• the price paid to the farmer per litre is lowered if three or more consecutive results show greater than 50 000 colony forming units per ml
• the farmer is paid a quality bonus if the monthly average shows less than or equal to 20 000 colony forming units per ml.
Sediment analysis
Analysing levels of dirt is a visual measurement of the amount of filterable sediment that exists in raw milk. The sediment in milk indicates the general dirtiness of the cows. Most sediment is removed on the farm by the milking machine filters. However, if there is a problem with the filters or too much sediment, then it can appear in the bulk tank.
Somatic Cell Count
Somatic cell count (SCC) is a measure of the number of the cow’s body (‘somatic’) cells that are in the milk. The majority of these cells are white blood cells (leucocytes) and are normally found in all body fluids. The somatic cell count is a direct measure of the severity of mastitis (udder infection). Mastitis has several bacterial causes. An increased number indicates an increase in mastitis in the herd. High somatic cell counts decrease the quality of the milk and the quantity of milk produced since infected cows do not produce as much milk as healthy ones.
In general, the somatic cell count measures only the non-visible or subclinical form of the mastitis. The feedback of the somatic cell count provides the farmer with a health profile of the animal or herd. This can have a significant economic effect because even symptomless mastitis will affect milk yield and milk quality.
Under certain circumstances mastitis infections become severe enough to become clinical. The clinical signs include changes in milk appearance and may include signs of disease in the animal as well (fever, hard, swollen quarter, discharge from the teat/s which may include blood in severe cases). Milk from cows with clinical mastitis cannot legally be included in the commercial supply. It is the milker's responsibility to assure that the disease is detected early and the milk is diverted for discard or non-commercial use. Early detection of the disease is very important. A delay of eight to twelve hours can result in the incorporation of poor quality milk into the commercial milk, and may result in greater disease costs.
One type of somatic cell count test is the Bulk Milk Cell Count (BMCC). BMCC levels for milk being processed for one processor are:
• less than 200 000 cells/ml for top tier bonus
Milk marketing and production 11
• less than 300 000 cells/ml for lower tier bonus
• levy of 1.2c/l on all milk supplied if the lesser of the monthly average and the three month rolling average is greater than 400 000 cells/ml
• nil payment for all milk supplied if the of the monthly average is greater than 600 000 cells/ml.
Acid analysis
Milk samples are tested for the presence of lactic acid, which is a product of the action of certain bacteria and causes the milk to sour. Lactic acid contamination occurs due to bacterial contamination (poor hygiene) or when the milk is not stored at the correct temperature.
Milk can be rejected if the lactic acid content is greater than 0.14 %.
pH testing
pH is the measure of the acidity of the milk. When the fats in milk break down, they produce a range of volatile (smelly) organic acids. One way of measuring for the presence of these acids is by measuring pH. Exposure to sunlight, warmth and the air can cause oxidation of milk fats to produce organic acids. A low pH may also be caused by bacterial contamination (poor hygiene).
Milk may be rejected if the pH is less than 6.60. (7 is neutral. Less than 7 is acidic, more than 7 is basic).
Summary of milk quality tests Name of product: Milk
Test name Test for Level for acceptance
Farm influence – How can farm management ensure the best result?
Sensory Evaluation
Abnormal odours or flavours.
First grade milk must be free of abnormal odours or flavours.
Keep milk cool and milking equipment clean.
Maintain pastures free of weeds that may taint milk.
Freezing point
Water added to milk
Freezing point
≤ -0.517o C
Drain water from milking system after cleaning.
Antibiotic and antimicrobial chemical residues
The measurement of antibiotics or other unnatural substances
0.003 μg/mL (Penicillin 500μg/l Iodine
Use antibiotics, according to the manufacturer’s/veterinary recommendations.
Use iodine teat dips after milking.
12 Part 2: Product quality and processing
Pesticide residues
Pesticide residues
Nil levels Do not clean udders before milking with iodated chemicals.
Observe withholding periods for pesticides.
BactoScan Counts (BC)
Testing for bacteria.
≤50,000 colony forming units per mL.bonus paid if monthly average ≤20,000 colony forming units per ml
High counts are usually due to poor cleaning and sanitizing of milking equipment as well as inadequate cooling of the milk.
Somatic Cell Count (SCC)
The Somatic Cell Count is a measure of the number of the cow’s body ("somatic") cells that are in the milk.
<200,000 cells/ml for top tier bonus.
Nil payment for all milk supplied if the monthly average >600,000 cells/ml.
Test cows for mastitis before milking.
It is the milker's responsibility to assure that the disease is detected early and the milk is diverted for discard or non-commercial use. Early detection of the disease is very important. A delay of eight to twelve hours can result in the incorporation of poor quality milk into the commercial milk, and may result in greater disease costs.
Acid analysis Testing for breakdown products of milk.
Rejected if the lactic acid content is greater than 0.14 %
High acid content is usually due to poor cleaning and sanitizing of milking equipment as well as inadequate cooling of the milk.
pH Testing for effects of acids as a result of milk breakdown.
Rejected if the pH is less than 6.60
Low pH is usually due to poor cleaning and sanitizing of milking equipment as well as inadequate cooling of the milk.
Figure 2.2: Milk quality test summary.
Turn to Exercise 2.2 and use the case study product information you collected in Part 1 to complete a test summary table for your case study product.
Practical tests on milk quality
You should be able to perform some simple practical tests to assess the quality of the product of a plant or animal system.
Access an interactive version of Practical tests on milk quality using this link. Resume with this material on page 21: Quality information feedback to the farmer.
Milk marketing and production 13

Experiment 1: Added water There is an alternative method to see if water has been added to the milk other than by looking at its freezing point. The alternative is to measure the density of the milk.
The density of milk normally varies between 1.028 and 1.034 kilos per litre. The density depends on the content of water, fat and dry matter. If fat is removed from the milk the density will go up. If the milk contains extra water the density will go down. This fact can be used as an indicator for added water.
Density is a measure of how heavy something is for its size (density = mass/volume). There are two ways to measure density:
1 using a hydrometer, which measures density directly.
2 using a balance to measure weight and a measuring cup or measuring cylinder to measure volume.
Method 1: Using a hydrometer to measure density
Aim: To test milk for added water.
Equipment: • A hydrometer
• 1 measuring cylinder
• A sample of water
• A sample of milk
• A sample of milk and water – mix approximately 50% of each.
Figure 2.3: Experimental equipment.
Procedure:
Find the density of each of the three liquid samples by: 1 pouring sufficient of each liquid sample into the measuring cylinder so that
the hydrometer floats (or suck enough liquid into the hydrometer chamber so that the measurer floats)
2 taking a reading from the hydrometer measuring scale at the surface of the liquid
3 recording your result.
14 Part 2: Product quality and processing

Water Milk Milk + water
Figure 2.4: Results of experiment.
Results: Water Milk Milk + water
Hydrometer reading
Conclusion:
Does milk get more or less dense when water is added?
_________________________________________________________
_________________________________________________________
Discussion:
What problems or sources of error are involved in this method of testing for added water?
_________________________________________________________
_________________________________________________________
_________________________________________________________
_________________________________________________________
_________________________________________________________
Check your answers.
Milk marketing and production 15

Method 2: Using a balance and a measuring cup or cylinder
Aim: To test milk for added water.
Equipment: • A sample of milk
• Water
• Measuring cup or measuring cylinder
• 2 plastic lunch bags
• 2 lengths of string
• A long ruler or balance
Figure 2.5: Experimental equipment.
Procedure:
1 Measure exactly 100 ml of milk and pour it into a plastic bag.
2 Tie the top of the bag tightly closed with string, then tie it to the end of the ruler or place on one side of the balance.
3 Measure exactly 50 ml of milk and 50 ml water, add to the other plastic bag.
4 Tie tightly with string to the end of the ruler or place on the other side of the balance.
Figure 2.6: Pour milk into a bag and tie tightly to the ruler.
16 Part 2: Product quality and processing

5 Find the centre of the ruler and balance it, or hold the balance, and record which sample is heavier.
Figure 2.7: Balance at the centre.
Results:
_________________________________________________________
Conclusion:
Does milk get more or less dense when water is added?
_________________________________________________________
_________________________________________________________
Discussion:
What problems or sources of error are involved in this method of testing for added water?
_________________________________________________________
_________________________________________________________
_________________________________________________________
_________________________________________________________ Check your answers.
Milk marketing and production 17
Experiment 2: pH of milk
Exposure to sunlight, warmth and air can cause the break down of milk fats to volatile fatty acids. These fatty acids give sour milk an off flavour and smell. The presence of these acids reduces the pH of the milk. A low pH may also be caused by bacterial contamination (poor hygiene). Even before the milk begins to smell or taste off, a change in pH can be measured. Milk may be rejected if the pH is less than 6.60. (7 is neutral. Less than 7 is acidic).
Aim: To test the pH of milk.
Equipment: • Water
• A sample of fresh milk
• A sample of spoiled milk (leave a milk sample out of the refrigerator)
• Universal indicator and pH colour chart (find this in a pH testing kit used for swimming pools or soil testing - available from some nurseries and pool equipment shops)
• Saucer or watch glass.
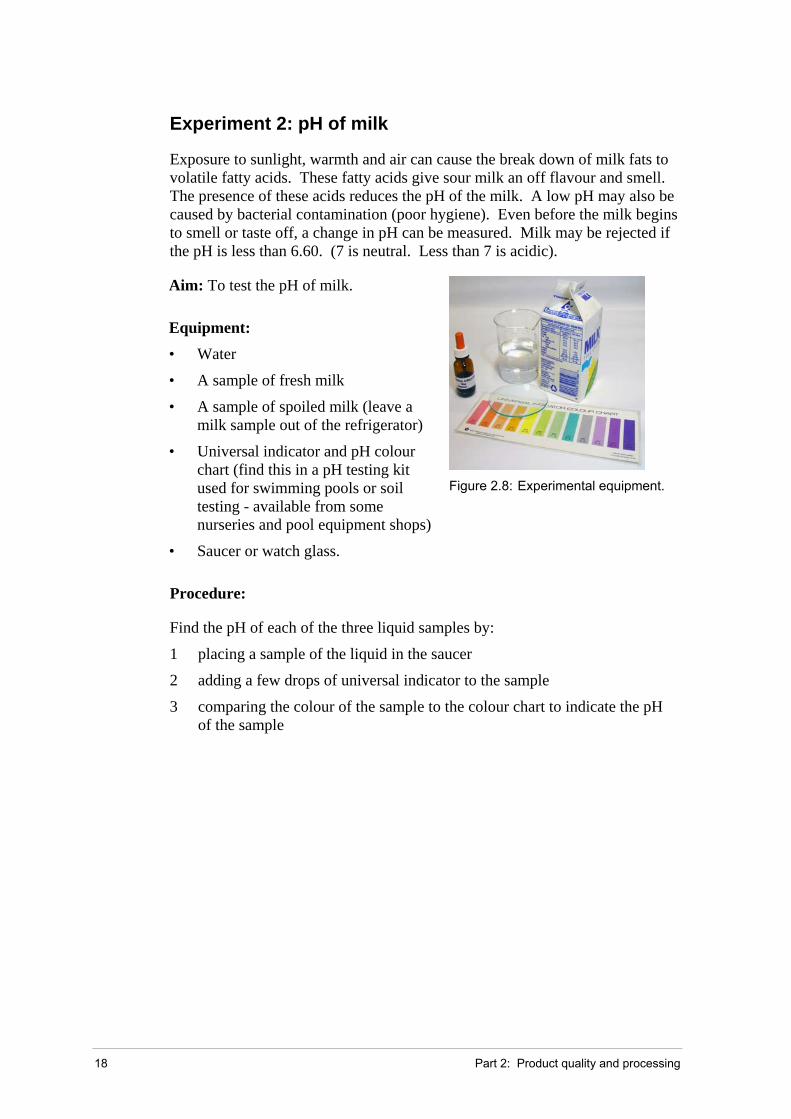
Figure 2.8: Experimental equipment.
Procedure:
Find the pH of each of the three liquid samples by:
1 placing a sample of the liquid in the saucer
2 adding a few drops of universal indicator to the sample
3 comparing the colour of the sample to the colour chart to indicate the pH of the sample
18 Part 2: Product quality and processing

4 recording the results.
Water Fresh milk Spoiled milk
Figure 2.9: Results of experiment.
Results:
Water Fresh milk Spoiled milk
Indicator colour
pH
Conclusion:
Does milk get more or less acidic as it ages?
_________________________________________________________
_________________________________________________________
Discussion:
What factors contributed to the change in the pH of the milk as it aged?
_________________________________________________________
_________________________________________________________
_________________________________________________________
_________________________________________________________
Check your answers.
Milk marketing and production 19

Quality information feedback to the farmer
One of the main reasons for testing quality is to assist the farmer to improve the quality of the farm product. In order for this to happen there must be some mechanism whereby the farm manager is informed of the results of the tests done. In the dairy industry where fresh milk is picked up from the farm on a regular basis (daily to once every three days) tests need to be reported on as soon after the raw product has left the farm as possible.
Following is a form that can be filled in to provide feedback to dairy farmers about the results of tests.
MILK QUALITY REPORT Ref No:
Report to: Owner:
Address: Address:
Submitted by:
Date collected: Time: Type of sample:
Test Laboratory results
Components Butterfat: _____ %m/V Protein: _____ %m/V
BMCC ________ cells / mL
Freezing Point ________ oC _____% water
Antibiotics ________ μg/mL (Penicillin G equiv.)
Bactoscan (BC) ________ colonies / mL
Acidity ________ % lactic acid
pH ________
Sediment analysis good average poor unacceptable
Received: Reported: Tested by: Percentage rank
Comments:
Signature:
Average
Figure 2.10: A milk quality report.
These forms are given to the farm manager as hard copy or can be emailed and stored in the manager’s computer records. They are invaluable as feedback information to assist the farm manager improve management techniques and plan for herd improvement.
20 Part 2: Product quality and processing

Importance of product specifications Importance of product specifications The specifications of the raw product must be able to support the specifications of the processed products that the consumer wants. Therefore, there are two sets of specifications that need to be appreciated. In this section you will look at how consumer tastes for milk products have changed over time. Further insights into marketing of milk will be seen in Part 5 of this module.
Understanding the market place In order for dairy factories and dairy farmers to be successful, they must be competitive in the market place. They must be able to give the consumer what they want, or create demand for products through innovative marketing. In order for this to happen, dairy manufacturers must research consumer preferences.
Despite the increasing range of beverages and soft drinks available to consumers, the demand for milk per capita has remained fairly stable for a number of years. On average each person in Australia drinks about 100 litres of milk each year.
Figure 2.11: Per capita milk consumption by type 1986 – 2001 © Dairy Australia
Milk marketing and production 21

1 Describe four trends that can be seen in figure 2.11.
Trend 1: Overall consumption of milk per capita.
_____________________________________________________
_____________________________________________________
Trend 2: Consumption of full cream milk per capita.
_____________________________________________________
_____________________________________________________
Trend 3: Consumption of low fat milk per capita.
_____________________________________________________
_____________________________________________________
Trend 4: Consumption of flavoured and UHT milk per capita.
_____________________________________________________
_____________________________________________________
2 Choose ONE of the milk products shown in the graph and explain possible reasons for the change in consumption over time.
______________________________________________________
______________________________________________________
______________________________________________________
______________________________________________________
Check your answers.
Even though total milk consumption per person has not changed very much, the type of milk we are drinking has.
Product specifications and consumer demand You have seen from the figure 2.11 that consumer demand for different types of milk is changing. What is it about these milks or the way in which they are marketed that has caused consumption to change?
22 Part 2: Product quality and processing

PER 100ml
Fat (
g)
Car
bohy
drat
e (g
)
MILK TYPE
Ener
gy (k
J)
Prot
ein
(g)
Tota
l
Satu
rate
d
Cho
lest
erol
(mg)
Tota
l
Suga
rs
Na
(mg)
K (m
g) (%
RD
I)
%R
DI
Ca
(mg)
(%R
DI)
%R
DI
Full cream
271 3.3 3.6 2.4 11 4.8 4.8 58 14 (4) 123 (15)
Low fat 195 3.4 1.4 0.9 6 4.9 4.9 58 14 (4) 126 (16)
Skim milk 208 5.1 0.15 0.09 3.95 6.8 6.8 78 19 (7) 184 (21)
Flavoured 264 3.8 0.9 0.6 6 9.7 9.7 63 17 (4) 137 (17)
Calcium enriched
211 3.9 1.4 0.9 6 5.5 5.5 91 16 (5) 202 (25)
Figure 2.12: Product specifications for a range of milk products (per 100 ml).
1 Account for the change in demand for fat reduced milks shown in
figure 2.11 using your knowledge of dietary changes in Australian culture and the product specifications in figure 2.12.
_____________________________________________________
_____________________________________________________
_____________________________________________________
_____________________________________________________
_____________________________________________________
_____________________________________________________
2 Flavoured milks are not perceived to be as healthy as full cream or fat reduced milks. Explain this perception using the product specifications in figure 2.12.
_____________________________________________________
_____________________________________________________
_____________________________________________________
Milk marketing and production 23

3 Outline why you think the demand for flavoured milks also increased in the period 1986–2001.
______________________________________________________
______________________________________________________
______________________________________________________
Check your answers.
Raw and processed product specifications You are aware that there is a wide range of processed and manufactured products derived from raw milk. Apart from a few special lines of raw milk, the vast range of products comes from ordinary dairy farms with mostly Friesian cows. All this milk is mixed together before it is processed.
If you work backwards from the processed product specifications you will see that the raw milk must meet certain criteria in order for it to be turned into these products. Dairy product Protein % Butterfat %
Full cream milk 3.3 3.6
Fat reduced milk 3.4 1.4
Skim milk 3.5 0.1
Flavoured milk 3.8 0.9
Buttermilk 4 0.9
Butter 0.08 8.2
Cream 1.8 35
Cheddar cheese 24 36
Raw milk specifications 3.15 3.95
Figure 2.13: Specifications for butterfat and protein in various milk products.
24 Part 2: Product quality and processing
Most of the products in figure 2.13 can be made easily given the level of butterfat and protein specified in raw milk. Many dairy products have their constituents adjusted by the addition of milk fats and solids after these have been removed from whole milk during processing. Other processes, such as cheese making, cause some constituents to be concentrated, or changed by microbial action.
Turn to Exercise 2.3 and answer the HSC style questions for your case study product. This is a compulsory section in your HSC examination.
Milk marketing and production 25

Processing the raw product Processing the raw product While completing On the case you collected information about your case study product and what happens to it on the farm. In this section you will look at what happens to the farm product when it becomes an input for processing.
The degree of processing and the range of final processed commodities is different, depending on the agricultural product. In some cases, for example, fresh produce like fruit, vegetables and flowers the degree of processing is much less. However, with preserved fruit, jams, canned vegetables and soups, some of the processes are similar.
Examine the following material related to processes used to change raw milk into a consumable product. At the end of the section you will complete an exercise describing processes used to change the raw farm product you are studying.
Processing milk On arrival at the dairy factory, fresh milk is treated by processes appropriate for the end product. Some of these processes are common to a number of milk and dairy products. These processes are:
• pasteurisation
• homogenisation
• composition adjustment.
Depending on the end product, milk also goes through a range of other processes such as flavouring or culturing.
Pasteurisation This involves heating the milk to 72°C for 15 seconds and cooling immediately. It is done to ensure the destruction of harmful micro-organisms.
26 Part 2: Product quality and processing

Homogenisation This process involves pumping the milk under pressure through very fine nozzles so as to make the fat globules small and uniform in size, and evenly dispersed. This gives the milk a smooth, creamy texture. If the milk is not homogenized, the fat globules will rise to the surface, forming a layer of cream at the top of the milk.
Composition adjustment Many varieties of special or modified milks require adjustment of composition. This may involve centrifugal separation of some or all of the cream to give reduced fat, low fat or skim milk. Removal of too much cream makes the flavour and texture in the mouth feel less attractive. To help overcome this, and to increase the level of nutrients such as protein and calcium, extra milk solids may be added.
Ultra Heat Treatment (UHT) Pasteurisation produces milk with very few micro-organisms. If held at correct refrigerated temperature, pasteurised milk will last up to 10 days.
The UHT process destroys all the micro-organisms and so ensures long life even unrefrigerated. The process involves heating the milk of 132°C for one to two seconds followed by rapid cooling and sealing into packages under aseptic conditions (no micro-organisms can gain access).
However, once the package is opened, the UHT milk must be refrigerated and it then has a shelf life similar to pasteurised milk.
Flavouring Various forms of pasteurised and UHT milks have had flavouring added. To keep the flavouring evenly dispersed in the milk, modifying agents such as vegetable gums are added. Some sugar is normally added to improve mouth-texture and add sweetness. Some varieties are sweetened with artificial sweeteners such as Nutrasweet. Flavoured milk is available in full cream or reduced fat varieties.
Milk marketing and production 27
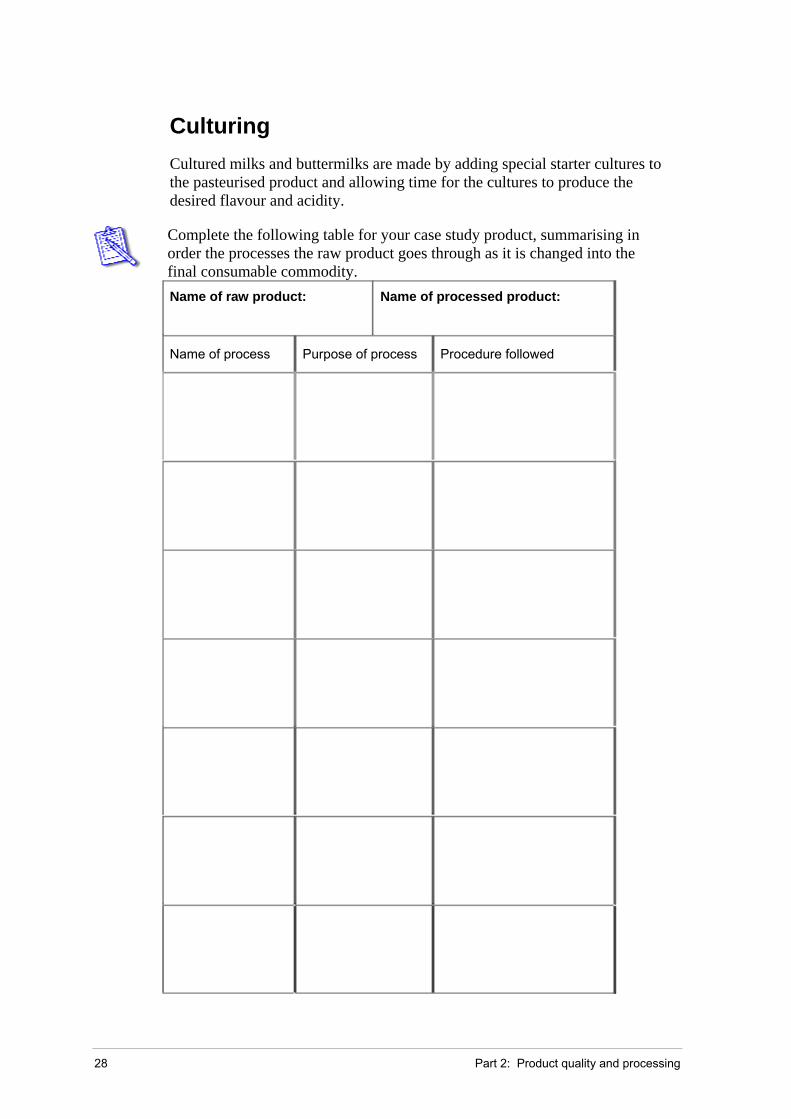
Culturing Cultured milks and buttermilks are made by adding special starter cultures to the pasteurised product and allowing time for the cultures to produce the desired flavour and acidity.
Complete the following table for your case study product, summarising in order the processes the raw product goes through as it is changed into the final consumable commodity. Name of raw product:
Name of processed product:
Name of process Purpose of process Procedure followed
28 Part 2: Product quality and processing
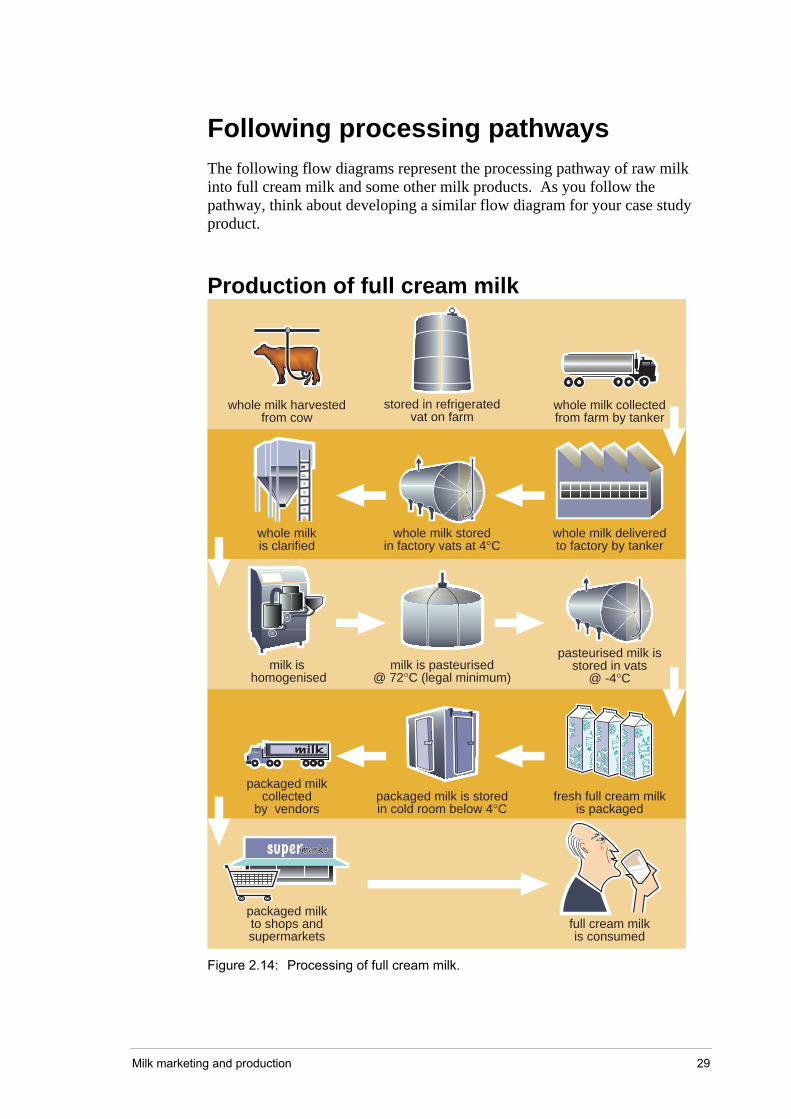
Following processing pathways The following flow diagrams represent the processing pathway of raw milk into full cream milk and some other milk products. As you follow the pathway, think about developing a similar flow diagram for your case study product.
Production of full cream milk
whole milkis clarified
milk is homogenised
milk is pasteurised@ 72°C (legal minimum)
whole milk storedin factory vats at 4°C
pasteurised milk isstored in vats
@ -4°C
fresh full cream milkis packaged
packaged milk is storedin cold room below 4°C
packaged milkcollected
by vendors
packaged milkto shops andsupermarkets
full cream milkis consumed
whole milk collectedfrom farm by tanker
whole milk deliveredto factory by tanker
stored in refrigeratedvat on farm
whole milk harvestedfrom cow
Figure 2.14: Processing of full cream milk.
Milk marketing and production 29

Production of cream and skim milk products
whole milk is separated intoskim milk and cream
skim milk and creamare blended
to make reduced fat milk
skimmilk is
pasteurised
skim concentrateand calciumsupplement
added
calcium enrichedmilk is
pasteurised
reduced fatmilk is
pasteurised
blended milkis
homogenised
cream ispasteurised
cream
calcium enrichedmilk is
packaged
skim milk iscooled andstored in
vats @ 1–4°C
fresh skim milkis
packaged
skim milk iscooled andstored in
vats @ 1–4°C
fresh reducedfat milk
is packaged
reduced fat milkis cooled and
stored invats @ 1–4°C
fresh creamis
packaged
cream iscooled andstored in
vats @ 1–4°C
skim milk
packaged milkand creamstored incold roombelow 4°C
packaged milkand creamcollected
by vendors
packaged milkand creamare retailed
milkand cream
are consumed
k
whole milk delivered to factoryand stored in vats @ 4°C
Figure 2.15: Processing of cream, skim calcium enriched and fat reduced milk.
Turn to Exercise 2.4 and draw a flow diagram from the farm to the consumer for one commodity processed from your raw case study product.
30 Part 2: Product quality and processing

Problems meeting product specifications
Outline problems that may occur along the milk marketing chain that would result in a lowering of milk quality.
_________________________________________________________
_________________________________________________________
_________________________________________________________
_________________________________________________________
_________________________________________________________
_________________________________________________________
_________________________________________________________
_________________________________________________________
Check your answers.
Identify any areas where there is particular risk of reduced product quality in the marketing chain associated with your case study product.
_________________________________________________________
_________________________________________________________
_________________________________________________________
_________________________________________________________
_________________________________________________________
_________________________________________________________
_________________________________________________________
_________________________________________________________
_________________________________________________________
_________________________________________________________
_________________________________________________________
_________________________________________________________
_________________________________________________________
Milk marketing and production 31
Value adding Value adding The process of value adding is anything that is done to the product to make it more valuable. Value adding can take place in a number of ways. Value adding can take place on the farm and at the processing factory.
Value adding on the farm The processes of value adding are not just restricted to milk or things done in a factory that change the raw product into a consumable commodity.
Simple processes such as sorting eggs into consistent 60, 70 or 80 gram carton sizes can add value to the farm product. Less visible examples of value adding include post harvest dipping of fruit with a fungicide to stop storage rot, or gassing bananas with ethylene to promote even ripening.
To most people, raw milk is all the same. It is used as the basis of all the dairy products you have looked at so far. So can a farmer value add the product before it leaves the farm gate? Because of health regulations and limits to capital, the farmer is not able to process the milk on site – few dairy farmers have the money to install equipment for pasteurisation, homogenisation and hygienic packaging of milk.
The answer lies in product specialization – to produce a line of milk that is different to most others, to satisfy a specific consumer demand. That is to supply a niche market. Increasingly consumers are being selective about how their produce is being grown, and so we see lines of milk appearing that have been produced in special ways. For example in some parts of NSW it is now possible to buy:
• extra creamy milk from Jersey herds
• organic milk
• biodynamic milk
• alpha 2 (α2) milk.
α1 (alpha 1) casein is not present in human milk but makes up about 70% of
the milk protein in the milk produced by most dairy cows. Some people claim that milk high in α1 (alpha 1) casein is responsible for a range of health problems. By selecting the right cows farmers can aim to produce milk high in α2
(alpha 2) milk and can niche market their product.
32 Part 2: Product quality and processing
If you have Internet access you can find out more about α2 (or a2) milk at http://www.a2australia.com.au/ or http://www.abc.net.au/landline/content/2006/s1702999.htm.
Value adding during processing At the processing stage raw milk from farms goes through a number of processes. Some of these processes are aimed at standardising and ensuring milk quality. Other processes are aimed at increasing the variety of products. In each case value is added to the milk.
There are a large number of dairy products available to the consumer. This increase in the diversity of dairy products comes from competition between dairy processors as well as competition from non dairy drinks and foods. In the milk market this has resulted in product innovation with branded specialty milks with varying compositions. Some contain varying amounts of fat while others have been fortified with extra vitamins and minerals. Other milks have been developed to take advantage of particular consumer needs, such as lactose-free or extra frothing milk for cappuccinos. Still others have been aggressively marketed to appeal to certain consumer segments.
Look at the list of products produced from your case study product that you collected in Part 1 and note whether any of these products are produced by the same company.
Outline one reason why a single company would produce a range of similar products.
_________________________________________________________
_________________________________________________________
_________________________________________________________
Check your answer.
When you are writing an HSC exam style extended response answer it is an effective strategy to begin with a very brief dot point summary of the information you intend to write about.
Turn to Exercise 2.5 and provide a dot point summary for the value adding extended response question about your case study product.
Milk marketing and production 33

Summary Summary • Quality refers to the desirability and/or acceptability of an animal or plant
product.
• The five factors affecting quality of a raw product are:
• nutrition
• genetics
• disease
• climate
• management.
• Quality of products can be measured and tested in various ways, depending on the product.
• Payments are often based on product quality.
• Quality tests can provide feedback to the farmer, so the production cycle can be modified and optimised.
• Consumer preferences are researched by companies so that suitable products can be manufactured.
• Product specifications for the finished product influence the required specifications of the raw product.
• There are processes involved in altering a product from a raw form into one that satisfies consumer demand. This can be illustrated with a processing pathway.
• Value adding is anything done to the product to make it more valuable.
• Value adding may occur on the farm as well as during processing.
34 Part 2: Product quality and processing

Suggested answers Suggested answers
Testing farm product quality
Analysing milk components
1 Using the table, the price is 35 cents per litre.
2 The base price is 34 cents per litre.
3 A difference of 1 cent per litre seems minor, but this would decrease the level of profit and make it more difficult for farmers to operate.
Experiment 1: Added water
Method 1: Using a hydrometer to measure density
Results: Milk Water Milk + water
Hydrometer reading 1.03 1.00 1.02
Conclusion:
Milk becomes less dense as water is added.
Discussion:
A hydrometer measures density relative to water. It is reliable, but since the density of milk varies with the amount of fat, protein and dissolved minerals and vitamins, it is not a reliable way of telling how much water has been added.
Method 2: Using a balance and a measuring cup or cylinder
Results: Milk is heavier than water indicating greater density.
Conclusion:
Milk becomes less dense as water is added.
Milk marketing and production 35

Discussion: • Inaccuracies in measuring the quantities of milk and water.
• Problems finding the centre of the ruler, so the balance does not indicate a true result.
Experiment 2: pH of milk
Results: Water Fresh milk Spoiled milk
Indicator colour green green orange
pH 7 7 3
Conclusion:
As milk ages the ph goes down, which means the milk is becoming more acidic.
Discussion:
Exposure to air, warm temperatures and microbes cause fats and proteins to be broken down into fatty acids and amino acids
Importance of product specifications Patterns of consumer preferences
1 Trend 1: Milk consumption has remained fairly constant at about100 litres per person per year over the period 1986 to 2001.
Trend 2: Consumption of whole milk has decreased from about 85 litres per person per year to about 60 litres per person per year over the period 1986 to 2001.
Trend 3: Consumption of low fat milk has increased from about 5 litres per person per year to about 25 litres per person per year over the period 1986 to 2001.
Trend 4: Consumption of flavoured and UHT milk has increased from about 10 litres per person per year to about 20 litres per person per year over the period 1986 to 2001.
2 Consumption of low fat milk has increased because people are more aware of the negative effects of fat and cholesterol in the diet. People are moving away from full cream (high fat) milk to low fat or reduced fat milks. This trend has been helped by active marketing campaigns. Flavoured and UHT milks are convenience foods, and their increased consumption reflects the increased use of convenience products.
36 Part 2: Product quality and processing

Product specifications and consumer demand
1 Consumption of low fat milk has increased because people are more aware of the negative effects of fat and cholesterol in the diet. People are moving away from full cream (high fat) milk to low fat or reduced fat milks. This trend has been helped by active marketing campaigns.
2 The flavoured milk in the table has less fat than full cream milk, but it has the most sugar and more salt than full cream or fat reduced milk.
3 Consumption of flavoured milk has increased because they are being actively marketed as an alternative to soft drinks. The range of flavours and marketing strategies are aimed primarily at teenagers and young adults. Flavoured milk drinks are seen as cool, and healthier than the alternatives.
Problems meeting product specifications
In the milk marketing chain there are many points where incorrect cleaning of vessels or connections can result in potential contamination by microorganisms. This includes:
• collection of milk from farms
• transport by tanker
• delivery and storage at processing plant
• processing equipment
• packaging equipment.
Another source of milk contamination is allowing the milk temperature to rise, encouraging microbial growth, for example by malfunctioning refrigeration units. Places in the milk marketing chain where this could be a problem include:
• collection of milk from farms
• transport by tanker
• delivery and storage at processing plant
• storage of packaged milk at processing plant
• transport by vendors
• storage of milk in shops / supermarkets
• transport of milk by consumer
• storage of milk by consumer.
Problems with processing equipment, for example incorrect pasteurisation temperature could also result in lowering of milk quality.
Value adding Value adding during processing – product diversification
Each product is aimed at a particular segment of the consumer market. The idea is to produce and promote a product that people of certain ages and lifestyles identify with. The goal is to get as many of these people consuming that product in preference to a competitors product. In addition, one company producing so many lines means that they can have a range of different appearing products on the shelf, so that consumers are more likely to grab one of these than if the company only supplied one type.
Milk marketing and production 37

Exercises – Part 2 Exercises – Part 2 Exercises 2.1 to 2.5 Name: _________________________________
Exercise 2.1
Complete the following table with examples that show how each of the following factors can affect the quality of your case study product. If you are studying milk as your case study product use different examples to those presented previously.
Nutrition
Genetics
Disease
Climate
Management
38 Part 2: Product quality and processing
Exercise 2.2
Complete the following table related to your case study product by referring back to the information you collected in Part 1.
If you are studying milk as your product, try and find farm manager influences other than those provided in the example. Name of product:
Test name Test for Level for acceptance
Farm influence – How can farm management ensure the best result?
Milk marketing and production 39
Exercise 2.3
Name ONE farm product you have studied
Name of farm product _____________________________________
Answer ALL parts of this question with reference to the product named above.
(a) Identify TWO criteria for assessing the quality of the product.
______________________________________________________
______________________________________________________
2 marks
(b) Outline ONE testing method for assessing the quality of the product.
______________________________________________________
______________________________________________________
______________________________________________________
2 marks
(c) Outline ONE way that the product is changed during processing in order to promote consumption.
______________________________________________________
______________________________________________________
______________________________________________________
2 marks
(d) Describe ONE mechanism whereby the farmer receives information about the quality of the farm product.
______________________________________________________
______________________________________________________
______________________________________________________
______________________________________________________
3 marks
(e) Describe ONE change in consumer preferences that has had an impact on the demand for the farm product.
______________________________________________________
______________________________________________________
______________________________________________________
______________________________________________________
3 weeks
40 Part 2: Product quality and processing
Exercise 2.4
Construct a flow diagram from the farm to the consumer for one commodity processed from your raw case study product.
Milk marketing and production 41

Exercise 2.5
Write a dot point summary of the information you would need to write about for the following extended response question about your case study product. Check that your summary:
• fully answers all aspects of the question
• follows the guidance offered by the key words in the question
• contains sufficient points of information to satisfy the marks allocated.
Propose a case for or against value adding by a farmer through the production of a specialist line of raw agricultural commodity (such as α2 casein milk, superfine merino wool, or organically grown wine grapes).
(a) Identify the raw agricultural commodity and describe the differences between this product and more conventional lines. 3 marks
(b) Describe the perceived benefits of this specialist line to the consumer. 5 marks
(c) Discuss the value of this specialist line to the farmer. In your answer include production benefits/additional costs, farmer health, ease of conversion from traditional production and ease of transport and processing.
7 marks
_________________________________________________________
_________________________________________________________
_________________________________________________________
_________________________________________________________
_________________________________________________________
_________________________________________________________
_________________________________________________________
_________________________________________________________
_________________________________________________________
_________________________________________________________
_________________________________________________________
_________________________________________________________
_________________________________________________________
_________________________________________________________
_________________________________________________________
_________________________________________________________
42 Part 2: Product quality and processing