milky way kinematics, or how we discovered the geometry
TRANSCRIPT
Milky Way Kinematics, or how we discovered the geometry and dynamics of our own galactic environment.
Compiled by Paul R. Woodward and B. Kevin Edgar
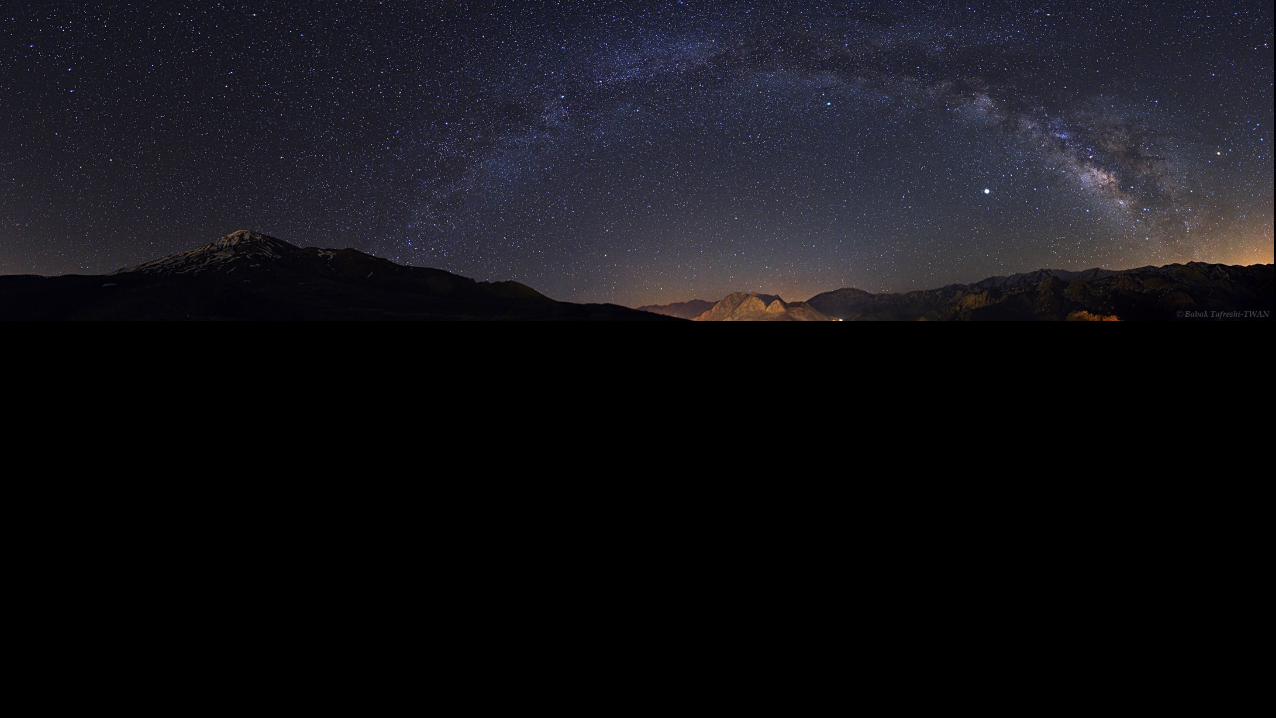
The name “galaxy” comes from the Greek word for milk.
The Galaxy appears to us like a river of milk, and hence its name, the Milky Way.
Kinematics – describes the motion without consideration of the
causes leading to the motion.
Dynamics – describes the relationship between motion of objects
and its causes

Just What is a Galaxy?
Was everything seen in telescopes part of the Milky Way?
Stars
Clusters
Supernova Remnants
Planetary Nebulae
Dark Nebulae
Reflection Nebulae
“Spiral Nebulae”
Was the Milky Way the entire Universe?
Debate raged well into the 20th Century

Mapping from the Inside
What is the Earth's place in the Universe
(As Usual, we first thought we were at the center)
What is the Sun's place in the Galaxy
(For a long time we thought the Sun was at the center of the Milky Way)

Starting With Star Counts
1. William Herschel
“Star Gauging”
683 regions around the sky
Assumed Galaxy uniformly filled with stars to edge
His data were almost completly uniform e.g. Sun at Center

William Herschel’s Universe, 1785

Starting With Star Counts continued
2. Jacobus Kapetyn 1906
First “Modern” attempt using photography
Assumed all stars have same intrinsic brightness
Determine distance based on apparent and intrinsic magnitudes
Bright stars uniformly distributed
Fainter stars concentrated in a band “Galactic Equator”
Conceived a lens shaped galaxy 25,000 light years thick
Solar System near the center

Map local stellar environment by means of star counts.
First plot positions on sky of stars brighter than some level 1.
Then plot positions of stars between brightness levels 1 and 2.
And so on.
If distribution of stars in space is uniform, each plot will be also.
Number of stars per square degree in each successive plot will increase in a fashion that we could predict.
Find stars concentrated in band of sky, the galactic equator.
Find that numbers of fainter stars do not increase away from the galactic equator so rapidly (as uniform distribution would imply).
This true also toward galactic equator, although shortfall is smaller.
Led to “Kapteyn Universe” with us in center.


1912 - Henrietta Levitt and Cepheid variables
Typical Cepheid Light Curve

Cepheid Period-Luminosity Relation - 1912
To determine the Absolute Magnitude (MV), essentially the luminosity, of a Cepheid: first find the Period of the Cepheid along the horizontal axis (x-axis), go up to the diagonal line which corresponds to the Period-Luminosity relation, then read across to the vertical axis (y-axis) to see what value of MV it corresponds to. Write the corresponding value of MV in the correct column on your Cepheid Data Sheet.

Cepheid period luminosity relation.

In 1917, after Henrietta Levitt’s discovery of the period-luminosity relation for the Cepheid variable stars in the Small Magellanic Cloud, Harlow Shapley proposed that these stars were pulsating.
The explanation that we can determine the intrinsic luminosity of one of these special, pulsating stars from measuring its pulsational period goes like this.
The pulsational period depends upon the size of the object. This is because the pulsation is a pressure-driven phenomenon. One period is the time it takes sound (a pressure wave) to propagate from the surface to the deep interior and back. The longer this distance is, the longer the period of the pulsation.
This should be familiar to you from the different sounds of large and small bells or of long and short vibrating strings (in a piano, violin, or guitar). Big bells sound low notes. Big stars have low frequency pulsations.

So we see the relationship between the pulsational period and the size of the pulsating star.
The size of the star is in turn related to its intrinsic luminosity, because the Cepheid variable stars are all giant stars that are located in a nearly vertical strip in the H-R diagram. This means that they all have about the same surface temperature. The properties of the black body spectrum then imply that their luminosities are given by a nearly constant factor determined by their nearly identical surface temperatures multiplied by the areas of their surfaces.
This is summed up by the period-luminosity relation for Cepheid variable stars that is shown on the previous slide.

Shapley applied Levitt’s relation to RR-Lyrae variable stars in globular clusters, to get their distances.
He did not realize that the period-luminosity relationship for this different class of variable stars is not the same as for the Cepheid variables studied by Henrietta Levitt. His globular cluster stars were very old, and contained relatively few heavy elements, so they had a different period-luminosity relation.
Because of this mistake, Shapley got systematic overestimates for the distances to these star clusters, but he got the right geometrical distribution.
Globular clusters have spherical distribution centered on a position about 30,000 light years from us (the modern, corrected distance) in the direction of the galactic equator.
Thus we live in a disk, far from its center.
Globular clusters orbit center in all directions, disk stars all go around in one direction and in a single plane.

1918

Shapley Curtis Debate (1920)the Scale of the Universe
Main Questions:
* What is the nature of the “nebulae”?
* What is the size of our Galaxy?
* Is the Sun in the center of the Galaxy?

Shapley believed:
* diameter of our Galaxy was 300,000 light-years
* Sun was not at Galaxy's center, but 60,000 light-years away
* Milky Way was so large, it was the entire universe
* spiral nebulae were gaseous clouds repelled by Milky Way's light pressure
Curtis believed:
* diameter of our Galaxy was 30,000 light-years (10x smaller!)
* Sun was very close or at center of Galaxy
* spiral nebulae were galaxies -- island universes in their own right* Did NOT Believe that Cepheids had a strong period-luminosity
relation

Here is what the Andromeda “nubula” looks like through a good sized, but not very large telescope.To have it look like its pictures, you must take a picture and greatly overexpose the central region.

The Andromeda Galaxy

Edwin Hubble 1924
* located Cepheids in nearest major spiral nebula
*derived distances larger than even Shapley's estimate of Milky Way's size
* Shapley admits he was wrong about spiral nebulae (an issue that he did not consider at the heart of the 1920 debate)
at the 100in on Mount Wilson

Trumpler's Discovery
1930 Robert Trumpler was studying star clusters
Noticed some appear fainter than expected based on their assumed size
Concluded (correctly) that space is filled with dust and gas which scatters light
This scattering is called Interstellar Extinction
Therefore Herschel and Kapteyn were only seeing the local stars

1930 Trumpler’s Discovery

He took advantage of wartime blackout conditions during World War II, which reduced light pollution at Mount Wilson Observatory, to resolve stars in the center of the Andromeda galaxy for the first time, which led him to define distinct “populations” for stars (Population I and Population II).
Walter Baade Mt Wilson 100 inch Hooker Telescope


Milky Way in Sagittarius -- the region near the Galactic center

Milky Way in Sagittarius; Spitzer Infrared image

How by looking at stars in the sun’s vicinity, we are able to deduce the structure and dynamics of the Galactic disk:
See small number of “high velocity stars” near us moving rapidly relative to rest of material in disk.
All appear to be going in about same direction.
Bertil Lindblad said they are a population with little rotation about the Galaxy, and hence with large radial velocities.
We are rotating past this small population of stars.


We can measure this rate of shear in disk star motions(how much faster or slower stars orbit with distance toward or away from galactic center).
Also need to measure orbital velocity at radius of sun.
Bertil Lindblad figured out how to do this last thing, later confirmed by Jan Oort.
Measure dispersion of stellar velocities in two directions, along orbit and in direction of galactic center.
2 dispersions would be equal if galaxy rotated like a solid body.
Measure amount that they are unequal, and then can calculate orbital period of stars near us. This turns out to be related to the Oort constants mentioned earlier.
Answer is about 230 million years.
Use sun’s orbital velocity to “weigh” the galaxy inside sun’s orbit.
Result is 130 billion solar masses.


The Visible Sky

NGC 891, a spiral galaxy in the constellation Andromeda that is seen edge on, probably looks pretty much the way our galaxy would look when viewed from outside and edge on.
This galaxy looks pretty symmetrical, and pretty
thin.

Mapping our Galaxy by observing neutral hydrogen emission:
Henk van de Hulst realized that neutral hydrogen gas emits radio waves of 21 cm wavelength.
This radiation goes clear across the Galaxy without absorption.
Small radio telescope left in Holland by German army was then used to map the entire galactic disk.
This gave full “rotation curve” and revealed spiral arms as well.
At 21 cm, you can see forever, but result is confusion.
Consider single line of sight on diagram.
Only aid in handling confusion is different Doppler shifts of radiation from different regions along line of sight.
Gives a “line profile,” and is an art to interpret one.

The 21-centimeter Sky


To interpret line profile, use model of gas motions in galactic disk.
Simplest is circular orbits everywhere.
Then is single point along line of sight, the so-called tangent point, where gas has maximum velocity relative to us.
This maximum velocity measures speed of galactic rotation at one radius, radius of tangent point.
Whole series of such measurements gives the “rotation curve.”
