mine spoil weathering and tds dynamics w. lee daniels, zenah orndorff and carl zipper dept. of crop...
TRANSCRIPT

Mine Spoil Weathering and TDS Dynamics
W. Lee Daniels, Zenah Orndorff and Carl Zipper
Dept. of Crop and Soil Environ. Sciences
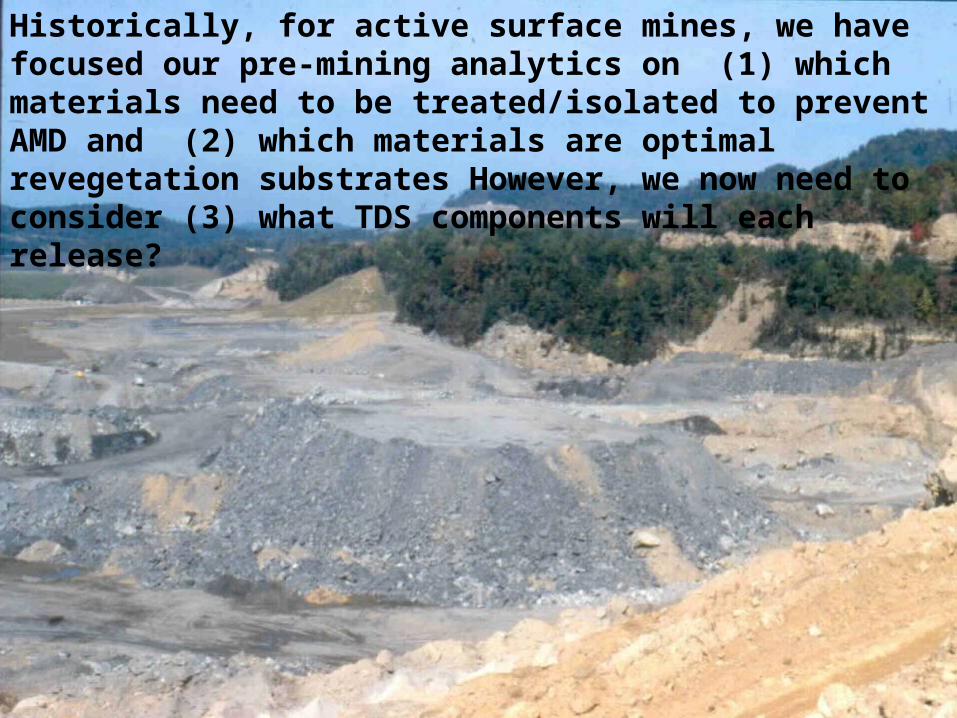
Historically, for active surface mines, we have focused our pre-mining analytics on (1) which materials need to be treated/isolated to prevent AMD and (2) which materials are optimal revegetation substrates However, we now need to consider (3) what TDS components will each release?
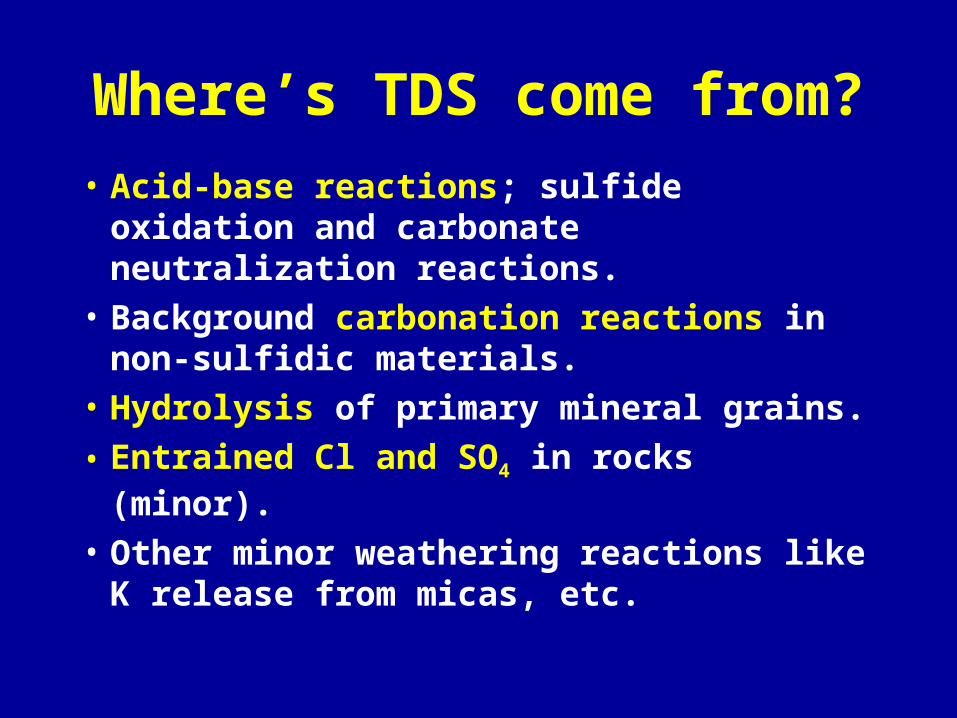
Where’s TDS come from?
• Acid-base reactions; sulfide oxidation and carbonate neutralization reactions.
• Background carbonation reactions in non-sulfidic materials.
• Hydrolysis of primary mineral grains.
• Entrained Cl and SO4 in rocks (minor).
• Other minor weathering reactions like K release from micas, etc.

All these reduced gray spoils are just waiting to weather!
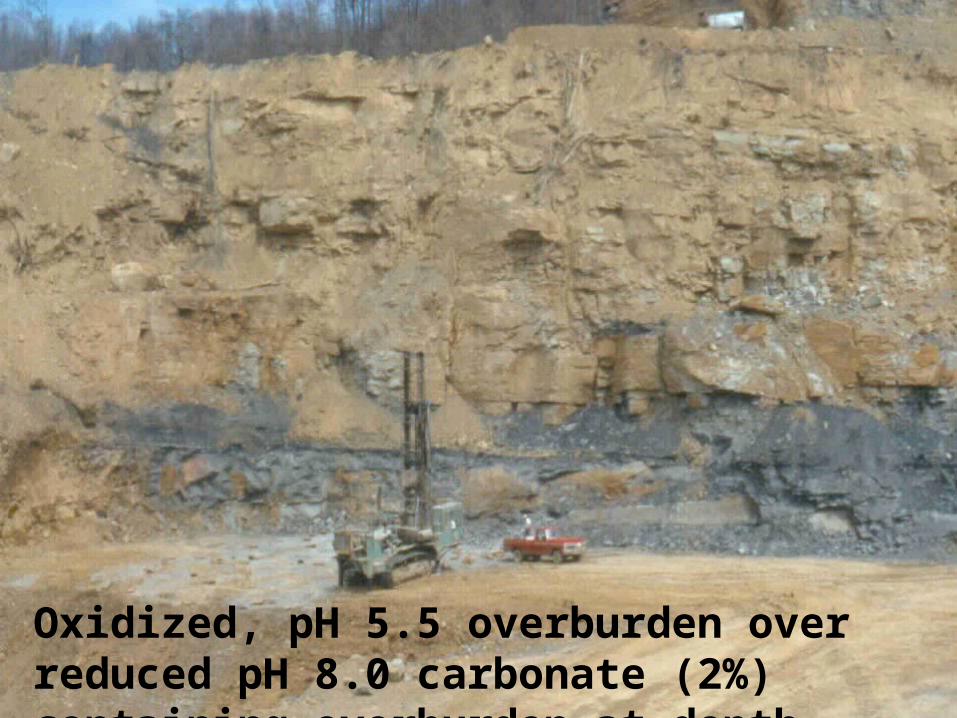
Oxidized, pH 5.5 overburden over reduced pH 8.0 carbonate (2%) containing overburden at depth.
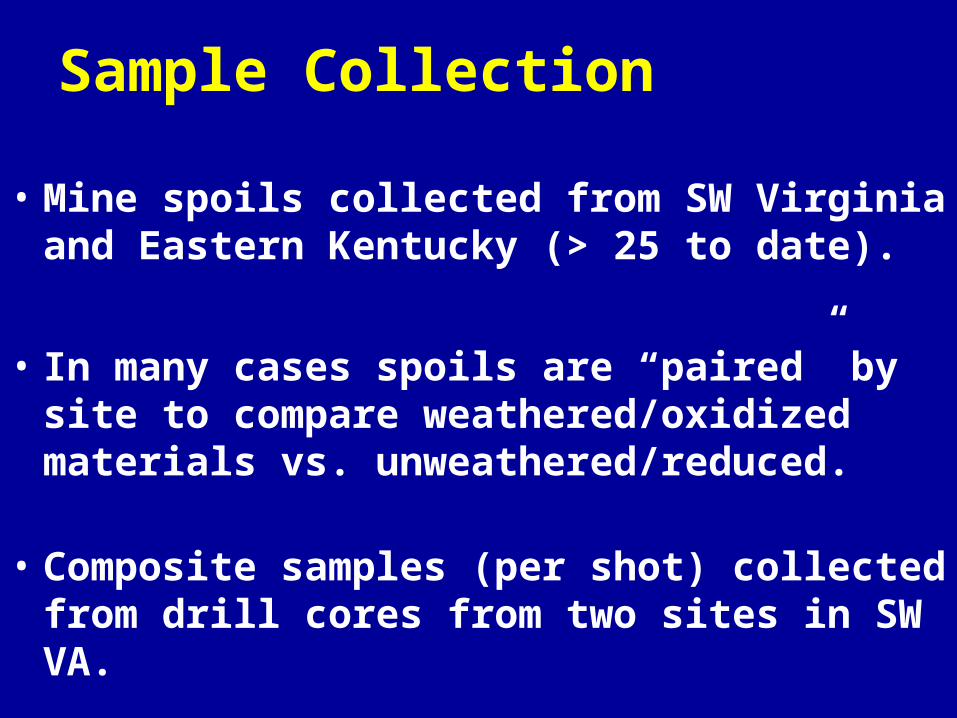
Sample Collection
• Mine spoils collected from SW Virginia and Eastern Kentucky (> 25 to date).
• In many cases spoils are “paired” by site to compare weathered/oxidized materials vs. unweathered/reduced.
• Composite samples (per shot) collected from drill cores from two sites in SW VA.
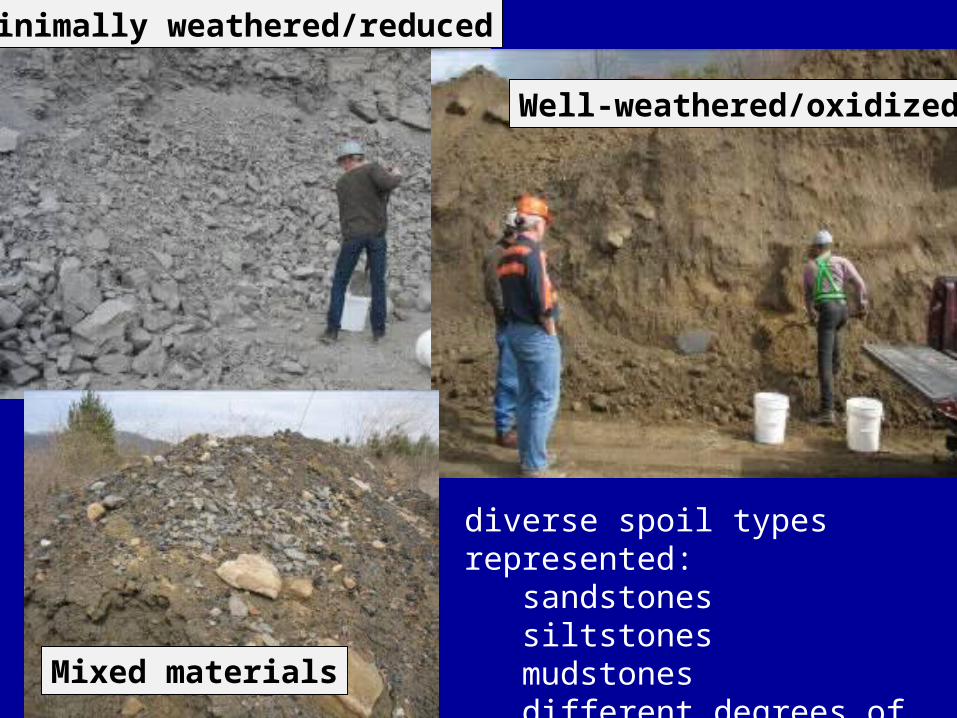
Minimally weathered/reduced
Well-weathered/oxidized
Mixed materials
diverse spoil types represented: sandstones siltstones mudstones different degrees of weathering
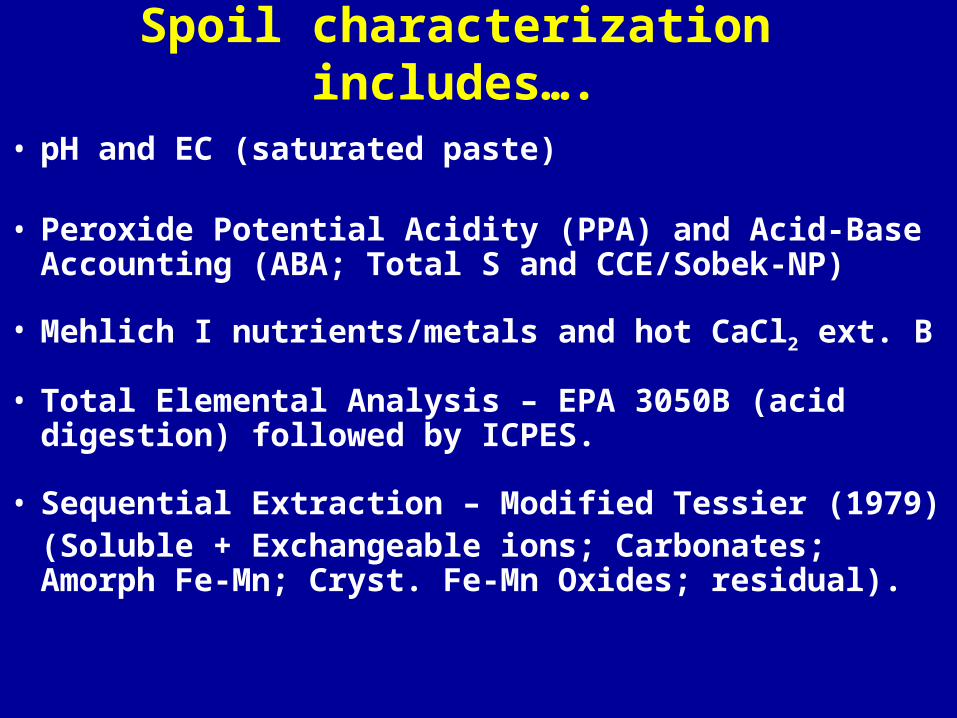
Spoil characterization includes….
• pH and EC (saturated paste)
• Peroxide Potential Acidity (PPA) and Acid-Base Accounting (ABA; Total S and CCE/Sobek-NP)
• Mehlich I nutrients/metals and hot CaCl2 ext. B
• Total Elemental Analysis – EPA 3050B (acid digestion) followed by ICPES.
• Sequential Extraction – Modified Tessier (1979)(Soluble + Exchangeable ions; Carbonates; Amorph Fe-Mn; Cryst. Fe-Mn Oxides; residual).
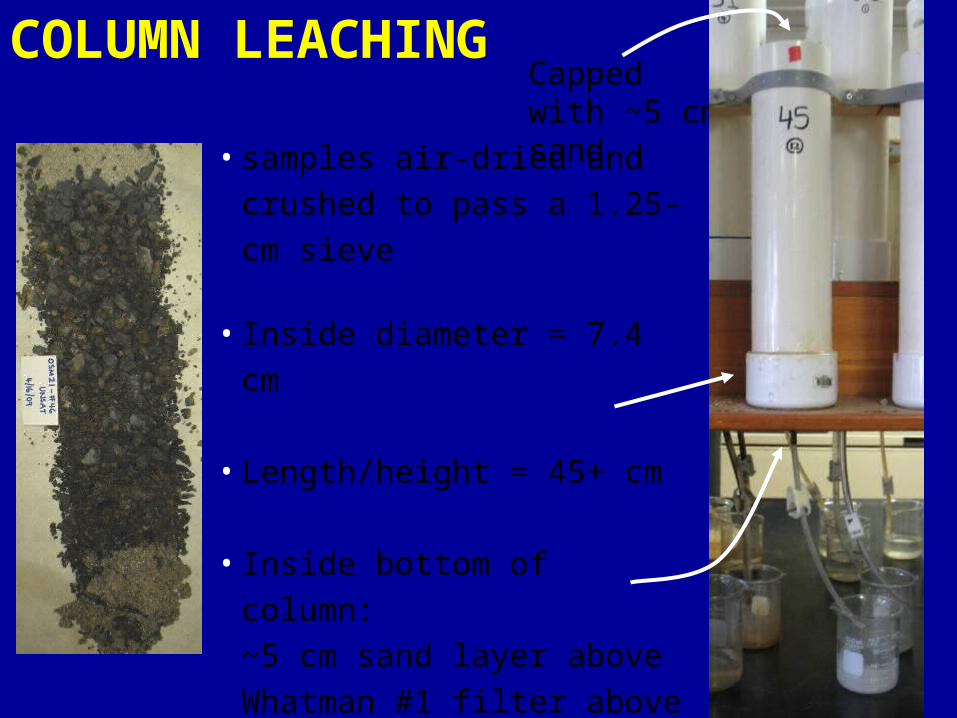
• samples air-dried and crushed
to pass a 1.25-cm sieve
• Inside diameter = 7.4 cm
• Length/height = 45+ cm
• Inside bottom of column:
~5 cm sand layer above
Whatman #1 filter above
0.1 mm mesh (glued to endcap)
• 1 cm PVC pipe nipple and
Tygon tubing for drainage
• Sample volume ~1200 cm3
Capped with ~5 cm sand
COLUMN LEACHING
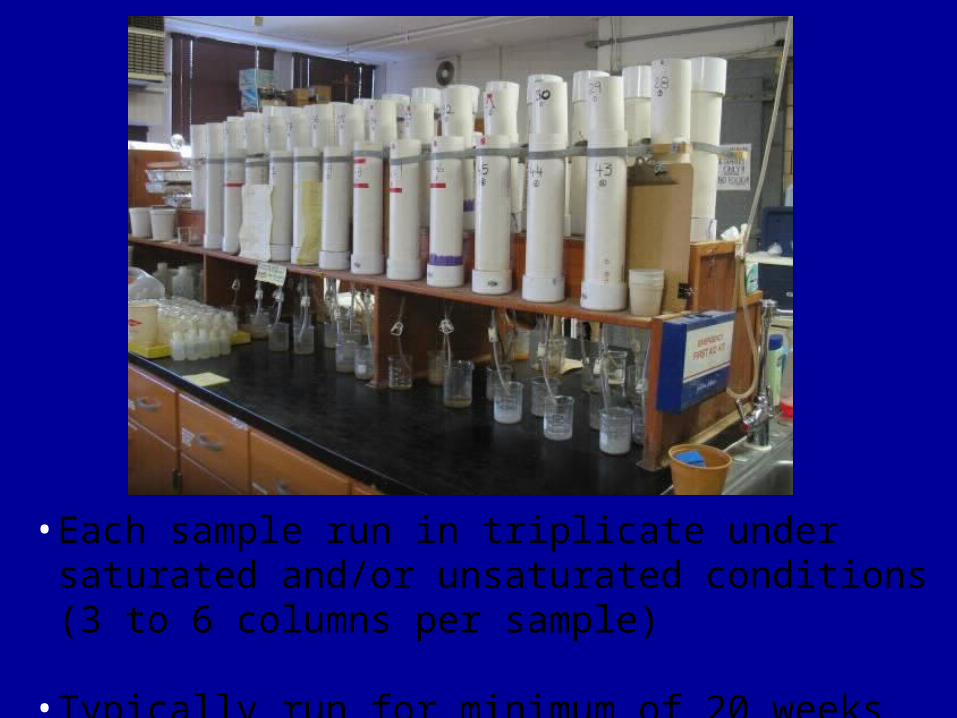
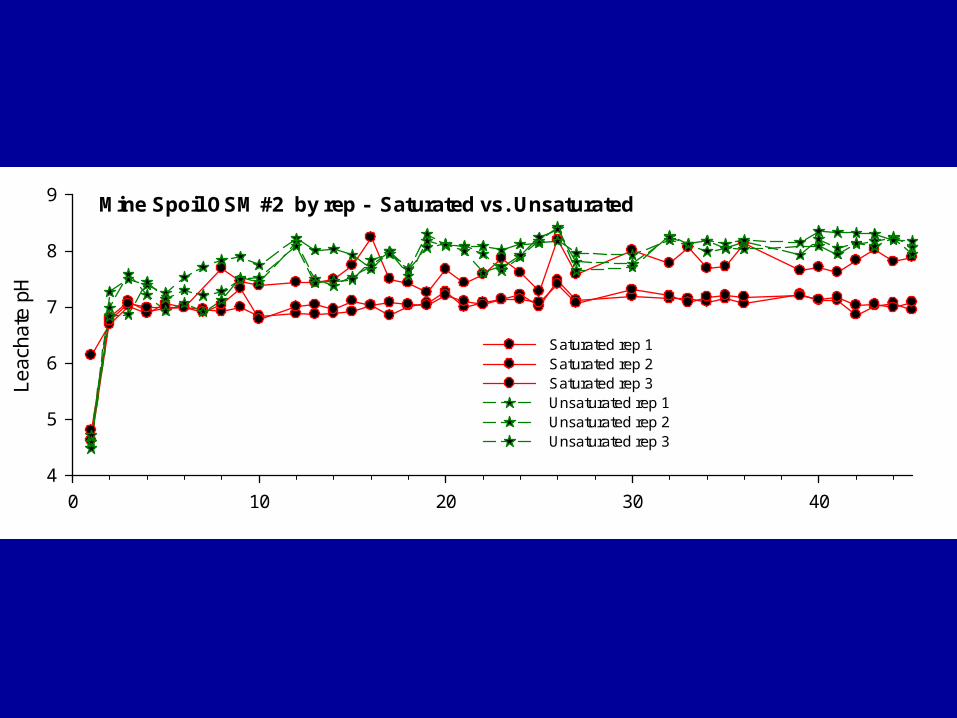
• Each sample run in triplicate under saturated and/or unsaturated conditions (3 to 6 columns per sample)
• Typically run for minimum of 20 weeks (40 cycles)
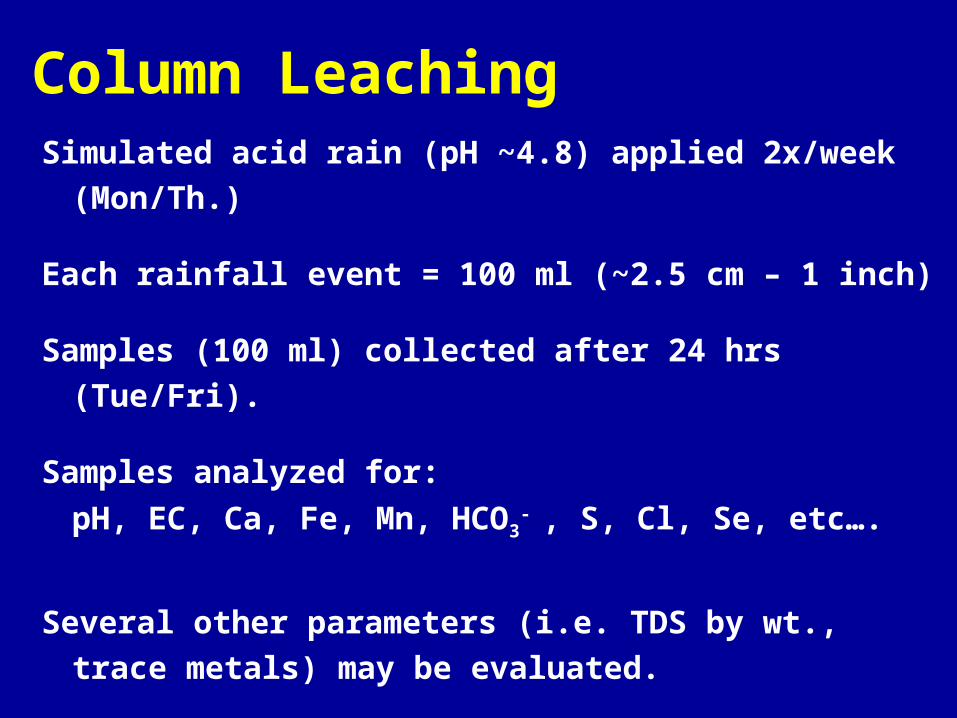
Column Leaching Simulated acid rain (pH ~4.8) applied 2x/week
(Mon/Th.)
Each rainfall event = 100 ml (~2.5 cm – 1 inch)
Samples (100 ml) collected after 24 hrs (Tue/Fri).
Samples analyzed for:
pH, EC, Ca, Fe, Mn, HCO3- , S, Cl, Se, etc….
Several other parameters (i.e. TDS by wt., trace
metals) may be evaluated.
0 10 20 30 40
Leac
hate
pH
4
5
6
7
8
9
Saturated rep 1Saturated rep 2Saturated rep 3Unsaturated rep 1Unsaturated rep 2Unsaturated rep 3
Mine Spoil OSM #2 by rep - Saturated vs. Unsaturated
0 10 20 30 40
Leac
hate
pH
4
5
6
7
8
9
Saturated rep 1Saturated rep 2Saturated rep 3Unsaturated rep 1Unsaturated rep 2Unsaturated rep 3
Coarse Refuse OSM #21 by rep - Saturated vs. Unsaturated
Leachate event #
0 10 20 30 40
Leac
hate
pH
6.5
7.0
7.5
8.0
8.5
Saturated rep 1Saturated rep 2Saturated rep 3Unsaturated rep 1Unsaturated rep 2Unsaturated rep 3
Fine Refuse OSM #19 by rep - Saturated vs. Unsaturated
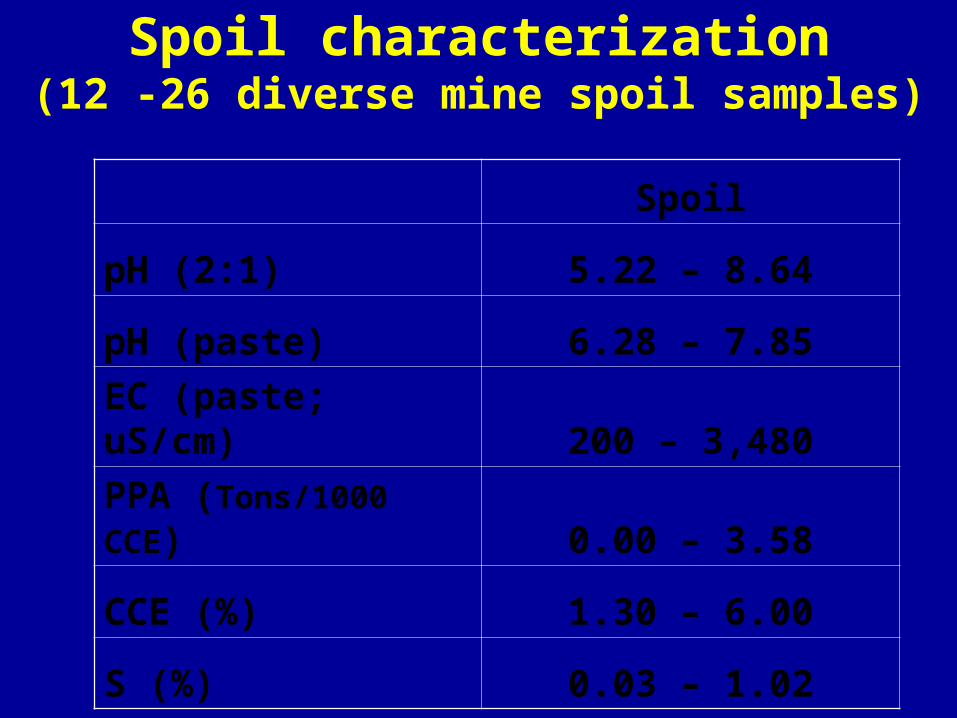
Spoil characterization(12 -26 diverse mine spoil samples)
Spoil
pH (2:1) 5.22 – 8.64
pH (paste) 6.28 – 7.85
EC (paste; uS/cm) 200 – 3,480
PPA (Tons/1000 CCE) 0.00 – 3.58
CCE (%) 1.30 – 6.00
S (%) 0.03 – 1.02
leach #
0 5 10 15 20 25 30
pH
4
5
6
7
8
9
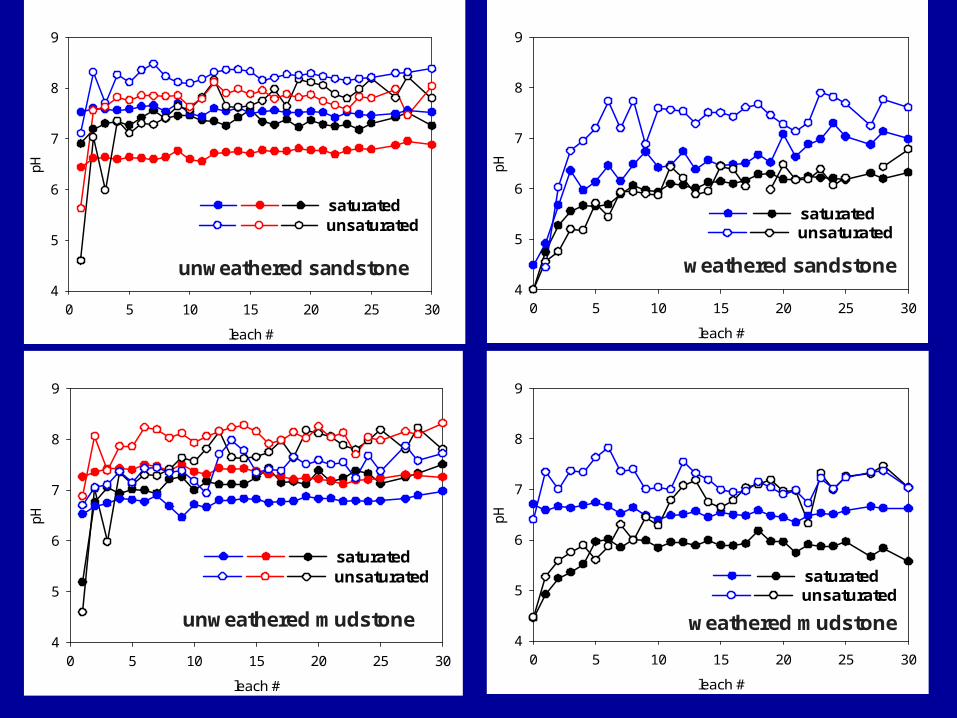
unweathered sandstone
saturatedunsaturated
leach #
0 5 10 15 20 25 30
pH
4
5
6
7
8
9
unweathered mudstone
saturatedunsaturated
leach #
0 5 10 15 20 25 30
pH
4
5
6
7
8
9
weathered sandstone
saturatedunsaturated
leach #
0 5 10 15 20 25 30
pH
4
5
6
7
8
9
weathered mudstone
saturatedunsaturated
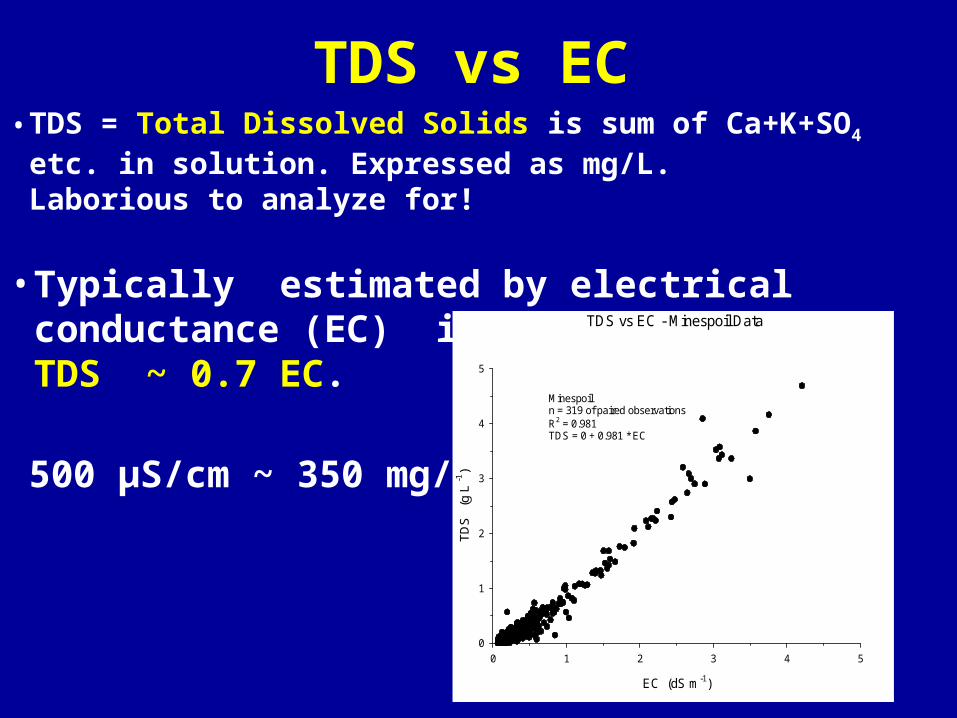
TDS vs EC• TDS = Total Dissolved Solids is sum of Ca+K+SO4
etc. in solution. Expressed as mg/L. Laborious to analyze for!
• Typically estimated by electrical conductance (EC) in µS/cm. TDS ~ 0.7 EC.
• 500 µS/cm ~ 350 mg/L
TDS vs EC - Minespoil Data
EC (dS m-1)
0 1 2 3 4 5
TD
S
(g L
-1)
0
1
2
3
4
5
Minespoil n = 319 of paired observationsR2 = 0.981TDS = 0 + 0.981 * EC
leach #
0 5 10 15 20 25 30
EC
(uS
/cm
)
0
500
1000
1500
2000
2500
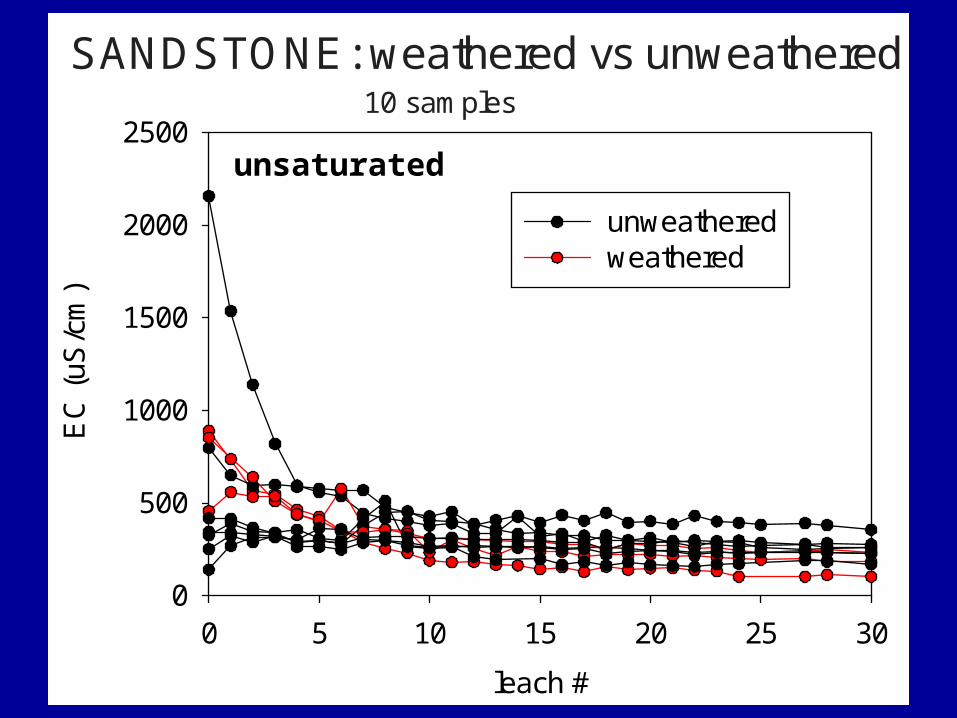
unweatheredweathered
SANDSTONE: weathered vs unweathered10 samples
unsaturated
leach #
0 5 10 15 20 25 30
EC
(u
S/c
m)
0
500
1000
1500
2000
2500
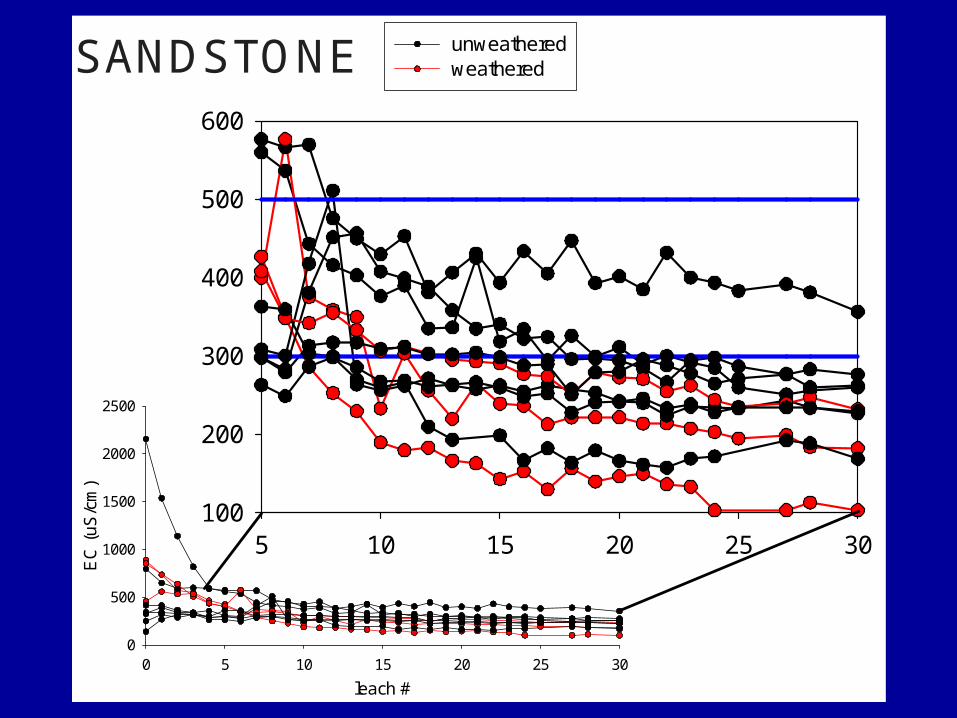
unweatheredweatheredSANDSTONE
5 10 15 20 25 30100
200
300
400
500
600
leach #
0 5 10 15 20 25 30
EC
(uS
/cm
)
0
1000
2000
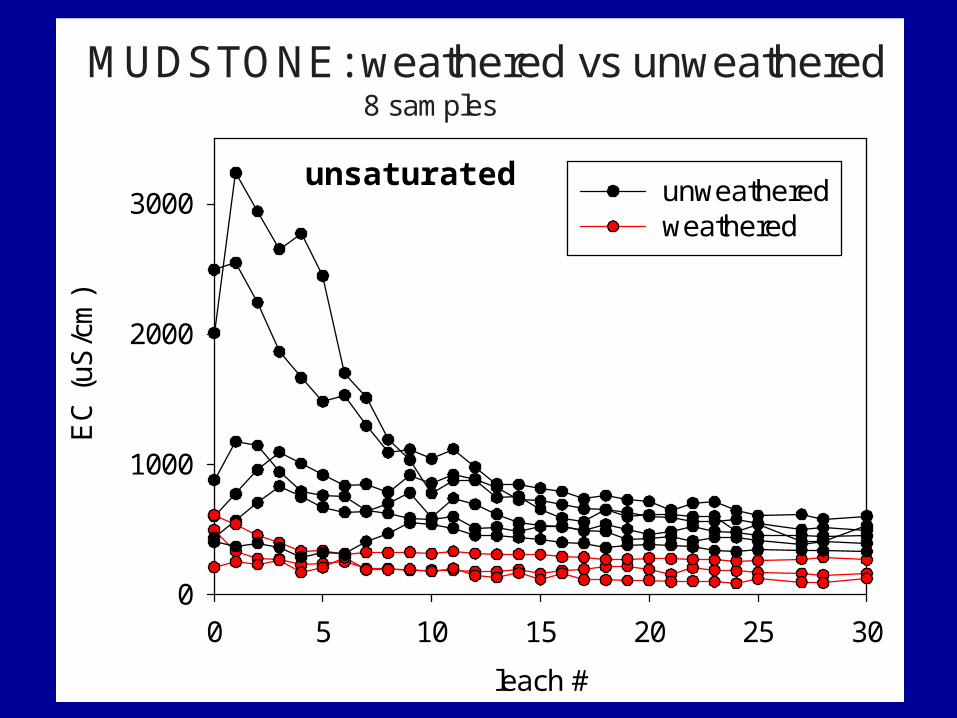
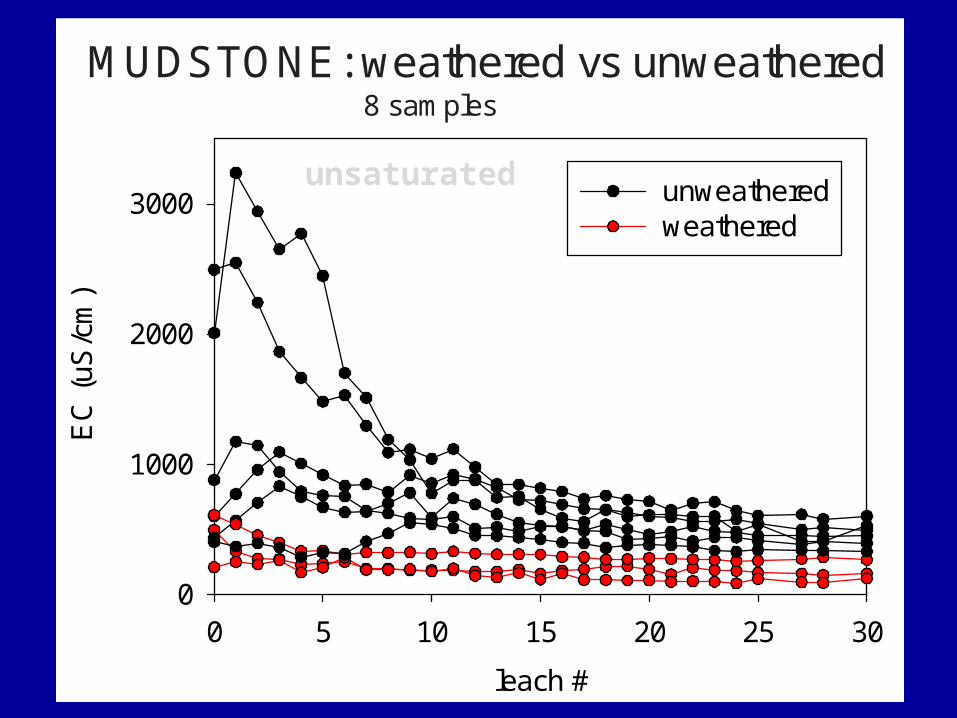
3000 unweatheredweathered
MUDSTONE: weathered vs unweathered8 samples
unsaturated

leach #
0 5 10 15 20 25 30
EC
(uS
/cm
)
0
1000
2000
3000
MUDSTONE
10 15 20 25 300
200
400
600
800
1000
1200
unweatheredweathered
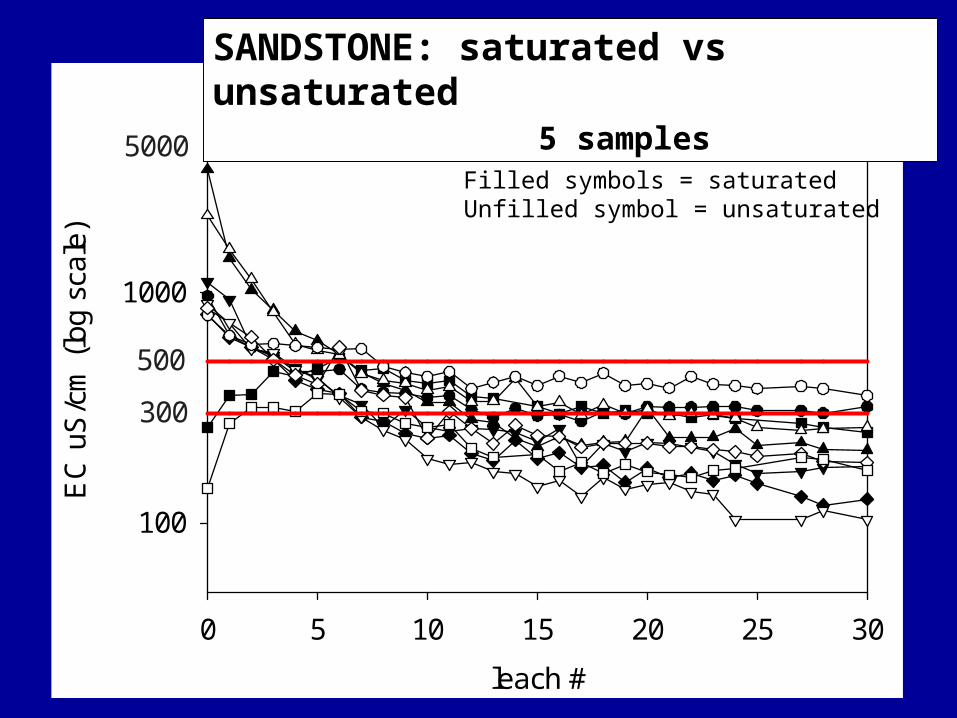
leach #
0 5 10 15 20 25 30
EC
uS
/cm
(lo
g sc
ale)
100
1000
300
500
5000
SANDSTONE: saturated vs unsaturated 5 samples
Filled symbols = saturatedUnfilled symbol = unsaturated
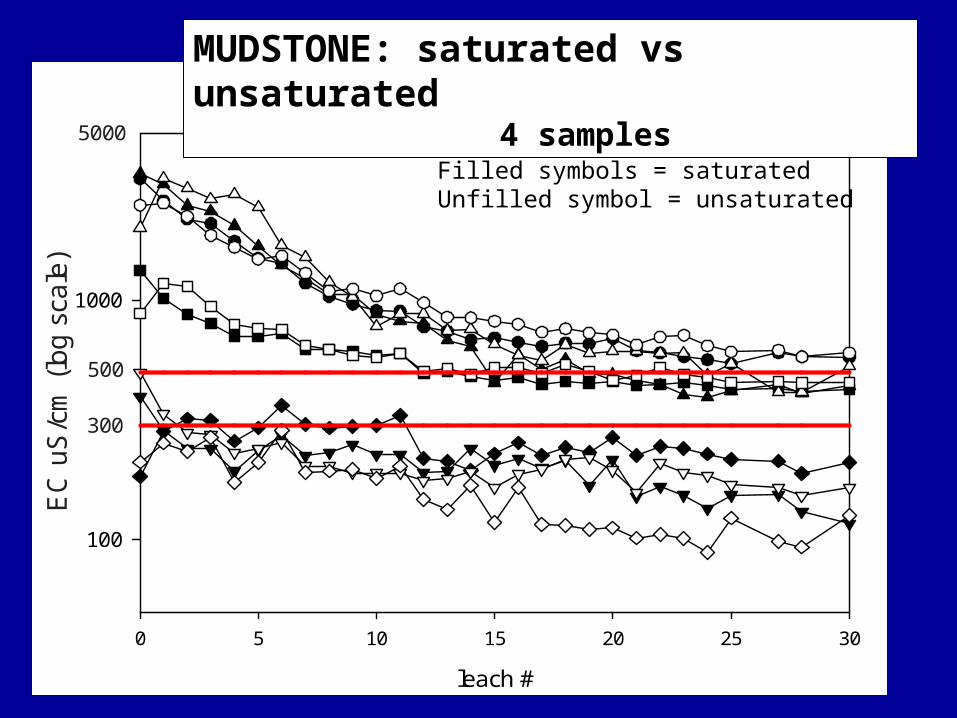
leach #
0 5 10 15 20 25 30
100
1000
500
300
5000
EC
uS
/cm
(lo
g s
cale
)MUDSTONE: saturated vs unsaturated
4 samples
Filled symbols = saturatedUnfilled symbol = unsaturated
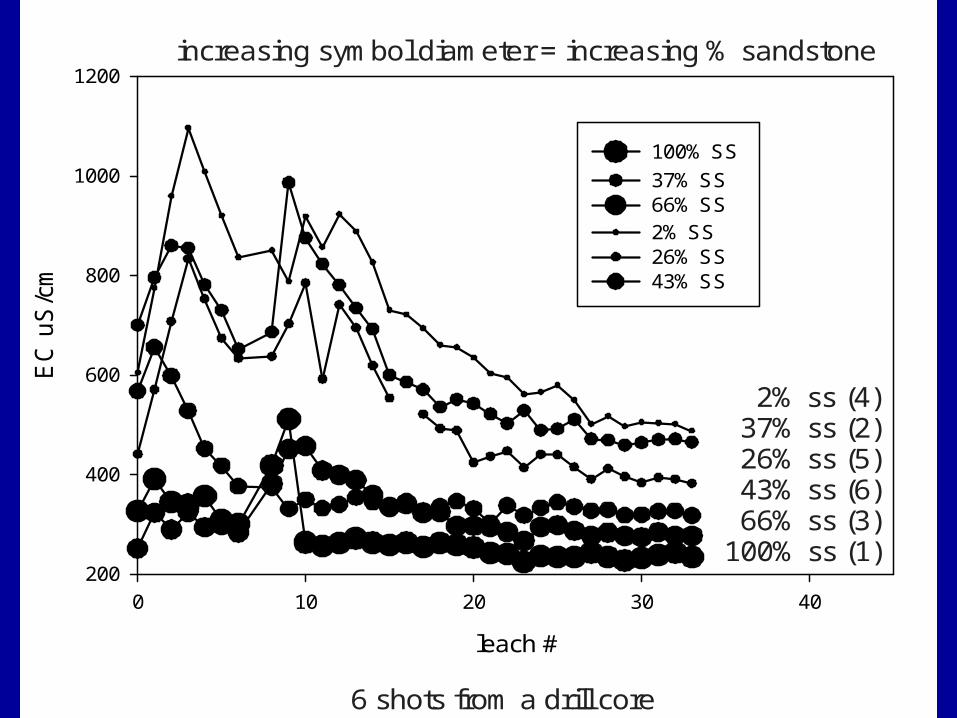
leach #
0 10 20 30 40
EC
uS
/cm
200
400
600
800
1000
1200
100% SS
37% SS66% SS2% SS26% SS 43% SS
increasing symbol diameter = increasing % sandstone
2% ss (4) 37% ss (2) 26% ss (5) 43% ss (6) 66% ss (3)100% ss (1)
6 shots from a drill core
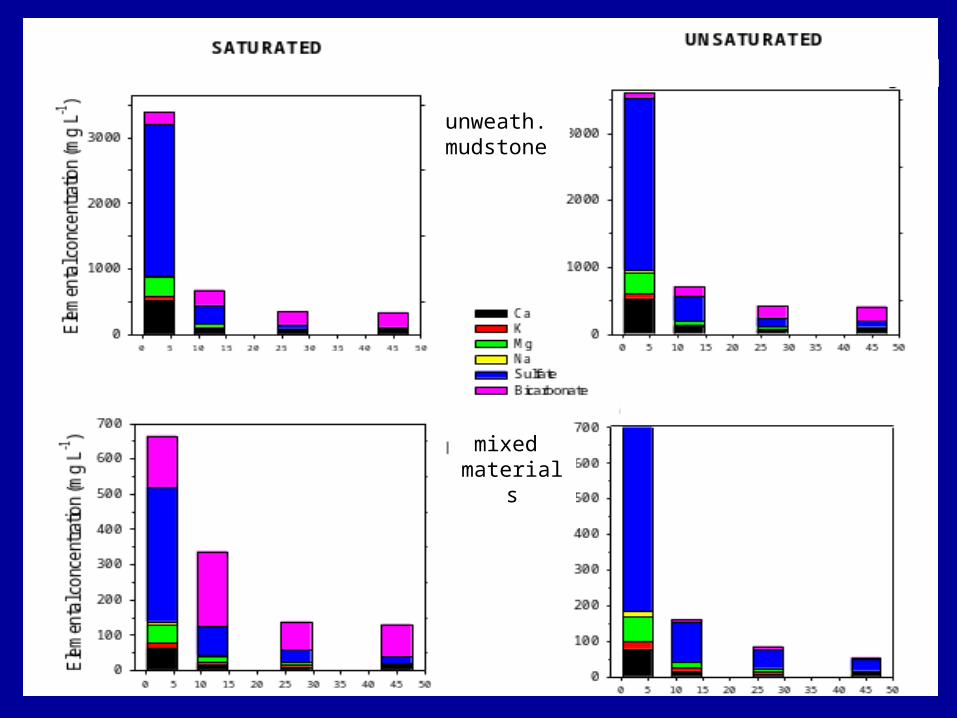
unweath. mudstone
mixed materials
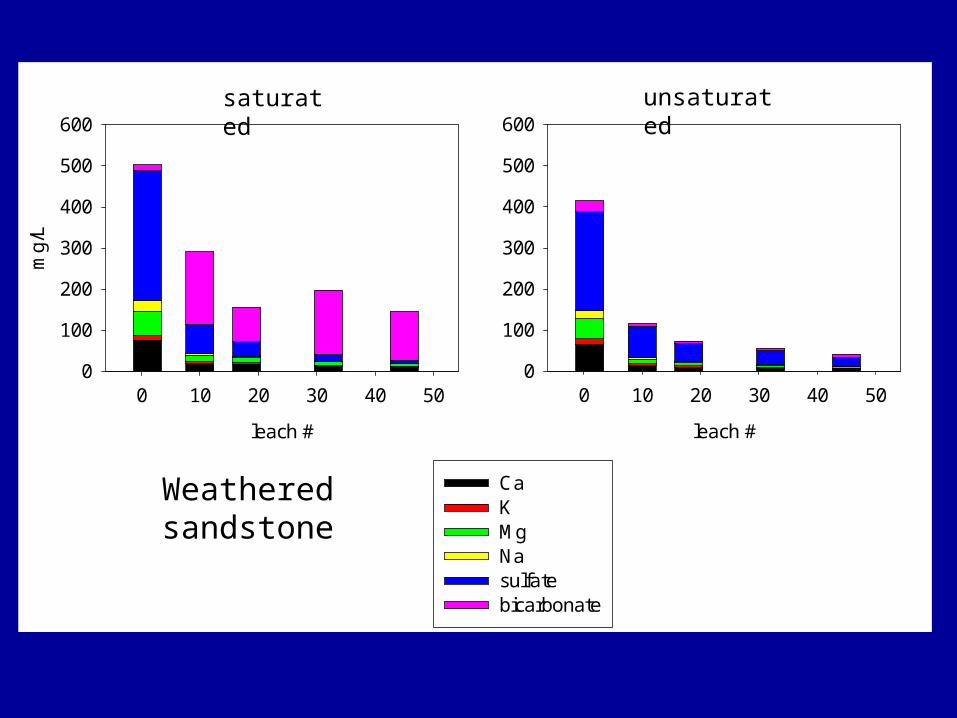
leach #
0 10 20 30 40 50
mg/
L
0
100
200
300
400
500
600
CaKMgNasulfatebicarbonate
leach #
0 10 20 30 40 500
100
200
300
400
500
600
Weathered sandstone
saturated unsaturated
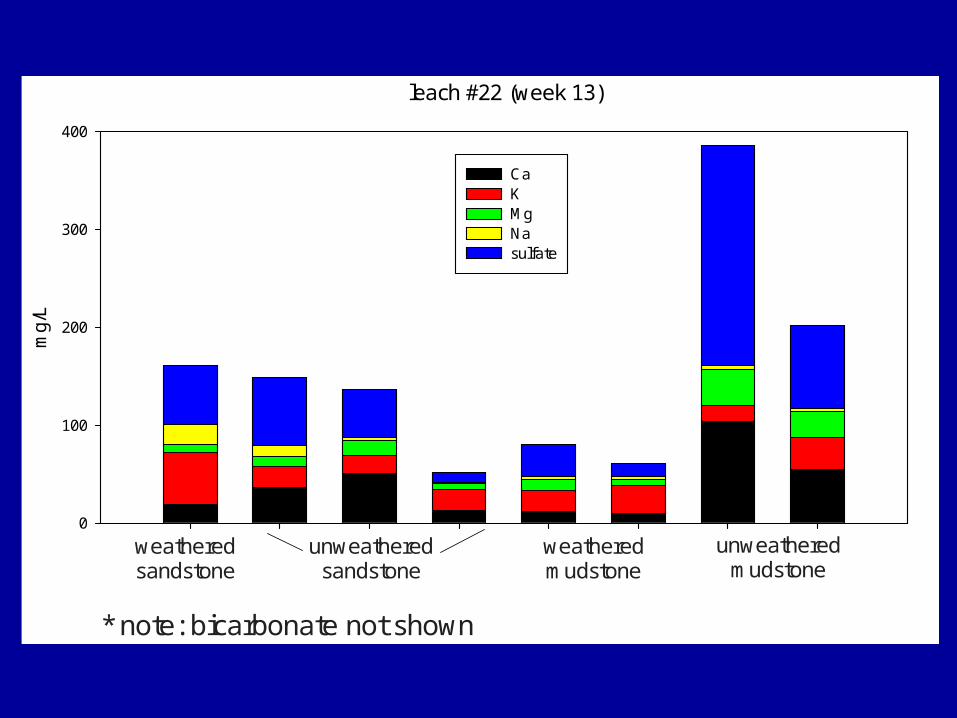
unsaturatedleach #22 (week 13)
mg
/L
0
100
200
300
400
Ca K Mg Na sulfate
weatheredsandstone
unweatheredsandstone
unweatheredmudstone
weatheredmudstone
* note: bicarbonate not shown
Summary Findings
Most samples eluted considerable levels of TDS over their initial leaching cycles with EC usually > 500 uS/cm; some were lower.
For all materials, after first pore volumes (7 to 9 cycles) leach, TDS elution drops rapidly.
Samples containing significant reactive sulfides were most likely to elute high TDS levels for the duration of the study, regardless of their leachate pH values.
Summary Findings
Overall, TDS mass was dominated by six elements/compounds:
Ca, K, Mg, Na, SO4 and HCO3, .
TDS was commonly dominated by… • sulfate under unsaturated conditions• sulfate and bicarbonate under saturated
conditions.
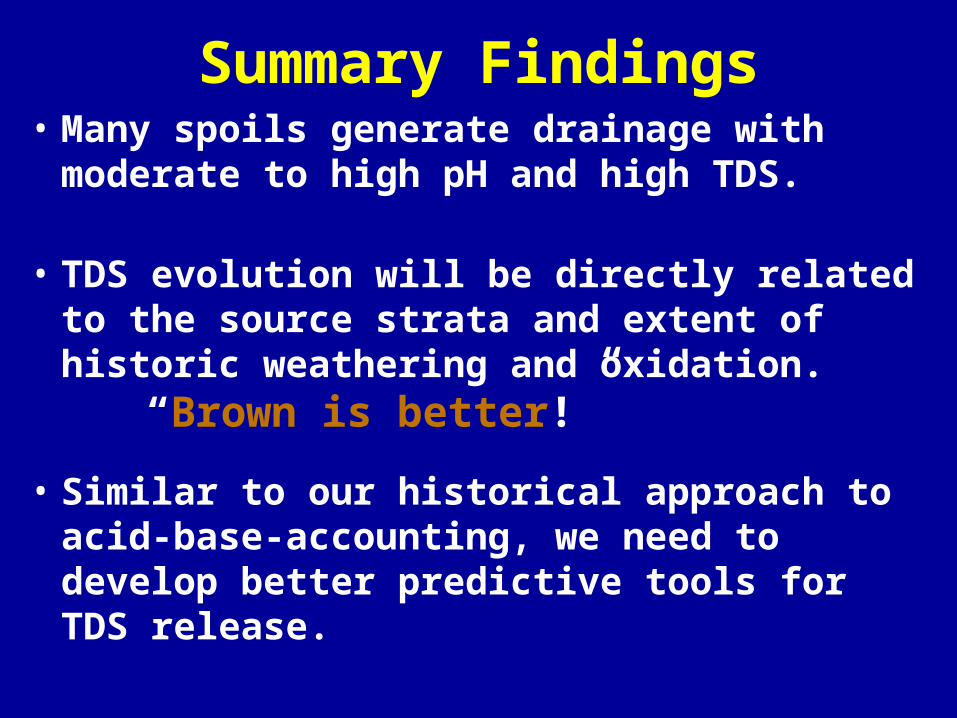
• Many spoils generate drainage with moderate to high pH and high TDS.
• TDS evolution will be directly related to the source strata and extent of historic weathering and oxidation.
“Brown is better!”
• Similar to our historical approach to acid-base-accounting, we need to develop better predictive tools for TDS release.
Summary Findings
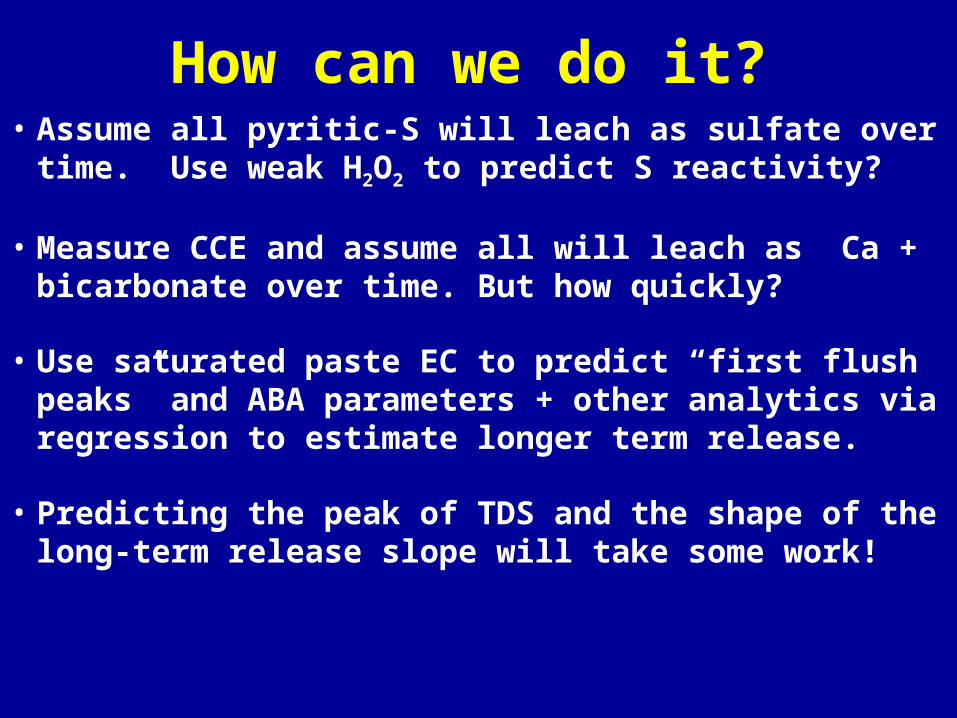
How can we do it? • Assume all pyritic-S will leach as sulfate over
time. Use weak H2O2 to predict S reactivity?
• Measure CCE and assume all will leach as Ca + bicarbonate over time. But how quickly?
• Use saturated paste EC to predict “first flush peaks” and ABA parameters + other analytics via regression to estimate longer term release.
• Predicting the peak of TDS and the shape of the long-term release slope will take some work!
leach #
0 5 10 15 20 25 30
EC
(uS
/cm
)
0
1000
2000
3000 unweatheredweathered
MUDSTONE: weathered vs unweathered8 samples
unsaturated
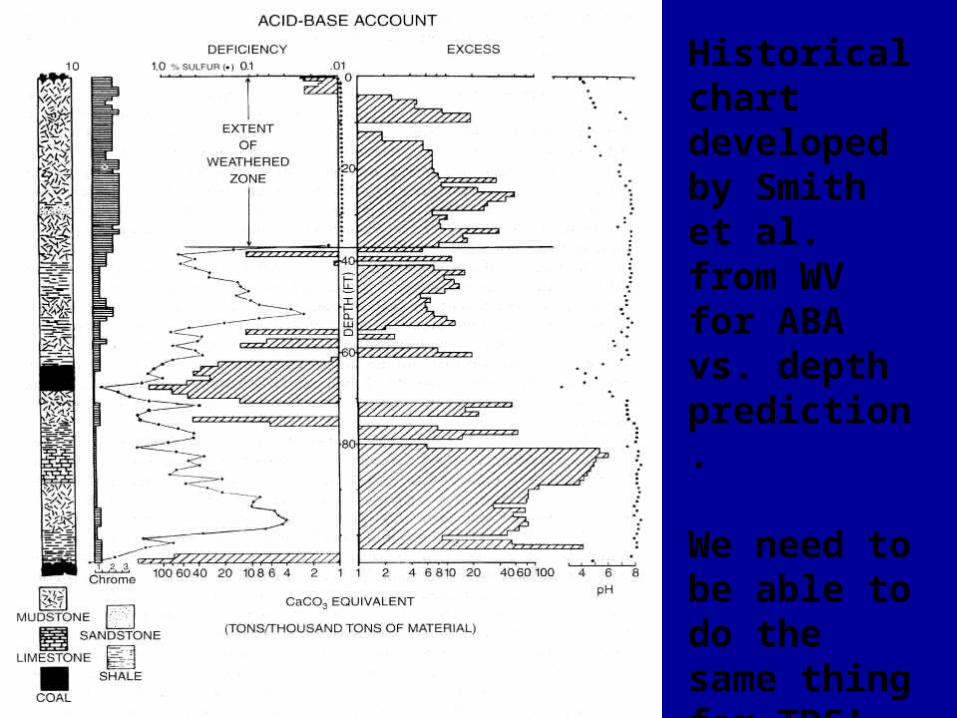
Historical chart developed by Smith et al. from WV for ABA vs. depth prediction.
We need to be able to do the same thing for TDS!
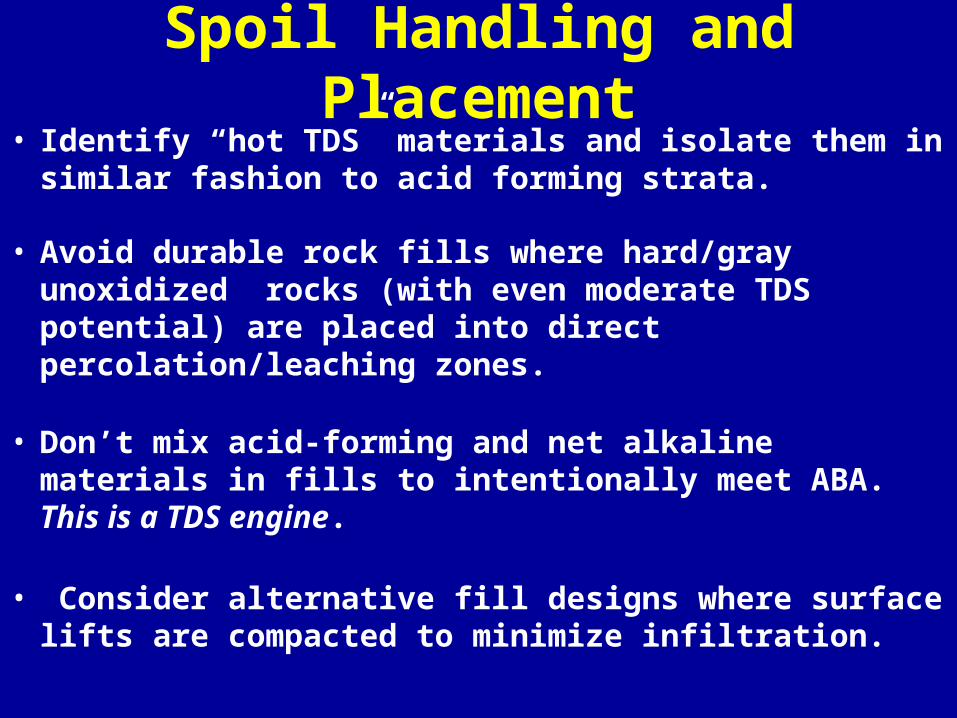
Spoil Handling and Placement• Identify “hot TDS” materials and isolate them in similar
fashion to acid forming strata.
• Avoid durable rock fills where hard/gray unoxidized rocks (with even moderate TDS potential) are placed into direct percolation/leaching zones.
• Don’t mix acid-forming and net alkaline materials in fills to intentionally meet ABA. This is a TDS engine.
• Consider alternative fill designs where surface lifts are compacted to minimize infiltration.
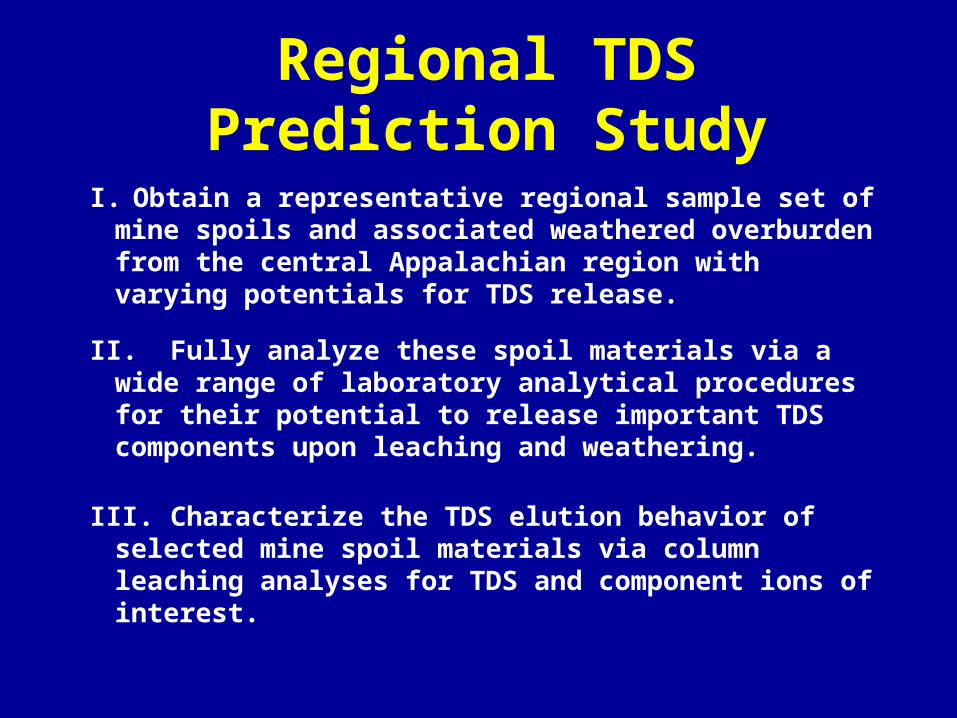
Regional TDS Prediction Study
I. Obtain a representative regional sample set of mine spoils and associated weathered overburden from the central Appalachian region with varying potentials for TDS release.
II. Fully analyze these spoil materials via a wide range of laboratory analytical procedures for their potential to release important TDS components upon leaching and weathering.
III. Characterize the TDS elution behavior of selected mine
spoil materials via column leaching analyses for TDS and component ions of interest.
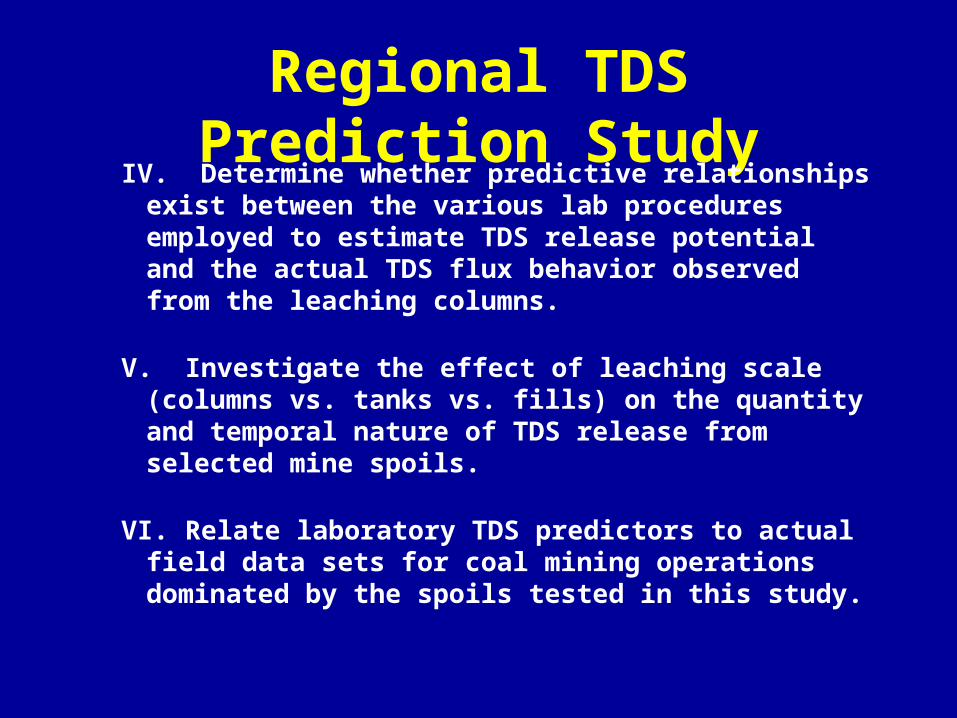
Regional TDS Prediction StudyIV. Determine whether predictive relationships exist
between the various lab procedures employed to estimate TDS release potential and the actual TDS flux behavior observed from the leaching columns.
V. Investigate the effect of leaching scale (columns vs. tanks vs. fills) on the quantity and temporal nature of TDS release from selected mine spoils.
VI. Relate laboratory TDS predictors to actual field data sets for coal mining operations dominated by the spoils tested in this study.
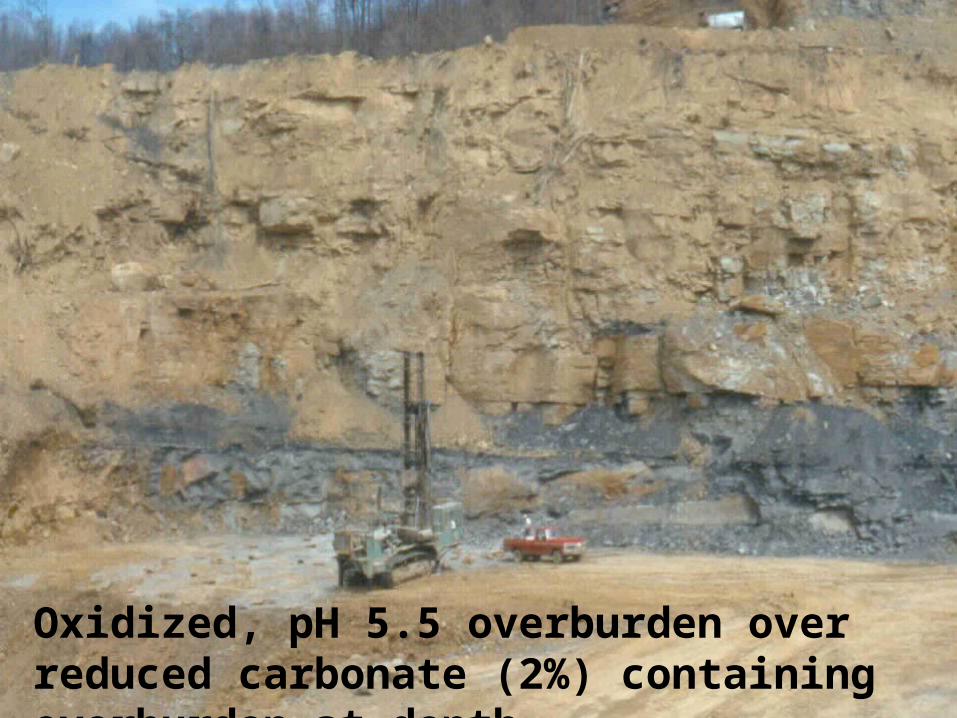
Oxidized, pH 5.5 overburden over reduced carbonate (2%) containing overburden at depth.
Acknowledgments
Current support provided by industry cooperators and Powell River Project.
Thanks to OSM for support of original 2007 to 2009 leaching study.
Thanks to Red River Coal, Alpha Natural Resources, TECO and other industry cooperators for assistance in sample collection.