min(e)d your tags: analysis of question response time in
TRANSCRIPT

Min(e)d Your Tags: Analysis of Question ResponseTime in StackOverflow
Vasudev Bhat Adheesh Gokhale Ravi Jadhav Jagat Pudipeddi Leman AkogluDepartment of Computer Science
Stony Brook UniversityEmail: {vabhat, agokhale, rjadhav, jpudipeddi, leman}@cs.stonybrook.edu
Abstract—Given a newly posted question on a Question andAnswer (Q&A) site, how long will it take until an answer isreceived? Does response time relate to factors about how thequestion asker composes their question? If so, what are thosefactors? With advances in social media and the Web, Q&A siteshave become a major source of information for Internet users.Response time of a question is an important aspect in these sitesas it is associated with the users’ satisfaction and engagement, andthus the lifespan of these online communities. In this paper westudy and estimate response time for questions in StackOverflow,a popular online Q&A forum where software developers postand answer questions related to programming. We analyze along list of factors in the data and identify those that have clearrelation with response time. Our key finding is that tag-relatedfactors, such as their “popularity” (how often the tag is used) andthe number of their “subscribers” (how many users can answerquestions containing the tag), provide much stronger evidencethan factors not related to tags. Finally, we learn models using theidentified evidential features for predicting the response time ofquestions, which also demonstrate the significance of tags chosenby the question asker.
Keywords-online communities, question answering sites, collec-tive intelligence, question response time, user engagement, humanbehavior, evidential feature analysis
I. INTRODUCTION
Q&A sites like StackOverflow, Yahoo! Answers, Naver,Quora, LiveQnA, WikiAnswers etc. are becoming increas-ingly popular with the growth of the Web. These are largecollaborative production and social computing platforms ofthe Web, aimed at crowd-sourcing knowledge by allowingusers to post and answer questions. They not only provide aplatform for experts to share their knowledge and get identifiedbut also help novice users solve their problems effectively.StackOverflow1 is one such community-driven Q&A websiteused by more than a million software developers who postand answer questions related to computer programming. It isgoverned by a reputation system2 which rewards the usersby giving reputation points, badges, extra privileges on thewebsite, etc. by the usefulness of their posts. The usefulnessof a question or an answer is largely determined by the numberof votes it receives.
In such a crowd-sourced system driven by a reputationmechanism, response time of questions to receive the firstanswer plays an important role and would largely determine
1http://www.stackoverflow.com2http://meta.stackoverflow.com/help/whats-reputation
Fig. 1. Probability distribution of the response time of questions onStackOverflow.
the popularity of the website. People who post questions wouldwant to know the time by which they can expect a responseto their question. In fact, a study by Rechavi et al. [1] onthe response time and satisfaction rates in Yahoo! Answersshowed that askers use the response time as a measure formarking the best answer, which indicates that the askers arelooking for quick responses. Response time analysis wouldalso help improve the site where administrators can reach outto the developers who possess necessarily skills so that thequestions get answered quickly. Although most questions onStackOverflow are answered in less than an hour, we observethat about 30% of the questions which are not answered withinan hour have a response time of more than a day (see Figure1). Therefore, it remains a crucial task to infer the responsetime of questions in Q&A sites in order to help improve usersatisfaction and lifespan.
Related to response time analysis, Mahmud et al. [2]proposed models based on exponentially-distributed wait timesto predict response time of questions on Twitter. Avrahami etal. [3] analyzed response times in instant messaging based onthe IM app and desktop settings. Our response time analysison StackOverflow is similar, however, a number of substan-tially different factors such as the reputation mechanism,tag information, availability of experts etc. are involved inStackOverflow which influence response time. Prediction ofresponse time in a Q&A site is thus a challenging problem

due to the number of factors involved.In our work, we identify evidential features related with
question response time and use these factors to build predic-tion models. As our key contribution, we show that besidesseveral other factors, tags of a question have strong correlationwith and are extremely indicative of response time. Taggingquestions involves askers selecting appropriate keywords (e.g.,android, jquery, c#) to broadly identify the domainsto which their questions are related. There also exist mecha-nisms by which other users can subscribe to tags, search viatags, mark tags as favorites, etc. As a result, tags play a crucialrole in how the questions are answered and hence determiningtheir response time. We focus on various tag-related features,such as the frequency of tags and number of subscribers oftags, which aid us in building our prediction models. To thebest of our knowledge, none of earlier works in the literaturehave studied the tag-related features and their influence onresponse time in Q&A sites.
Following are the main contributions of our work:• We study a large set of factors likely to be associated
with question response time in question answering sites.For the first time in the literature, we analyze tag-basedfeatures and illustrate the strong correlation betweenquestion tags and response time.
• We propose to exploit tag-based features in estimatingresponse time on a large collection from StackOverflow.Experiments demonstrate the utility of tags in the predic-tion tasks.
II. Q&A SITES AND DATA DETAILS
Formal articles and books are often inadequate in providinganswers to questions that people have on a daily basis. SeveralQ&A sites have become popular that meet the needs ofInternet users in seeking answers to their questions. Morris etal. [4] studied the kinds of topics for which people turn to theirsocial network to seek answers about and found technology tobe the top contender.
StackOverflow is a popular community-driven technology-focused Q&A site, which is used by more than a milliondevelopers across the globe who post and answer questionsrelated to computer programming. Example questions include“How to send 16bit data to FPGA??”, and “How to specifyfile order with Grunt?”. Askers can also specify a maximum of5 keywords, i.e. tags, that broadly describe the domain whichtheir questions belong to. For example, the latter questionabove on Grunt contains three tags, node.js, gruntjs,minimatch.
Users of StackOverflow can either post answers to questionsor comment on them, asking for more details. Questions andanswers can be up-voted or down-voted, deleted, or editedby the user or the site moderators. People who answer andpost questions are rewarded via the reputation system3 whichrewards the users by giving reputation points and these pointsdepend on the number of votes the question or the answer
3http://meta.stackoverflow.com/help/whats-reputation
receives. Other rewards include badges for users, bounty (i.e.,a lump sum reputation transfer from one user to the other) foranswering specific questions, extra privileges on the website,and so on.
StackOverflow provides a public dump of its database inevery quarter. For our analysis we consider data of four yearswhich spans from July 31, 2008 to July 31, 2012. This datahas information about all the posts, users, and votes. The sizeof the data in total is approximately 17GB. Several statisticsof the data are provided in Table I.
TABLE ISTACKOVERFLOW DATA STATISTICS.
Users: 1.3 millionQuestions: 3.4 million, Answers: 6.8 millionQuestions answered: 91.3%Median time to receive an answer: 16 minutesQuestions answered in ≤ 1hr: 63.5%Questions answered in > 1 day: 9.98%Expected number of tags a question has: 2.935
III. RESEARCH QUESTIONS
Our goal is to investigate which features of StackOverfloware highly correlated with response time and to build a modelthat can effectively estimate the response time of questions.More formally, we try to address the following problem: Givena set of questions Q1, Q2, Q3, ....Qn and the response timeof their first answer R1, R2, R3, R4, ...Rn, where R1 is theresponse time of the first answer received for question Q1, R2
is the response time of the first answer received for questionQ2 and so on, predict the response time R of a new questionQ that has been asked by a user, which is yet to receive ananswer.
Specifically, we formulate the response time predictionproblem as two separate classification tasks:
Task 1.Given a question (its tags, body, title, post date),Predict if it will be answered in ≤ 16 minutes (median
response time) or not.Task 2.
Given a question (its tags, body, title, post date),Predict if it will be answered in ≤ 1 hr or > 1 day
We start with a conjecture: The asker-specified tags of a ques-tion have significant influence on its response time, since usersoften answer questions based on their broad domains as spec-ified by the tags. For example a question with tag androidis likely to attract a specific group of answerers, which maybe different from one with tag genetic-programming.Tags are important, because users can subscribe to and followcertain tags, search the site based on tags, and designate certaintags as their favorites, which help them quickly identify thequestions of relevance to their expertise and interest. The listof research questions we are interested in answering throughthis study are listed as follows:

1) What are the intrinsic factors and signals that are likelyto influence a question’s response time?
2) What site-level information is available that shows sig-nificant correlation with response time? How do tag-related factors relate to response time?
3) Can we predict question response times using the evi-dential features available on the site? How effective arethe tag-based features?
IV. DATA ANALYSIS
In this section we first describe the evidential features weconsidered and found to correlate with response time. Later,we show several results of our data analysis demonstratingthese correlations.
A. Evidential Features
We construct and study a long list of potentially indicativefeatures in estimating the response time of questions. We groupour features into two: those that are tag-related and thosethat are not. We give a list of all the features and their shortdescriptions in Table II.
TABLE IIFEATURES CORRELATED WITH RESPONSE TIME. WE GROUPFEATURES INTO TWO: NON-TAG BASED FEATURES AND TAG
BASED FEATURES. NON-TAG BASED FEATURES ARE STUDIEDEARLIER WHILE WE ARE THE FIRST TO PROPOSE AND STUDY TAG
BASED FEATURES FOR RESPONSE TIME PREDICTION.
Tag based Question Featurestag popularity: Average frequency of tagsnum pop tags: Number of popular tagstag specificity: Average co-occurrence rate of tagsnum subs ans: Number of active subscriberspercent subs ans: % of active subscribersnum subs t: Number of responsive subscriberspercent subs t: % of responsive subscribers
Non-tag based Question Featuresnum code snippet: Number of code segmentscode len: Total code length (in chars)num image: Number of imagesbody len: Total body length (in chars)title len: Title length (in chars)end que mark: Whether title ends with question markbegin que word: Whether title starts with ‘wh’ wordis weekend: Whether question posted on weekendnum active verb: Number of verbs that indicate actionnum selfref: Number of self references of the asker
1) Tag based Question Features: The tag based features arethe main contributions of this work, since these have not beenstudied in any of the earlier works on Q&A sites, let alonefor predicting response time.
tag popularity: We define popularity of a tag t as its fre-quency, i.e., the number of questions that contains t as oneof its tags. For each question, we then compute the averagepopularity of all its tags.num pop tags: Each question can contain a maximum of 5tags. Here, we set a threshold on the frequency of tags togroup them into popular and non-popular ones, and count the
number of popular tags each question contains. We derivedthree such features based on frequency thresholds 25, 50, and100.tag specificity: We define the “togetherness” of two tagsas the extent to which the two co-occur in a question andwe measure it using the Point-wise Mutual Information:
PMI(x, y) =p(x, y)
p(x)p(y), where p(x, y) is the probability of
tag x and tag y occurring together in a question and p(x) isthe probability of tag x occurring in a question. The specificityof a question is the average “togetherness” of all pairs of tagsthat it contains.
In the following, we describe the features related to the“subscribers” of tags. Subscribers of a tag are defined asthose users who usually answer questions containing thatparticular tag. Our goal is to quantify the number of “active”and “responsive” subscribers for each tag. The activenessis associated with the amount of questions with a certaintag that a user is capable of answering. The responsivenessis associated with the speed with which the user answersquestions containing a certain tag. As such, we calculate thenumber of subscribers of a tag t based on (1) the number ofanswers posted by a user to questions containing t and (2) theuser’s average response time to questions containing t.
num subs ans: We define an “active subscriber” of a tag t tobe a user who has posted “sufficient” answers in the “recentpast” to questions containing t. We say that a user has posted“sufficient” answers when the number of their answers isgreater than a particular threshold δ(ans) and by “recent past”we mean a predefined number of months δ(mo) before thelast posted answer in the dataset. We conducted experimentswith δ(mo)=3 and δ(ans) = 10, 20, 30. After computing thenumber of active subscribers for every tag, we compute theaverage number of active subscribers for individual tags ineach question.percent subs ans: We also compute the ratio of the numberof “active subscribers” to the total number of subscribers,where the total number of subscribers indicates the numberof users who have posted at least one answer (“in the recentpast”) to a question containing a particular tag.num subs t: We say that a user is a “responsive subscriber” ofa tag t if their average response time for questions containingt and posted in “recent past” is less than a threshold δ(t). Weset δ(mo)=3 for defining recent past as before, and δ(t)=1hour. We then average the number of responsive subscribersof the individual tags each question contains.percent subs t: Similarly, we also compute the ratio of thenumber of “responsive subscribers” to the total number ofsubscribers, where the total is defined as before.
2) Non-tag based Question Features: The non-tag basedfeatures are quite straightforward and their short descriptionsin Table II are explanatory enough so we do not discuss themin detail here. The two that deserve a longer description arethe following.
num active verb: Active verbs are those that indicate certainaction taken by the asker before posting the question which(s)he mentions in the description of their question. Examplesinclude “tried”, “did”, “made”, “used”, “run”, etc.num selfref: Self references are words such as “I”, “we”,“me”, “my”, “myself”, etc. which the asker uses to refer tohimself/herself or his/her work.
The above two features indicate that the user has donecertain amount of ground work before asking the question.It is likely that such words implying prior effort increasethe strength of the question, which thereby receive an earlyresponse. Both features are normalized by the question length.
B. Feature AnalysisTo analyze the question features and their correlation with
response time, we constructed two types of plots: (i) boxplots (feature value against the response time) that capture themedian, 25% and 75% of the distributions, as well as the min-imum and maximum values, and (ii) cumulative distributionfunction (CDF) plots of the response time. We bin the valuesof most of the features using (base 2) logarithmic binning [5]except for the features considering ratios since the range ofpercentage is between 1-100.
1) Tag based Question Features: In Fig. 2 we observe thatas the popularity of tags increases the response time decreases,which implies that using more popular tags in a question islikely to result in an earlier answer on average. Similarly,the response time drops with the count of most popular tagsthat the question contains. On the right figure, we note thesignificant difference in response time among questions withat least one popular tag versus those that contain none.
Fig. 2. Response time drops by increasing popularity of tags andnumber of popular tags.
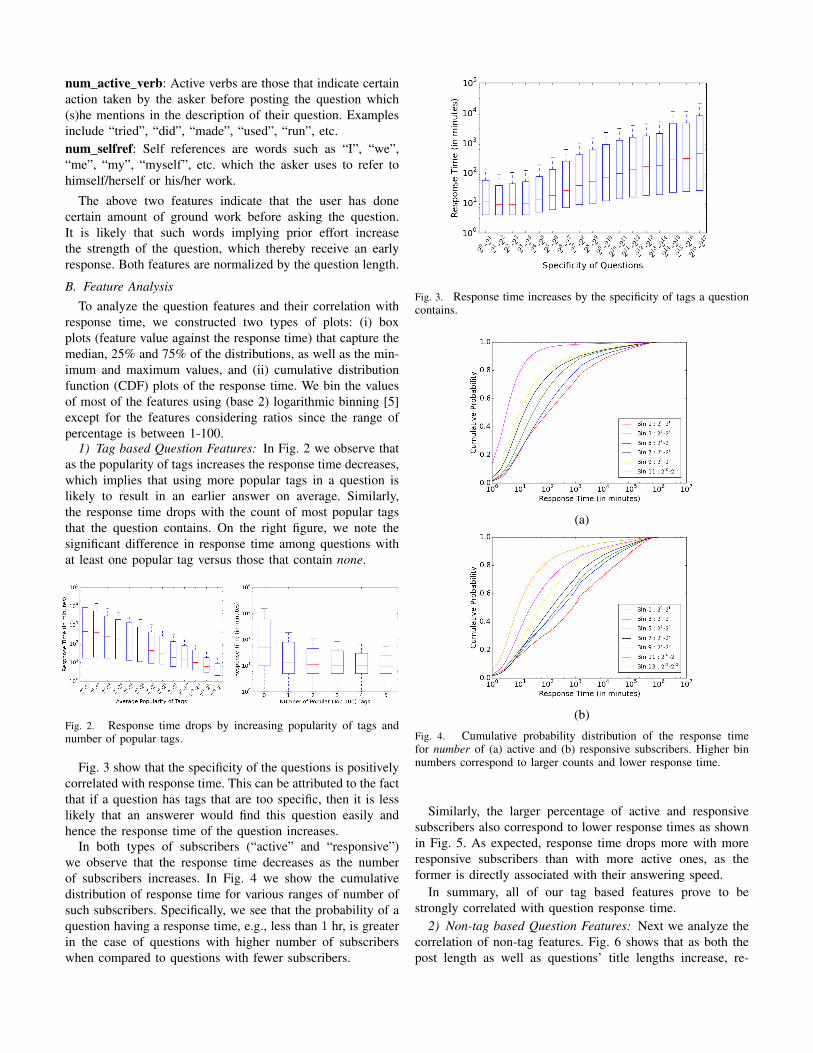
Fig. 3 show that the specificity of the questions is positivelycorrelated with response time. This can be attributed to the factthat if a question has tags that are too specific, then it is lesslikely that an answerer would find this question easily andhence the response time of the question increases.
In both types of subscribers (“active” and “responsive”)we observe that the response time decreases as the numberof subscribers increases. In Fig. 4 we show the cumulativedistribution of response time for various ranges of number ofsuch subscribers. Specifically, we see that the probability of aquestion having a response time, e.g., less than 1 hr, is greaterin the case of questions with higher number of subscriberswhen compared to questions with fewer subscribers.
Fig. 3. Response time increases by the specificity of tags a questioncontains.
(a)
(b)
Fig. 4. Cumulative probability distribution of the response timefor number of (a) active and (b) responsive subscribers. Higher binnumbers correspond to larger counts and lower response time.
Similarly, the larger percentage of active and responsivesubscribers also correspond to lower response times as shownin Fig. 5. As expected, response time drops more with moreresponsive subscribers than with more active ones, as theformer is directly associated with their answering speed.
In summary, all of our tag based features prove to bestrongly correlated with question response time.
2) Non-tag based Question Features: Next we analyze thecorrelation of non-tag features. Fig. 6 shows that as both thepost length as well as questions’ title lengths increase, re-

(a) (b)
Fig. 5. Response time decreases for larger percent of (a) active and(b) responsive subscribers.
sponse time also increases. In other words, succinct questionsseem to receive faster responses.
(a) (b)
Fig. 6. Response time increases by questions’ (a) body length and(b) title length.
With action verbs and self references, we see in Fig. 7 thatresponse time slightly decreases as the number of these wordsincreases although the decrease is not as significant as weobserved for tag-related features such as those based on tagpopularity and subscriber counts. As such, these are likely toprovide weak evidence for estimating response time.
(a) (b)
Fig. 7. Response time drops only slightly with the number of (a)action verbs and (b) self-references.
Fig. 8 (a) shows that including code snippets in questionsis likely to help with faster response however only if thecodes are of certain length (∼50-150 characters). Too shortor increasingly longer codes tend to increase response time.Finally, Fig. 8 (b) shows that questions that contain “?” or/andstart with “wh” words in their title are more likely to receivefaster responses, although the drop in response time is quitesmall and thus they also seem to be weak indicators.
Fig. 8. Response time (top) by largest code length embedded in thequestions, and (bottom) based on whether the question title is framedas a question or not.
3) Feature Analysis Summary: For brevity, we present anddiscuss only a subset of the feature analysis figures. In thefollowing, we summarize our observations of all features thatpositively and negatively correlate with response time.
Observation 1 (Positive Correlations): Given a question,the higher its body length, title length, code length, and tagspecificity; the higher its response time tends to be.
Observation 2 (Negative Correlations): Given a question,the larger its tag popularity, number of popular tags, numberand percentage of active and responsive subscribers associatedwith its tags, its number of active verbs and self-referencingwords, number of code snippets (up to 5), number of images(up to 5); the lower its response time tends to be. Starting thetitle with a “wh” word and ending it with a question mark aswell as posting the question on weekend days also correlatewith lower response time.
V. RESPONSE TIME PREDICTION
Having identified a long list of evidential features, we turnto exploiting them for predicting question response time. Asdescribed in Section III, we consider two prediction tasks. Task1 aims to classify questions based on whether they will receivean answer within the median response time, i.e. 16 minutes,or not. On the other hand, Task 2 tries to separate questionsthat are answered within an hour from those that take morethan one day to receive an answer.
Since we split the data based on median response time,the class sizes are exactly the same for Task 1 (∼1.7 millionquestions/class). For Task 2, the class sizes are skewed, with

most questions (63.5%) having response time less than 1 hour.If we simply predict all questions having low response time,we could achieve low prediction error, although such a trivialmethod is not very informative. To address this issue, wefollow the under-sampling technique [6] so as to balance theclass sizes (∼344 thousand questions/class). We perform thesampling several times and report averaged results.
We perform each task based on various settings dependingon the set of features used in prediction. Specifically, weexperiment with (i) all but only non-tag based (10) features, (ii)(1) tag-based feature tag popularity, (iii) another (1) tag-basedfeature percent subs t, (iv) all but only tag-based (9) features,and finally (v) all (19) features. We also employ severaldifferent classifiers to eliminate the pitfall of interpretingresults based on only a specific classifier type. In particular,we use two linear classifiers: logistic regression (Log Reg)and SVM with linear kernel (SVM (Lin)), as well as two non-linear classifiers: decision tree (DT) and SVM with radial basisfunction kernel (SVM (RBF)).
In Fig. 9 we show the classification performances (based on10-fold cross validation) on Task 1, measured by both accuracyand F1 score (bars depict standard deviation across folds).The results are quite intriguing. First and foremost, non-tagbased features perform inferior to all the other settings. Eachof the two models learned based on single tag-based featuresoutperforms the models learned using all 10 non-tag featuresby a significant margin.
Second, we observe that percent subs t proves to be moreevidential than tag popularity. This is expected, since theformer feature is based on the answering speed of responsive“subscribers” of tags. Using all of the 9 tag-based featuresimproves accuracy by 7-9% and the F1 score by 4-5% overusing only percent subs t. Adding all non-tag features ontop of all tag-based features, however, incurs only a slightimprovement, by only another 1-2%. This difference is in-significant specifically for the non-linear models.
Finally, we note that these observations remain qualitativelythe same across different types of classifiers, which indicatesthat the utility of our proposed tag based features comparedto the non-tag based features is not an artifact of the choiceof a specific classifier.
The same arguments hold for results on Task 2, as shown inFig. 10. Here, the performance is slightly better than Task 1,as the separation between response times of the class instancesis larger and hence the task is relatively easier.
To further analyze the importance of tag based features,we quantify the discriminative power of all the features inestimating response time. In particular, we use their sum ofinformation gains weighted by the number of samples split byeach feature at the internal tree nodes [7] based on the decisiontree models. We present the top 10 features for Task 1 and Task2 in Table III ranked by their importance. We observe that themost discriminative (top-3) as well as the majority (6/10) offeatures are the ones based on tags.
Fig. 9. Classification performance based on (top) accuracy and(bottom) F1 score on Task 1. All non-tag based features yield lowerperformance than tag popularity feature alone. Tag based featuresprovide the largest boost in prediction performance.
Fig. 10. Classification performance based on (top) accuracy and(bottom) F1 score on Task 2. All non-tag based features yield loweraccuracy than tag popularity feature alone. Tag based features providethe largest boost in prediction performance.

TABLE IIITOP 10 MOST IMPORTANT FEATURES BASED ON INFORMATION
GAIN. ASTERIKS (*) INDICATES TAG BASED FEATURES. NOTICETHAT THE MAJORITY OF THE FEATURES AS WELL AS TOP 3 MOST
PREDICTIVE FEATURES ARE TAG BASED.
Task 1 Task 2* percent subs t 0.440 * percent subs t 0.506* tag popularity 0.173 * percent subs ans 0.266* num subs t 0.130 * tag popularity 0.085
body len 0.123 body len 0.057* percent subs ans 0.033 * num subs ans 0.030* num subs ans 0.026 end que mark 0.013* tag specificity 0.025 title len 0.010
end que mark 0.013 * num subs t 0.010title len 0.013 code len 0.009code len 0.012 * tag specificity 0.007
Finally, we note that the prediction performance is slightlybetter for non-linear models for both tasks. The highestaccuracy (F1 score) on Task 1 is 68.5% (69.2%) and 72.6%(71.9%) on Task 2. While these predictions are significantlybetter than the random baseline, performance is not tremen-dously high. Nevertheless, our study clearly demonstrates thepredictive power of tag based features, which could be utilizedin future efforts of estimating response time.
VI. RELATED WORK
Asaduzzaman et al. [8] explained why questions remainunanswered on Q&A sites and proposed a categorizationof questions based on features such as too short, too hard,program specific, fails to attract expert, etc. Their analysisdoes not identify tags as one of the factors that determineif a question would remain unanswered. Mahmud et al. [2]studied how the response time can be predicted for questionsasked on Twitter. Since Twitter is not specifically meant to bea Q&A site, their results do not take into consideration theinformation that is available on such sites.
Rechavi et al. [1] analyzed average response time and otherfacts in Yahoo! Answers and predominantly looked for whatconstitutes a best answer on the site. They found that inmost cases the first received answer is marked as the bestanswer by the asker, implying the askers looking for quickresponses, while the community carefully chooses the bestanswer amongst all the answers received. The authors alsofound that being a follower or fan of a person on Yahoo!Answers does not yield quicker response from the person.Avrahami et al. [3] analyzed the response time in instantmessaging. They built various features from the messagingapp and desktop settings, and predicted if a response will begiven to a message within a certain period. In addition, Sunet al. [9] developed link prediction methods not only to inferwhether a relational link will form but also when the link isexpected to be formed in the future, although their work is onnetwork data and not on question response time.
Wang et al. [10] studied Quora to understand the impact ofits site design and organization on the growth and quality ofits knowledge base. Different from earlier behavioral studies,this work focuses on the design aspects of the Q&A sites
and their effects on user engagement. Other related works onQ&A sites include the quality and value analysis of questionsand answers. Harper et al. [11] studied the predictors of answerquality with respect to two dimensions; site characteristics(e.g., type and organization of communities and experts), andquestion characteristics (e.g., strategies like thanking in ad-vance and showing prior effort). Anderson et al. [12] analyzedthe factors that contribute to the long-term value of questionson StackOverflow.
Another group of works studies the lifespan of users inonline Q&A sites. Yang et al. [13] analyzed three largeQ&A sites from three countries to understand the predictivepatterns in participation lifespans of users. Arguello et al.[14] studied user communities to understand the contributingfactors to success in their ability to respond to and retain activeparticipants. Several other works also looked at newcomers’retention [15], [16], [17]. Finally, Movshovitz et al. studiedStackOverflow to build an understanding of its reputationsystem and user contributions [18]. None of these earlier worksstudied the response time of questions however.
VII. CONCLUSION
Question response times on Q&A sites affect the lifespanof these online communities as faster responses increase usersatisfaction and engagement. We study a large dataset fromStackOverflow to identify evidential factors associated withresponse time. We conjecture that the tags chosen by the askersinfluence how their questions are answered. Our in-depth dataanalysis and prediction experiments demonstrate the compe-tence of tag-based features as well as their superiority overmore obvious, previously studied non-tag based factors.
ACKNOWLEDGEMENTS
This material is based upon work supported by the Army Re-search Office Young Investigator Program grant under ContractNo. W911NF-14-1-0029, an R&D grant from Northrop GrummanAerospace Systems, an Office of Naval Research SBIR grant underContract No. N00014-14-P-1155, and Stony Brook University Of-fice of Vice President for Research. Any findings and conclusionsexpressed in this material are those of the author(s) and should notbe interpreted as representing the official policies or views, eitherexpressed or implied, of the funding parties.
REFERENCES
[1] A. Rechavi and S. Rafaeli, “Not all is gold that glitters: Response time& satisfaction rates in Yahoo! answers.” in SocialCom/PASSAT. IEEE,2011, pp. 904–909.
[2] J. Mahmud, J. Chen, and J. Nichols, “When will you answer this?estimating response time in twitter.” in ICWSM. The AAAI Press,2013.
[3] D. Avrahami and S. E. Hudson, “Responsiveness in instant messaging:predictive models supporting inter-personal communication.” in CHI.ACM, 2006, pp. 731–740.
[4] M. R. Morris, J. Teevan, and K. Panovich, “What do people ask theirsocial networks, and why?: a survey study of status message Q&Abehavior,” in SIGCHI, 2010.
[5] M. E. J. Newman, “Power laws, pareto distributions and zipf’s law,”Contemporary Physics, vol. 46, no. 5, pp. 323–351, 2005.
[6] N. V. Chawla, “Data mining for imbalanced datasets: An overview,” inData Mining and Knowledge Discovery Handbook. Springer, 2010, pp.875–886.

[7] P. G. Neville, “Decision Trees for Predictive Modeling,” SAS InstituteInc., 1999.
[8] M. Asaduzzaman, A. Mashiyat, C. Roy, and K. Schneider, “Answeringquestions about unanswered questions of stack overflow,” in 10th Work-ing Conference on Mining Software Repositories. Mining Challenge,2013.
[9] Y. Sun, J. Han, C. C. Aggarwal, and N. V. Chawla, “When will it hap-pen?: Relationship prediction in heterogeneous information networks.”in WSDM. ACM, 2012, pp. 663–672.
[10] G. Wang, K. Gill, M. Mohanlal, H. Zheng, and B. Y. Zhao, “Wisdomin the social crowd: an analysis of Quora,” in WWW, 2013.
[11] F. M. Harper, D. R. Raban, S. Rafaeli, and J. A. Konstan, “Predictorsof answer quality in online Q&A sites.” in CHI. ACM, 2008, pp.865–874.
[12] A. Anderson, D. P. Huttenlocher, J. M. Kleinberg, and J. Leskovec, “Dis-covering value from community activity on focused question answeringsites: a case study of stack overflow.” in KDD, 2012, pp. 850–858.
[13] J. Yang, X. Wei, M. S. Ackerman, and L. A. Adamic, “Activity lifespan:An analysis of user survival patterns in online knowledge sharingcommunities.” in ICWSM, 2010.
[14] J. Arguello, B. S. Butler, E. Joyce, R. Kraut, K. S. Ling, , and X. Wang,“Talk to me: foundations for successful individual-group interactions inonline communities,” in CHI, 2006.
[15] C. Lampe and E. W. Johnston, “Follow the (slash) dot: effects offeedback on new members in an online community.” in GROUP, 2005,pp. 11–20.
[16] E. Joyce and R. E. Kraut, “Predicting continued participation in news-groups.” J. Computer-Mediated Communication, vol. 11, no. 3, pp. 723–747, 2006.
[17] G. Dror, D. Pelleg, O. Rokhlenko, and I. Szpektor, “Churn predictionin new users of yahoo! answers.” in WWW, 2012, pp. 829–834.
[18] D. Movshovitz-Attias, Y. Movshovitz-Attias, P. Steenkiste, andC. Faloutsos, “Analysis of the reputation system and user contributionson a question answering website: Stackoverflow.” in ASONAM, 2013,pp. 886–893.