mini grids for half a billion people · 2020-06-25 · 2 mini grids for half a billion people...
TRANSCRIPT

MINI GRIDS FOR HALF A BILLION PEOPLEMarket Outlook and Handbook for Decision Makers
TECHNICAL REPORT 014/19
EXECUTIVE SUMMARY
Pub
lic D
iscl
osur
e A
utho
rized
Pub
lic D
iscl
osur
e A
utho
rized
Pub
lic D
iscl
osur
e A
utho
rized
Pub
lic D
iscl
osur
e A
utho
rized

MINI GRIDS FOR HALF A BILLION PEOPLEB
Copyright © June 2019 The International Bank for Reconstruction and Development / THE WORLD BANK GROUP Energy Sector Management Assistance Program 1818 H Street, NW | Washington DC 20433 | USA
ESMAP reports are published to communicate the results of ESMAP’s work to the development community. Some sources cited in this report may be informal documents not readily available.
This work is a product of the staff of the World Bank with external contributions. The findings, interpretations, and conclusions expressed in this work do not necessarily reflect the views of the World Bank, its affiliated organizations, members of its board of executive directors for the countries they represent, or to ESMAP. The World Bank and ESMAP do not guarantee the accuracy of the data included in this publication and accept no responsibility whatsoever for any consequence of their use. The boundaries, colors, denominations, and other information shown on any map in this report do not imply on the part of the World Bank Group any judgment on the legal status of any territory or the endorsement of acceptance of such boundaries.
The text of this publication may be reproduced in whole or in part and in any form for educational or nonprofit uses, without special permission, provided the source is acknowledged. Requests for permission to reproduce portions for resale or commercial purposes should be sent to the ESMAP Manager at the address above. ESMAP encourages dissemination of its work and normally gives permission promptly. The ESMAP Manager would appreciate receiving a copy of the publica-tion that uses this report for its source, sent in care of the address above.
All images remain the sole property of their source and may not be used for any purpose without written permission from the source.
Cover photo: Welder in Kenya powered by mini grid electricity. © World Bank. Further permission required for reuse.
Attribution | ESMAP. 2019. Mini Grids for Half a Billion People: Market Outlook and Handbook for Decision Makers. Executive Summary. Energy Sector Management Assistance Program (ESMAP) Technical Report 014/19. Washington, DC: World Bank.
The Energy Sector Management Assistance Program (ESMAP) is a global knowledge and technical assistance program administered by the World Bank. It provides analytical and advisory services to low- and middle-income countries to increase their know-how and institutional capacity to achieve environmentally sustainable energy solutions for poverty reduction and economic growth. ESMAP is funded by Australia, Austria, Canada, ClimateWorks, Denmark, the European Commission, Finland, France, Germany, Iceland, Italy, Japan, Lithuania, Luxembourg, the Netherlands, Norway, the Rockefeller Foundation, Sweden, Switzerland, and the United Kingdom, as well as the World Bank.
ESMAP MISSION

MINI GRIDS FOR HALF A BILLION PEOPLE 1
TABLE OF CONTENTS
MINI GRIDS BY THE NUMBERS 2
MAIN FINDINGS 5
THE NEW ELECTRICITY ACCESS LANDSCAPE 11
WHERE MINI GRIDS FIT IN THE ELECTRICITY SECTOR 15 The Mini Grid System 15 Cost of a Mini Grid System 16 Status of and Outlook for Capital and Operating Expenses 21 Capital costs 21
Operating, replacement, and project development costs 22
Potential cost reductions 25
PRIVATE SECTOR AND UTILITIES SCALING DELIVERY OF ELECTRICITY SERVICES 26
CREATING THE ENVIRONMENT FOR TAKE-OFF OF MINI GRID PORTFOLIOS 30 Using Geospatial Analysis in Portfolio Planning and in National Electrification Planning 30 Regulating the Sector and Making It Easier to Do Business 32 Strengthening the Institutional Model and Framework 37 Building Human Capital and Engaging the Community 38
INCREASING ACCESS TO FINANCE 42
GLOBAL MARKET SNAPSHOT AND OUTLOOK TO 2030 47
MAKING IT HAPPEN 51 Overarching Sector Objectives and Goals 51 Stakeholder Support 53 Areas for Additional Research 54
ACKNOWLEDGMENTS 55
APPENDIX A. Introducing a Comprehensive Knowledge Package for the 10 Building Blocks Needed to Scale Up Mini Grid Deployments 56
REFERENCES 58
NOTES 60

MINI GRIDS FOR HALF A BILLION PEOPLE2
PLANNED (Mostly 3rd generation mini grids)i
1,905 India
1,217 Senegal
879 Nigeria
506 Indonesia
301 Tanzania
Where We Want to Be to Reach Universal Access by 2030490 million people served at least cost by 210,000 mini grids, mostly solar-hybrids, requiring an investment of $220 billion.
10 Building Blocks need to be addressed in countries to deploy mini grids at scale: (i) solar- hybrid technology and costing, (ii) geospatial portfolio planning, (iii) income-generating uses of electricity, (iv) community engagement, (v) local and international industry, (vi) access to finance, (vii) training and skills-building, (viii) institutional framework, (ix) workable regulations, and (x) enabling business environments.
Where We Are Today47 million people connected to 19,000 mini grids, mostly hydro and diesel-powered, at an investment cost of $28 billion. Plus: 7,500 mini grids planned, mostly in Africa, mostly solar-hybrid, connecting more than 27 million people at an investment cost of $12 billion.
MINI GRIDS BY THE NUMBERS
INSTALLED (Mostly 1st and 2nd generation mini grids)i
1,500 Africa 6,900 East Asia & Pacific 1,100 OECD & Central Asia9,300 South Asia 300 Other
INSTALLED (Mostly 1st and 2nd generation mini grids)i
4,980 Afghanistan
3,988 Myanmar
2,800 India
1,519 Nepal
1,184 China
Regional Trends from ESMAP’s database of more than 26,000 mini grid projects in 134 countries
Top 5 Countries . . . PLANNED (Mostly 3rd generation mini grids)i
4,000 Africa 900 East Asia & Pacific 200 OECD &
Central Asia2,200 South Asia 200 Other
Top 3 Private-Sector Developers by number of mini grids1. PowerGen (7 countries in Africa) > 100 mini grids 2. OMC (India) 993. Husk Power (India) 45
Top 3 Utilities by number of mini grids1. NPC-SPUG (Philippines) 7502. RAO (Russia) 5003. JIRAMA (Madagascar) 96
Private-Sector Opportunity$3.3 billion Annual profit potential for developers for mini grids deployed between 2019–2030
$4.7 billion Net profit potential across all mini grid component and service suppliers in 2030 alone
i. A detailed discussion of 1st, 2nd, and 3rd generation mini grids is provided in the “Where Mini Grids Fit in the Electricity Sector” section. Sources and underlying analysis for the figures above are presented throughout the book.
Current Financing$28 billion—Cumulative global investment in mini grids to date
$5 billion—Cumulative global investment in Africa and South Asia in mini grids to date
$1.3 billion—Development Partners committed including AFD, AfDB, DfiD, Islamic Development Bank, GIZ and WB
$660 million—World Bank commitment to mini grids in 33 countries through 2025
$259 million—Private-sector investment in mini grid developers in low-income countries since 2013
25%—Average World Bank share of total mini grid investment (government, development partners, and private sector) in client countries

MINI GRIDS FOR HALF A BILLION PEOPLE 3
Cost of Solar- Hybrid Mini Grid Today . . . $3,908/kW Total Capital Expense
$690/kWp Solar PV Module
$598/kWh Lithium-ion Batteries
$264/kW PV Inverter
Cost of Unsubsidized Solar-Hybrid Mini Grid Electricity (LCOE) . . . $0.55/kWh baseline today
$0.42/kWh with income- generating machines to achieve 40% load factor
$0.22/kWh with income- generating machines & expected 2030 costs
. . . and by 2030<$3,000/kW
$140/kWp
$62/kWh
$58/KW
. . . Compared with Utilities in Africa$0.27/kWh average across 39 utilities
2 of 39 utilities with cost-recovery tariffs
Income Generating Machinery< 12 months payback period for more than 30 income-generating machines and other equipment available today
$1.3 billion microfinance for1.1 million machines and other equipment connected to 3rd generation mini grids in 2030
3rd Generation Mini Grid Service . . . 97% UptimeTier 4–5 Access
84/100 Customer Satisfaction Rate
. . . Compared with Typical Utilities40–50% Uptime
Tier 3–4 Access41/100 Customer Satisfaction Rate
Environmental Impact by 203010–15 GW Solar PV installed by 2030
50–110 GWh Batteries mostly lithium-ion
60% Energy Savings from energy efficient appliances
1.5 billion Tons of CO2 emissions avoided
Typical 3rd Generation Mini Grid0.5–1.0 million US$ investment
200–800 Clients connected
800–4,000 People receiving electricity for the first time
50–100 kWp Solar PV installed
200–500 kWh Batteries installed
Definition of a Mini GridMini grids are electric power generation and distribution systems that provide electricity to just a few custom-ers in a remote settlement or bring power to hundreds of thousands of customers in a town or city. They can be fully isolated from the main grid or connected to it but able to intentionally isolate (“island”) themselves from the grid. Mini grids supply power to households, businesses, public institutions, and anchor clients, such as telecom towers and large agricultural processing facilities. They are designed to provide high-quality, reliable electricity. A new, third gen-eration”of mini grids has recently emerged, which are solar-hybrids, incorporate the latest technologies such as smart meters and remote monitoring systems, and are typically designed to interconnect with the main grid. The “Where Mini Grids Fit in the Electricity Sector” section provides a detailed description of 3rd generation mini grids.
To be considered in our analysis in the context of this report, a mini grid had to serve multiple customers. Electricity systems that service a single hospital, industrial facility, military base, university campus, mine, or other single entity, were therefore not considered mini grids. We also do not define mini grids in terms of size, although in our detailed analysis of mini grid costs and in our global database of over 26,000 mini grid projects, the vast majority (over 99 percent) ranged from a few kW to several MW in installed capacity.
MINI GRIDS BY THE NUMBERS, continued


MINI GRIDS FOR HALF A BILLION PEOPLE 5
MAIN FINDINGS
According to the latest Tracking SDG7: The Energy Progress Report, progress toward achieving univer-sal access to electricity has been promising (World Bank and others 2019). In 2017, the global electrification rate reached 89 percent, with the number of people without access dropping to around 840 million—compared with around 1 billion people in 2016 and 1.2 billion in 2010. Despite this progress, under current policies, an estimated 650 million people—or 8 percent of the global population—will still lack access to electricity in 2030; 9 out of 10 of them will be in Sub-Saharan Africa.
Reaching the remaining unserved people, including those connected to frail and overburdened urban grids, as well as displaced people and those in hard-to-reach locations, will require strong policies, increased private financing, and comprehensive electrification planning. Tracking SDG7: The Energy Progress Report shows that countries with a comprehensive approach to planning—which consists of main grid extensions, mini grids, and solar home systems—have achieved the fastest results in electricity access (World Bank and others 2019). Countries with the fastest gains in electrification between 2010 and 2018 include Ban-gladesh, Cambodia, India, Kenya, Myanmar, Nepal, Rwanda, and Tanzania.
Compared with the main grid and solar home systems, mini grids are a more viable solution for off-grid areas with high population density and demand. Extending the main grid to serve remote communities that consume a limited number of kilowatt-hours (kWh) per month is prohibitively costly in most cases. Meanwhile, solar home systems are ideal for areas with low population density and low demand. Mini grids are generally the most economically viable option for servicing areas that are too expensive for the main grid to reach in a timely manner but have high enough demand and population density to support commercial viability.
At the same time, mini grids have grown from a niche solution to being deployed widely. The World Bank’s Energy Sector Management Assistance Program (ESMAP) has developed a database of more than 26,000 installed and planned mini grid projects around the world. Globally, at least 19,000 mini grids are already installed in 134 countries and territories, representing a total investment of $28 billion, providing electricity to around 47 million people. Most of these mini grids are diesel-fueled, followed by hydro-powered and solar-hybrid systems. Between 2014 and 2018, twice as many solar-hybrid mini grids were built compared with the period between 2009 and 2013. In Africa and South Asia only, however, the investment figure drops to $5 billion for 11,000 mini grids covering 31 million people. Another 7,500+ mini grids are planned to go online over the next couple of years, mostly in Africa, connecting more than 27 million people for an investment cost of $12 billion. These planned systems show a significant shift from diesel to solar-hybrid systems using the latest technologies.
Asia has the most mini grids installed, but Africa has the largest share of planned mini grids. The ESMAP database of mini grid projects around the world indicates that Asia—including South Asia, East Asia, and the Pacific—has a combined total of more than 16,000 installed mini grids, representing 85 percent of the global total. The majority (61 percent) of the installed mini grids in Asia are in just three countries: Afghanistan (4,980), Myanmar (3,988), and India (2,800). Estimates show, however, that mini grid deployment will grow pre-dominantly in Africa. Currently, more than 4,000 mini grids are being planned for development in Africa, repre-

MINI GRIDS FOR HALF A BILLION PEOPLE6
senting more than half (54 percent) of the total 7,507 planned mini grids globally. More than half of the planned mini grids in Africa will be developed in Senegal (1,217) and Nigeria (879).1
Over the past decade, mini grid capital costs have been declining and are expected to continue a downward trend through 2030. At the same time, the quality of service has increased dramatically. The costs of key mini grid components, such as solar panels, inverters, batteries, and smart meters, have decreased by 62–85 percent as a result of innovations and economies of scale in utility-scale solar projects, the booming rooftop solar industry, and the growing electric vehicle market. A detailed ESMAP survey of mini grids in Africa and Asia presented in this book has shown how this has brought capital costs down from more than $8,000 per kilowatt of firm power output (kWfirm)ii in 2010 to $3,900/kWfirm in 2018. ESMAP analysis further indicates that if costs continue to decline—and optimistic though not naive assumptions indicate that this will be the case—the upfront investment cost of solar and solar-hybrid mini grids could drop below $3,000/kWfirm by 2030. Other mini grids based on renewable energy have seen cost reductions as well, however not as dramatically as the
solar-battery–based systems. Furthermore, with the market potential for these solar systems signifi-cantly less restricted by the location of the available resources—such as hydro or wind—it is expected that most new mini grids will be based on solar.
As a result of declining capital costs and increased load factor, the per-kWh cost of mini grid electric-ity is on pace to decrease by two-thirds by 2030. ESMAP modeling presented in this book indicates that a well-designed solar-battery-diesel hybrid mini grid serving more than 1,500 people has a levelized cost of energy (LCOE) of about $0.55/kWh when it serves household customers, giving it a load factor of about 22 percent. As the cost of efficient income-generating machines and equipment decreases and developers increase demand for income-generating uses of electricity during the daytime, mini grids can increase their load factor to more than 40 percent. When combined with reducing soft costs by using remote-controlled manage-ment systems and smart meters as well as geospatial portfolio planning tools, which reduce pre-site preparation costs by an order of magnitude from around $30,000 per site to $2,300, the LCOE of these “third-generation” mini grids can be reduced by up to 25 percent ($0.41/kWh) by 2020. If component costs also decline as expected, ESMAP analysis suggests that the LCOE could fall by 60–70 percent to around $0.20/kWh by 2030.
Leading developers are now leveraging transformative technologies and economic trends to build third-generation mini grids with the potential to provide high-quality, affordable electricity at unprec-edented scale. A typical third-generation mini grid consists of a solar-hybrid generation system that includes solar panels, batteries, charge controllers, inverters, and diesel backup generators. These mini grids typically use smart, remotely controlled electricity meters that allow customers to prepay for their electricity in a pay-as-you-go (PAYG) model. They use remote monitoring systems to manage the status of the system in real time from a distance. They have also integrated partnership programs throughout the lifecycle of the mini grid that stimulate the local economic development of their clients, and do this in collaboration with suppliers of ener-gy-efficient appliances as well as microfinance providers. Research shows that the uptimes of third-generation mini grids often exceed 97 percent—less than 2 weeks of scheduled maintenance per year. This performance is significantly better than previous generations of mini grids and most utilities across Sub-Saharan Africa.
The combination of falling costs, new technologies, and favorable enabling environments has made third-generation mini grids an option to connect 490 million people, complementing grid extension and solar home systems to reach universal electrification by 2030. Factoring in the current deficit of 840 million
ii. Firm power output means that the peak load for which the system was designed can be supplied by the mini grid any second of the day throughout the year. In solar-hybrid mini grids, firm power output is the sum of the generator and battery inverter kW capacity. For a more detailed description of this metric and the rationale for using it, please see chapter 3 of the main book.
Falling costs, new technologies and favorable enabling environments have made mini grids an option to connect 490 million people.

MINI GRIDS FOR HALF A BILLION PEOPLE 7
people without access to electricity, population growth, and current approaches to electrification, around 1.2 billion people would need to be connected to electricity by 2030. ESMAP analysis, building on estimates from the 2019 Tracking SDG7: The Energy Progress Report (World Bank and others 2019) and the International Energy Agency (IEA 2017), shows that 490 million people could be connected to mini grids by 2030. The same analysis shows that this connectivity is complemented by main grid extensions and solar home systems.
Third-generation mini grids can promote inclusive growth in remote rural areas through income-gener-ating uses of electricity to support economic activities. Modern mini grids are designed to enable payback periods of less than 12 months for more than 30 income-generating machines and other equipment available today. As such, they result in win-win scenarios that improve the financial viability of developers as well as create jobs and enhance livelihoods in communities. However, approximately $1.3 billion in microfinance for 1.1 million appliances is needed, assuming five productive-use appliances per mini grid for 210,000 mini grids at an average cost of $1,200 per appliance.
Third-generation mini grids also support electric cooking, an often-neglected application of mini grid electricity that also offers an opportunity to capture an existing household expenditure. Households switching to mini grid–powered electric cooking save money compared with traditional methods: cooking with a mini grid–powered induction stove costs $0.18–$0.98 per person per day, often making it cheaper than traditional wood-fired and charcoal-fired stoves, which can cost up to $0.37 and $0.45 per person per day, respectively (Couture and others 2016). Electric cooking also presents developers with a valuable opportunity to increase their load factor and boost their revenue. While peak loading is a major issue for electric cooking on mini grids, a variety of time-shifting techniques can decouple electricity demand from supply, such as household battery storage. ESMAP is collaborating with Loughborough University and its partners on a new United Kingdom Department for International Development (DfID)-funded Modern Energy Cooking Services program that aims to take advantage of the opportunities for, and address the challenges of, mini grid–powered electric cooking.
Third-generation solar mini grids can result in significant positive environmental impacts. It is estimated that by 2030, 10–15 gigawatts (GW) of solar photovoltaic (PV) could be installed using 50–110 gigawatt-hours (GWh) of mostly lithium-ion batteries. In addition, these systems are designed based on introducing energy- efficient appliances when the end users acquire their first electric machinery, which require 60 percent less energy compared with the same appliances five years ago. These combined efforts would result in 1.5 billion tons of carbon dioxide (CO2) emissions avoided.
Connecting 490 million people to mini grids by 2030 will require more than 210,000 mini grids and almost $220 billion in investment. While investment in mini grids has been increasing over the past decade, it is not enough to enable a significant scale-up to close the electricity access gap by 2030. ESMAP research presented in this book shows that reach-
ing universal access to electricity will require a two-order-of-magnitude increase in the number of mini grids deployed in each of the top-20 electricity access-deficit countries, on a per-country, per-year basis: from 10–50 deployed annually today, to more than 1,500 deployed in each of the highest energy access deficit countries annually by 2030.
The mini grid industry offers significant profit potential to mini grid developers and suppliers. In well- established markets where a combination of private and public funding is available, ESMAP analysis presented in this book indicates that the profit potential for private-sector companies across the third-generation mini grid supply chain is expected to increase dramatically over the next decade, approaching $25 billion of cumula-tive profits by 2030 based on today’s corporate margins, with the largest proportions attributable to solar and storage providers. This estimated profit margin was derived by analyzing component cost projections from
Connecting half a billion people to mini grids by 2030 requires more than 210,000 mini grids and almost $220 billion in investments.

8
reputable market research firms, estimating total equipment spending for the forecasted number of mini grids, and using audited financial statements from half a dozen mini grid companies. The estimated profit implies that more value may be at stake as companies use economies of scale to drive down costs with the expanding mini grid sector. For developers, ESMAP projects an annual profit in excess of $3 billion by 2030, which was derived by assessing current and projected tariffs and the levelized costs of electricity, as well as analyzing the audited financial statements. For the private sector to accelerate its investment in mini grids, sufficient profit margin is needed along the full value chain.
As a result of the profit potential for mini grid developers and suppliers, significant opportunities for partnerships between local and international firms exist across the mini grid industry value chain. Local entities are best positioned to focus on the aspects of the value chain that require knowledge of local rules and regulations or require coordination with the customer being served by the mini grid; international companies are best suited to perform tasks that can be replicated across geographic boundaries. Partnerships between local and international firms can stimulate value creation, as borne out by recent partnership agreements between Caterpillar and PowerHive in Africa, ABB and Husk Power in India, Mitsui and OMC in India, ENGIE and Man-dalay Yoma Energy in Myanmar, and Schneider Electric and both EM-ONE and GVE in Nigeria.
At the same time, experience shows that reaching universal access requires public funding—even in private-sector–led programs—to overcome the gap between the cost of reaching the remote areas and the affordability level of these clients. Governments and development partners recognize this and are developing comprehensive support packages that include subsidies to attract private investment. The packages provide an incentive for delivering electricity services to the end user, while at the same time allowing for reasonable profit margin to attract the private sector to enter the market.
Performance-based grants for mini grids are often less than the implicit or explicit subsidy that the main grid receives. A performance-based grant equivalent to 40 percent of a developer’s connection costs would enable a developer to charge customers a tariff that was 11–22 percent less than its unsubsidized LCOE. Meanwhile, a survey of 39 national utility companies in Africa showed that utilities received explicit or implicit subsidies that enabled them to sell electricity at prices that were on average 41 percent—and up to 80 percent— less than the utilities’ unsubsidized LCOE (Trimble and others, 2014; Kojima and Trimble, 2016). This would indi-cate that many national utilities in Africa receive implicit subsidies that are more than 40 percent of their connection costs. With national utility connection costs often exceeding $2,000 in rural areas (Trimble and others 2014; Blimpo and Cosgrove-Davies 2019), the implicit subsidy they receive is therefore likely greater than
$800 per connection. Meanwhile, ESMAP research found that mini grid connection costs ranged from around $1,000 or less to just over $2,100, so a performance-based grant equivalent to 40 percent of the connection cost would represent about $400–$900 per connection.
To support the deployment of mini grids as one of the key strategies to reach universal access to electricity, development partners, including the World Bank, have committed more than $1.3 billion to mini grids over the next several years. This investment is just for mini grids and does not include funding for technical assistance and research. Six organizations have investment commitments for mini grids that total more than $100 million: Agence Française de Développement (AFD); the African Development Bank (AfDB); DfID; Deutsche Gesellschaft für Internationale Zusammenarbeit (GIZ); the Islamic Development Bank; and the World Bank.
The World Bank’s investment commitment in mini grids spans 37 projects in 33 countries, with a total commitment of more than $660 million. Of these projects, 29 have been approved by the World Bank’s board, totaling $636 million across 25 countries. This investment is expected to leverage an additional $1.1
Performance-based grants for mini grids are often less than the implicit or explicit subsidy that the main grid receives.
MINI GRIDS FOR HALF A BILLION PEOPLE

MINI GRIDS FOR HALF A BILLION PEOPLE 9
billion in cofinancing from the private sector, governments, and development partners and to catalyze mini grid development at scale. In addition, in each of the 33 countries in its portfolio, the World Bank’s financial commit-ment to mini grids represents on average 25 percent of all current and planned investment in mini grids from governments, development partners, and the private sector. ESMAP also established a Global Facility on Mini Grids (GFMG), with core support from the government of the United Kingdom, to advance this portfolio and further mainstream mini grid programs into World Bank operations and national electrification programs, as well as to support the development and dissemination of knowledge and learning on mini grids. The GFMG also hosts annual Action Learning Events to share and exchange the latest developments across the industry.
National utilities can benefit from third-generation mini grids, as they can pave the way for more financially viable future grid expansion. Third-generation mini grids are typically designed to interconnect with the main grid, which allows for load balancing as well as transmission and distribution support at the end of the line. They also promote income-generating uses of electricity and create local economic development. As a result, once the main grid arrives, significant demand for electricity already exists, and customers have a greater ability to pay, increas-ing the economic viability of the main grid’s extension. New regulations give developers options for what happens when the main grid arrives, while cost reductions in mini grid components enable developers to build grid-intercon-
nection–ready systems while keeping tariffs at affordable levels. Even though these regulations exist, they are adopted in only a handful of countries so far. Nigeria is one of the frontier countries; the regulator has adopted one of the most comprehensive sets of mini grid regulations in Africa covering issues like licensing, retail tariff setting, and what happens when the main grid arrives.
Hybridizing existing diesel-powered mini grids owned by national utilities or the private sector represents an additional multibillion-dollar market opportunity. ESMAP estimates the installed capacity of the theoretical diesel mini grid market at 1.6–4.6 GW. Using an estimate of $5,100/kW for the investment costs of hybridizing diesel-fired mini grids, based on the actual costs of hybridizing diesel-fired mini grids in Kenya (Carbon Africa Limited and others 2015), the global market opportunity for hybridizing diesel mini grids is $8–$23 billion.
Third-generation mini grids can also promote resilience in the face of increasing disruptions from climate change and natural disasters by providing reliable electricity to critical infrastructure as well as households and businesses. In Puerto Rico, for example, hospitals, schools, and municipal buildings like police stations—as well as 1.5 million people—lost power for months following Hurricane Maria. Puerto Rican authorities quickly developed a strategy to build solar-based mini grids around the country, in an effort to resup-ply electricity to critical infrastructure, while at the same time building a more resilient power sector. The island’s new integrated resource plan (IRP) divides the previously centralized grid into eight mini grids, which will bring online almost 1.4 GW of solar generation and 920 megawatts (MW) of battery storage between 2019 and 2022. The IRP specifically describes the business case for transitioning to mini grids, stating that it is the least-cost way to achieve resilience against hurricanes, reach renewable energy targets, and provide high-quality customer service (Walton 2019). Globally, ESMAP estimates that the market for mini grids developed as a way to increase resilience could exceed 5,000 installed and planned mini grids, mostly in islands and high-income countries, connecting more than 10 million people, at an investment cost of around $10 billion.
For countries to advance the mini grid sector, 10 building blocks need to be in place to support five key market drivers. As each country has its unique set-up, the 10 building blocks will be designed in country-specific ways. The World Bank’s experience over the past decade working with mini grid developers, government officials, investors, experts, and donor partners helped identify these 10 building blocks: (i) solar-hybrid technology and costing, (ii) geospatial portfolio planning, (iii) income-generating uses of electricity, (iv) community engagement, (v) local and international industry, (vi) access to finance, (vii) training and skills building, (viii) institutional frame-work, (ix) workable regulations, and (x) enabling business environments. These 10 building blocks need to be in
National utilities can benefit from third-generation mini grids, as they can pave the way for more financially viable future grid expansion.

MINI GRIDS FOR HALF A BILLION PEOPLE10
place to support five key market drivers that will propel the sector to scale: (i) increasing the pace of deployment through a portfolio approach to mini grid development; (ii) providing superior-quality service; (iii) leveraging devel-opment partner and government funds to crowd in private-sector finance; (iv) establishing enabling business environments in key access-deficit countries; and (v) reducing the cost of solar-hybrid mini grids. Each of the 10 building blocks is discussed in more detail in each chapter of the comprehensive report to help decision makers and stakeholders along the entire chain of the mini grid industry craft appropriate solutions.
This report calls for progress on each of the five market drivers. In consultation with the mini grid industry, development partners and other stakeholders, progress indicators have been defined of which the main ones are the following:
1. increasing the pace of deployment through a portfolio approach to mini grid development to around 1,500 projects per key access-deficit country per year by 2030, as well as aiming to reduce the time it takes to build a mini grid to five weeks in 2030
2. providing superior-quality service of 97 percent uptime by 2020, as well as increasing the industrywide average load factor of 3rd-generation mini grids to 45 percent
3. establishing enabling mini grid business environments in key access-deficit countries, with the aim of raising the average RISE (Regulatory Indicators for Sustainable Energy) score in the top-20 electricity access-deficit countries to 80 out of 1002
4. leveraging development partner funding to crowd in private-sector finance, attracting almost $220 billion of investment from donors, governments, and the private sector between 2019 and 2030
5. reducing the cost of solar-hybrid mini grids (which the other four market drivers will also support) to $0.20/kWh by 2030
The report also acknowledges the unprecedented levels of commitment required from governments, development partners, the mini grid industry, and regulators to reach these targets. It calls for action by each of these stakeholder groups, as
well as recently established partnerships like the African Minigrid Developers Association (AMDA) and the Green Mini Grid initiative managed and implemented by DfID, AfDB, and the World Bank. Key recommendations are for
• policymakers to leverage the latest geospatial analysis technology to develop national electrification plans that can guide investment in mini grids, main grid extension, and solar home systems, as well as develop initiatives that promote productive uses of electricity and build human capital
• development partners to work with government counterparts and the private sector to create enabling environments for mini grids through investments in actual portfolios of projects and technical assistance for developing workable regulations and strengthening institutions
• regulators to adopt an evolving, light-handed approach for a maturing mini grid sector, providing at each stage of development clear guidance on market entry, retail tariffs, service standards, technical standards, and arrival of the main grid
• the mini grid industry and its associations to work toward increasing the pace of deployment, retaining superior-quality service delivery of third-generation mini grids, and reducing the cost of these systems through innovation to reach a value proposition that is affordable to the end users
• national utilities to adopt an openness to partnerships with the third-generation mini grid industry on the basis that the systems are grid-integration ready, which can provide for more financially viable grid expansion programs for the utility in the long run
Reducing the cost of solar-hybrid mini grids to $0.20/kWh by 2030 is a key objective.

MINI GRIDS FOR HALF A BILLION PEOPLE
THE NEW ELECTRICITY ACCESS LANDSCAPE
Reaching universal access to electricity is a priority for many governments. As a result, significant progress was made over the past decade. Governments of 17 of the top-20 electricity access-deficit coun-tries set clear targets to achieve or approach universal access by 2030. Between 2000 and 2017, the number of people without access to electricity fell from more than 1.4 billion to fewer than 900 million; thus, more than 89 percent of the world’s population now has access to some level of electricity service (World Bank and others 2019).3 The pace of electrification also increased, rising from 100 million people a year in 2000–10 to more than 150 million a year in 2015–17. Between 2010 and 2017, 45 countries reached universal access to electrification (World Bank and others 2019). In Africa, for the first time in history, access to electricity is outpacing population growth, although this progress has been highly uneven across the region, both by country and across urban and rural areas (World Bank and others 2019).4
Countries that pursue a comprehensive approach to electrification through main grid extension, mini grids, and solar home systems achieved the fastest gains. In most of the countries with the fastest gains in electrification between 2010 and 2018—including Bangladesh, Cambodia, Kenya, Myanmar, Nepal, Rwanda, and Tanzania—national electrification strategies leveraged a combination of main grid, mini grid, and solar home system investments. Nigeria is another recent example of a country that has developed a comprehensive national electrification strategy and implementation plan.
This comprehensive approach is the only way to connect the 1.2 billion people that will need access to electricity by 2030. If the current global pace of electrification, current policies, and current population trends continues, about 570 million people will gain access to electricity by 2030, leaving as many as 650 million people without access to any source of electricity. The total number of people requiring access to electricity by 2030 is therefore estimated to be 1.22 billion (World Bank and others 2019).
In parallel, governments and development partners are developing financial support packages as part of their comprehensive approach to electrification. Universal electrification efforts in high-income countries have historically required public funding. The same holds true for electricity access-deficit countries today, particularly since most people without access have low disposable incomes and live in rural areas. As a result, governments and development partners are putting together support packages for all three electrification pathways—main grid extensions, solar home systems, and mini grids. Comprehensive support packages for mini grids consist of subsidies—increasingly in the form of performance-based grants—as well as debt facili-tation and risk-sharing mechanisms, alongside private-sector debt and equity. The objective of these support packages is to increase the affordability of mini grid electricity and incentivize private-sector investment, while ensuring that public funds are deployed appropriately and efficiently. For example, performance-based grants are increasingly favored by private-sector developers and investors. ESMAP analysis presented in this report shows that these subsidies can reduce the cost of electricity by almost 50 percent, but at the same time can dampen the effect of productive-use programs and put additional pressure on developers to secure significant upfront funding.
11
MINI GRIDS FOR HALF A BILLION PEOPLE12
Mini grids are not a new phenomenon: nearly all current centralized electricity grid systems started with isolated mini grids, which gradually interconnected. These first mini grids were pivotal to the early develop-ment and industrialization of most modern economies, including Brazil, China, Denmark, Italy, the Netherlands, Spain, Sweden, the United Kingdom, and the United States. Mini grid systems introduced in the late 19th and early 20th centuries can be described as the first generation of mini grids. They faced many of the same policy, regulatory, and operational challenges experienced by mini grids in developing countries in Asia and Sub- Saharan Africa today.
For more information on the historical role of mini grids in national power systems, see chapter 1 of the book (“Why Mini Grids, and Why Now”) and “Retrospective Analysis of the Role of Isolated and Mini Grids in Power System Development” in volume 3 (Country Case Studies).
A second generation of mini grids is widespread in many low-income countries today. These systems are typically small and isolated, powered by diesel or hydro, and built by local communities or entrepreneurs to pro-vide access to electricity to households, primarily in rural areas that have not yet been reached by the main grid. Tens of thousands of these systems were built, starting in the 1980s and ramping up through the 1990s and early 2000s. The second generation of mini grids provided important lessons about technical design, productive uses, economies of scale, financial viability, and regulatory frameworks that have been incorporated into a third generation of solar-hybrid mini grids that are owned and operated by the private sector. Second-generation mini grids also yielded lessons about the importance of productive uses for financial viability and the need to reduce the risk of stranded assets once the main grid arrives (for a detailed discussion of what happened when the main grid arrived in Cambodia, Indonesia, and Sri Lanka, see Tenenbaum, Greacen, and Vaghela 2018).
Over the past few years, a third generation of mini grids has emerged. These mini grids—mostly solar PV hybrids—are owned and operated by private companies that leverage transformative technologies and innova-tive strategies to build portfolios of mini grids instead of one-off projects. The typical third-generation mini grid is grid-interconnection ready; uses remote management systems, prepay smart meters, and the latest solar-hybrid technologies; and incorporates energy-efficient appliances for productive uses of electricity into its business model. Third-generation mini grids operate in more favorable business environments, taking advantage of cost reductions in the latest mini grid component technologies and regulations that have been developed specifi-cally for private sector-investment. Developers of third-generation mini grids are joining industry associations to speak with one voice and drive policies and regulations that favor private-sector investment.
Experience in electricity access-deficit countries over the past five decades has shown that the main grid is typically unreliable. Across Sub-Saharan Africa, more than half of households connected to the main grid reported receiving electricity less than half of the time (Blimpo and Cosgrove-Davies 2019). In most elec-tricity access-deficit countries, the main grid usually provides only Tier 3 or Tier 4 electricity.5 The main reason for unreliability in the region is the challenges with the national transmission and distribution networks, rather than with the generation systems. Given the region’s size and frequently very low population densities, the vast distances between rural economic hubs in many countries prove to be prohibitively expensive to connect to centralized systems.
In addition, research has shown that most utilities in Africa are not financially solvent. Most national util-ities in Sub-Saharan Africa sell electricity at a loss, as the full cost of connecting residential customers (typically $800–$2,000 but often significantly higher for rural areas) is too expensive for most households (Trimble and others 2014), and this cost is frequently subsidized by the national government. In addition, the amounts that the rural, remote, and poorest groups of the population are able to pay for electricity generally do not reach the cost-recovery threshold for national utility companies, and the tariffs charged to these customer segments are often cross-subsidized across the utilities’ large customer bases. The average fully cost-reflective tariff for 39

MINI GRIDS FOR HALF A BILLION PEOPLE 13
utilities across Sub-Saharan Africa is $0.27/kWh; 25 percent of utilities require a cost-reflective tariff of more than $0.40/kWh, about half require a tariff of $0.20–$0.40/kWh, and 25 percent require less than $0.20/kWh. Only 2 of the 39 utilities (Seychelles and Uganda) charged tariffs that enabled them to recover their costs (Trim-ble and others 2014; Kojima and Trimble 2016). Mini grids are, therefore, often the least-cost, best solution to connect communities where the cost of extending the main grid is simply too expensive.
The penetration of off-grid solar—including solar lanterns, pico PV systems, and solar home systems—grew rapidly over the last two decades, with more than 100 million systems sold in Africa alone. This market growth has been the result of increasing consumer demand for electricity services in homes, as well as the pace of innovations in telecommunications, which enabled the rise of the PAYG model for electricity access. Significant consumer data that emerged from the mobile money and PAYG revolution provided lenders and investors with more confidence with regard to the credit risk of the end users, enabling them to raise more capital and consequently expand their services. Today, such solar home systems, depending on their size, can typically cost $30–$200 and provide electricity service at Tiers 1 and 2. Some larger, component-based systems are also in use (GOGLA 2019).
Mini grids have characteristics of both utilities and solar home system companies, creating both chal-lenges and opportunities for their large-scale deployment. Like the main grid, mini grids have sunk cost assets, are subject to regulatory oversight, and have the possibility of providing 24/7 electricity and supporting productive loads. Mini grids also have features of the solar home system industry, with the possibility for very rapid expansion when the value proposition is right for the market. Both utilities and solar home system com-panies are entering into the mini grid space for economic reasons, in ways that mirror their respective busi-ness models, with utility mini grids operating as rural distribution networks and solar home system companies interconnecting individual stand-alone systems. This trend would lead to modest growth in the deployments of mini grids, as the two sectors develop mini grids at the margins of their current target markets. If, however, the unique position of mini grids can build on the strengths of both sectors—24/7 electricity from the utility sector and agility and customer service from solar home system companies—mini grids will be able to bring affordable access to high-quality electricity to millions of people at an accelerated pace.
Scaling up mini grids does not mean scaling back the main grid. On the contrary, third-generation mini grids enhance the economic viability of expanding the main grid. Second-generation diesel-powered mini grids were expensive, highly inefficient, polluting, and dangerous, and were not managed as businesses. The fact that they existed showed that some customers were willing to pay for electricity and suggested that demand would develop once the main grid arrived. Most customers used very little electricity, however, which meant that the main grid would sustain ongoing financial losses when it reached the mini grid’s service area. Third-genera-tion mini grids flip this narrative. By designing the system from the beginning to interconnect with the main grid and by promoting income-generating uses of electricity through effective community engagement and training, third-generation mini grids can provide early economic growth, so that significant load already exists by the time the main grid arrives and customers have a greater ability to pay. New regulatory frameworks give developers viable options for what happens when the main grid arrives, and reductions in the cost of components enable developers to build grid-interconnection–ready systems while still keeping tariffs affordable.
Supporting third-generation mini grids therefore goes hand in hand with strengthening the utility sector. Interconnecting third-generation mini grids with the main grid as part of a national electrification strategy can increase the resource diversity and overall resilience and efficiency of the power system when interconnection is properly planned and executed. But this presents an operational challenge, requiring utilities to be able to intro-duce the practical technical functions to support power system operations and planning with multiple mini grids connected to the distribution grid, such as short-term and long-term forecasting and other complex procedures. This means that mini grid development—as a viable strategy for helping deliver universal access to electricity—

MINI GRIDS FOR HALF A BILLION PEOPLE14
entails also significant strengthening of the utility sector, so that it can accommodate interconnecting mini grids with the main grid. However, many electricity access-deficit countries lack clear procedures for integrating mini grids into the utility’s system planning and operations. As a result, it will also be important for national electrifi-cation plans to accommodate scenarios in which many or at least some mini grids will remain isolated from the main grid or connected only to other mini grids.
At the same time, third-generation mini grids challenge the existing centralized approach to electricity service delivery. The cost of mini grid electricity is expected to decline significantly over the next decade, to levels that make it competitive with main grid electricity in a large number of electricity access-deficit countries (more discussion on this point is provided in the next section). In addition, third-generation mini grids provide higher-quality service—in terms of reliability, availability, and customer service—than many national utilities in low-income countries. As mini grid developers establish strong reputations in their respective countries of oper-ation, demand for their services in urban and peri-urban areas is likely to increase, incentivizing developers to target these customers as well. This will put pressure on national utility companies to evolve and improve their service offering.
To capitalize on the opportunities that third-generation mini grids present and contribute to the acceler-ation of their deployment as a strategy to reach universal access to electricity by 2030, ESMAP created the GFMG. Housed within ESMAP, the GFMG stands on two pillars: providing operational support to World Bank projects that have a mini grid component, and generating and disseminating actionable knowledge about mini grids to the broader mini grid industry globally. This report is part of the GFMG’s knowledge development activities, which include hosting annual learning events that bring together hundreds of mini grid industry stake-holders and producing case studies and frontier research reports. A number of these reports and case studies informed chapters in this book, including the six country case studies, which are available in volume 3 of the book (Country Case Studies).
The book synthesized by this Executive Summary documents the knowledge the World Bank has gained through close collaborations over the past decade with mini grid developers, electricity regula-tors, investors, policy makers, ministries, rural electrification agencies, experts, and donor partners. It serves as a reference guide for decision makers, to be consulted when key decisions about mini grids need to be made at the project, portfolio, or program level.
This Executive Summary encapsulates the book’s main themes. It answers two fundamental questions that individuals, governments, and organizations face when making decisions about strategies, investments, policies, and regulations for electrification:
• Why mini grids, and why now?
• How can mini grid deployment be scaled up to connect half a billion people by 2030?

MINI GRIDS FOR HALF A BILLION PEOPLE 15
WHERE MINI GRIDS FIT IN THE ELECTRICITY SECTOR
THE MINI GRID SYSTEM
Third-generation mini grids consist of specialized components for the generation, distribution, meter-ing, and consumption of electricity. A typical third-generation mini grid consists of a solar-hybrid generation system that includes solar panels, batteries, charge controllers, inverters, and diesel backup generators. The distribution network consists of poles and low-voltage wires; larger mini grids sometimes also have medium-volt-age systems. Third-generation mini grids often use smart meters that provide both prepaid payment options for consumers and real-time, granular information about energy consumption patterns and system performance. They also use remote monitoring systems, which allows operators to identify technical issues before they affect energy services and rectify problems quickly and inexpensively, thus improving the quality of customer service. Many developers of third-generation mini grids encourage and incentivize customers to use efficient appliances for household uses as well as efficient machines and equipment for income-generating activities (figure ES.1), and provide or facilitate access to financing options to help customers overcome any barriers presented by upfront costs.
15
PV array Chargecontroller
Battery block
AC/DCinverter
Generator Distributionline
Service drop
AC bus
Poletop hardware
Pole
Smart meter
Smart meter
Residential
AC load in village
Solar-hybrid generation system Distribution systemSmart meters Efficient productive loads
AC appliances
FIGURE ES.1 Features of a third-generation mini grid system
Note: AC = alternating current; DC = direct current; PV = photovoltaic.

MINI GRIDS FOR HALF A BILLION PEOPLE16
Third-generation mini grid systems encompass a comprehensive set of the latest hardware and soft-ware technologies. They leverage transformative technologies to provide high-quality, affordable electricity and growth at scale. These systems
• use the latest mini grid component technologies, which are declining in cost
• introduce and encourage the use of energy-efficient appliances, which can reduce the required installed capacity of a mini grid by 60 percent or more
• enable productive uses of electricity, which reduces kWh unit costs, increases profitability, and promotes local economic development
• provide superior-quality service, often above 97 percent uptime, to satisfy customer demands and build cred-ibility for the product and industry
• use remote-controlled energy management systems, Web-based data platforms, and prepay smart meters to reduce operating costs and increase revenue collection
• use innovative solutions, such as video-exchange hubs, to engage communities that are geographically dispersed early in the sensitization processes to accelerate early uptake of electricity consumption and have the communities’ buy-in of the electricity pricing strategy
• follow standardized designs for components and processes to lower manufacturing, installation, and operat-ing costs
• are typically designed to interconnect with the main grid, to mitigate investment risk when the main grid arrives
• are built as part of a developer’s portfolio instead of as a one-off project, aided by geospatial analysis, to achieve economies of scale and attract investment
While third-generation mini grids are not necessarily built to main grid standards, the findings in this report show that the majority of future mini grids are expected to be built to interconnect with the main grid, in order to align more closely with the country-level and utility expansion priorities and fit into an integrated national electrification plan.
For more information on the characteristics of third-generation mini grid systems, see chapter 1 of the book (“Why Mini Grids, and Why Now?”).
COST OF A MINI GRID SYSTEM
ESMAP analyzed the detailed characteristics of selected solar and solar-hybrid mini grids in Africa and Asia to study the cost of mini grid electricity under different scenarios. The LCOE combines a mini grid’s capital and operating costs into a single cost per unit of energy.6 It considers initial costs (such as equipment and installation costs), operations cost (such as staff and fuel costs), and equipment replacement over the lifetime of the mini grid. The LCOE is equivalent to the minimum average tariff at which electricity must be sold to cover project costs. It is typically expressed in currency per kWh. It is important to acknowledge here that dif-ferent stakeholders will have different approaches to calculating LCOE—for example, in the discount rate, which costs to include in operations and maintenance (O&M), and interest rates—but at the same time LCOE provides a valuable and appropriate benchmark for assessing the cost of mini grid electricity.
The LCOE in the mini grids analyzed ranged from $0.55 to $0.85 per kWh, with a median cost of $0.66, using a 22 percent load factor. The mini grid with the lowest estimated LCOE is from Bangladesh and is one of the largest in the sample, in terms of both the number of customers (1,099) and firm alternating current (AC) output (294 kWfirm). These kinds of systems—and significantly larger systems, which provide electricity to large villages and towns—are expected to gain more traction over the coming years.

MINI GRIDS FOR HALF A BILLION PEOPLE 17
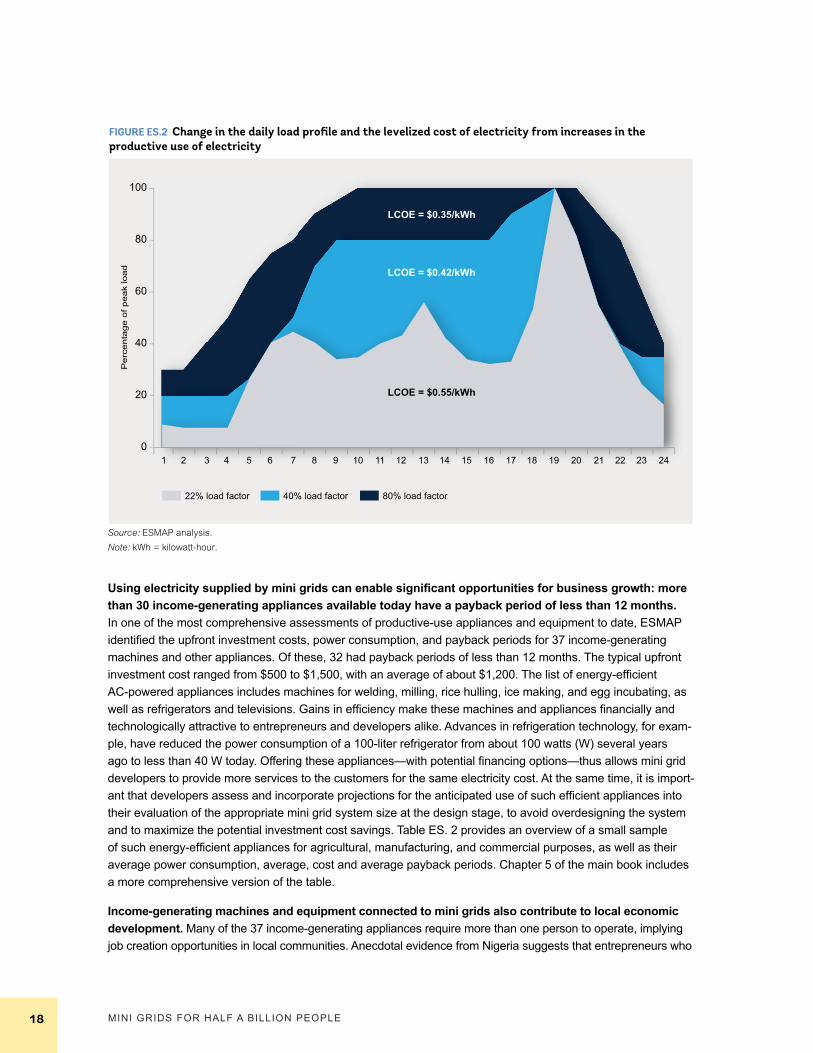
Increasing income-generating uses of electricity can decrease the LCOE by 25 percent or more. The baseline load factor for mini grids of 22 percent reflects low lev-els of income-generating uses of electricity (table ES.1).iii Income-generating loads, such as agricultural milling, generally occur during daytime hours, adding diversity to residential loads, which occur primarily in the evening. Mini grids in this analysis experienced significant reductions in the LCOE when off-peak load was added,
increasing the energy consumed but not increasing peak load. Where a 40 percent load factor was achieved through significant daytime consumption by local businesses and commercial clients, the LCOE fell by 25 per-cent compared with the base case. For an 80 percent load factor—achieved by inclusion of a water pump with storage tank and an anchor load, such as a telecom tower, for example—LCOE reduction was 37 percent.
ESMAP analysis indicates that the combination of increased productive uses and decreased compo-nent costs resulting from economies of scale and sectorwide technology cost trends can bring mini grid LCOE down to $0.22/kWh by 2030. Increasing load factor alone generally means that a hybrid mini grid ends up burning more diesel fuel. If the mini grid design can be optimized to accommodate higher daytime productive use loads and future reduced cost of components, then further reductions in LCOE are possible. The combination of expected component cost reductions through enhanced scale and an increase in the load factor from 22 percent to 40 percent through productive-use loads could reduce costs by as much as 60 per-cent compared with LCOEs under current capital expense (CAPEX)/operating expense (OPEX) cost scenarios and baseline load residential scenarios. These changes reduce the LCOE from $0.55/kWh to $0.22/kWh for the same Bangladesh mini grid example.
Increasing productive uses of mini grid electricity creates a win-win-win-win scenario for mini grid develop- ers, rural entrepreneurs, communities, and national utilities over time. It reduces the LCOE, which increases the mini grid developer’s margins and therefore financial viability. Entrepreneurs and small businesses benefit from switching from expensive diesel generators to affordable mini grid electricity. Communities benefit from the creation of new jobs and increased economic activity. The growth of rural economies also benefits national utilities once interconnection to the main grid is considered, because it increases customers’ ability to pay higher tariffs. Figure ES.2 illustrates what increased productive uses looks like in terms of demand for mini grid electricity.
Switching to mini grid electricity makes business sense for entrepreneurs: power outages and lack of reliable supply can have a tangible impact on a business’s revenues. A recent evaluation found that, in Sub-Saharan Africa, outages can cost companies as much as a 31 percent loss in sales. In some of the largest economies in the region, such as Nigeria, Ghana, and Angola, more than 25 percent of businesses lose more than 10 percent in sales because of power outages, with individual firms reporting losing more than 70 percent. The firms with the most significant challenges average more than 200 hours a month without power, while even the companies receiving electricity services with the highest reliability still report more than 10 hours a month without electricity (Ramachandran, Shah, and Moss 2018).
TABLE ES.1 Estimated and potential levelized cost of electricity, 2018 and 2030
Load factor (percent)Levelized cost of electricity ($/kWh)
2018 203022% 0.55 0.33
40% 0.42 0.22
80% 0.35 0.237
Source: ESMAP analysis.Note: LCOE data are for a well-designed 294kWfirm solar-hybrid mini grid in Bangladesh serving more than 1,000 customers (more than 5,000 people). A detailed description of the underlying analysis is provided in chapter 3 of the main book. kWh = kilowatt-hour.
iii. Load factor (LF) is defined as average load divided by peak load over a specified period of time. In this report we define LF over the course of an entire year (8,760 hours), consistent with the default approach employed by HOMER Pro software. Random variation in daily loads over the course of a year means that the annual peak load is considerably higher than observed from the average daily load profile. For example, an average daily load profile with a 38 percent LF (daily basis) is calculated to have a 22 percent LF on an annual basis assuming a day-to-day random load variability of 10 percent and hour-to-hour variability of 20 percent.
MINI GRIDS FOR HALF A BILLION PEOPLE18
Pe
rce
nta
ge
of
pe
ak
loa
dFIGURE ES.2 Change in the daily load profile and the levelized cost of electricity from increases in the productive use of electricity
Source: ESMAP analysis.Note: kWh = kilowatt-hour.
22% load factor 40% load factor 80% load factor
0
20
40
60
80
100
1 2 3 4 5 6 7 8 9 10 11 12 13 14 15 16 17 18 19 20 21 22 23 24
LCOE = $0.35/kWh
LCOE = $0.42/kWh
LCOE = $0.55/kWh
Using electricity supplied by mini grids can enable significant opportunities for business growth: more than 30 income-generating appliances available today have a payback period of less than 12 months. In one of the most comprehensive assessments of productive-use appliances and equipment to date, ESMAP identified the upfront investment costs, power consumption, and payback periods for 37 income-generating machines and other appliances. Of these, 32 had payback periods of less than 12 months. The typical upfront investment cost ranged from $500 to $1,500, with an average of about $1,200. The list of energy-efficient AC-powered appliances includes machines for welding, milling, rice hulling, ice making, and egg incubating, as well as refrigerators and televisions. Gains in efficiency make these machines and appliances financially and technologically attractive to entrepreneurs and developers alike. Advances in refrigeration technology, for exam-ple, have reduced the power consumption of a 100-liter refrigerator from about 100 watts (W) several years ago to less than 40 W today. Offering these appliances—with potential financing options—thus allows mini grid developers to provide more services to the customers for the same electricity cost. At the same time, it is import-ant that developers assess and incorporate projections for the anticipated use of such efficient appliances into their evaluation of the appropriate mini grid system size at the design stage, to avoid overdesigning the system and to maximize the potential investment cost savings. Table ES. 2 provides an overview of a small sample of such energy-efficient appliances for agricultural, manufacturing, and commercial purposes, as well as their average power consumption, average, cost and average payback periods. Chapter 5 of the main book includes a more comprehensive version of the table.
Income-generating machines and equipment connected to mini grids also contribute to local economic development. Many of the 37 income-generating appliances require more than one person to operate, implying job creation opportunities in local communities. Anecdotal evidence from Nigeria suggests that entrepreneurs who

MINI GRIDS FOR HALF A BILLION PEOPLE 19
TABLE ES.2 Power requirements, costs and indicative payback periods of selected income-generating appliances 8
Sector Activities / AppliancesPower required
(kW)Cost from
supplier ($)Payback period
(months)Primary industries (agriculture, fishing)
Egg incubator 80 to 160W $50 to $100 1 to 3
Grinder for pulses and beans 5.2 kW $1,500 to $4,000 6 to 12
Water irrigation pump 3.7 to 22.4 kW $200 to $1,000 3 to 6
Sterilizer (for dairy processing)
3 to 6kW $600 to $2,000 1 to 3
Packager 250W to 3kW $500 to $1,000 6 to 12
Light manufacturing Electronic welding machine 3 to 7.5 kW $200 to $300 6 to 12
Jigsaw 400W $100 3 to 6
Electric drilling machine 400W $20 to $50 3 to 6
Popcorn maker 1.5 to 2.1 kW $50 1 to 3
Commercial and retail activities
Computer 15 to 100W $250 to $800 3 to 6
Printer/scanner for stationery 0.5 to 2kW $150 to $250 3 to 6
Sewing machine 200W $30 to $100 3 to 6
Television for local cinemas and bars (including decoder)
50 to 200W $100 to $200 1 to 3
Source: ESMAP, Alibaba, Inensus. Note: Chapter 5 of the main report provides the full table of 37 income-generating machines and other equipment. kW = kilowatt; W = watt.
purchased an income-generating appliance hired an additional employee within the first year after making the purchase. Income-generating uses of electricity can notably help women, in particular, to improve earnings, quality of life through use of light, electrical equipment for cottage industries, ceramics, and others (see box ES.1).
Electric cooking is an often-neglected application of mini grid electricity that also offers an opportunity to capture an existing household expenditure. Households switching to mini grid–powered electric cooking save money compared with traditional methods: cooking with a mini grid–powered induction stove costs $0.18–$0.98 per person per day, often making it cheaper than traditional wood-fired and charcoal-fired stoves, which can cost up to $0.37 and $0.45 per person per day, respectively (Couture and others 2016). Electric cooking also presents developers with a valuable opportunity to increase their load factor and boost their revenue. While peak loading is a major issue for electric cooking on mini grids, a variety of time-shifting techniques can decou-ple electricity demand from supply, such as household battery storage. ESMAP is collaborating with Loughbor-ough University and its partners on a new DfID-funded Modern Energy Cooking Services program that aims to take advantage of the opportunities for, and address the challenges of. mini grid–powered electric cooking.
Increasing productive uses of electricity can double or triple demand for a mini grid’s service. The Infrastructure Development Company Limited (IDCOL) of Bangladesh launched a comprehensive initiative to support 26 solar mini grids in remote parts of the country. The initiative includes activities aimed to increase productive uses of electricity (productive-use appliances and machines), through such measures as appliance training, management skill development, daytime load stimulation, and promotion of softer loan finance terms. To date, this approach has helped some of the mini grids to achieve their target utilization rates sooner than projected. One notable example is the Suro Bangla mini grid on Paratoli Island, which was able to reach its full projected uptake of more than 17,000 kWh within 18 months, rather than two years, as initially anticipated. Operating at or near capacity for these mini grids translates into higher returns on investment for developers.

MINI GRIDS FOR HALF A BILLION PEOPLE20
Increasing the uptake of productive-use equipment requires access to more than $1 billion in affordable consumer finance. Assuming an average upfront cost of $1,200 and five appliances per mini grid, approxi-mately $1.3 billion in microfinance will be needed for the purchase of 1.1 million productive-use appliances by 2030. Although they have relatively high upfront costs, most productive-use appliances and equipment provide opportunities to generate or increase revenue. Financing the upfront purchase cost of the appliances—by the mini grid operator via on-bill financing or by a third party, such as a microfinance organization—is a good way to increase productive uses of mini grid electricity. Both financing pathways have benefits and drawbacks for the mini grid operator, and both require the operator to develop new business model capabilities.
As a result of declining LCOE and increasing income-generating uses of electricity, third-generation mini grids can have transformational effects on power sectors. They are on track to provide power at lower cost than many utilities by 2030 (figure ES.3). Mini grids will become the least-cost solution for grid-quality electricity for more than 60 percent of the population in Africa in a scenario assuming that national utilities do not dramatically change their operations—with significant implications for the allocation of both public and private investment funds.
Mini grids also provide service that consistently exceeds the level of service provided by the main grid. Developers are creating systems that can provide 24/7 electricity. Remote monitoring technologies and smart meters are increasing the quality of customer service and the reliability of mini grids. The average uptime of mini grids owned and operated by members of AMDA exceeds 97 percent—less than two weeks of planned outage over an entire year. Across Sub-Saharan Africa, the main grid is significantly less reliable: households and small businesses typically experience several hours a day of outage. In some countries—including Burundi, Ghana, Guinea, Liberia, Nigeria, and Zimbabwe—more than half of households connected to the main grid reported receiving electricity less than half of the time (Blimpo and Cosgrove-Davies 2019). Furthermore, disaggregated data from the diagnostic survey reports carried out by ESMAP in a range of countries based on the Multi-Tier Framework provides additional evidence of this lack of reliability, both in the Sub-Saharan region and beyond. The report from Rwanda indicates 97 percent of grid-connected households experience more than four electric-ity disruptions a week (ESMAP 2018c). The Ethiopia report shows that 57.6 percent of grid-connected house-holds face 4–14 outages a week, and 2.8 percent face more than 14 outages a week (ESMAP 2018b). The
Attracting women as productive-use mini grid customers
Women are important productive-use customers for mini grids because of their high entrepreneurship rates in many low-income countries. Inclusive community engagement strategies are helping identify and connect women-owned businesses.
In India, for example, mini grid developers are providing loans to women entrepreneurs to finance the upfront investment of productive-use equipment. Doing so has increased the rigor of governance processes and the equity of community-owned mini grids (Katre, Tozzi, and Bhattacharyya 2019). Initiatives like these result in better-managed mini grids with higher load factors, leading to increased profitability.
BOX ES.1
For more information on how to promote productive uses of electricity, see chapter 5 of the book (“Promoting Productive Uses of Electricity”).

MINI GRIDS FOR HALF A BILLION PEOPLE 21
FIGURE ES.3 Comparison of levelized cost of electricity of mini grids and utilities in Africa
Source: Based on Kojima & Trimble 2016.Note: kWh = kilowatt-hour; LCOE = Levelized cost of energy.
Mini grid LCOE at $0.20/kWh is less than the LCOE of 24 of 39 utilities in Africa
At $0.30/kWh mini grid LCOE is less than 15 of 39
At $0.40/kWh: 7of 39
At $0.50/kWh: 5 of 39
0.0
0.1
0.2
0.3
0.4
0.5
0.6
0.7
Na
tion
al u
tility
LC
OE
($
/kW
h)
Liber
iaCo
moro
sSi
erra
Leon
eSã
o Tom
é and
Prín
cipe
Cape
Ver
deGa
mbia,
The
Rwan
daGu
inea
Sene
gal
Maur
itania
Burki
na F
aso
Togo Ma
liMa
daga
scar
Seyc
helle
sBe
ninGa
bon
Keny
aBo
tswan
aNi
geria
Côte
d'Ivo
ireMa
uritiu
sBu
rund
iCe
ntral
Afric
an R
epub
licNi
ger
Swaz
iland
Cong
o, Re
p.Et
hiopia
Tanz
ania
Malaw
iCa
mero
onUg
anda
Zimba
bwe
Suda
nGh
ana
Moza
mbiqu
eSo
uth A
frica
Leso
thoZa
mbia
report from Cambodia indicates that 69.3 percent of grid-connected households face frequent, unpredictable power outages, and 9.9 percent of all grid-connected customers receive less than 4 hours of service per day (ESMAP 2018a).
STATUS OF AND OUTLOOK FOR CAPITAL AND OPERATING EXPENSES
CAPITAL COSTS
Solar-hybrid mini grids cost about $3,900/kWfirm. In ESMAP’s survey of 53 mini grids, costs per unit of firm power output (kWfirm) range from $1,420 to $22,689/kWfirm. The average and median costs per kWfirm were $6,193 and $4,849, respectively. If outlier projects above $8,000/kWfirm are removed, the average cost per kWfirm falls to $4,298, with a median of $3,908. Components used for generating electricity accounted for 54 percent of total capital costs. The components with the largest share of overall CAPEX were batteries (15 percent), distri-bution grids (14 percent), PV modules (11 percent), inverters (5–9 percent), powerhouses (7 percent), and meters (4 percent).
MINI GRIDS FOR HALF A BILLION PEOPLE22
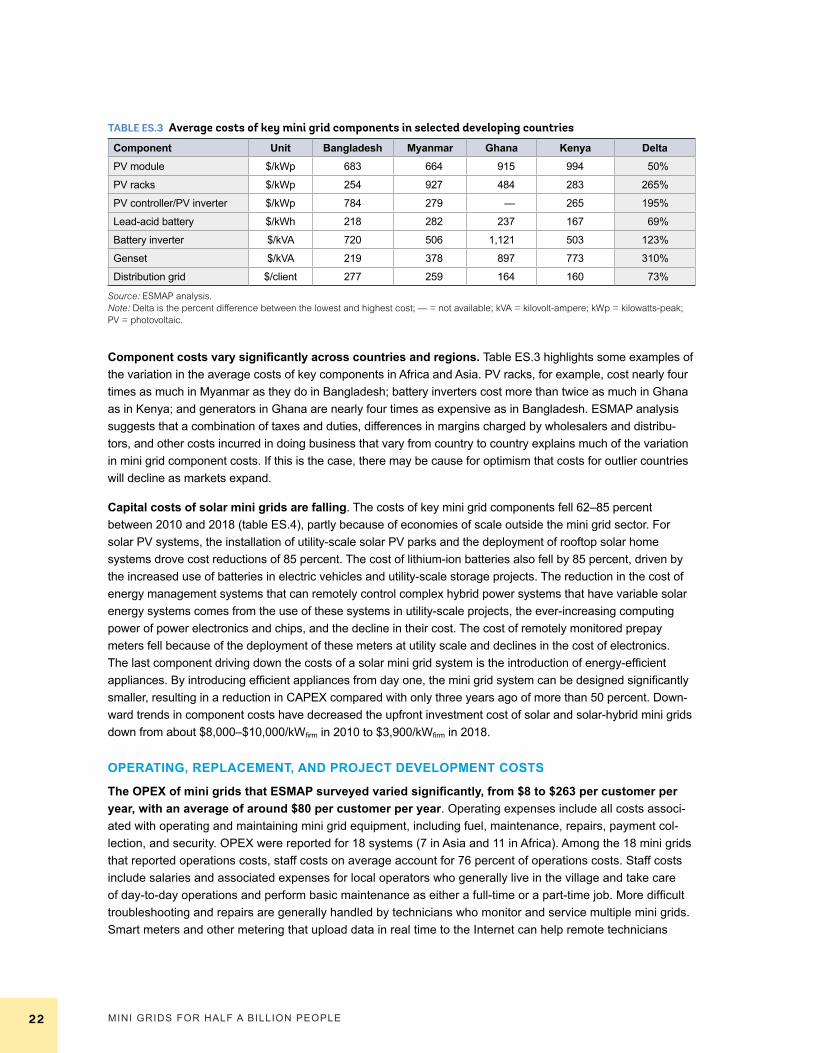
Component costs vary significantly across countries and regions. Table ES.3 highlights some examples of the variation in the average costs of key components in Africa and Asia. PV racks, for example, cost nearly four times as much in Myanmar as they do in Bangladesh; battery inverters cost more than twice as much in Ghana as in Kenya; and generators in Ghana are nearly four times as expensive as in Bangladesh. ESMAP analysis suggests that a combination of taxes and duties, differences in margins charged by wholesalers and distribu-tors, and other costs incurred in doing business that vary from country to country explains much of the variation in mini grid component costs. If this is the case, there may be cause for optimism that costs for outlier countries will decline as markets expand.
Capital costs of solar mini grids are falling. The costs of key mini grid components fell 62–85 percent between 2010 and 2018 (table ES.4), partly because of economies of scale outside the mini grid sector. For solar PV systems, the installation of utility-scale solar PV parks and the deployment of rooftop solar home systems drove cost reductions of 85 percent. The cost of lithium-ion batteries also fell by 85 percent, driven by the increased use of batteries in electric vehicles and utility-scale storage projects. The reduction in the cost of energy management systems that can remotely control complex hybrid power systems that have variable solar energy systems comes from the use of these systems in utility-scale projects, the ever-increasing computing power of power electronics and chips, and the decline in their cost. The cost of remotely monitored prepay meters fell because of the deployment of these meters at utility scale and declines in the cost of electronics. The last component driving down the costs of a solar mini grid system is the introduction of energy-efficient appliances. By introducing efficient appliances from day one, the mini grid system can be designed significantly smaller, resulting in a reduction in CAPEX compared with only three years ago of more than 50 percent. Down-ward trends in component costs have decreased the upfront investment cost of solar and solar-hybrid mini grids down from about $8,000–$10,000/kWfirm in 2010 to $3,900/kWfirm in 2018.
OPERATING, REPLACEMENT, AND PROJECT DEVELOPMENT COSTS
The OPEX of mini grids that ESMAP surveyed varied significantly, from $8 to $263 per customer per year, with an average of around $80 per customer per year. Operating expenses include all costs associ-ated with operating and maintaining mini grid equipment, including fuel, maintenance, repairs, payment col-lection, and security. OPEX were reported for 18 systems (7 in Asia and 11 in Africa). Among the 18 mini grids that reported operations costs, staff costs on average account for 76 percent of operations costs. Staff costs include salaries and associated expenses for local operators who generally live in the village and take care of day-to-day operations and perform basic maintenance as either a full-time or a part-time job. More difficult troubleshooting and repairs are generally handled by technicians who monitor and service multiple mini grids. Smart meters and other metering that upload data in real time to the Internet can help remote technicians
TABLE ES.3 Average costs of key mini grid components in selected developing countries
Component Unit Bangladesh Myanmar Ghana Kenya DeltaPV module $/kWp 683 664 915 994 50%
PV racks $/kWp 254 927 484 283 265%
PV controller/PV inverter $/kWp 784 279 — 265 195%
Lead-acid battery $/kWh 218 282 237 167 69%
Battery inverter $/kVA 720 506 1,121 503 123%
Genset $/kVA 219 378 897 773 310%
Distribution grid $/client 277 259 164 160 73%
Source: ESMAP analysis.Note: Delta is the percent difference between the lowest and highest cost; — = not available; kVA = kilovolt-ampere; kWp = kilowatts-peak; PV = photovoltaic.
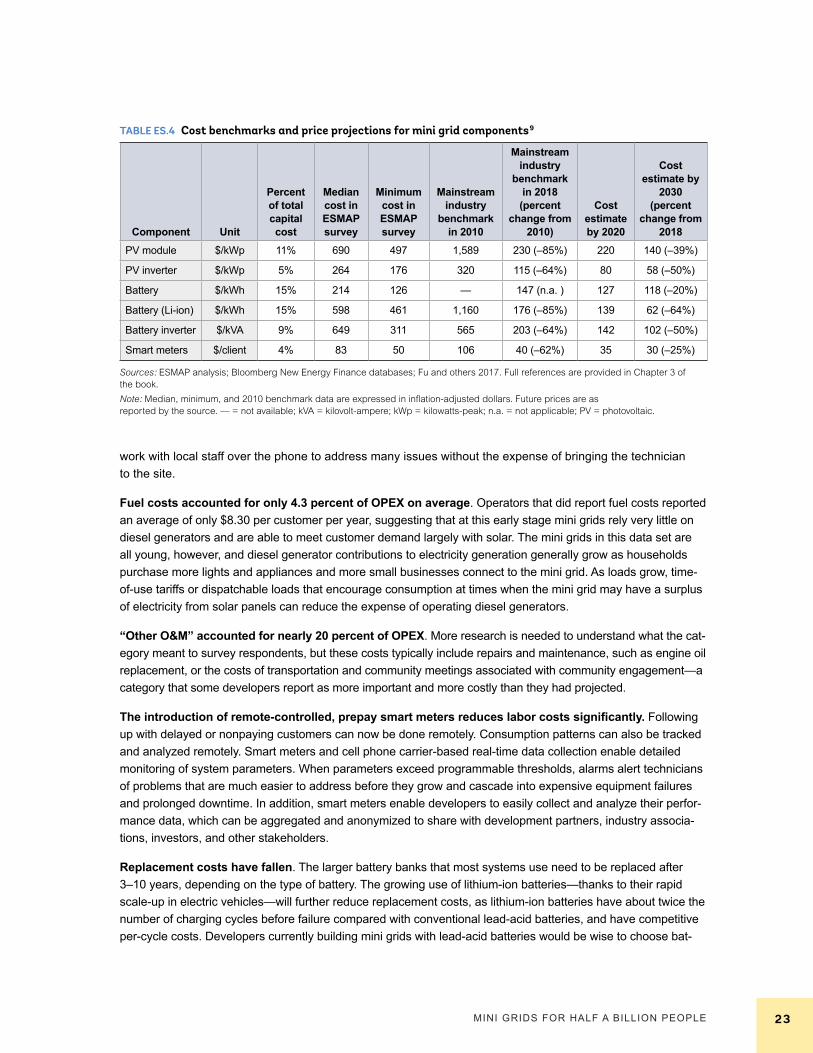
MINI GRIDS FOR HALF A BILLION PEOPLE 23
work with local staff over the phone to address many issues without the expense of bringing the technician to the site.
Fuel costs accounted for only 4.3 percent of OPEX on average. Operators that did report fuel costs reported an average of only $8.30 per customer per year, suggesting that at this early stage mini grids rely very little on diesel generators and are able to meet customer demand largely with solar. The mini grids in this data set are all young, however, and diesel generator contributions to electricity generation generally grow as households purchase more lights and appliances and more small businesses connect to the mini grid. As loads grow, time-of-use tariffs or dispatchable loads that encourage consumption at times when the mini grid may have a surplus of electricity from solar panels can reduce the expense of operating diesel generators.
“Other O&M” accounted for nearly 20 percent of OPEX. More research is needed to understand what the cat-egory meant to survey respondents, but these costs typically include repairs and maintenance, such as engine oil replacement, or the costs of transportation and community meetings associated with community engagement—a category that some developers report as more important and more costly than they had projected.
The introduction of remote-controlled, prepay smart meters reduces labor costs significantly. Following up with delayed or nonpaying customers can now be done remotely. Consumption patterns can also be tracked and analyzed remotely. Smart meters and cell phone carrier-based real-time data collection enable detailed monitoring of system parameters. When parameters exceed programmable thresholds, alarms alert technicians of problems that are much easier to address before they grow and cascade into expensive equipment failures and prolonged downtime. In addition, smart meters enable developers to easily collect and analyze their perfor-mance data, which can be aggregated and anonymized to share with development partners, industry associa-tions, investors, and other stakeholders.
Replacement costs have fallen. The larger battery banks that most systems use need to be replaced after 3–10 years, depending on the type of battery. The growing use of lithium-ion batteries—thanks to their rapid scale-up in electric vehicles—will further reduce replacement costs, as lithium-ion batteries have about twice the number of charging cycles before failure compared with conventional lead-acid batteries, and have competitive per-cycle costs. Developers currently building mini grids with lead-acid batteries would be wise to choose bat-
TABLE ES.4 Cost benchmarks and price projections for mini grid components9
Component Unit
Percent of total capital cost
Median cost in ESMAP survey
Minimum cost in ESMAP survey
Mainstream industry
benchmark in 2010
Mainstream industry
benchmark in 2018(percent
change from 2010)
Cost estimate by 2020
Cost estimate by
2030(percent
change from 2018
PV module $/kWp 11% 690 497 1,589 230 (–85%) 220 140 (–39%)
PV inverter $/kWp 5% 264 176 320 115 (–64%) 80 58 (–50%)
Battery $/kWh 15% 214 126 — 147 (n.a. ) 127 118 (–20%)
Battery (Li-ion) $/kWh 15% 598 461 1,160 176 (–85%) 139 62 (–64%)
Battery inverter $/kVA 9% 649 311 565 203 (–64%) 142 102 (–50%)
Smart meters $/client 4% 83 50 106 40 (–62%) 35 30 (–25%)
Sources: ESMAP analysis; Bloomberg New Energy Finance databases; Fu and others 2017. Full references are provided in Chapter 3 of the book.Note: Median, minimum, and 2010 benchmark data are expressed in inflation-adjusted dollars. Future prices are as reported by the source. — = not available; kVA = kilovolt-ampere; kWp = kilowatts-peak; n.a. = not applicable; PV = photovoltaic.

MINI GRIDS FOR HALF A BILLION PEOPLE24
tery inverters (and battery chargers in the case of direct current (DC)-coupled systems) that are compatible with lithium-ion batteries, so that future battery replacements can accommodate lithium-ion if costs are favorable. Replacement costs for electronics, such as PV inverters and battery inverters, are also decreasing as they are manufactured at larger and larger scales.
Preparation and planning costs have declined. In the past, multidisciplinary teams prepared electrification plans, scoped sites, and conducted prefeasibility studies, at considerable cost. Today, most of this work, all the way up to feasibility-level analysis—including compiling bills of quantity and bid documents or purchase orders—can be done from behind a desk, thanks to the following factors:
• the availability of big data that provide geotagged points of interest that can be used to prepare a detailed demand assessment of prospective load centers
• affordable high-resolution satellite imagery
• easy-to-use but sophisticated software that can be used to design hybrid generation systems together with the design of the distribution network
• data-driven Web-based platforms that compile large amounts of geotagged market intelligence that can be configured in different ways to be useful for mini grid developers, financiers, and government agencies.
Field visits at the preparation stage are needed to engage with communities to discuss agreements, such as the terms of land purchases or leases, and to verify the geospatial analysis data—and they can be handled by a much leaner team.
The introduction of geospatial and other digital technologies has decreased the cost of preparation and planning by an order of magnitude. In the past, the unit cost per site was more or less the same, irrespective of the number of sites—about $30,000 per site—because each site required a high level of on-site analysis. Today, portfolios of mini grids can be prepared to the point where they are ready for full feasibility assessment and community engagement at a cost of about $2,300 per site, based on the World Bank’s recent experience in Nigeria. The largest components of this per-site cost are socioeconomic surveys and energy audits to estimate electricity demand and willingness and ability to pay. These components account for 58 percent of the total per-site cost, and their costs are largely linear since the primary driver is human resources. The time required to survey a household will not change too much with the scale of the exercise, although there is likely to be some savings in travel logistics. Nevertheless, technology can help expedite the comple-tion of these labor-intensive tasks—for example, through the use of drones to map out a village and efficiently sequence household visits by enumerators, or through the use of tablet-based software to swiftly and more accurately capture survey data.
Other costs are incurred for obtaining licenses, approvals, and permits. These costs depend on the enabling environment in place in a country. Several governments have incorporated mini grids as part of their energy policy, giving the systems and industry a place in the energy sector. Some countries have adopted mini grid regulations that allow for a light-handed approach. In some countries, e-government has streamlined the process for obtaining location and building permits. Even though these costs are important, they are not expected to change significantly in high–energy-deficit countries over the next decade unless efforts are under-taken to facilitate doing business in these countries.
For more information on the components and costs of third-generation mini grid systems, see chapter 3 of the book (“Mini Grid Costs and Technology Innovations”).
MINI GRIDS FOR HALF A BILLION PEOPLE 25
POTENTIAL COST REDUCTIONS
Further cost reductions are projected as mini grid systems are developed in a portfolio approach as opposed to one-off projects, leading to standardization and economies of scale. These economies of scale will also have a significant impact on planning and preparation costs.
Several factors will lead to significant cost reductions:
1. Expected decreases in component costs associated with using current best practices can reduce upfront investment costs to less than $3,000/kWfirm. ESMAP’s research, corroborated by analysis from Bloomberg New Energy Finance (BNEF), suggests that the global spot price of solar PV modules will fall from $230/kW in 2018 to $140/kW in 2030 (BNEF 2018). As electric vehicles become mainstream, the spot price of lithium-ion battery packs will drop from $176/kWh to $62/kWh. Factory prices for PV inverters could drop to below $58/kW in 2030, down from $115/kW in 2018. If the prices that mini grid developers pay for just these components decline by the same proportion by 2030, the upfront capital cost of a solar-hybrid mini grid would fall by almost 22 percent. If mini grid developers are able to purchase these three components at global spot prices in 2030, the upfront capital cost of a solar-hybrid mini grid would fall by more than 26 percent. For example, solar PV typically accounts for about 11 percent of total capital expenditures for mini grids, so a 39 percent reduction in its costs by 2030 (the expected decline in global spot prices) would result in a 4.3 percent reduction in total upfront investment costs. Meanwhile, if developers can purchase solar PV at global spot prices in 2030 ($140/kW), this represents an 80 percent decline from their 2018 costs; there-fore, the total investment cost would decrease by 8.8 percent. It is important to note that this is a conserva-tive estimate, as it only accounts for cost declines in three major components of solar-hybrid mini grids. Other estimates for capital costs for the same type of mini grid are significantly lower.
2. Economies of scale and broader cost declines for mini grid components will reduce the LCOE of mini grids even further. As developers build portfolios of mini grids instead of one-off projects, they benefit from increased economies of scale—primarily as a result of bulk purchases of components and increased efficiencies through standardized processes and increased know-how. Analysis of the data collected in ESMAP’s survey of mini grids in Africa and Asia indicates that economies of scale reduce capital costs significantly. On average, for every additional 100 customers a mini grid serves, its per-customer cost falls by about $68; for every additional mini grid in a developer’s portfolio, capital costs decline by about $100/kW. Cost reductions from economies of scale complement the downward effect on costs from increasing productive uses of electricity.
3. Using geospatial and other digital tools to develop portfolios of mini grids will also reduce costs. Geospatial analysis allows developers to assess mini grid sites at a fraction of the cost of traditional site assessment activities. A number of established mini grid developers in Sub-Saharan Africa use geospatial and other analytical software to plan their portfolios remotely. They prioritize sites for mini grid development and use technology-enabled processes to estimate demand, enabling them to optimize system design across their portfolios. Where government or donor entities are conducting the portfolio-level analysis, the data can be analyzed and disseminated to developers on a Web-based platform like Odyssey Energy Solutions.
For more information on using geospatial analysis to plan portfolios of mini grids at the national and project levels, see chap-ter 4 of the book (“Geospatial and Digital Tools for Electrification and Portfolio Planning”).
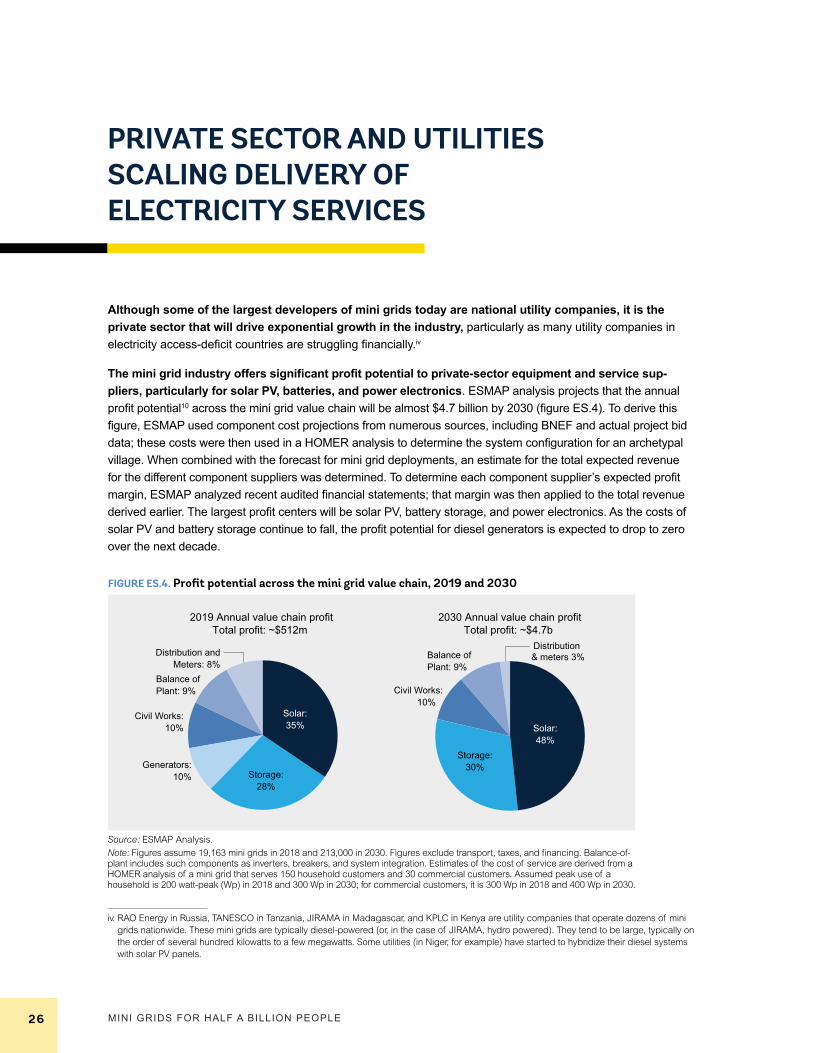
MINI GRIDS FOR HALF A BILLION PEOPLE26
PRIVATE SECTOR AND UTILITIES SCALING DELIVERY OF ELECTRICITY SERVICES
Although some of the largest developers of mini grids today are national utility companies, it is the private sector that will drive exponential growth in the industry, particularly as many utility companies in electricity access-deficit countries are struggling financially.iv
The mini grid industry offers significant profit potential to private-sector equipment and service sup-pliers, particularly for solar PV, batteries, and power electronics. ESMAP analysis projects that the annual profit potential10 across the mini grid value chain will be almost $4.7 billion by 2030 (figure ES.4). To derive this figure, ESMAP used component cost projections from numerous sources, including BNEF and actual project bid data; these costs were then used in a HOMER analysis to determine the system configuration for an archetypal village. When combined with the forecast for mini grid deployments, an estimate for the total expected revenue for the different component suppliers was determined. To determine each component supplier’s expected profit margin, ESMAP analyzed recent audited financial statements; that margin was then applied to the total revenue derived earlier. The largest profit centers will be solar PV, battery storage, and power electronics. As the costs of solar PV and battery storage continue to fall, the profit potential for diesel generators is expected to drop to zero over the next decade.
iv. RAO Energy in Russia, TANESCO in Tanzania, JIRAMA in Madagascar, and KPLC in Kenya are utility companies that operate dozens of mini grids nationwide. These mini grids are typically diesel-powered (or, in the case of JIRAMA, hydro powered). They tend to be large, typically on the order of several hundred kilowatts to a few megawatts. Some utilities (in Niger, for example) have started to hybridize their diesel systems with solar PV panels.
FIGURE ES.4. Profit potential across the mini grid value chain, 2019 and 2030
2019 Annual value chain profitTotal profit: ~$512m
2030 Annual value chain profitTotal profit: ~$4.7b
Source: ESMAP Analysis.Note: Figures assume 19,163 mini grids in 2018 and 213,000 in 2030. Figures exclude transport, taxes, and financing. Balance-of-plant includes such components as inverters, breakers, and system integration. Estimates of the cost of service are derived from a HOMER analysis of a mini grid that serves 150 household customers and 30 commercial customers. Assumed peak use of a household is 200 watt-peak (Wp) in 2018 and 300 Wp in 2030; for commercial customers, it is 300 Wp in 2018 and 400 Wp in 2030.
Distribution & meters 3%Distribution and
Meters: 8%
Solar:35% Solar:
48%
Storage:28%
Storage:30%Generators:
10%
Civil Works:10%
Civil Works: 10%
Balance of Plant: 9%
Balance of Plant: 9%

MINI GRIDS FOR HALF A BILLION PEOPLE 27
The profit potential for mini grid operators is expected to increase dramatically over the next decade, even as tariffs decline. Table ES.5 outlines the profit potential of third-generation mini grid operators, given assumed tariffs and costs of service. This analysis indicates a profit potential that could exceed $3.3 billion on an annual basis for all third-generation mini grids deployed between today and 2030. These tariffs are reflective of the low end of mini grid tariffs today, resulting in a conservative estimate for profits. It is important to note that financial support packages, including subsidies from governments and development partners, will be needed to unlock this profit potential, particularly over the next few years to set the market on the trajectory of rapid scale-up. Public funds enabled high-income countries to achieve universal electricity access; the same will be true for electricity access-deficit countries today.
Private-sector participation in the mini grid market is increasing as the economics of mini grids become more attractive. More and more private companies are participating across the mini grid value chain (table ES.6). Manufacturers of renewable energy technologies—particularly solar and battery companies—see the mini grid market as a profitable opportunity. Large energy companies, like Engie, are directly investing in mini grids. Other large suppliers, like SMA, are securing deals with mini grid developers. However, the business envi-ronment is not yet attracting finance at scale across the board: only a few large companies are operating in the market, and, according to BNEF, $259 million has been invested in private-sector developers since 2013—far short of the billions of private-sector investment needed by 2030 (BNEF 2019).
The mini grid value chain refers to different steps needed to successfully complete a mini grid project, and encompasses component manufacturing, site assessment, procurement, installation, O&M, and after-sales services. Broadly, the private sector can be classified into two categories: operators and facilitators. The operators assume primary responsibility for the mini grid lifecycle, engage with the community being served by the mini grid, and generally take ownership over operating the mini grid and collecting payment from custom-ers. Types of operator companies include mini grid energy service companies, such as mini grid developers, and utilities. The facilitators are private organizations that help mini grid operators design, build, and manage mini grids, but do not take primary responsibility of engaging with the community and selling electricity. Facilitating organizations include mini grid component manufacturers; engineering, procurement, and construction com-panies that assist with system design and installation; system integrators, which package the various mini grid components into complete systems; and investors.
Even in countries in which the government leads mini grid development, the private sector is a key partner in mini grid initiatives. Public–private partnerships are often an effective way of distributing responsibilities to opti-mize government and private-sector capacities. They enable mini grid operators that do not have substantial finan-cial resources to enter the market. Two common models are the management model and the split-asset model:
• Under the management model, a government entity plans, finances, and implements a mini grid up to the commissioning stage, with a private operator subsequently taking on responsibility. The operator manages, maintains, and operates the entire mini grid, including generation and distribution, and collects fees from mini grid customers. Contractual options for the operator to take on responsibility from the governmental entity
TABLE ES.5 Current and projected tariffs, costs, and profits of mini grid operators, 2019 and 2030
Item 2019 2030Average tariff/kWh 0.45 0.26
Cost of service/kWh 0.43 0.21
Profit on mini grids deployed this year (millions of US$) 28 608
Cumulative profit on all mini grids deployed (millions of US$) 153 3,343Source: ESMAP analysis.Note: kWh = kilowatt-hour.

MINI GRIDS FOR HALF A BILLION PEOPLE28
TABLE ES.6 Examples of private-sector companies participating in the mini grid value chainCompany Headquarters DescriptionMini grid developersMLinda India MLinda installed a 48 kWp system to supply power to a large market in West Bengal. Before
the mini grid’s introduction, the market ran on diesel. In some installations, such a market acts as an anchor customer, and surplus power is exported to houses within a 1-kilometer radius.
Redavia Tanzania Redavia uses a lease structure to deploy systems that can be integrated with diesel generators. The containerized units reduce investor risk, as they can be redeployed. The company has secured more than $20 million in investment.
Sigora Haiti Sigora completed the Mole-St-Nicolas mini grid in 2017. It produces 200 kW of diesel power and 200 kW of solar power, supplying power to 5,500 customers. Expansion plans include adding solar and wind capacity.
Engineering, procurement, and construction companies (EPCs)Clarke Energy
United Kingdom
In 2018, Clarke developed and installed a hybrid in Nigeria that used 4 MW of natural gas engines with 250 kVA of energy storage. It can operate either connected to the grid or in islanded operation. Clarke integrated GE engines with a FLEXGEN energy storage system.
Hatch Canada Nearly 300 remote communities in Canada lack access to the grid. Most rely on diesel generation. Hatch, a global EPC, developed its own microgrid controller (HµGrid), which integrates renewables with diesel generation to improve power quality and reliability and lower cost (as a result of lower diesel consumption) (Sedighy 2016).
Sterling and Wilson
India Sterling and Wilson is an EPC that is executing projects in more than 40 countries across a variety of projects, including solar, cogeneration, and diesel generation. In 2018, the company established a business unit dedicated to developing hybrid systems. It won an order for three hybrid systems, including one with 17 MWh of energy storage, across three sites in western Africa (Kenning 2018).
Mini grid component manufacturersExide United States Exide is a large lead-acid battery manufacturer that has been in business since 1888. It
operates in more than 30 countries.
SMA Germany SMA, a leading manufacturer of solar and storage inverters, develops products that can be integrated into mini grids with capacity of up to 300 kW.
Yingli Solar China Yingli, a large solar panel manufacturer, has shipped more than 20 GW of panels to more than 90 countries. It has annual manufacturing capacity of 4 GW.
System integration companiesNayo Tropical Technology
Nigeria Nayo Tropical Technology sells individual mini grid components and integrates them into containerized systems. In 2019, it won a contract worth about $260,000 to power the Kare and Dadin Kowa communities with a 90-kW system (Okafor 2019).
Tiger Power Belgium In 2018, Tiger Power signed an agreement with the Ugandan rural electrification agency to develop three mini grids using its containerized solar and storage system, backed up by a hydrogen generator, to provide power to 3,000 households (Alliance for Rural Electrification 2018).
Winch Energy
United Kingdom
In 2016 Winch Energy installed 17 kW and 30 kW containerized solar and storage systems in the village of Nimjat, in Mauritania, providing electricity to a school, dispensary, mosque, streetlights, and 70 households.
InvestorsAcumen United
Kingdom and United States
Founded in 2001, Acumen seeks to provide long-term capital that bridges the gap between market-based approaches and pure philanthropy. It makes seed and early-stage investments in social enterprises.
Bamboo Capital Partners
Luxembourg Launched in 2007, Bamboo has proved that private capital can be profitably deployed as a tool for change. It has about $290 million under management, with a portfolio of 33 companies in more than 20 countries.
Shell Foundation
United Kingdom
Shell Foundation was established in 1997 by Royal Dutch Shell as a social investment initiative. It uses grants and other financial instruments to support early-stage social enterprises, including mini grid operators and technology providers.
Sources: Alliance for Rural Electrification 2018; BNEF 2018and 2019; ESMAP research; Kenning 2018; Okafor 2019; and, Sedighy 2016.Note: GW = gigawatt; kVA = kilovolt-ampere; kW = kilowatt; kWp = kilowatt-peak; MW = megawatt; MWh = megawatt-hour.

MINI GRIDS FOR HALF A BILLION PEOPLE 29
include an authorization arrangement, a contracted operation, a leasing contract, and full ownership transfer (EUEI PDF 2014). A recent example of such a model is the Rural Renewable Energy Project implemented by DfID in Sierra Leone with the assistance of the United Nations Office for Project Services.
• Under the split-asset model, a governmental institution procures and owns the distribution assets of a mini grid and the developer owns the generation assets. This split reduces the investment costs for the developer and has been deployed as part of a GIZ project in Nigeria.
Significant opportunities for partnership between local and international firms exist across the mini grid industry value chain. Local entities are best positioned to focus on the aspects of the value chain that require knowledge of local rules and regulations or require coordination with the customer being served by the mini grid; international companies are best suited to perform tasks that can be replicated across geographic boundaries. Partnerships between local and international firms can increase value creation, as borne out by recent partnership agreements between Caterpillar and PowerHive in Africa, ABB and Husk Power in India, Mitsui and OMC in India, ENGIE and Mandalay Yoma Energy in Myanmar, and Schneider Electric with both EM-ONE and GVE in Nigeria.
Industry associations can facilitate collaboration and deal-making between local and international entities. AMDA comprises 27 developers, each operating a portfolio of commercially viable mini grids in Sub-Saharan Africa. AMDA helps its members present a unified voice and facilitates deals between developers and suppliers. By collecting data from their members, associations can present data-driven opportunities to investors as well as suppliers of specialized products and services.
Private-sector players are also beginning to focus on specific segments of the value chain. First- and second-generation mini grid operators often were responsible for each step of the mini grid project lifecycle, from identifying sites and determining the demand profile, to designing the system, procuring the various components and installing them, and finally managing system operation and collecting payment. Increasingly with third-generation mini grids, private-sector players are specializing in specific aspects of the mini grid value chain, thus enabling a greater ability to scale through replicability. For example, Sparkmeter produces smart meters for the mini grid market, ESRI creates geospatial software for mini grid developers and national elec-trification planners, Odyssey Energy Solutions provides a data-driven, Web-based market-exchange platform for mini grid portfolios, and AMMP develops mini grid monitoring software. This trend follows a similar path that has been followed by the somewhat older and more mature off-grid solar industry. For a number of years after their emergence within the sector, companies that sold PAYG systems were highly vertically integrated—largely because of the nascent nature of the market and lack of sufficient potential business-to-business partners. But recently a number of these companies—from solar panel manufacturers to local distributors and financial inter-mediaries—have started to break up the value chain by forming fruitful partnerships (Waldron 2017).
At the same time, private-sector–led mini grids can pave the way for more financially viable grid extension in the future. Private-sector–led mini grids are typically designed to interconnect with the main grid, which allows for load balancing as well as transmission and distribution support at the end of the line. They also promote income-generating uses of electricity and create local economic development. As a result, once the main grid arrives, significant demand for electricity already exists and customers have a greater ability to pay, increasing the economic viability of the grid. New regulations give developers options for what happens when the main grid arrives, and cost reductions in mini grid components enable developers to build grid- interconnection–ready systems while keeping tariffs at affordable levels. Even though these regulations exist, they are not yet widely adopted.
For more information on private-sector participation in the mini grid industry value chain by both local and international companies, as well as the results of nationally representative surveys of mini grid operators in Cambodia, Myanmar, and Nepal, see chapter 7 of the book (“Local and International Industry”).

MINI GRIDS FOR HALF A BILLION PEOPLE30
CREATING THE ENVIRONMENT FOR TAKE-OFF OF MINI GRID PORTFOLIOS
Connecting 490 million people by 2030 will require utilities and private companies to develop and oper-ate more than 210,000 mini grids. National utility companies in Kenya, Madagascar, the Philippines, Russia, and many other countries are already important developers of mini grids. Private-sector developers—including PowerGen, OMC, GVE, and Husk Power—are developing large portfolios of mini grids. In a well-established market, private-sector–led initiatives have a better chance of reaching exponential growth—something that is needed to reach universal access by 2030. National utilities also see an expanding role for mini grids based on their organizational cost-benefit analysis.
Several important changes to the mini grid ecosystem will enable utilities and the private sector to scale up their portfolios. They include the following:
• use of geospatial analysis to create national electrification strategies and mini grid portfolios for investment
• workable mini grid regulations and enabling business environments that make it easier for mini grid compa-nies to do business.
• stronger institutional frameworks
• increased access to finance from investors and development partners
• training and skills-building initiatives and effective community engagement strategies
This section discusses each of these areas.
USING GEOSPATIAL ANALYSIS IN PORTFOLIO PLANNING AND IN NATIONAL ELECTRIFICATION PLANNINGA portfolio approach to mini grid development is becoming mainstream in the mini grid industry and in national electrification planning, thanks to new geospatial analysis technologies. Geographic information system (GIS) software and geospatial data are becoming key tools for planning electrification at the national level and performing rapid site assessments. The following factors are mainstreaming digital tools:
• technological advances and cost reductions in satellite imaging and machine learning
• the increased sophistication of algorithms and analytical software
• the proliferation of global positioning system (GPS) devices and Web-based and mobile technologies
• the availability of high-quality open-source software
• the accessibility of big data and cloud-based computing.
Countries are using geospatial analysis to develop national electrification plans that clearly delineate areas for mini grids (figure ES.5). Through a geospatial approach to national electrification planning, the existing grid network is mapped and its attributes are digitalized. The supply of and demand for electricity are geo-located and overlaid with supporting data, including demographic (population density and growth patterns); social infrastructure (schools, health centers, churches, administrative offices); and economic
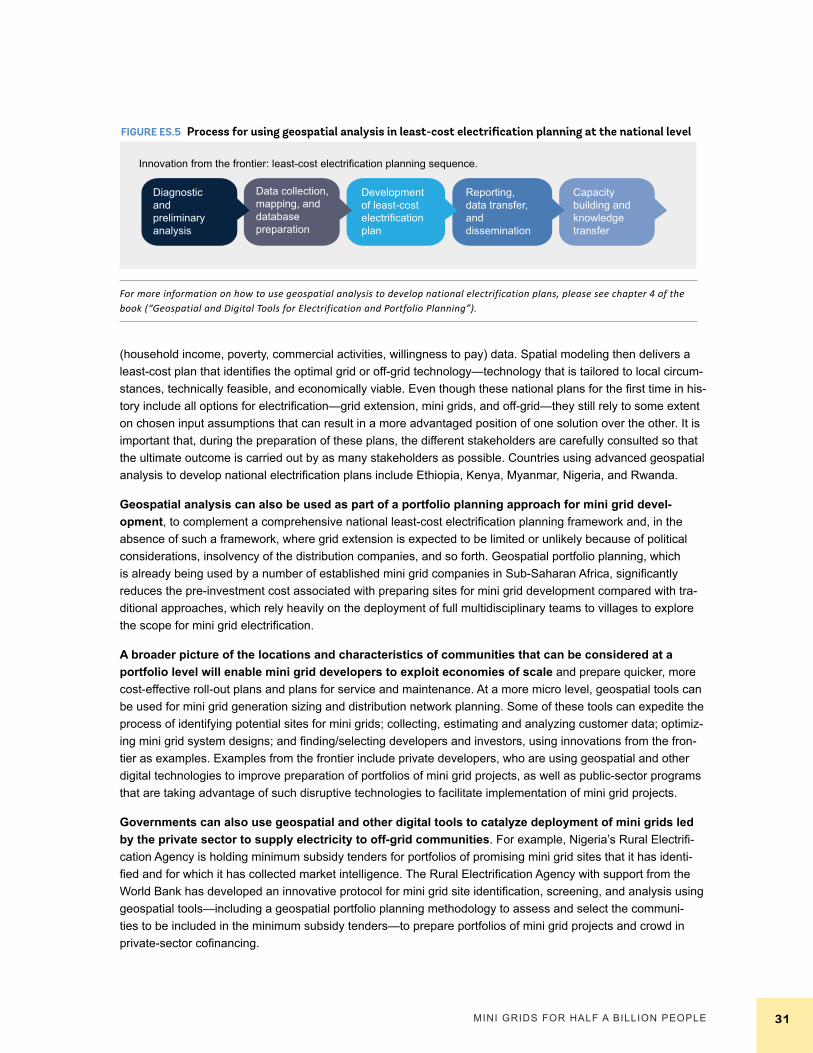
MINI GRIDS FOR HALF A BILLION PEOPLE 31
(household income, poverty, commercial activities, willingness to pay) data. Spatial modeling then delivers a least-cost plan that identifies the optimal grid or off-grid technology—technology that is tailored to local circum-stances, technically feasible, and economically viable. Even though these national plans for the first time in his-tory include all options for electrification—grid extension, mini grids, and off-grid—they still rely to some extent on chosen input assumptions that can result in a more advantaged position of one solution over the other. It is important that, during the preparation of these plans, the different stakeholders are carefully consulted so that the ultimate outcome is carried out by as many stakeholders as possible. Countries using advanced geospatial analysis to develop national electrification plans include Ethiopia, Kenya, Myanmar, Nigeria, and Rwanda.
Geospatial analysis can also be used as part of a portfolio planning approach for mini grid devel-opment, to complement a comprehensive national least-cost electrification planning framework and, in the absence of such a framework, where grid extension is expected to be limited or unlikely because of political considerations, insolvency of the distribution companies, and so forth. Geospatial portfolio planning, which is already being used by a number of established mini grid companies in Sub-Saharan Africa, significantly reduces the pre-investment cost associated with preparing sites for mini grid development compared with tra-ditional approaches, which rely heavily on the deployment of full multidisciplinary teams to villages to explore the scope for mini grid electrification.
A broader picture of the locations and characteristics of communities that can be considered at a portfolio level will enable mini grid developers to exploit economies of scale and prepare quicker, more cost-effective roll-out plans and plans for service and maintenance. At a more micro level, geospatial tools can be used for mini grid generation sizing and distribution network planning. Some of these tools can expedite the process of identifying potential sites for mini grids; collecting, estimating and analyzing customer data; optimiz-ing mini grid system designs; and finding/selecting developers and investors, using innovations from the fron-tier as examples. Examples from the frontier include private developers, who are using geospatial and other digital technologies to improve preparation of portfolios of mini grid projects, as well as public-sector programs that are taking advantage of such disruptive technologies to facilitate implementation of mini grid projects.
Governments can also use geospatial and other digital tools to catalyze deployment of mini grids led by the private sector to supply electricity to off-grid communities. For example, Nigeria’s Rural Electrifi-cation Agency is holding minimum subsidy tenders for portfolios of promising mini grid sites that it has identi-fied and for which it has collected market intelligence. The Rural Electrification Agency with support from the World Bank has developed an innovative protocol for mini grid site identification, screening, and analysis using geospatial tools—including a geospatial portfolio planning methodology to assess and select the communi-ties to be included in the minimum subsidy tenders—to prepare portfolios of mini grid projects and crowd in private-sector cofinancing.
FIGURE ES.5 Process for using geospatial analysis in least-cost electrification planning at the national level
Innovation from the frontier: least-cost electrification planning sequence.
Capacity building and knowledge transfer
Diagnostic and preliminary analysis
Data collection, mapping, and database preparation
Development of least-cost electrification plan
Reporting, data transfer, and dissemination
For more information on how to use geospatial analysis to develop national electrification plans, please see chapter 4 of the book (“Geospatial and Digital Tools for Electrification and Portfolio Planning”).

MINI GRIDS FOR HALF A BILLION PEOPLE32
REGULATING THE SECTOR AND MAKING IT EASIER TO DO BUSINESS
No single approach to regulating mini grids works best in all settings, and regulation has costs as well as benefits. ESMAP has developed a series of decision trees that present options for how to regulate mini grids and the conditions under which each option is suitable. The decision trees are not prescriptive. They can provide guidance to help regulators and policy makers make informed decisions in five regulatory areas: market entry, tariffs, technical specifications, service standards, and what happens when the main grid arrives in the service area of a mini grid. The decision tree for main grid arrival options is presented in this section; the main report presents decision trees for the other four regulatory areas in chapter 11. Table ES.7 briefly summa-rizes the focus of each of these decision trees.
The approach to regulation should be light handed, based on the following principles (Tenenbaum and others 2014):
• Minimize the amount of information required by the regulator.
• Limit the number of separate regulatory processes and decisions.
• Use standardized documents and forms.
• Acknowledge and draw on related decisions made by other government or community bodies.
At the same time, regulations should evolve as the mini grid market matures. As the market matures, mini grids evolve from marginally viable competitive entrants to potential monopoly providers of essential services. In early stages, overly stringent regulation can choke the sector’s growth; in later stages, however, closer regulation is usually necessary to protect customers. Regulators can manage the regulatory evolution required of this sector by defining its growth phases and spelling out, in advance, the regulations that will apply at each stage.
TABLE. ES.7 Overview of ESMAP decision trees on options for mini grid regulation
Decision Tree Topic OverviewArrival of the main grid (see figure ES.6)
This decision tree provides options for what happens when the main grid arrives in the service area of a mini grid, including operating as a small power distributor (SPD) or small power producer (SPP).
Market entry This decision tree provides options for regulating entry of mini grid developers into the market and indicates the conditions under which one of the four entry regulation options (registration, permitting, licensing, or no regulation of entry) would be most appropriate. The first branches of the tree are determined by what is legally required to operate as a mini grid business and how much control the regulator wishes to exert on who enters the market.
Retail tariffs The options presented in this decision tree depend on the availability and type of subsidies and whether or not a uniform national tariff is required. The five options include willing buyer-willing seller tariff-setting schemes, efficient new entrant price caps, individualized cost-based tariff limits, bid tariffs, to uniform national tariffs.
Service standards The first branches of this decision tree are determined by the maturity of the mini grid market (less stringent service standards may be more acceptable in more nascent markets) and the availability of subsidies. The options for regulating service standards orange from no service standards, to reporting standards, to differentiated standards, to uniform mini grid-specific standards, to grid-level standards.
Technical standards This decision tree presents the options for regulating technical standards, and the first branches of the tree are determined by whether future integration of mini grids with the country’s main grid is expected. The options for technical standards range from safety standards only, to mini grid-specific, to optional grid-compatible standards, to mandatory grid-compatible or main-grid standards.

MINI GRIDS FOR HALF A BILLION PEOPLE 33
Several countries are developing mini grid–specific regulatory frameworks that support private-sector investment. Across Asia and Africa, countries like Bangladesh, Cambodia, India, Kenya, Nigeria, Rwanda, Tanzania,11 and Zambia have developed regulatory frameworks for mini grids that address key issues.
A formal regulatory agency does not need to be in place to make these decisions. Regulatory decisions can be embodied in a legal contract between the developer and a government authority tasked with oversight of the mini grid. Bangladesh and Myanmar offer two examples of this approach.
In countries that have established formal regulatory agencies, these entities can play an important role in guiding the mini grid sector forward. For example, in Cambodia, the Electricity Authority of Cambodia (EAC) played an important role throughout the lifecycle of the mini grid sector. It provided very light regulation at the initial phase through the requirement for developers to register with the EAC, and became much more prescriptive when the sector was well established through, for example, the introduction of a universal tariff. The EAC ensured that this lower tariff regime was balanced with sufficient compensation through the Rural Electrification Fund.
There are generally four options for regulating how mini grids can enter the market:
• Decide not to regulate market entry.
• Require that mini grids register with the appropriate government entity.
• Require that mini grids obtain a permit, typically granted by the regulator, to operate.
• Require that mini grids obtain a license, typically granted by the regulator, to operate.
Chapter 11 of the main report provides country-specific examples of these options, but in general, registration, permitting, and licensing require increasing levels of information from the developer and review from the reg-ulator. In some countries, mini grids of different sizes have different market entry requirements (for example, smaller mini grids need only to register, whereas larger mini grids must obtain a permit or license).
Analysis of different countries’ regulatory frameworks for mini grids revealed five approaches to regu-lating mini grid retail tariffs:
• willing buyer/willing seller
• efficient new-entrant price cap
• bid tariff
• individualized cost-based tariff limits
• national uniform tariff.
The uniform national tariff option is viable only if significant and sustainable subsidies are available—some-thing that requires commitment from the government to ensure that the funds are available to the implementing parties in a transparent and predictable measure. Ghana is an example of a country that requires mini grids to adhere to the national uniform tariff. The choice among the other four options, each of which can in theory enable mini grid developers to recover their costs, depends on the capacity of the regulatory agency and the importance the government gives to reducing the risk of monopoly pricing, compared with the emphasis the government places on driving rapid expansion by minimizing red tape and allowing attractive returns on invest-ment. For example, Nigeria has adopted a willing-buyer, willing-seller approach to regulating tariffs for mini grids smaller than 100 kW, in part to stimulate rapid growth in the nascent mini grid market.
Regardless of which tariff regulation option is implemented, regulatory authorities should adhere to the following general principle when accounting for subsidies in their regulation of retail tariffs: If a subsidy is authorized, mandated, provided, or allowed by the government, the regulator should not take

MINI GRIDS FOR HALF A BILLION PEOPLE34
actions that would nullify or reduce the effect of the subsidy. Instead, the regulator should take regulatory actions that help to ensure that the subsidy is delivered to its intended target as efficiently as possible. The regulator, however, should periodically inform the government of the costs and benefits of the subsidy (Tenenbaum and others 2014, 122).
With regard to service standards, regulatory authorities generally follow one of the following approaches:
• Require only that developers report their service levels.
• Develop and enforce standards that are specific to a particular mini grid or portfolio of mini grids.
• Develop and enforce standards that are uniform for all mini grids.
• Require mini grids to adhere to the same standards as the main grid.
Requiring main grid–level standards is typically possible only if subsidies are available. The choice among the other options depends in part on the level of the regulatory agency’s administrative capacity. Nigeria and Peru are two examples of countries that have set different service standards for different types of mini grids. In Nigeria, mini grids smaller than 100 kW can choose to follow the recommended service standards while more stringent standards are mandatory for larger mini grids. In Peru, different service standards apply to mini grids serving rural or urban areas.
In addition to setting service standards, regulators also set technical standards for mini grids, of which the options are generally as follows:
• Set minimum safety standards only.
• Set mini grid–specific standards.
• Set optional main grid–compatible standards.
• Set mandatory main grid–compatible standards.
• Set main grid standards.
The choice of option depends on the availability of subsidies (higher standards typically require subsidies) and what happens when the main grid arrives (main grid–compatible standards are the minimum for enabling mini grids to interconnect with the main grid). A growing number of countries require mini grids to adhere to main grid–compatible standards. Bangladesh, Cambodia, Kenya, Nigeria, Sri Lanka, and Tanzania all require at least some types of mini grids (often those that are larger than a certain size) to be technically compatible with the main grid or to follow the main grid’s technical standards.
The arrival of the main grid is one of the biggest risks private mini grid developers face. Mini grid reg-ulations should explicitly state the options for what happens when the main grid arrives, and provide as much clarity as possible about how each option would be implemented (figure ES.6). There are six options for what happens when the main grid arrives in the service area of a mini grid:
• Allow the mini grid to operate as a small power distributor (SPD).
• Allow the mini grid to operate as a small power producer (SPP).
• Allow the mini grid to operate as an SPD and SPP.
• Allow the mini grid developer to sell its eligible assets to the utility.
• Allow the mini grid to coexist with the main grid.
• Require the mini grid to decommission and remove its assets.

MINI GRIDS FOR HALF A BILLION PEOPLE 35
FIGURE ES.6 Decision tree for determining what happens to mini grids when the main grid arrives
Policy objective to protect the distribution companies from competition
No policy objectiveto protect the
distributioncompanies from
competition
When themain grid
arrives
Integration with the main grid is essential
Integration with the main grid is desirable
Mini grids are built at grid-compatible standards
Mini grids are not built at grid-compatible standards
Dominant generation tech-nology is not competitivewith generation from themain grid
Dominant generation technology is competitivewith generation from the main grid
Mini gridsoperate under
contractwith the main
grid fromthe start
Assetbuyout
option thatcan be
exercisedby the
main grid
Option toconvert to
small powerdistributor (SPD) plus
small powerproducer
(SPP)
Option toconvert to
SPD
Distributionnetworkbuyout
option thatcan be
exercisedby the
mini grid
Option toconvert toSPP and
distributionnetworkbuyout
Option toconvert toSPP and
SPD
Assetabandonment(possibly withcompensation
for loss ofvalue)
Coexistencewith the main grid
(possibly withcompensation
for loss ofvalue)
For more information on di�erent options for mini grid regulations and reducing red tape for mini grid businesses, please refer to Chapters 11 and 12 in the book, respectively.
For more information on regulating mini grids and reducing red tape, see chapters 11 and 12 of the book (“Workable Mini Grid Regulations” and “Enabling Business Environment”).

MINI GRIDS FOR HALF A BILLION PEOPLE36
The SPP, SPD, and SPP+SPD options require the mini grid to have been built at least to main grid–compatible standards. The asset buy-out option requires a credible compensation mechanism in order to be workable for private-sector mini grid developers. More and more countries are implementing regulations that specify options for when the main grid arrives in the service area of mini grids, including Bangladesh, Cambodia, India (Uttar Pradesh), Nigeria, Rwanda, Tanzania, and Zambia.
Compatibility and interconnection with the grid depend on utilities’ capacity to effectively understand, operate, and absorb the value of mini grids. To connect half a billion people to mini grids by 2030, regula-tions for mini grids and utilities will need to consider mini grids as a complementary resource to utility services (necessitating technical requirements for both utilities and mini grids to enable interconnection). At the same time, regulators will need to be aware that utilities may perceive mini grids as undesirable competition. As a result, regulations should avoid placing utility companies in gatekeeper roles, such as giving utilities the sole authority to identify mini grid service areas, and should specify as clearly as possible how interconnection options are to be implemented.
Two regulatory innovations can further incentivize private-sector investment in mini grids:
• regulation by contract, in which mini grid regulations are embodied in a legal contract
• an arbitration-style appeal mechanism, in which an independent entity or tribunal can be asked to review a regulator’s decisions, with the authority to overturn the regulator’s decision
The goal of a regulatory framework for mini grids should be to promote good service at the lowest cost-recovery tariffs. Pursuit of this goal throughout the stages of development of a country’s mini grid sector—taking into account subsidies and the broader national electrification strategy—requires a regulatory framework that is predictable but flexible enough to evolve as the market does.
Innovative solutions that cut down on red tape and make it easier for mini grid developers to do busi-ness include the following:
• A handful of countries have developed standardized templates for key bureaucratic processes that affect mini grids, including standardized power purchase agreements, which define the terms under which mini grid developers sell electricity to the main grid, and standardized environmental and social management systems, which identify when mini grid developers obtain environmental approvals.
• Technology platforms are emerging to connect developers with investors and suppliers and to run large-scale mini grid tenders. These platforms significantly increase market efficiencies.
• In countries where the absence of a formal regulator increases the risk that mini grid developers face multiple layers of government oversight, governments can formally delegate oversight authority to a single entity—usually the local government or a government agency that provides grants or subsidies to mini grid developers (such as a rural electrification agency).
• Introduction of e-government can reduce overhead cost for business registration, land and building permits, and environmental approvals. The World Bank’s Doing Business reports provide a good overview of the level of red tape one can expect in a country.

MINI GRIDS FOR HALF A BILLION PEOPLE 37
STRENGTHENING THE INSTITUTIONAL MODEL AND FRAMEWORK
National-level institutions are supporting the scale-up of mini grids as a key element of electrification strategies. Haiti’s Ministry of Public Works has developed a special unit, the Energy Cell, to implement a World Bank–funded project to deploy mini grids in more than 50 municipalities. Nigeria’s Rural Electrifica-tion Agency is implementing the largest mini grid program in Africa, targeting 850 mini grids by 2025, out of an estimated potential market of 10,000 sites. Regulatory agencies in Haiti, Nigeria, Rwanda, Zambia, and several other countries have teams dedicated to mini grids. Ministries, national utilities, and rural electrification agencies are collaborating on national electrification plans, as in the examples from Kenya, Nigeria, Myanmar, and Rwanda mentioned earlier.
National electrification policies are specifying the link between gender equality and uptake of off-grid solutions. Countries like Ethiopia in their national electrification policy recognize the challenges affecting women’s participation in the off-grid sector and have integrated support for female entrepreneurs, wholesalers, and distributors as well as women as users through trainings, communication campaigns and credit lines.
ESMAP’s research identified four characteristics of an institutional framework that can support mini grids, given the diversity in potential mini grid delivery models. The most common delivery models for mini grids are build-own-operate, public–private partnerships, concessions, utility models with and without private-sector involvement, and cooperative models. Strong institutional frameworks that can accommodate the diversity in delivery models have the following characteristics:
• Governments recognize mini grids as a desirable and viable electrification option.
• Government institutions support mini grid development through their actions and decisions.
• The institutional framework is flexible enough in principle to support a variety of mini grid delivery models.
• The framework minimizes duplication of oversight and conflicting roles.
Many entities are part of the institutional framework that affects mini grids. They include ministries of energy, labor, finance, and the environment; the national utility; the energy regulator; the rural electrification (or energy) agency; the environmental agency; the bureau of standards; energy associations; local development banks and financial institutions; social agencies and nongovernmental organizations (NGOs); customs author-ities; and international development banks and development partners. Figure ES.7 provides an example of the ecosystem of institutions that typically affect mini grid developers.
Government agencies are well positioned to increase the productive uses of electricity in agricultural, industrial, and service sectors. In Bangladesh IDCOL has improved the economics of mini grids through load-promotion efforts that include education about the benefits of switching from diesel engines to electric motors for agricultural milling. Mini grid regulations in Tanzania allow mini grid developers to finance custom-ers’ productive-use equipment through on-bill financing.
Adopting a comprehensive, multistakeholder approach can increase the impact of government efforts to promote productive uses of electricity. Government-led initiatives can include enhancing the knowledge and skills of small and microbusinesses on how to use newfound electrical and motive power for profitable enterprise, enhancing the technical and financial management capacity of women’s enterprises, strengthening access to markets, creating linkages and access to financial products and services, and enhancing extension or business development services. The combined impact of these efforts exceeds the impact of any single ini-tiative or focus area on its own; many stakeholders and partners can be actively engaged, such as local NGOs and microfinance institutions.

MINI GRIDS FOR HALF A BILLION PEOPLE38
FIGURE ES.7 Sample institutional framework affecting mini grid developers
EnvironmentalAgency
RuralElectrification
Agency
Governmentinstitution indeveloper
base country
Develop programs in conjunction with
Institute research programs
Collarborates with
Set locally relevantpolicies andimplement programs
Determines budgetsand avails grants
Determines internationalplaying field
Ministry ofFinance
Ministry ofEnergy
Mini GridDeveloper
National institutions International institutions
Developmentbank
Donors
Developmentpartner
Regulator
Nationalutility
Determinelocalregulations
Development partners can support institutional frameworks that promote private-sector approaches to mini grid development. Development partners can act as knowledge brokers of best practices, assist national or regional administrations in building the capacity of all relevant agencies, and assist in designing and implementing monitoring and evaluation programs to track the deployment of mini grids, among other supporting activities.
BUILDING HUMAN CAPITAL AND ENGAGING THE COMMUNITY
Scaling up mini grid deployments will be possible only if human capital keeps pace with financial capital. Innovative technologies and initiatives have emerged to train the stakeholders needed to support a thriving mini grid industry. ESMAP has identified almost 50 training programs for key stakeholder groups in the mini grid ecosystem, including developers, financiers, policy makers, and regulators. Many of these courses rely on new technologies (box ES.2). For example, LED Safari’s flexible curriculum design and remote Web-based training enables developers and governments to develop high-quality, reputable certification programs. Comprehensive training programs that follow a train-the-trainer approach, such as the IEEE Smart Village’s Comprehensive Training Program, can provide training to thousands of people. These programs seek to create a skilled, knowledgeable ecosystem of stakeholders that can support the rapid scale-up of mini grids.
Capacity needs assessments are a critical early step in designing training and skills-building initiatives. They reveal gaps in key areas, including technical expertise, management skills, institutional capacity, policy frameworks, partnerships, knowledge, and implementation know-how. Needs assessments generally follow a four-step process—identifying key actors, determining the project’s or portfolio’s capacity needs, assessing exist-ing capacity, and identifying capacity gaps—that can be carried out through a mixed-methods approach using existing data or data collected from key informant interviews, focus group discussions, and surveys.
For more information on the institutional frameworks affecting mini grids and mini grid delivery models, see chapter 10 of the book (“Institutional Framework”).

MINI GRIDS FOR HALF A BILLION PEOPLE 39
Knowledge and skills gaps exist in every stakeholder group in the mini grid ecosystem. Trainings are therefore needed at the national, project, portfolio, and community levels. National-level trainings can focus on policy and regulation; planning; monitoring; and technical certifications that are relevant for mini grid construction, operations, and maintenance. Project- and portfolio-level training can build developers’ capacity in site assessment, feasibility studies, construction, operations, and maintenance. Community-level trainings can increase awareness and understanding of mini grid services, increase the uptake and use of productive- use appliances, and prioritize skills building for women.
In parallel, community engagement strategies can help increase productive uses of electricity and stimulate demand for mini grid services. Two innovations have the potential to reduce costs and improve the effectiveness of community engagement initiatives:
• ESMAP worked with Quicksand Design Studio to pilot a smartphone app and accompanying online You-Tube–like platform called Mini Grid Stories. The app-website platform lets developers engage with com-munities at very low cost. Following simple on-screen instructions, mini grid customers and staff of mini grid companies use the free smartphone app to create short videos—on how a customer uses electricity in her small business, for example—and upload them to Mini Grid Stories, where the videos can be viewed, shared, and downloaded. The approach was inspired by the success of the agricultural Web-based plat-form Digital Green, which uses videos for agricultural extension work. Studies have found that Digital Green reached 24 percent more farmers than traditional agricultural extension approaches, resulted in 35 percent higher uptake of promoted practices, increased women’s access to extension information by 20–25 percent, and was 10 times more cost efficient than traditional community engagement services on a cost-per-adoption basis (Abate and others 2018).
• The Rockefeller Foundation launched Smart Power India (SPI), a comprehensive community engagement initiative, to bring electricity to 1,000 villages and 1 million Indians (Muther 2016). This India-based, Indian-led organization intermediates between key stakeholders, including developers, national and local government entities, and community organizations (Rockefeller Foundation 2017). SPI’s approach is called “Community Engagement, Load Acquisition and Micro-enterprise Development” (CELAMeD). With SPI support, develop-ers have crafted communication and marketing strategies to inform consumers about the benefits of renew-able energy and catalyze the growth of rural businesses (Smart Power India 2017). SPI has supported the installation of more than 100 mini grids, affecting more than 40,000 people (Rockefeller Foundation 2017). One developer working with SPI trained more than 140 potential and existing entrepreneurs; 30 percent were women, 40 percent set up new businesses, and 20 percent expanded their existing businesses (Smart Power India 2016).
Experience from successful mini grid developers indicates that community engagement begins by raising awareness before moving to adoption, productive operation, and word-of-mouth marketing. Community engagement requires a flexible approach; a clear understanding of the local socioeconomic and cultural characteristics; and tailoring of promotional tools, materials, and channels.12 Table ES.8 summarizes the key community engagement activities for each phase of the typical mini grid project cycle.
The benefits of prioritizing access to female-led households and small businesses and increasing the participation of women in management positions in mini grid businesses are clear. Mini grids can significantly increase women’s productivity, particularly in female-dominated, labor-intensive agricultural and food-processing activities. Women are 9–23 percent more likely to gain employment outside the home follow-ing electrification (Smith 2000). Electrification can reduce fertility levels, through greater exposure to television (Buckley 2012). Electrifying health clinics for lighting and the refrigeration of medication has an especially ben-eficial impact on maternal health. Mini grid projects can create jobs for women while shaping new community decision-making and leadership models by placing women in leadership roles.

MINI GRIDS FOR HALF A BILLION PEOPLE40
Design and Planning Promotion and informationFinancing and procurement
Implementation and construction
Registration and connection
Operation and maintenance
Obj
ectiv
es
Obtain prospective user and situational information:• Customer
expectations• Current energy use• Geographic conditionsPrepare a mini grid design that is: • Socially inclusive
(tariff structure, meeting expectations)
• Technically sound (load distribution and likely future demand)
• Financially viable (cost-covering tariff)
Increase community-level awareness of energy access issuesProvide relevant information (e.g., potential productive uses) and raise active interest to promote early buy-in and sign-upAssist prospective customers in their registration decision with specific, detailed information (sign-up, tariff, payment methods, etc.)
Establish a clear financial model to determine ideal public/private-sector investment needPrepare a project document showing: financial structuring, risk assessment and mitigation, financing partners, adherence to regulatory aspectsCarry out procurement based on proper tender documents and transparent process
Construct a robust, appropriately sized and scalable mini gridInclude provisions for potential future expansion (e.g., modular construction)Install simple control systems to manage demand levels
Secure viable customer base with (fairly) secured power loadIdentify anchor customers in advance and secure connections
Ensure reliability of services, maximizing benefits of investmentEnsure functionality and domestic and productive benefits (potentially offering household and/or productive use appliances for sale or lease)Strengthen and incentivize local service capacitySpecify cost-effective maintenance program, with engaged local service providers
Targ
et g
roup
s CommunityLocal leaders and authoritiesFinancial institutionsLocal and national government agencies
Community membersProductive users
Financial institutions, investors, local and national government agencies
Experienced service providersLocal businesses and laborers
HouseholdsLocal businesses and start-upsOperating companies
HouseholdsLocal businesses and start-upsOperating companies
Cha
nnel
s
Meetings with local institutions, stakeholders, and community
Campaign:Local radio, newspaper, social media, brochuresCommunity meetingsCSC
Meetings with local and national finance institutions and local government
Community meetings ICT for connectionsSocial media, user videoCSC
ICT for connections ESCO officeCSC
Act
ors
Project developer, ESCO staff, CE manager and teamLocal authorities, lead community members
Project developer, ESCO manager, CE teamLocal media
Project developer, ESCO manager, local banks
Project developer, ESCO manager, local technicians and laborers
ESCO manager and staff, CE manager and team
ESCO manager and technical staffCE manager
Com
mun
ity e
ngag
emen
t
Carry out a community scan to assess WTP/ ATP and expectations of potential customers, particularly if the ABC approach is followedEnsure women’s participation in all design and planning activitiesEngage on local permits and approvalsDevelop a client portfolio (ABC segmentation)Local HR inventoryEngage on land acquisition or right of use
Carry out a promotion and information campaign regarding mini grid servicesIncrease consumers “energy education” on such aspects as reading the bill, maintenance, grievance handling, safety aspects, health benefitsFinalize customer segmentationPotentially carry out impact video showsAttract, organize and include women in promotion and sales activitiesMobilize women’s networks to disseminate mini-grid information
Finalize WTP/ATP assessmentsFinalize market segmentation (ABC customers)Finalize the tariff structureMobilize women’s finance networks to make investment financing for female-run households and businesses available
Recruit local HREngage with future stakeholders (ABC clients, local authorities)Offer gender differentiated user training on O&M and productive use opportunities
Continue community dialogue to stimulate inclusionCarry out a PUE inventoryCarry out a community service inventory
Continue community dialogue to monitor customer satisfactionPromote PUE extensionPrepare impact documentation (including video) and sharingCarry out O&M trainingAs needed, implement conflict mediation
Note: ABC = Anchor-Business-Community; CE = community engagement; CSC = community service center; ESCO = energy service company; HR = human resources; ICT = information and communications technology; O&M = operations and maintenance; PUE = productive uses of energy; WTP/ATP = willingness to pay/ability to pay.
TABLE. ES.8 Key community engagement activities through mini grid project phases

MINI GRIDS FOR HALF A BILLION PEOPLE 41
Developing a database of 50 training courses for mini grid stakeholders
ESMAP has developed a database of more than 50 training courses and entities that provide trainings that are relevant to the mini grid sector. These training programs are available all over the world—and many can be delivered remotely. They target policy makers and regulators, developers, engineers, and operators. Most of the training programs provide a formal certificate upon satisfactory completion of the course.
BOX ES.2
For more information on training and skills building for mini grid industry stakeholders, see chapter 9 of the book (“Training & Skill Development”). For insights on how to engage with communities, see chapter 6 (“Community Engagement”).

MINI GRIDS FOR HALF A BILLION PEOPLE42
INCREASING ACCESS TO FINANCE
Private investors—both domestic and international—are financing third-generation mini grids and driv-ing innovation in financing mechanisms. Private financiers invested $259 million in developers building mini grids in low-income countries between 2013 and 2018, mostly as equity (BNEF 2019). Impact investors and commercial investors, as well as local and national banks, have developed equity, debt, and blended finance options to help developers scale up their mini grid business. Acumen, Bamboo Capital Partners, Crossbound-ary Energy, InfraCo Africa, and Shell Foundation are just a few exa smples of recent investors in mini grids.
Development partners, including the World Bank, have increased financing for mini grids, from millions of dollars in the 2000s to billions of dollars in 2018. A group of 15 major international donors and devel-opment partners, including the World Bank, has collectively committed more than $1.3 billion just to mini grid investment (that is, excluding funding for technical assistance and research). Six of these organizations have investment commitments for mini grids that total more than $100 million: AFD, AfDB, DfID, GIZ, the Islamic Development Bank, and the World Bank. Moving from commitments to disbursements and investments, however, will require sustained efforts and close collaboration with governments and the private sector. Donor support to mini grids covers slightly more than 10 percent of the $12.4 billion total planned investment in mini grids globally, according to ESMAP’s analysis of funding commitments from donors and development partners.
The World Bank has committed more than $660 million to mini grids over the next five to seven years. As of June 2019, its mini grid portfolio consisted of 37 projects in 33 countries (29 approved by the World Bank Board and 8 under preparation). The investment plans of this portfolio project the deployment of 2,200 mini grids by 2025, with the expectation of bringing electricity to nearly 6 million people. Even more important than the direct impact is the expected crowding in of private-sector development and investment, which is expected to leverage $1.1 billion of cofinancing from private-sector, government, and development partners.
In the 33 countries in the World Bank’s mini grid portfolio, the Bank’s investment commitment rep-resents on average about 25 percent of the total investment in mini grids in each country from govern-ments, the private sector, and development partners. On a demand basis, the World Bank will continue to provide support for well-designed, new energy-access projects that included mini grid investments. In the broader context, the upscaling of financing in the sector will need the involvement of the World Bank, develop-ment partners, and governments, at least at the same level of engagement over the next five years, in order to create the leverage for exponential private-sector involvement. In the longer run, the percentages of public funds compared with overall investment should taper off with the growth of private-sector investment.
Private mini grid developers typically face five main barriers to accessing finance:
• Many potential private financiers do not have experience lending to mini grids or even small-scale infra-structure projects, so they consider mini grids as too risky. For example, they are not aware of the improved revenue collection methods, where the developers use remote-controlled prepay meters.

MINI GRIDS FOR HALF A BILLION PEOPLE 43
• Developers often cannot charge tariffs that cover all of their costs because many potential consumers are unable to pay the full costs of mini grid electricity, and some regulatory frameworks require mini grids to adhere to the same national uniform tariff as the main grid.
• Local for-profit and community developers often lack the financial resources to meet the equity require-ments imposed by conventional lenders.
• Local debt financiers are often unable to provide loans with long-term tenors because their business model revolves around short-term deposits and lending.13
• Uncertainty about future macroeconomic conditions—particularly regulatory risks, exchange rates, interest rates, and the economic growth rate—discourages investment.
Governments and their development partners are preparing packages of financial support for mini grid developers that help them overcome these barriers and finance the scale-up of mini grid deployments. Different financing packages—consisting of different combinations of equity, debt, subsidy, and risk-sharing mechanisms—are required for different types of mini grid developers. Larger international and local firms tend to have significant access to equity and debt; smaller, mostly local firms usually do not. Female-led enterprises and project developers may require an expanded support package, as women often face additional barriers to accessing finance.
Three innovations in equity investment for mini grids are emerging:
• equity crowdfunding, in which developers offer small amounts of equity to a large number of investors through an online platform
• mezzanine finance (such as convertible notes), in which a lender has the right to convert its loan to an equity stake in the company
• socially oriented equity investment, in which investors take an equity stake in a company but accept a lower financial return in exchange for demonstrable social impact
One common debt facilitation intervention in donor-supported projects is an upfront credit line. In this multitier lending mechanism, the government receives funds from development partners, such as the World Bank, selects qualified participating financial institutions (PFIs) interested in financing mini grids, and on-lends the development partner funds to the PFIs in local currency using loans with a long tenor and market-conform-ing interest rates. The PFIs then lend to mini grid developers using loans denominated and repaid in local cur-rency, with market-conforming interest rates and loan tenors that are longer than what is locally common. The PFIs assume the commercial risk for the loan, repaying the government even if the mini grid developer fails to repay the loan, except in cases where the loan is packaged with a guarantee mechanism, which can also be an option. Box ES.3 presents an example of a government-backed debt facility in Bangladesh.
Two debt-financing innovations have recently emerged for private-sector mini grids:
• In a convertible note, a loan can be converted into equity on terms that are favorable to the lender, thereby reducing the loan’s interest rate.
• In peer-to-peer lending, a mini grid developer borrows, without collateral, from a group of individuals or institutional lenders, using an online lending platform.
Four types of subsidies can help mini grid developers and customers finance their costs:
• pre-investment subsidies, such as market and resource assessments, geospatial planning, prefeasibility and feasibility studies, and technical assistance
• capital cost subsidies, preset as a share of “reasonable” capital costs or based on lowest-subsidy bids
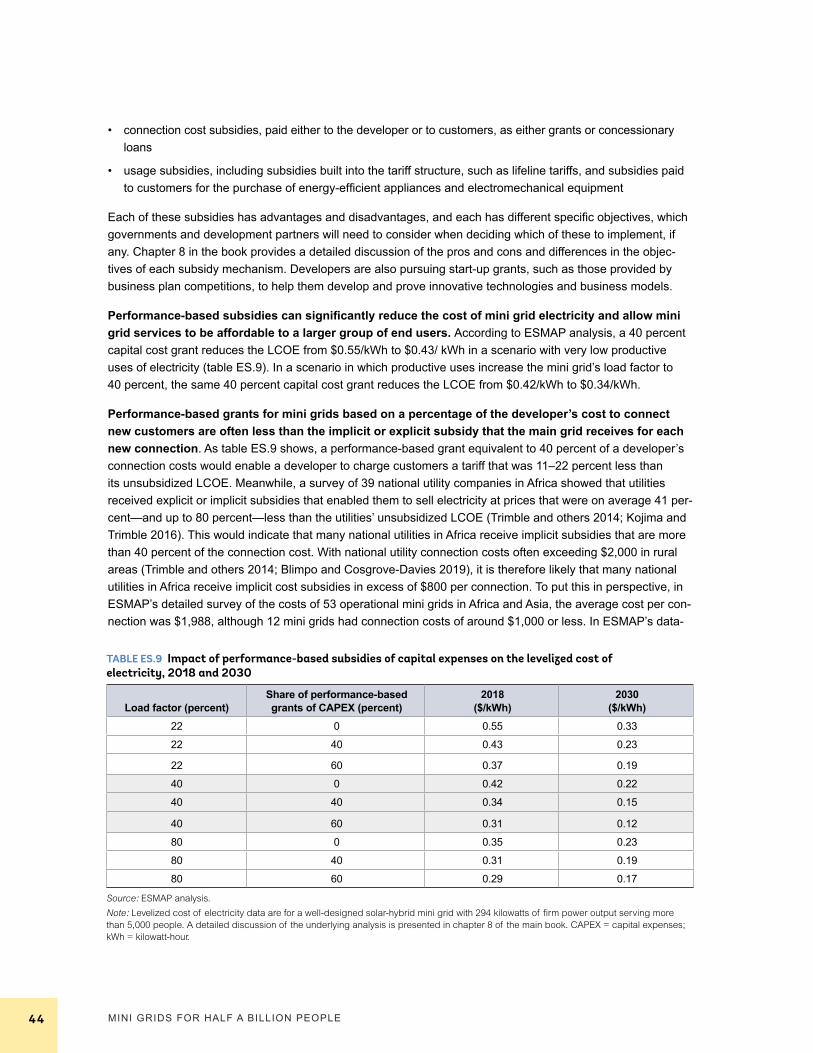
MINI GRIDS FOR HALF A BILLION PEOPLE44
• connection cost subsidies, paid either to the developer or to customers, as either grants or concessionary loans
• usage subsidies, including subsidies built into the tariff structure, such as lifeline tariffs, and subsidies paid to customers for the purchase of energy-efficient appliances and electromechanical equipment
Each of these subsidies has advantages and disadvantages, and each has different specific objectives, which governments and development partners will need to consider when deciding which of these to implement, if any. Chapter 8 in the book provides a detailed discussion of the pros and cons and differences in the objec-tives of each subsidy mechanism. Developers are also pursuing start-up grants, such as those provided by business plan competitions, to help them develop and prove innovative technologies and business models.
Performance-based subsidies can significantly reduce the cost of mini grid electricity and allow mini grid services to be affordable to a larger group of end users. According to ESMAP analysis, a 40 percent capital cost grant reduces the LCOE from $0.55/kWh to $0.43/ kWh in a scenario with very low productive uses of electricity (table ES.9). In a scenario in which productive uses increase the mini grid’s load factor to 40 percent, the same 40 percent capital cost grant reduces the LCOE from $0.42/kWh to $0.34/kWh.
Performance-based grants for mini grids based on a percentage of the developer’s cost to connect new customers are often less than the implicit or explicit subsidy that the main grid receives for each new connection. As table ES.9 shows, a performance-based grant equivalent to 40 percent of a developer’s connection costs would enable a developer to charge customers a tariff that was 11–22 percent less than its unsubsidized LCOE. Meanwhile, a survey of 39 national utility companies in Africa showed that utilities received explicit or implicit subsidies that enabled them to sell electricity at prices that were on average 41 per-cent—and up to 80 percent—less than the utilities’ unsubsidized LCOE (Trimble and others 2014; Kojima and Trimble 2016). This would indicate that many national utilities in Africa receive implicit subsidies that are more than 40 percent of the connection cost. With national utility connection costs often exceeding $2,000 in rural areas (Trimble and others 2014; Blimpo and Cosgrove-Davies 2019), it is therefore likely that many national utilities in Africa receive implicit cost subsidies in excess of $800 per connection. To put this in perspective, in ESMAP’s detailed survey of the costs of 53 operational mini grids in Africa and Asia, the average cost per con-nection was $1,988, although 12 mini grids had connection costs of around $1,000 or less. In ESMAP’s data-
TABLE ES.9 Impact of performance-based subsidies of capital expenses on the levelized cost of electricity, 2018 and 2030
Load factor (percent)Share of performance-based grants of CAPEX (percent)
2018 ($/kWh)
2030 ($/kWh)
22 0 0.55 0.33
22 40 0.43 0.23
22 60 0.37 0.19
40 0 0.42 0.22
40 40 0.34 0.15
40 60 0.31 0.12
80 0 0.35 0.23
80 40 0.31 0.19
80 60 0.29 0.17
Source: ESMAP analysis.Note: Levelized cost of electricity data are for a well-designed solar-hybrid mini grid with 294 kilowatts of firm power output serving more than 5,000 people. A detailed discussion of the underlying analysis is presented in chapter 8 of the main book. CAPEX = capital expenses; kWh = kilowatt-hour.

MINI GRIDS FOR HALF A BILLION PEOPLE 45
base of more than 7,500 planned mini grids, the average connection cost was $2,175. A performance-based grant equivalent to 40 percent of a mini grid developer’s connection costs, therefore, would represent about $400–$900 per connection.
Performance-based financing can help mini grid developers cover the viability gap but needs to account for gender equity issues. In recent years, many governments have provided output- or results-based subsidies. Some award grants are on a per-connection basis, paying developers a fixed amount for each new connection they serve over a minimum time period (for example, Nigeria’s Rural Electrification Agency is using it as part of the World Bank–supported Nigeria Electrification Project—see box ES.3). Per-connection subsidies can also be combined with support for connecting productive-use customers, as Haiti’s Ministry of Public Works is planning to do as part of the World Bank––and Scaling Up Renewable Energy Program––supported Renewable Energy for All project. However, mechanisms to support customer connections need to pay attention to equity issues related to gender. If connection charges are too expensive for female-headed households, or if connecting to the mini grid requires a land title or proof of collateral, the benefits of mini grid electricity will not reach male and female customers equally.
Performance-based grants should be applied with caution, however, as relying exclusively on final out-put makes it difficult for developers to finance their upfront capital costs. Therefore, it is reasonable to des-ignate some intermediate results—such as purchase orders or the arrival of goods on site—as a basis for early subsidy payments. Capital cost subsidies can also dilute the benefits of increasing productive uses of electricity. Although the combined impact of grants and productive uses on the LCOE is typically greater than either on its own, their cumulative impact can increase the LCOE when OPEX costs are large relative to CAPEX.14
It is important that any subsidy scheme has an exit/taper policy. The need for subsidies should decline over time, as a result of at least the following three factors:
• Experience should allow financiers to assess risks more accurately, reducing the risk perception. Thus, the availability of debt and equity finance is likely to grow.
• The need for pre-investment subsidies should fall as mini grid developers become active in particular markets.
• Costs are likely to fall as firms gain experience and the scale of the industry increases.
However, as mini grids move into poorer, more remote areas, affordability may be lower, reducing the ability to taper subsidies.
Interventions to mitigate risks comprise the fourth pillar of a successful financing package to support the scale-up of mini grids. Three interventions to do so follow:
• risk-sharing schemes, such as first-loss, pari passu, and last-loss guarantees
• political risk guarantees or insurance schemes
• financial instruments that reduce foreign exchange risks, such as full or partial foreign exchange hedges (in which the exchange rate is locked in for all or part of the duration of the investment) or insurance instru-ments covering these risks
Experience with these interventions has been limited in the mini grid sector. They would be very helpful in plan-ning large-scale mini grid development.

MINI GRIDS FOR HALF A BILLION PEOPLE46
Innovations from the frontier: results-based financing in Nigeria and government-backed debt financing in Bangladesh
Private-sector mini grids in Bangladesh can apply for grants and debt financing from the Infrastructure Development Company Limited (IDCOL), a government-owned financial institution that has received World Bank financial support. When conducting due diligence on a proposal, IDCOL consults with the Rural Electrification Board to check on when the main grid is likely to serve the proposed site. IDCOL also reviews other factors affecting project viability, including potential customers’ willingness to pay and the reasonableness of cost estimates. If a proposal is approved, IDCOL provides a grant of 50 percent of the capital costs. It can also provide loans for an additional 30 percent of the capital costs. Loans are for 10 years, with a 2-year grace period and an annual interest rate of 6 percent (below the market rate). IDCOL has provided $27 million to support 29 mini grids totaling 5.03 megawatts. Twenty mini grids are in operation, with the balance expected to come online by the end of 2019.
Nearly 80 million people in Nigeria lack access to electricity. To address this challenge, Nigeria’s Rural Electrification Agency (REA) is implementing the World Bank–supported Nigeria Electrification Project (NEP), which aims to scale up investment in mini grid and off-grid solutions. On April 15, 2019, the REA launched the mini grid and solar home system components of the NEP. The mini grid compo-nent aims to extend electricity services to 300,000 households and 30,000 enterprises in rural areas by 2023. This private-sector–led component provides viability gap subsidies to mini grid develop-ers under two funding windows. The first window will distribute viability gap subsidies to 250 sites selected by the REA through a minimum subsidy tender to help kick-start the industry at scale. Under the second window, developers can apply for performance-based grants of $350 per connection for sites of their choice on a rolling basis.
BOX ES.3
For more information on financing options for mini grids, see chapter 8 of the book (“Access to Finance”).

MINI GRIDS FOR HALF A BILLION PEOPLE 47
GLOBAL MARKET SNAPSHOT AND OUTLOOK TO 2030
The global mini grid market consists of more than 26,000 installed and planned mini grids in more than 130 countries around the world. ESMAP identified 19,163 mini grids in 134 countries and territories, serving almost 47 million people (table ES.10). Most of these mini grids are first- and second-generation mini grids, and approximately half of installed capacity is from diesel and other fossil fuel–powered generators, with hydro and solar accounting for an additional 20 percent and 13 percent, respectively. Another 7,507 mini grids are planned for development in 57 countries and territories, and most of these are third-generation mini grids.15 These figures are considerably higher than previous estimates from leading market research firms. Renewable energy is expected to have a larger share of generating capacity for planned mini grids, with hydro and solar accounting for 46 percent and 40 percent of planned capacity, respectively.
The number of mini grids built in 2014–18 that incorporate solar PV was twice as high as the number built in 2009–13. Over the same periods, about the same number of mini grids ran in whole or in part on diesel. The increase in solar projects reflects the decline in component costs for solar-hybrid mini grids, par-ticularly solar panels and batteries, which incentivized developers to include solar PV in their generation mix. Looking ahead, more than 85 percent of planned mini grid capacity will come from solar and hydro.
TABLE ES.10 Data on installed mini grid projects, by region
RegionNumber of mini grids
Number of connections
(millions)
Number of people
(millions)
Number of developers identified
Median capital cost
($/kW)
Total capacity
(MW)
Total investment (million $)
South Asia 9,339 2.9 16.2 537 1,850 298 632
East Asia and Pacific
6,905 2.9 12.1 4,158 4,379 1,721 8,236
Africa 1,465 3.0 14.9 479 6,668 783 3,966
Europe and Central Asia
594 0.1 0.3 56 5,015 1,007 5,050
United States and Canada
519 0.2 0.6 246 3,973 2,152 8,551
Latin America and Caribbean
283 0.7 2.7 188 3,800 456 1,632
Middle East and North Africa
31 0.1 0.1 17 3,387 32 110
Other Island Territories
27 > 0.1 > 0.1 9 3,986 31 125
Global total 19,163 10.1 46.9 5,690 4,410 6,481 28,302 Source: ESMAP analysis. Note: Data are scarce for the Europe and Central Asia, Latin America and Caribbean, and Middle East and North Africa regions, where there are likely to be significantly more mini grids than shown in the table. A detailed discussion of the data sources and analysis is presented in Chapter 2 of the main book. kW = kilowatt; MW = megawatt.

MINI GRIDS FOR HALF A BILLION PEOPLE48
Hybridizing existing diesel-powered mini grids represents a multibillion-dollar market opportunity. ESMAP estimates the installed capacity of the theoretical diesel mini grid market at 1.6–4.6 GW. Using an esti-mate of $5,100/kW for the investment costs of hybridizing diesel-fired mini grids, based on the actual costs of hybridizing diesel-fired mini grids in Kenya (Carbon Africa Limited and others 2015), the global market opportu-nity for hybridizing diesel mini grids is $8–$23 billion.
Five countries in the database have more than 1,000 installed mini grids: Afghanistan, Myanmar, India, Nepal, and China. As table ES.11 shows, Afghanistan has the most mini grids of any country in the data-base, with almost 5,000 installed mini grids. While the top-10 countries account for 89 percent of all installed mini grids, the top-two countries account for almost half (47 percent) of all installed mini grids. In Afghanistan, where NGOs have developed hundreds of small mini grids, the median mini grid size is 11 kW of installed capacity, serving 152 connections; in Myanmar, the median mini grid size is 15 kW, serving 79 connections; and in India, the typical mini grid—again using median values from ESMAP’s dataset—has an installed capac-ity of 32 kW and serves 123 connections.
Even with these positive trends, achieving universal access to electricity will require the construc-tion of more than 210,000 mini grids by 2030, connecting 490 million people at an investment cost of
TABLE ES.11 Country rankings for key indicators of installed mini grids
#Number of mini grids
Number of people
(millions, and % of
population)
Median capital cost (US$/kW)
Total capacity
(MW)
Total investment
(million US$)Number of developers
Developer portfolios (mini grids
per portfolio, and country)
1 Afghanistan(4,980)
Afghanistan(8, 21%)
Mexico($1,456)
United States(1,594)
United States($6,332)
Myanmar(3,986)
NPC-SPUG(750, Philippines)
2 Myanmar(3,988)
Philippines(7, 7%)
Chile($1,667)
Russia(671)
Russia($3,364)
Nepal(440)
UN Habitat(646, Afghanistan)
3 India(2,800)
India(6, <1%)
Afghanistan($1,850)
Canada(558)
Canada($2,219)
United States(217)
Aga Khan Development Network
(551, Afghanistan)
4 Nepal(1,519)
Madagascar(4, 14%)
Kenya($2,102)
China(472)
China($2,068)
Mali(124)
CARE International(543, Afghanistan)
5 China(1,184)
Tanzania(3, 5%)
DRC($2,320)
Philippines(397)
Philippines($2,035)
Peru(96)
RAO Energy(500, Russia)
6 Philippines(896)
D. R. Congo(3, 3%)
Uganda($2,435)
Australia(287)
Madagascar($1,167)
Burkina Faso (93)
BRAC(422, Afghanistan)
7 Indonesia(583)
Nepal(2, 6%)
Tanzania($2,680)
Japan(219)
Australia($1,092)
Cambodia(50)
Afghan Aid(344, Afghanistan)
8 Russia(501)
Myanmar(1, 3%)
Myanmar($2,707)
Madagascar(175)
South Korea($1,072)
Tanzania(47)
International Rescue Committee
(344, Afghanistan)
9 United States(391)
Peru(0.9, 3%)
Cambodia($2,986)
Tanzania(158)
Japan($958)
Afghanistan(42)
Swedish Committee for Afghanistan
(312, Afghanistan)
10 Senegal(272)
China(0.8, <1%)
Indonesia($3,000)
India(138)
Spain(487)
Haiti(36)
People in Need(221, Afghanistan)
Total(% global
total)
17,114(89%)
35.0(75%)
n.a. 4,668(72%)
20,794(73%)
5,131(90%)
4,633 mini grids(24%)
Source: ESMAP analysis.Note: kW = kilowatts; MW = megawatts; n.a. = not applicable.

MINI GRIDS FOR HALF A BILLION PEOPLE 49
almost $220 billion. Meanwhile, the current pace of mini grid development according to ESMAP’s analysis of mini grid projects in its database would see 31,143 mini grids serving 71.5 million people, at a total investment cost of $47 billion by 2030 (figure ES.8). This business-as-usual (BAU) scenario assumes that development in 2018–30 follows the same growth trajectory as the 2007–17 data in the ESMAP database.
The market outlook scenarios are informed by the latest research from the SDG7 tracking initiative. ESMAP constructed the universal access scenarios for the mini grid market between 2018 and 2030 using global projections from the 2019 Tracking SDG7 report (World Bank and others 2019), as well as data from its own database of more than 26,000 installed and planned mini grids, and from the International Energy Agency (IEA 2017). The main assumptions for the three scenarios beyond ESMAP’s BAU are as follows:
• The “SDG7 Tracking 2019: New Policies” scenario follows the latest SDG7 Tracking report’s “New Policies” scenario, in which current national electrification policies will continue and planned policies will be imple-mented through 2030, leading to 570 million people gaining access worldwide from all sources of electricity, which is projected to translate to a 92% global electrification rate. It also uses the IEA’s estimate that 26 percent of people gaining access will do so through mini grids at a cost of more than $3,500 per connection16 (IEA 2017). This scenario sees 147 million people connected to 64,000 mini grids at a total investment cost of $105 billion by 2030.
FIGURE ES.8 Number of people connected to mini grids under business-as-usual and universal access scenarios, 2018–30
Source: ESMAP analysis. Note: A detailed description of the underlying analysis is provided in chapter 2 of the main book. BAU = business as usual; ESMAP = Energy Sector Management Assistance Program; SDG7 = Sustainable Development Goal #7.
0
50
100
150
200
250
300
350
400
450
500Millions
Peo
ple
Con
nect
ed to
Min
i Grid
s
2018
ESMAP Survey: BAU
SDG7 Tracking 2019: Universal Access
2019 2020 2021 2022 2023 2024 2025 2026 2027 2028 2029 2030
SDG7 Tracking 2019: New Policies
ESMAP Mini Grid Outlook

MINI GRIDS FOR HALF A BILLION PEOPLE50
TABLE ES.12 ESMAP Mini Grid Outlook targets for number of mini grids that need to be built by 2030
YearCumulative number of mini
grids globallyAnnual number of mini grids required globallya
Annual number of mini grids required in
each of the 20 countries with the largest electricity
access deficitb
2018 baseline 19,163 About 1,000 10–50
By 2020 28,600 5,200 > 200
By 2025 78,000 14,200 > 500
By 2030 212,700 38,700 > 1,500Source: ESMAP analysis.Note: a. Number of mini grids in target year minus number of mini grids in previous year in ESMAP’s ESMAP Mini Grid Outlook. b. Based on allocating 80 percent of the annual number of mini grids added globally to the top 20 countries with the highest
electricity access deficit, which collectively account for about 80 percent of the global unelectrified population.
• The “SDG7 Tracking 2019: Universal Access” scenario uses the latest SDG7 tracking estimate that, to reach universal access, 1.2 billion people will need to gain electricity access between 2019 and 2030. It uses the IEA’s estimate that 35 percent of these people will gain access through mini grids at a cost of more than $3,300 per connection (IEA 2017). This scenario has almost 430 million people connected to more than 185,000 mini grids at an investment cost of more than $280 billion.
• The “ESMAP Mini Grid Outlook” scenario also uses the latest SDG7 tracking estimate that reaching univer-sal access will require 1.2 billion people gaining electricity access between 2019 and 2030. This scenario, however, builds on the costing analysis presented in this report, which projects significant cost reductions for mini grids by 2030. This scenario, therefore, uses a cost per connection of $2,175, which is the average across the 7,500 planned mini grids in ESMAP’s database and is closer to the cost per connection that BNEF uses in its universal access scenario (around $1,500) than current IEA connection cost projections (BNEF 2018). As a result of the projected lower costs, the “ESMAP Mini Grid Outlook” scenario assumes that mini grids are the least-cost option for 40 percent of the 1.2 billion people who will need to gain elec-tricity access by 2030. This scenario would see 488 million people connected to 213,000 mini grids at an investment cost of $217 billion.
The gap between the ESMAP BAU and universal access scenarios is vast. The “ESMAP Mini Grid Out-look” scenario suggests that reaching universal access will require connecting an additional 420 million people, investing an additional $170 billion, and building an additional 180,000 mini grids, over and above the “ESMAP Survey: BAU” scenario. Mini grids are just one of the three primary solutions to achieve universal access to electricity by 2030, alongside main grid extensions and solar home systems. The gap in investment and number of mini grids reported here is for those people who are best served by mini grids instead of main grid extension and solar home systems.
Achieving universal access to electricity will require a massive increase in annual mini grid deploy-ments. The required scale-up goes from tens to hundreds to thousands of mini grids a year (table ES.12) under the “ESMAP Mini Grid Outlook” scenario.
For more information on the current mini grid market and the outlook through 2030, see chapter 2 of the book (“Mini Grids Today: Where We Are, Where We Are Headed, and Where We Need to Go”).

MINI GRIDS FOR HALF A BILLION PEOPLE 51
MAKING IT HAPPEN
OVERARCHING SECTOR OBJECTIVES AND GOALS
Through a collaborative, iterative process, ESMAP and mini grid industry leaders—includ-ing AMDA and development partners—jointly identified five market drivers that will enable the sector to achieve its universal electrification targets:
• reducing the cost of solar-hybrid mini grids (which the other four market drivers will also support)
• increasing the pace of deployment through a portfolio approach to mini grid development
• providing superior-quality service
• leveraging development partner funding and government investment to crowd in private-sector finance
• establishing enabling mini grid business environments in key access-deficit countries.
Governments can support the industry, with assistance from development partners, including ESMAP, toward achieving clear and measurable targets for each of the five market drivers that will enable it to connect 490 million people by 2030. Targets for 2030 include the following:
• reducing the LCOE of mini grid electricity to $0.20/kWh
• building around 1,500 projects per key access-deficit country per year by 2030 and reducing the time it takes to build a mini grid to five weeks
• providing superior-quality service of more than 97 percent uptime by 2030 and increasing the industrywide average load factor to 45 percent
• attracting nearly $220 billion of investment from development partners, governments, and the private sector
• raising the average RISE score in the top-20 electricity access-deficit countries to 80 out of 100
Table ES.13 presents the targets for 2020, 2025, and 2030. These targets should not be viewed as the defin-itive set of targets for every country and mini grid developer. Instead, they are goals that are ambitious but achievable, that have received support from multiple stakeholders, and that, if achieved, could concretely help the sector achieve the scale necessary to connect half a billion people by 2030.
The targets presented in table ES.13 are ambitious but achievable if mini grid developers, govern-ments, development partners, and other key stakeholders collectively work toward scaling up mini grids. Increasing the pace of deployment depends on entrepreneurial innovations, like building portfolios of mini grids as well as concerted efforts from governments to make it easier for developers to plan, set up,
For more information on sectorwide objectives, see the introduction to Part II of the book.

MINI GRIDS FOR HALF A BILLION PEOPLE52
TABLE ES.13 Targets for the mini grid industry to achieve by 2020, 2025, and 2030
TargetObjective/indicator What is measured 2018 Baseline 2020 2025 20301. Increase pace of mini grid developmentTime from purchase order to commissioning (weeks)
Cohort of leading private sector developers
6–12 7 6 5
Time from goods arriving on site to commissioning (weeks)
Cohort of leading private sector developers
6–12 5 4 3
Mini grids per portfolio per year
Portfolios from rural electrification agencies, utilities, private developers, or industry associations
10–50 > 100 > 250 > 750
2. Provide superior-quality serviceIndustry-wide standard for minimum technical specifications
Industry associations Under preparation
Developed for solar-hybrid mini grids
Developed for solar-
hybrid and hydro mini
grids
Developed for all
renewable energy mini
grids
Industry-wide standard for reliability of electricity supply
Representative sample of mini grid developers
90–97 percent uptime
97 percent uptime during
promised availability
times
97 percent uptime for
24/7 electricity
99 percent uptime for
24/7 electricity
Customer satisfaction (percent)
Representative sample of mini grid customers
82–84 85 88 90
Average load factor across the industry (percent)
Representative sample of mini grid developers
22 25 35 45
3. Establish enabling mini grid business environment in key access deficit countriesAverage RISE score for mini grids framework in top 20 electricity access deficit countries
Top 20 electricity access deficit countries
59 60 70 80
Average Doing Business Score in top 20 electricity access deficit countries
Top 20 electricity access deficit countries
52 55 65 75
4. Crowd in government and private-sector fundingRatio of government and private funding to donor funding
Cohort of leading development partners
1.7: 1 2: 1 5: 1 10: 1
Ratio of developer investment to donor funding
Cohort of leading private sector developers
7: 1 8: 1 9: 1 10:1
Billions of dollars Invested Sum of all funding for mini grids in a country
28 40 93 217
5. Reduce cost of solar-hybrid energy
Levelized cost of energy ($/kWh)
Average across a cohort of leading mini grid developers
0.55 0.30 0.25 0.20
Note: A detailed discussion of the underlying analysis for each target is presented in the Introduction to Part II of the main book. kWh = kilowatt-hour. RISE = Regulatory Indicators for Sustainable Energy.

MINI GRIDS FOR HALF A BILLION PEOPLE 53
and operate mini grid businesses. Mini grid developers can work to provide superior-quality service, but this will require support from development partners and governments, particularly in increasing the uptake of income-generating equipment. Development partners and governments will need to crowd in private-sector investment and establish enabling mini grid business environments in key access-deficit countries. These com-bined efforts can bring down the cost of mini grid electricity to $0.25/kWh by 2025 and $0.20/kWh by 2030.
STAKEHOLDER SUPPORT
Connecting half a billion people to mini grids by 2030 is a monumental task that requires unprece-dented levels of investment, innovation, and commitment from development partners, governments, and across the mini grid industry. Each stakeholder has a role to play as follows:
• Policy makers can recognize the important role mini grids will play in helping countries achieve electrification targets. As CrossBoundary Energy recently observed, the private sector deserves a chance to compete in bringing power to off-grid areas where progress has historically been slow (Davies, Tillard, and Shaw 2018). Policy makers can leverage the latest geospatial analysis technology to develop national electrification plans that can guide investment in mini grids, main grid extension, and solar home systems, while at the same time developing initiatives to promote productive uses of electricity, build human capital, and reduce red tape for mini grid developers.
• Regulators can adopt a light-handed approach and provide clear guidance in five areas: market entry, retail tariffs, service standards, technical standards, and arrival of the main grid.
• Development partners can improve coordination on the design and funding of strategic interventions to crowd in private-sector investment. In addition, they can work with government counterparts to create enabling environments for mini grids. An important role for the World Bank here is leveraging its RISE initiative and long-standing economic policy expertise to assess and help improve policies and regulations that affect mini grid developers and investors. Finally, development partners can help share lessons with the industry as new knowledge is developed through experience.
• Mini grid developers can work individually and with other developers to achieve two key performance indica-tors that will help the industry grow at scale: increasing the pace of deployment through a portfolio approach to mini grid development and providing superior-quality service. Support from development partners and other stakeholders to crowd in private-sector and government finance and establish enabling mini grid busi-ness environments in key access-deficit countries together with entrepreneurial innovation can reduce the cost of mini grid electricity to $0.25/kWh by 2025 and $0.20/kWh by 2030.
• Industry associations can hold members and stakeholders to account by developing and tracking progress toward key performance indicators that are linked directly with growing the mini grid sector at scale. This data-driven approach can lead to effective advocacy with ministries, regulators, suppliers, and financiers.
• Investors can develop financing vehicles that can channel investment—debt, equity, risk-sharing instruments, and convertible notes—from large and small investors alike into portfolios of mini grids. Providers of microfi-nance can develop lending instruments that target productive uses of electricity.
• Suppliers can take a longer view of the mini grid industry than what quarterly reporting incentivizes. They can prepare now, when the market is nascent, for 2025, when the market will be expanding rapidly. Suppliers of appliances and machines for both household consumption and productive use can forge partnerships with mini grid developers.
• Researchers can conduct qualitative and quantitative research to fill knowledge gaps and identify statistically significant causal relationships that can inform investment decisions in mini grids.

MINI GRIDS FOR HALF A BILLION PEOPLE54
AREAS FOR ADDITIONAL RESEARCH
Six areas require further research:
• assessing and comparing the impacts of different policies—particularly economic and electrification poli-cies—on mini grid development and investment; This work can leverage the World Bank’s RISE initiative and long-standing economic policy research expertise
• collecting data on installed and planned mini grids to inform and improve analyses of the global mini grid market and detailed mini grid costs
• identifying opportunities to combine mini grids with main grid extensions and/or solar home systems to develop new business models that leverage combinations of these technologies
• identifying successful business techniques and strategies that will improve mini grid profitability and attract investment
• assessing and improving policies and the broader business environment that affect mini grids
• identifying proven ways to increase the uptake of income-generating machines and equipment that are powered by mini grid electricity

MINI GRIDS FOR HALF A BILLION PEOPLE 55
ACKNOWLEDGMENTS
Partnership and Funding.
This Executive Summary is part of a much larger comprehensive knowledge package that was funded by World Bank / ESMAP and DFID as one of ESMAP’s key donors in particular. This comprehensive knowledge package is the result of ESMAP’s collaboration with a broad set of mini grid sector stakeholders, including mini grid developers, regulators and other government officials, financiers, technology providers, researchers, proj-ect implementation partners, development partners, and recognized experts. We are particularly grateful to the following mini grid industry leaders who not only gave us their time but also helped ensure our work captured ground-level realities and frontier innovations accurately: AMDA, Engie, Havenhill, HOMER Energy, INENSUS, Odyssey Energy Solutions, Power Corner, PowerGen, PowerHive, Techno Hill, and Trama TecnoAmbiental.
Authorship and Project Management.
This book was prepared by the GFMG team under the overall guidance of ESMAP’s Program Manager, Rohit Khanna. Jon Exel, Tatia Lemondzhava and Dr. James Knuckles managed the project and oversaw the book’s development, from inception to publication. The book’s lead authors, in alphabetical order, are Juliette Besnard, Ricky Buch, Sunita Dubey, Dr. Chris Greacen, Dr. James Knuckles, Tatia Lemondzhava, Dr. Subodh Mathur, Ashish Shrestha, and colleagues from Castalia, INENSUS, and SNV Netherlands Development Orga-nization. In addition, World Bank colleagues Inka Schomer and Mary Dominic provided important contributions on the gender-related aspects of mini grid topics throughout the book, from access to finance to productive uses to community engagement and skills building, among others.
Review and Consultation.
We are exceptionally grateful to the reviewers for their time, expertise, and thoughtful comments: Gabriela Azuela, Dana Rysankova, Michael Toman and Bernard Tenenbaum along with colleagues from the AfDB, AMDA, Castalia, DfID, INENSUS, the Institute of Electrical and Electronics Engineers, the Rocky Mountain Institute, Trama TecnoAmbiental, and the United States National Renewable Energy Laboratory. Their com-ments helped sharpen the messages throughout the book and significantly elevated the quality of the final product. We are lucky to have had Barbara Karni and Joan O’Callaghan as our editors. Debra Naylor typeset this report and designed all of the graphs and figures contained within it. The quality and consistency with which this report presents information is thanks to Barbara’s, Debra’s, and Joan’s expert touch. The GFMG team would also like to express its gratitude to the ESMAP communications team, and especially to Nansia Constantinou, Anita Rozowska, and Janice Tuten for their help in synthesizing and tailoring the main messages of this report, and their overall support in its preparation and dissemination.
Stakeholder Engagement.
Over the past 3 years, ESMAP has co-hosted events and workshops on mini grids in Ghana, Kenya, Myanmar, Nigeria, Tanzania, the United Kingdom, and the United States. We are particularly grateful for the host gov-ernments in these countries as well as the more than 2,000 participants at these events representing all mini grid stakeholder groups from more than 60 countries for their input, debate, and validation of the knowledge brought together in this report.
None of the many people we interviewed or who reviewed this report, who were so gracious with their time, should be held responsible for any errors of fact or interpretation that remain. They were remarkably patient and accommodating with our requests under tight deadlines, and we are sincerely grateful.

MINI GRIDS FOR HALF A BILLION PEOPLE56
APPENDIX A. INTRODUCING A COMPREHENSIVE KNOWLEDGE PACKAGE FOR THE 10 BUILDING BLOCKS NEEDED TO SCALE UP MINI GRID DEPLOYMENTS
A decade of experience working with mini grid developers, government officials, investors, experts, and donor partners has helped the World Bank identify 10 building blocks that need to be in place to unleash the full potential of mini grid development in each country. Each building block contributes to one of the five market drivers identified in figure ES A.1. Collectively, the building blocks represent the foundation of successful national mini grid programs.
The ESMAP Global Facility on Mini Grids has produced a comprehensive knowledge package built around these 10 building blocks. This package consists of the following information tools:
• a 500-page book, Mini Grids for Half a Billion People: Market Outlook and Handbook for Decision Makers, which includes this executive summary and is the World Bank’s most comprehensive publication on mini grids to date
• a volume of annexes to chapters in the main book, which presents additional detailed analyses, methodolo-gies, and deep-dive discussions
• a volume of case studies on the history of mini grids in electric power systems, and mini grid regulations and subsidies in Bangladesh, Cambodia, India, Kenya, Nigeria, and Tanzania
• more than a dozen PowerPoint presentations highlighting key findings from the main report
TABLE ES A.1 Matrix of market drivers and building blocks to support the development of mini grids at scale
Building blocks to support mini grid development at scale
Market drivers of magnitude changes in scale So
lar-
Hyb
rid T
echn
olog
y C
ostin
g
Geo
spat
ial P
ortfo
lio P
lann
ing
Inco
me-
Gen
erat
ing
Use
s of
Ele
ctric
ity
Com
mun
ity E
ngag
emen
t
Loca
l & In
tern
atio
nal I
ndus
try
Acc
ess
to F
inan
ce
Trai
ning
& S
kill
Dev
elop
men
t
Inst
itutio
nal F
ram
ewor
k
Wor
kabl
e R
egul
atio
ns
Enab
ling
Bus
ines
s En
viro
nmen
t
Reducing costs
Increasing the pace of deployment
Providing superior quality of service
Crowding in government and private sector finance
Establishing enabling environments in key countries
Note: The darker the shading, the more direct the impact a building block is expected to have on a market driver.

MINI GRIDS FOR HALF A BILLION PEOPLE 57
• animations, infographics, and videos to present high-level findings to a wide audience
• LiveWires publications that can serve as quick reference guides for World Bank operations teams and other project implementation partners
• databases of detailed mini grid component and operating costs, installed and planned mini grid projects, and industry tracking toward key performance indicators
• a roster of experts to provide rapid response support to project implementation
The objective of this comprehensive knowledge package is to present road-tested options and examples from the frontier of mini grid development in each of the 10 building blocks, which decision makers can modify and implement to scale up mini grid deployment. The knowledge package provides actionable, ground-level answers to the question: How can mini grid deployment be scaled up to connect half a billion people by 2030? By acknowledging different national-level approaches to mini grids and providing context-specific considerations for implementation, it provides an adaptive approach to helping countries achieve their electrification targets.

MINI GRIDS FOR HALF A BILLION PEOPLE58
REFERENCES
Abate, G., T. Bernard, S. Makhija, and D. Spielman. 2018. “Accelerating Technical Change through Video-Mediated Agricultural Extension: Evidence from Ethiopia.” Working Paper, Cornell University, Ithaca, NY. http://barrett.dyson.cornell.edu/NEUDC/paper_421.pdf.
Alliance for Rural Electrification. 2018. “ARE Member Tiger Power Seals Deal to Run World’s First, Solar-Hydrogen Powered Mini-grids in Uganda.” https://www.ruralelec.org/news-from-are/are-member-tiger-power-seals-deal-run-worlds-first-solar-hydrogen-powered-mini-grids.
Blimpo, M., and M. Cosgrove-Davies. 2019. Electricity Access in Sub-Saharan Africa: Uptake, Reliability, and Complementary Factors for Economic Impact. Africa Development Forum. Washington, DC: World Bank.
BNEF (Bloomberg New Energy Finance). 2018. “Powering the Last Billion.”
———. 2019. “1Q 2019 Frontier Power Market Outlook.”
Buckley, A. 2012. “Best Practice Community Engagement for Infrastructure Projects: Building Community Ties That Dig Deeper.” Public Infrastructure Bulletin 1 (8). https://core.ac.uk/download/pdf/46935681.pdf.
Carbon Africa Limited, Trama TecnoAmbiental S.L., Research Solutions Africa Limited, and Energy Research Centre of the Netherlands. 2015. Kenya Market Assessment for Off-Grid Electrification: Final Report. Nairobi, Kenya: Energy Regulatory Commission.
Couture, T., D. Jacobs, S. Schurig, E. Matser, A. Leidreiter, and I. García. 2016. Beyond Fire: How to Achieve Sustainable Cooking. Hamburg and The Hague: World Future Council and Hivos.
Davies, G., M. Tilleard, and L. Shaw. 2018. Private Mini-Grid Firms Deserve a Chance to Compete against Slow Utilities in Africa: A Faster Path to Rural Electrification. GreenTechMedia. https://www.greentechmedia.com/articles/read/a-faster-path-to-rural-electrification#gs.d8qrrt.
EUEI PDF (European Union Energy Initiative Partnership Dialogue Facility). 2014. Mini-grid Policy Toolkit: Policy and Business Frameworks for Successful Mini-grid Roll-outs.
ESMAP (Energy Sector Management Assistance Program). 2018a. Cambodia—Beyond Connections: Energy Access Diagnostic Report Based on the Multi-Tier Framework. Washington, DC: World Bank. https://openknowledge.worldbank.org/handle/10986/29512.
———. 2018b. Ethiopia—Beyond Connections: Energy Access Diagnostic Report Based on the Multi-Tier Framework. Washington, DC: World Bank. https://openknowledge.worldbank.org/handle/10986/30102.
———. 2018c. Rwanda—Beyond Connections: Energy Access Diagnostic Report Based on the Multi-Tier Framework. Washington, DC: World Bank. https://openknowledge.worldbank.org/handle/10986/30101.
Fu, R., D. Feldman, R. Margolis, M. Woodhouse, and K. Ardani. 2017. “U.S. Solar Photovoltaic System Cost Benchmark: Q1 2017.” Technical Report NREL/TP-6A20-68925. Golden, CO: National Renewable Energy Laboratory.
GOGLA. 2019. Providing Energy Access through Off-Grid Solar: Guidance for Governments. Utrecht: GOGLA. https://www.gogla.org/sites/default/files/resource_docs/energy_access_through_off-grid_solar_-_guidance_for_govts.pdf.
IEA (International Energy Agency). 2017. Energy Access Outlook 2017: From Poverty to Prosperity. Paris: IEA.
IEA (International Energy Agency), International Renewable Energy Agency, United Nations Statistics Division, World Bank, and World Health Organization. 2019. Tracking SDG7: The Energy Progress Report. Washington, DC. http://documents.worldbank.org/curated/en/517781558037625254/Tracking-SDG-7-The-Energy-Progress-Report-2019.
Katre, A., A. Tozzi, and S. Bhattacharyya. 2019. “Sustainability of Community-Owned Mini-Grids: Evidence from India.” Energy, Sustainability and Society 9: 2. https://link.springer.com/article/10.1186/s13705-018-0185-9.
Kenning, T. 2018. “Sterling and Wilson to Build ‘Largest’ Battery Energy Storage Project in Africa.” Energy Storage News. https://www.energy-storage.news/news/sterling-and-wilson-to-build-largest-battery-energy-storage-project-in-afri.
Kojima, M., and C. Trimble. 2016. Making Power Affordable for Africa and Viable for Its Utilities. Washington, DC: The World Bank.
Muther, K. 2016. Smart Power for Rural Development. Creating a Sustainable Market Solution to Energy Poverty. Shared Value Initiative. New York, NY: Rockefeller Foundation.

MINI GRIDS FOR HALF A BILLION PEOPLE 59
Okafor, C. 2019. “43000 Rural Homes, Businesses to Benefit from N1.95bn REF.” This Day Live. January 22. https://www.thisdaylive.com/index.php/2019/01/22/43000-rural-homes-businesses-to-benefit-from-n1-95bn-ref/.
Ramachandran, V., M. Shah, and T. Moss. 2018. “How Do African Firms Respond to Unreliable Power? Exploring Firm Heterogeneity Using K-Means Clustering.” CGD Working Paper 493, Center for Global Development, Washington, DC. https://www.cgdev.org/sites/default/files/how-do-african-firms-respond-unreliable-power-exploring-firm-heterogeneity-using-k-means.pdf.
Rockefeller Foundation. 2017. “Smart Power for Rural Development: Transforming Lives through Energy Access.” https://www.rockefellerfoundation.org/report/smart-power-rural-development-brochure/.
Sedighy, M. 2016. “Powering Remote Communities and Industrial Facilities.” Hatch. https://www.hatch.com/en/About-Us/Publications/Blogs/2016/11/Powering-remote-communities-and-industrial-facilities.
Smart Power India. 2016. Smart Power Connect Magazine 1 (1). http://www.smartpowerindia.org/media/1136/smartpowerindia_magazine_july_2016.pdf.
———. 2017. Smart Power Connect Magazine 2 (1). http://www.smartpowerindia.org/media/1140/smartpowerindia_magazine_may_2017.pdf.
Smith, J. 2000. Solar-Based Rural Electrification and Microenterprise Development in Latin America: A Gender Analysis. Golden, CO: National Renewable Energy Laboratory. https://www.nrel.gov/docs/fy01osti/28995.pdf.
Tenenbaum B., C. Greacen, T. Siyambalapitiya, and J. Knuckles. 2014. From the Bottom Up: How Small Power Producers and Mini-Grids Can Deliver Electrification and Renewable Energy in Africa. Washington, DC: World Bank. https://openknowledge.worldbank.org/handle/10986/16571.
Tenenbaum, B., C. Greacen, and D. Vaghela. 2018. Mini Grids and the Arrival of the Main Grid: Lessons from Cambodia, Sri Lanka, and Indonesia. ESMAP Technical Report 013/18, World Bank, Washington, DC.
Trimble, C., M. Kojima, I. Perez Arroyo, and F. Mohammadzadeh. 2014. “Financial Viability of Electricity Sectors in Sub-Saharan Africa: Quasi-Fiscal Deficits and Hidden Costs.” Policy Research Working Paper 7788, World Bank, Washington, DC. http://documents.worldbank.org/curated/en/182071470748085038/pdf/WPS7788.pdf.
Waldron, D. 2017. “ Solar Energy: A New Frontier for Microfinance.” CGAP. April 17. https://www.cgap.org/blog/solar-energy-new-frontier-microfinance.
Walton, R. 2019. “Puerto Rico Energy Plan Introduces MiniGrids to Avoid Repeat of Hurricane Maria.” Utility Drive.

MINI GRIDS FOR HALF A BILLION PEOPLE60
NOTES
1. Nigeria’s Rural Electrification Agency has identified a market potential of 10,000 mini grids by 2030. The 879 planned mini grids referenced here are those for which specific funding has already been allocated or for which project-specific details are available in ESMAP’s database of more than 26,000 installed and planned mini grids.
2. The World Bank’s RISE initiative tracks policies and regulations for energy access. For mini grids, RISE tracks the following indicators: existence of a national program, legal framework for mini grid operation, ability to charge cost-reflective tariffs, financial incentives, and standards and quality. The latest RISE report and accompanying data are available at http://rise.worldbank.org/.
3. This report defines access to electricity in accordance with the multitier framework, elaborated in chapter 1 of the book, (“Why Mini Grids, and Why Now?”).
4. Ghana and Kenya stand out as successes in the pace and rate of electricity access in Sub-Saharan Africa, with both countries projected to reach universal access to electricity before 2030. At the same time, the region is home to the 20 countries with the lowest global electrification rates, with Burundi, Chad, Malawi, the Democratic Republic of Congo electrifying at a rate of less than 1 percent annually between 2010 and 2017. In addition, if current policies and trends continue, by 2030 80 percent of those remaining without access to electricity in Sub-Saharan Africa are projected to be from rural areas (while rural populations would represent about 50 percent of the total population) (World Bank and others 2019).
5. The World Bank’s Multi-Tier Framework (MTF) defines electricity access in terms of tiers of service, ranging from Tiers 0 to 5. The tiers are based on seven attributes of electricity service, including capacity, service hours, reliabil-ity, quality or voltage fluctuations, affordability, legality, and safety. On the basis of these seven attributes, the MTF assigns any given household to one of the five tiers, where Tier 0 is no meaningful access, Tier 1 is basic lighting and charging, Tier 2 is the ability to run a few small appliances, Tier 3 is a formal grid connection with limited service, Tier 4 is a service capable of supporting refrigeration, and Tier 5 is unrestricted continuous service.
6. When calculating LCOE, we used HOMER Pro and real data from the 12 mini grids. We included a number of assumptions based on prior research and experience, including a 20-year lifetime for the mini grid, a discount rate of 9.6 percent (consistent with analysis from a variety of sources), inflation of 3 percent, and diesel prices of $1 per liter. In the ESMAP data set, OPEX was divided into fuel costs, staff costs, and other O&M. Fuel costs were reported for 7 of the 9 mini grids that had generators; of the mini grids with fuel costs, fuel accounted for only 12.7 percent of OPEX costs. Staff costs were reported for 17 of the 18 mini grids; for mini grids reporting these staff costs, they accounted for 76.5 percent of OPEX costs. Staff costs vary radically, from $1,008 to more than $75,000 per year. Other O&M costs include other expenses incurred to operate and maintain the system.
7. The slight rise in LCOE as load factor (LF) increases from 40 percent to 80 percent in 2030 is a consequence of the importance of load being coincident with the solar resource. The only way for an 80 percent LF to be achieved is by adding load in the middle of the night. But this, in turn, requires that more electricity be cycled through a battery, incurring both increased costs from the need to invest in increased storage, as well as the electrical losses inherent in charging and discharging a battery. That is to say, for solar-hybrid mini grids with low-price solar gener-ation (as is the case particularly for mini grids in 2030, when the price of solar panels has decreased significantly while the price of diesel has remained relatively unchanged), maximizing load coincidence with solar resource can be more important than maximizing load factor.
8. Note that the costs indicated here are ex-factory prices. Actual prices in-country may vary and depend on import duties, value-added tax, shipping, and other clearance costs. The payback periods were calculated assuming a tariff of $0.75/kWh and considering conservative assumptions for machine efficiency and output.
9. Lithium-ion batteries are likely the future choice for many mini grids because of their lower lifetime costs, higher lifecycle, robust response to deep discharge, and hot-weather performance. PV module: At levelized costs compet-itive with conventional power plants, demand for zero-emission solar farms will remain strong, driving demand and pushing scale-related cost reductions. PV inverters: Used in mini grids, these are similar (in many cases identical) to those used in commercial grid-connected installations, which are growing by about 40 percent a year. Battery inverters: Synergies with electric vehicle motor drives and other power electronics will continue to lower costs. Lead-acid batteries: The technology is largely developed, but the industry makes small improvements every year. For example, carbon added to the negative electrode will reduce sulfation and increase charge rates. Smart meters: Competition among prepayment metering manufacturers and increasing scale will allow development costs to be spread over a larger product base.

10. Rather than a definitive number, this analysis is designed to understand the relative profit potential among different mini grid value chain stakeholders. Such an analysis can be used to determine the viability of establishing business lines focused on the mini grid market. The data reflect the profit potential after all variable production and manufacturing costs are taken into consideration. Detailed assumptions on the cost and manufacturing margins are documented in the annex to chapter 7 of the main book.
11. While the mini grid regulations in Tanzania are some of the most advanced in Africa, issues concerning implementa-tion and enforcement, as well as elements within the regulations themselves, have recently restricted private-sector investment in mini grids.
12. The importance of tailoring the community engagement approach to the local context was emphasized in an interview with Havenhill Synergy Ltd., a Nigerian mini grid developer operating several solar-hybrid mini grids in the Kwali and Kuje local government areas of Nigeria.
13. Local banks typically raise their funds from short-term deposits, so providing long-term loans (a bank’s assets) to developers while their deposits (liabilities) are for shorter periods would create an unacceptable asset–liability mismatch.
14. On average, CAPEX accounted for about 65 percent and OPEX for about 35 percent of the fully cost-recovering tariff.
15. ESMAP collected data from proprietary data sets from three leading market research firms—Navigant Research, Bloomberg New Energy Finance, and Infinergia—as well as World Bank surveys of mini grid operators. It also conducted extensive desk research and interviews.
16. In all scenarios, the cost per connection assumes 4.9 people per connection, which is the average number of people per connection across the 7,500 planned mini grids in ESMAP’s database.

Energy Sector Management Assistance Program The World Bank 1818 H Street, N.W. Washington, DC 20433 USA esmap.org | [email protected]