quality assurance framework for mini-grids
TRANSCRIPT
NREL is a national laboratory of the U.S. Department of Energy Office of Energy Efficiency & Renewable Energy Operated by the Alliance for Sustainable Energy, LLC
This report is available at no cost from the National Renewable Energy Laboratory (NREL) at www.nrel.gov/publications.
Contract No. DE-AC36-08GO28308
Quality Assurance Framework for Mini-Grids Ian Baring-Gould, Kari Burman, Mohit Singh, and Sean Esterly National Renewable Energy Laboratory
Rose Mutiso and Caroline McGregor U.S. Department of Energy
Technical Report NREL/TP-5000-67374 November 2016
NREL is a national laboratory of the U.S. Department of Energy Office of Energy Efficiency & Renewable Energy Operated by the Alliance for Sustainable Energy, LLC
This report is available at no cost from the National Renewable Energy Laboratory (NREL) at www.nrel.gov/publications.
Contract No. DE-AC36-08GO28308
National Renewable Energy Laboratory 15013 Denver West Parkway Golden, CO 80401 303-275-3000 • www.nrel.gov
Quality Assurance Framework for Mini-Grids Ian Baring-Gould, Kari Burman, Mohit Singh, and Sean Esterly National Renewable Energy Laboratory
Rose Mutiso and Caroline McGregor U.S. Department of Energy
Prepared under Task No. DSMG.1000
Technical Report NREL/TP-5000-67374 November 2016
NOTICE
This report was prepared as an account of work sponsored by an agency of the United States government. Neither the United States government nor any agency thereof, nor any of their employees, makes any warranty, express or implied, or assumes any legal liability or responsibility for the accuracy, completeness, or usefulness of any information, apparatus, product, or process disclosed, or represents that its use would not infringe privately owned rights. Reference herein to any specific commercial product, process, or service by trade name, trademark, manufacturer, or otherwise does not necessarily constitute or imply its endorsement, recommendation, or favoring by the United States government or any agency thereof. The views and opinions of authors expressed herein do not necessarily state or reflect those of the United States government or any agency thereof.
This report is available at no cost from the National Renewable Energy Laboratory (NREL) at www.nrel.gov/publications.
Available electronically at SciTech Connect http:/www.osti.gov/scitech
Available for a processing fee to U.S. Department of Energy and its contractors, in paper, from:
U.S. Department of Energy Office of Scientific and Technical Information P.O. Box 62 Oak Ridge, TN 37831-0062 OSTI http://www.osti.gov Phone: 865.576.8401 Fax: 865.576.5728 Email: [email protected]
Available for sale to the public, in paper, from:
U.S. Department of Commerce National Technical Information Service 5301 Shawnee Road Alexandria, VA 22312 NTIS http://www.ntis.gov Phone: 800.553.6847 or 703.605.6000 Fax: 703.605.6900 Email: [email protected]
Cover Photos by Dennis Schroeder: (left to right) NREL 26173, NREL 18302, NREL 19758, NREL 29642, NREL 19795.
NREL prints on paper that contains recycled content.
iii This report is available at no cost from the National Renewable Energy Laboratory (NREL) at www.nrel.gov/publications.
Preface Providing clean and affordable energy services to the more than 1 billion people globally who lack access to electricity is a critical driver for poverty reduction, economic development, and improved health and social outcomes. More than 84% of populations without electricity are located in rural areas where traditional grid extension is not cost-effective; therefore, distributed energy solutions such as mini-grids are critical. The International Energy Agency (IEA) projects that to achieve universal energy access by 2030, more than 40% of total investments must be directed toward mini-grids (IEA 2010).
Diesel engines have been used quite successfully to provide electric and other energy services to communities that cannot be reached by extensions of the existing grid. However, utilizing diesel technology has inherent drawbacks: limited improvements in diesel engines; the rising cost of delivered diesel fuel; and the environmental impacts of diesel fuel transportation, use, and storage. Therefore, efforts to expand energy access must include options beyond diesel. Although conventional and new mini-grid technologies have improved greatly over the past 10 years, successful efforts to provide energy services by utilizing advanced mini-grids have remained elusive.
With growing interest in the use of mini-grids to supply near-term power to un-electrified communities across sub-Saharan Africa and Asia, the need to expand beyond traditional energy delivery and financing models has become apparent. Technology and business models continue to evolve, and the following are still needed: developing methodologies allowing project bundling; developing the ability to assess long-term project risks; reducing project costs by expanded community learning and localizing the development process; collecting system information to allow data-driven technology assessment; and providing guidance to organizations, both financial and governmental, on how to implement large-scale isolated power system deployment programs.
The implementation of grid-based electrification at a huge scale has been greatly facilitated by the adoption of a series of defined quality assurance measures. This document describes a similar framework that can be applied to the mini-grid market sector. The authors expect that with widespread implementation of these or similar quality assurance procedures; reliance on appropriate, credible, and consistent technology standards; and the development of viable business models, large-scale mini-grid-based rural electrification can be completed using a combination of public and private sector funding sources. Success in such an endeavor will greatly impact rural communities, providing all of the benefits that have been documented by improved access to advanced energy systems: improved health, education, and personal security; improved economic possibilities; and a more stable population through political and food security.
iv This report is available at no cost from the National Renewable Energy Laboratory (NREL) at www.nrel.gov/publications.
Acknowledgments The authors would like to acknowledge the support of the U.S. Department of Energy (U.S. DOE) International Affairs Office for supporting the development and implementation of the Quality Assurance Framework for mini-grid power systems. This work was funded by the U.S. DOE, U.S. Department of State, and the U.S. Agency for International Development. This work is also an activity under the Clean Energy Ministerial’s Global Lighting and Energy Access Partnership (Global LEAP) initiative, Power Africa’s Beyond the Grid initiative, the U.S.-India Promoting Energy Access through Clean Energy (PEACE) initiative, and the Sustainable Energy for All High Impact Opportunity on Clean Energy Mini-Grids.
We would especially like to thank the following individuals who served on a technical review committee for this document and the QAF project:
• Chris Greacen, Ph.D: Independent consultant
• Arne Jacobson, Ph.D: Director, Schatz Energy Research Center at Humboldt State University
• Peter Lilienthal: CEO, HOMER Energy. Technical support related to electrical standards for the Quality Assurance Framework for mini-grid development was also provided by Robert Preus, PE: Senior engineer, National Renewable Energy Laboratory.
Additionally, we would like to thank the participants of several stakeholder consultation workshops during which the Quality Assurance Framework for mini-grids was reviewed in detail.
The challenges of providing power to rural populations are many and multi-faceted. It is hoped that the concepts portrayed in the Quality Assurance Framework for mini-grids will help to address some of these challenges, an outcome made more likely by the guidance and insight provided by the people named above.
v This report is available at no cost from the National Renewable Energy Laboratory (NREL) at www.nrel.gov/publications.
Abbreviations and Acronyms AC alternating current
ANSI American National Standards Institute
DC direct current
Global LEAP Global Lighting and Energy Access Partnership
IEA International Energy Agency
IEC International Electrotechnical Commission
IEEE Institute of Electrical and Electronic Engineers
kW kilowatt
kV kilovolt
MW megawatt
NREL National Renewable Energy Laboratory
O&M operations and maintenance
rms root-mean-square
PEACE Promoting Energy Access through Clean Energy (India)
P-SAIDI Planned System Average Interruption Duration Index
P-SAIFI Planned System Average Interruption Frequency Index
pu per unit
pk-pk peak-to-peak (in terms of voltage fluctuations)
QA quality assurance
QAF Quality Assurance Framework
SAIDI System Average Interruption Duration Index
SAIFI System Average Interruption Frequency Index
U.S. DOE U.S. Department of Energy
V Volt
vi This report is available at no cost from the National Renewable Energy Laboratory (NREL) at www.nrel.gov/publications.
Executive Summary Providing clean and affordable energy services to the more than 1 billion people globally who lack access to electricity is a critical driver for poverty reduction, economic development, improved health, and social outcomes. More than 84% of populations without electricity are located in rural areas where traditional grid extension may not be cost-effective; therefore, distributed energy solutions such as mini-grids are critical. The International Energy Agency (IEA) projects that to achieve universal energy access by 2030, more than 40% of total investments must be directed toward mini-grids (IEA 2010).
To address some of the root challenges of providing safe, quality, and financially viable mini-grid power systems to remote customers, the U.S. Department of Energy (DOE) teamed with the National Renewable Energy Laboratory (NREL) to develop a Quality Assurance Framework (QAF) for isolated mini-grid power systems. The QAF for mini-grids aims to address some root challenges of providing safe, quality, and affordable power to remote customers via financially viable mini-grids through two key components:
(1) Levels of service framework: Defines a standard set of tiers of end-user service and links them to technical parameters of power quality, power availability, and power reliability. These levels of service span the entire energy ladder, from basic energy service to high-quality, high-reliability, and high-availability service (often considered “grid parity”) (see Table ES-1).
(2) Accountability and performance reporting framework: Provides a clear process of validating power delivery by providing trusted information to customers, funders, and/or regulators. The performance reporting protocol can also serve as a robust monitoring and evaluation tool for mini-grid operators and funding organizations.
The QAF for mini-grids will provide a flexible alternative to rigid top-down standards for mini-grids in energy access contexts, outlining tiers of end-user service and linking them to relevant technical parameters. In addition, data generated through implementation of the QAF will provide the foundation for comparisons across projects, assessment of impacts, and greater confidence that will drive investment and scale-up in this sector. The QAF implementation process also defines a set of implementation guidelines that help the deployment of mini-grids on a regional or national scale, helping to insure successful rapid deployment of these relatively new remote energy options. Note that the QAF is technology agnostic, addressing both alternating current (AC) and direct current (DC) mini-grids, and is also applicable to renewable, fossil-fuel, and hybrid systems.
The QAF is being jointly developed by the U.S. DOE and NREL as a program of the Clean Energy Ministerial’s Global Lighting and Energy Access Partnership (Global LEAP) initiative. The QAF project was initiated as a priority activity within the PEACE (Promoting Energy Access through Clean Energy) Action Plan, the energy access initiative of the bilateral U.S.-India Partnership to Advance Clean Energy. The QAF is also part of Power Africa’s Beyond the Grid initiative and Sustainable Energy for All’s High Impact Opportunity on Clean Energy Mini-Grids.
The QAF can drive improved sustainability, greater market confidence, and expanded investment in this important off-grid sector by achieving the following:
vii This report is available at no cost from the National Renewable Energy Laboratory (NREL) at www.nrel.gov/publications.
• Facilitating safe, quality, and affordable delivery of power through mini-grids. The QAF levels of service ensure basic safety while matching service delivery to customer needs and ability to pay. This in turn can help strengthen a project’s revenue flows and optimize its system design and operability, which will increase the project’s financial viability
• Providing a formalized, common standard for classifying energy consumers. QAF levels of service also allow a common basis for assessment of community energy needs, streamlining community assessment and site selection efforts, as well as facilitating improved forecasting of energy needs across a community, region, and nation.
• Facilitating aggregation of mini-grid projects and unlocking private investment. A common classification system for customers and level of service provided, supported by the QAF’s standard monitoring and performance reporting protocols, will make it easier to bundle projects together, facilitating access to larger-scale finance at more competitive rates. Data generated from implementation of the QAF can be a source of robust sector-wide market intelligence on the typical technical and non-technical characteristics of mini-grid systems (e.g., payment collection rates, customer characteristics, and electrification rates), which over time will increase investor confidence and lower the risk profile of mini-grid power systems, further decreasing barriers to private investment and driving scale in the sector.
• Informing policy and regulatory frameworks while helping to standardize regional rural electrification deployment efforts. Defining a standard set of customers and an accountability-based reporting framework forces structure on larger rural electrification efforts using mini-grid power systems, providing regulatory clarity while hopefully minimizing the regulatory burden by providing a simple set of reporting requirements aligned with specific project stakeholder needs. Defining specific customer reporting also leads to the implementation of simple consumer protections, resulting in a better consumer service that will be reflected in willingness to pay for a high-quality energy service.
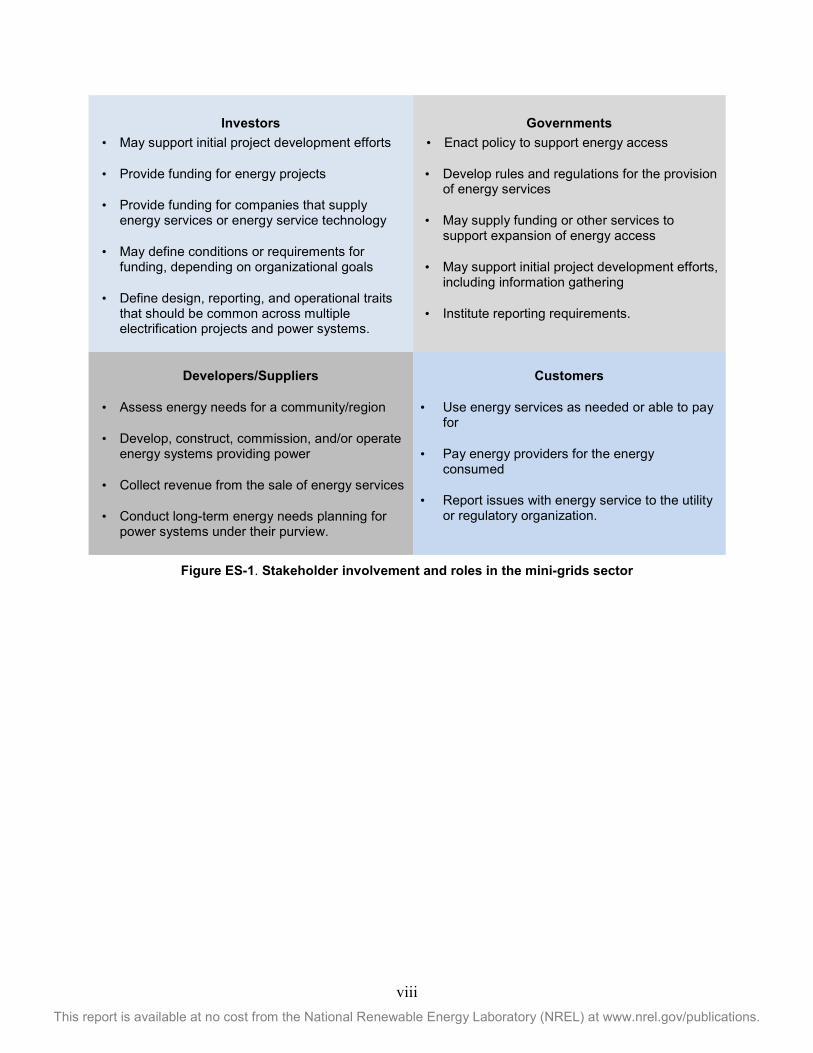
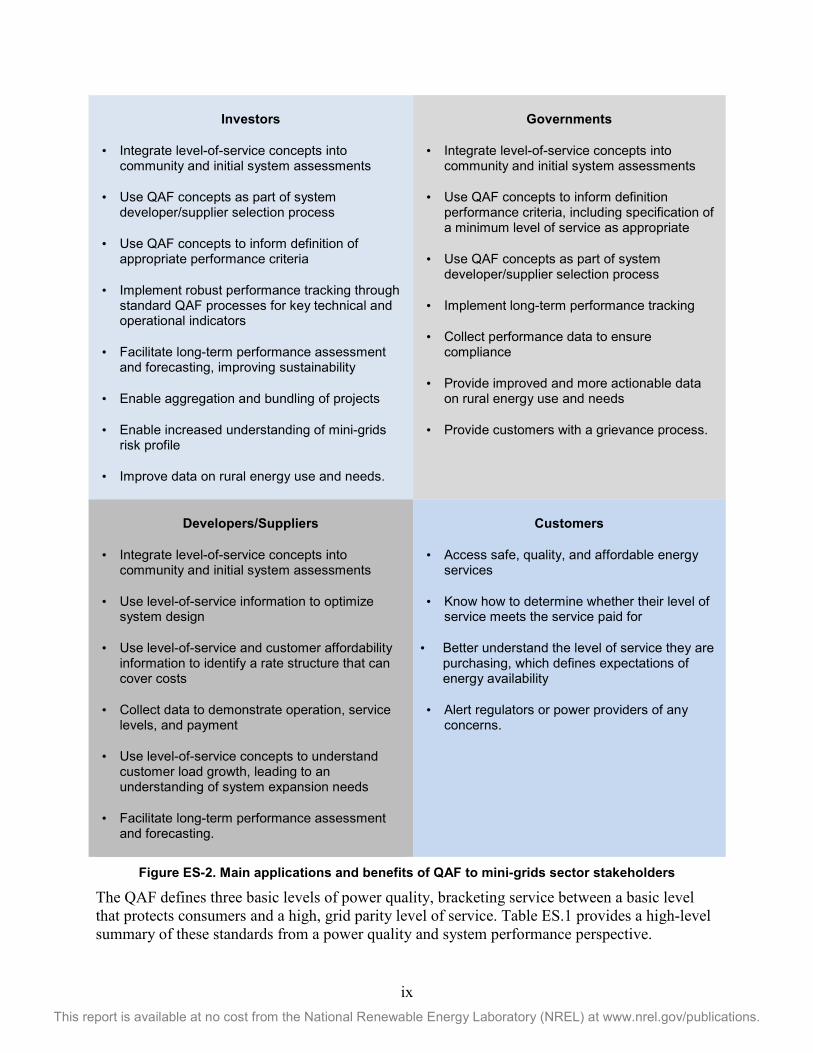
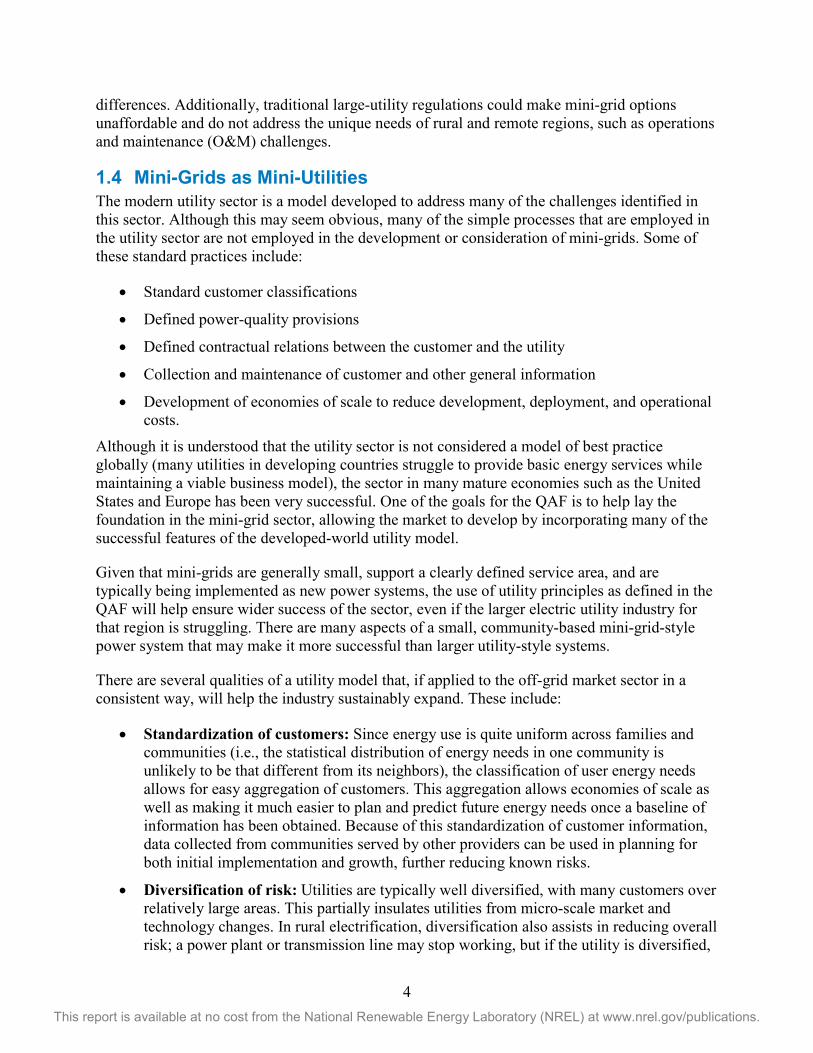
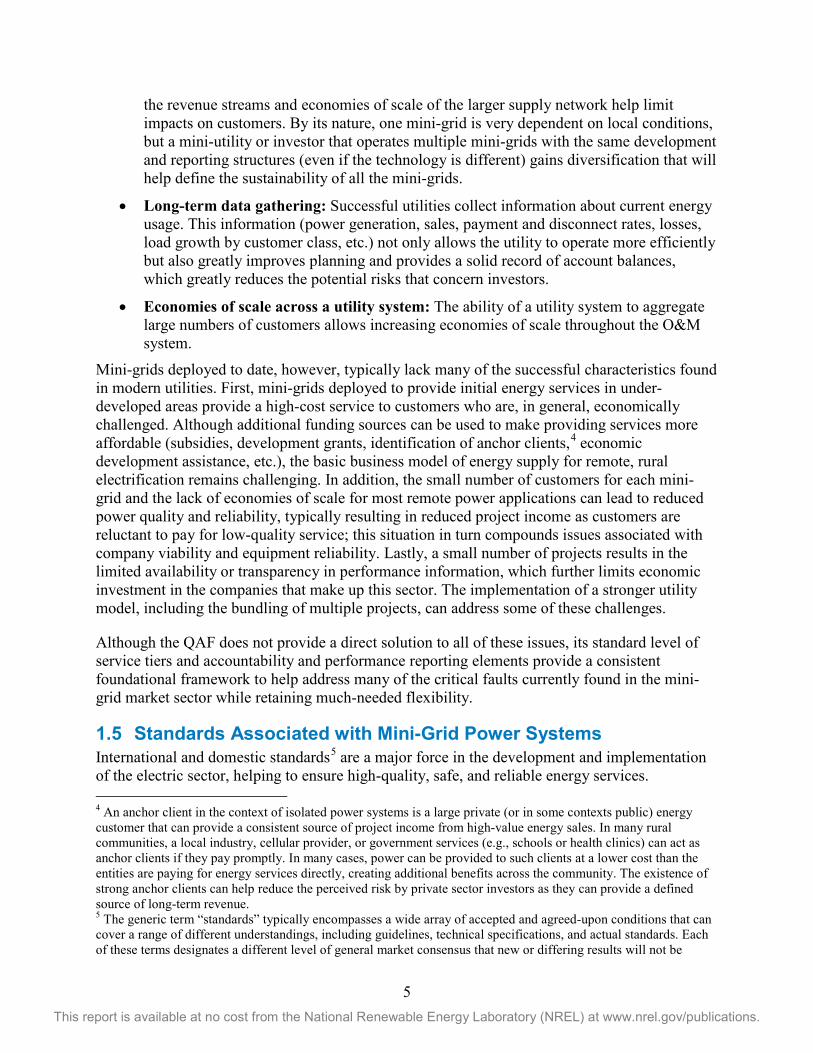
The following figures summarize how key stakeholders (investors, governments, developers/suppliers, and customers) are involved in the development of mini-grid systems for the provision of energy services (Figure ES-1) and how the QAF can be applied to facilitate the provision of energy services (Figure ES-2).
viii This report is available at no cost from the National Renewable Energy Laboratory (NREL) at www.nrel.gov/publications.
Investors
• May support initial project development efforts
• Provide funding for energy projects
• Provide funding for companies that supply energy services or energy service technology
• May define conditions or requirements for funding, depending on organizational goals
• Define design, reporting, and operational traits that should be common across multiple electrification projects and power systems.
Governments
• Enact policy to support energy access
• Develop rules and regulations for the provision of energy services
• May supply funding or other services to support expansion of energy access
• May support initial project development efforts, including information gathering
• Institute reporting requirements.
Developers/Suppliers
• Assess energy needs for a community/region
• Develop, construct, commission, and/or operate energy systems providing power
• Collect revenue from the sale of energy services
• Conduct long-term energy needs planning for power systems under their purview.
Customers
• Use energy services as needed or able to pay for
• Pay energy providers for the energy consumed
• Report issues with energy service to the utility or regulatory organization.
Figure ES-1. Stakeholder involvement and roles in the mini-grids sector
ix This report is available at no cost from the National Renewable Energy Laboratory (NREL) at www.nrel.gov/publications.
Investors
• Integrate level-of-service concepts into community and initial system assessments
• Use QAF concepts as part of system developer/supplier selection process
• Use QAF concepts to inform definition of appropriate performance criteria
• Implement robust performance tracking through standard QAF processes for key technical and operational indicators
• Facilitate long-term performance assessment and forecasting, improving sustainability
• Enable aggregation and bundling of projects
• Enable increased understanding of mini-grids risk profile
• Improve data on rural energy use and needs.
Governments
• Integrate level-of-service concepts into community and initial system assessments
• Use QAF concepts to inform definition performance criteria, including specification of a minimum level of service as appropriate
• Use QAF concepts as part of system developer/supplier selection process
• Implement long-term performance tracking
• Collect performance data to ensure compliance
• Provide improved and more actionable data on rural energy use and needs
• Provide customers with a grievance process.
Developers/Suppliers
• Integrate level-of-service concepts into community and initial system assessments
• Use level-of-service information to optimize system design
• Use level-of-service and customer affordability information to identify a rate structure that can cover costs
• Collect data to demonstrate operation, service levels, and payment
• Use level-of-service concepts to understand customer load growth, leading to an understanding of system expansion needs
• Facilitate long-term performance assessment and forecasting.
Customers
• Access safe, quality, and affordable energy services
• Know how to determine whether their level of service meets the service paid for
• Better understand the level of service they are purchasing, which defines expectations of energy availability
• Alert regulators or power providers of any concerns.
Figure ES-2. Main applications and benefits of QAF to mini-grids sector stakeholders
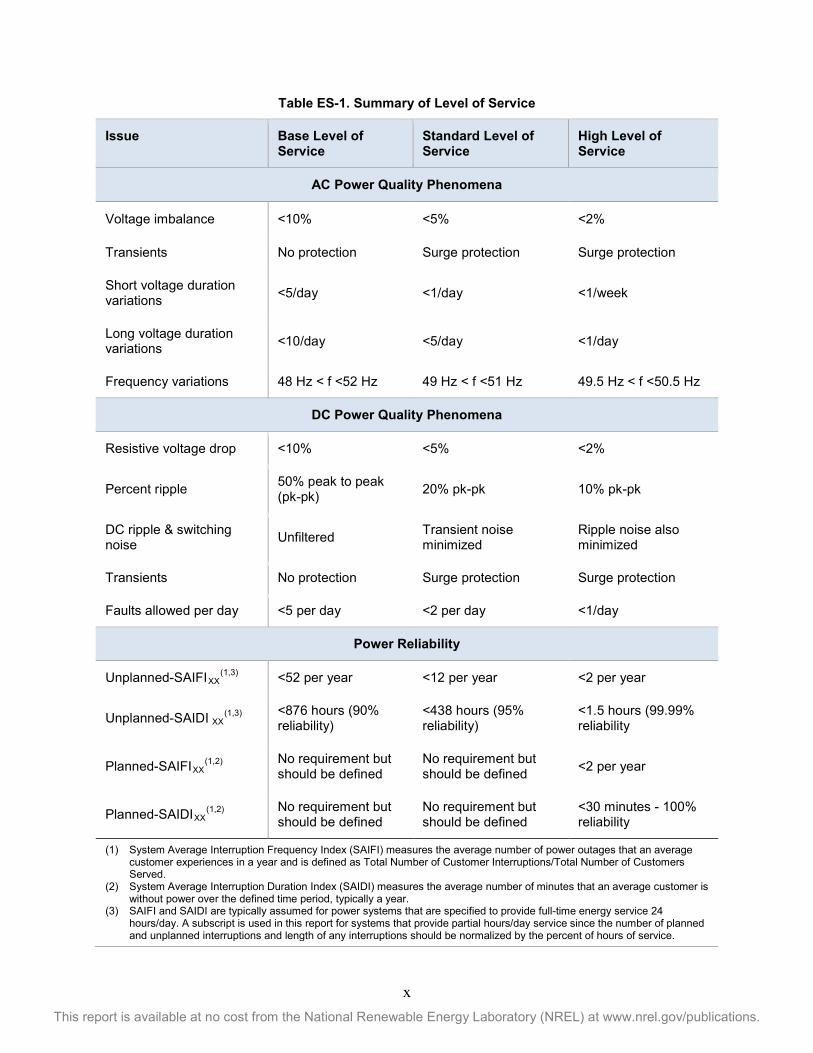
The QAF defines three basic levels of power quality, bracketing service between a basic level that protects consumers and a high, grid parity level of service. Table ES.1 provides a high-level summary of these standards from a power quality and system performance perspective.
x This report is available at no cost from the National Renewable Energy Laboratory (NREL) at www.nrel.gov/publications.
Table ES-1. Summary of Level of Service
Issue Base Level of Service
Standard Level of Service
High Level of Service
AC Power Quality Phenomena
Voltage imbalance <10% <5% <2%
Transients No protection Surge protection Surge protection
Short voltage duration variations <5/day <1/day <1/week
Long voltage duration variations <10/day <5/day <1/day
Frequency variations 48 Hz < f <52 Hz 49 Hz < f <51 Hz 49.5 Hz < f <50.5 Hz
DC Power Quality Phenomena
Resistive voltage drop <10% <5% <2%
Percent ripple 50% peak to peak (pk-pk) 20% pk-pk 10% pk-pk
DC ripple & switching noise Unfiltered Transient noise
minimized Ripple noise also minimized
Transients No protection Surge protection Surge protection
Faults allowed per day <5 per day <2 per day <1/day
Power Reliability
Unplanned-SAIFIXX(1,3) <52 per year <12 per year <2 per year
Unplanned-SAIDI XX(1,3) <876 hours (90%
reliability) <438 hours (95% reliability)
<1.5 hours (99.99% reliability
Planned-SAIFIXX(1,2) No requirement but
should be defined No requirement but should be defined <2 per year
Planned-SAIDIXX(1,2) No requirement but
should be defined No requirement but should be defined
<30 minutes - 100% reliability
(1) System Average Interruption Frequency Index (SAIFI) measures the average number of power outages that an average customer experiences in a year and is defined as Total Number of Customer Interruptions/Total Number of Customers Served.
(2) System Average Interruption Duration Index (SAIDI) measures the average number of minutes that an average customer is without power over the defined time period, typically a year.
(3) SAIFI and SAIDI are typically assumed for power systems that are specified to provide full-time energy service 24 hours/day. A subscript is used in this report for systems that provide partial hours/day service since the number of planned and unplanned interruptions and length of any interruptions should be normalized by the percent of hours of service.
xi This report is available at no cost from the National Renewable Energy Laboratory (NREL) at www.nrel.gov/publications.
Additionally, the QAF defines power availability levels that mirror the multi-tier framework defined by the World Bank (Bhatia and Angelou 2015) but defines them separately, giving system designers and operators the flexibility to specify the amount of energy consumers can expect. Like the multi-tier framework, power availability is defined by three parameters: power draw, energy availability, and the duration of daily service.
Through the accountability framework, the QAF defines guidelines for customer and utility reporting, helping all stakeholders better understand how systems are operating in a defined and outwardly consistent way. Utility accountability is defined with both technical and business information, including:
• Technical information: Measurements addressing system performance, energy usage, safety concerns, and operational issues
• Business information: Measurements that allow an understanding of overall energy usage, payment rates, and cost of system operations.
Through the implementation of the QAF, developers of multiple mini-grid projects will benefit from consistency and inter-system learning. Specifying reporting requirements, including the verification process to insure that reporting is accurate, helps to frame what to date has been a very unstructured development process. The application of the independently developed QAF implementation guide (to be released soon) will also help provide guidance on the ways that the QAF can be implemented as part of a larger development process.
If you wish to discuss this report or any information contained within it, please contact:
Ian Baring-Gould National Renewable Energy Laboratory 15013 Denver West Parkway Golden, CO 80401 USA [email protected] 303-384-7021
xii This report is available at no cost from the National Renewable Energy Laboratory (NREL) at www.nrel.gov/publications.
Table of Contents Preface ........................................................................................................................................................ iii 1 Introduction ........................................................................................................................................... 1
1.1 Definitions ..................................................................................................................................... 1 1.2 Mini-Grids to Support Universal Energy Access .......................................................................... 1 1.3 Key Barriers to Scaling up Mini-Grids ......................................................................................... 3 1.4 Mini-Grids as Mini-Utilities .......................................................................................................... 4 1.5 Standards Associated with Mini-Grid Power Systems .................................................................. 5
2 Introduction to the Quality Assurance Framework ........................................................................... 8 2.1 Overview of the Quality Assurance Framework ........................................................................... 8 2.2 Levels of Service Framework Overview ....................................................................................... 9
2.2.1 Power Quality ................................................................................................................... 9 2.2.2 Power Availability.......................................................................................................... 10 2.2.3 Power Reliability ............................................................................................................ 10
2.3 Accountability Framework Overview ......................................................................................... 11 2.3.1 Customer Accountability ................................................................................................ 11 2.3.2 Utility Accountability ..................................................................................................... 11 2.3.3 Monitoring and Performance Reporting Process ........................................................... 12
3 Levels of Service Framework ............................................................................................................ 13 3.1 Power Quality .............................................................................................................................. 13 3.2 Power Availability ....................................................................................................................... 15
3.2.1 Peak Available Power (Amps or Watts)......................................................................... 16 3.2.2 Energy Available per Time Period ................................................................................. 16 3.2.3 Duration of Daily Service .............................................................................................. 17 3.2.4 Time of Daily Service .................................................................................................... 17
3.3 Power Reliability ......................................................................................................................... 18 4 Accountability and Performance Reporting Framework ................................................................ 21
4.1 Consumer Accountability ............................................................................................................ 22 4.1.1 Level of Service Verification ......................................................................................... 22 4.1.2 Service Agreement ......................................................................................................... 23
4.2 Utility Accountability .................................................................................................................. 23 4.2.1 Technical Reporting ....................................................................................................... 24 4.2.2 Business Reporting ......................................................................................................... 26 4.2.3 Monitoring Processes ..................................................................................................... 27
5 Conclusion .......................................................................................................................................... 30 References ................................................................................................................................................. 31 Bibliography .............................................................................................................................................. 32 Appendix A: Power Quality (AC) ............................................................................................................. 33
A.1 Voltage Imbalance ....................................................................................................................... 33 A.2 Transients .................................................................................................................................... 33 A.3 Short-Duration Voltage Variations ............................................................................................. 34 A.4 Long Duration Variations ............................................................................................................ 35 A.5 Frequency Variations .................................................................................................................. 36
Appendix B: Power Quality (DC) ............................................................................................................. 37 B.1 Resistive Voltage Drop ............................................................................................................... 37 B.2 DC Ripple .................................................................................................................................... 37 B.3 Switching Noise .......................................................................................................................... 38 B.4 Transients .................................................................................................................................... 39 B.5 Short- and Long-Duration Variations .......................................................................................... 39
Appendix C: Sample Customer Disturbance Recording Form ............................................................ 40 Appendix D: Sample Technical Reporting Form ................................................................................... 41 Appendix E: Sample Business Reporting Form .................................................................................... 43

xiii This report is available at no cost from the National Renewable Energy Laboratory (NREL) at www.nrel.gov/publications.
List of Figures Figure ES-1. Stakeholder involvement and roles in the mini-grids sector................................................. viii Figure ES-2. Main applications and benefits of QAF to mini-grids sector stakeholders ............................. ix Figure 1. Transient over-voltage. By Biezl (own work) [public domain], via Wikimedia Commons.
https://commons.wikimedia.org/w/index.php?curid=4676389 .............................................. 34 Figure 2. Oscillatory transients ................................................................................................................... 34 Figure 3. DC ripple based on the output of a rectified AC power source. Image from Spinning Spark,
https://en.wikipedia.org/wiki/File:Smoothed_ripple_gray_background.svg ......................... 38
List of Tables Table ES-1. Summary of Level of Service ................................................................................................... x Table 1. Summary of Levels of Service for Power Quality ........................................................................ 13 Table 2. Peak Power Levels ........................................................................................................................ 16 Table 3. Energy Use per Service Level ....................................................................................................... 17 Table 4. Duration of Daily Service ............................................................................................................. 17 Table 5. Time of Day Service ..................................................................................................................... 18 Table 6. Unplanned Power Interruptions, Assuming 24-Hour Service ...................................................... 19 Table 7. Planned Power Interruptions ......................................................................................................... 20 Table 8. Levels of Service for % Voltage Imbalance ................................................................................. 33 Table 9. Protection against Transients for Different Levels of Service ...................................................... 34 Table 10. Number of Short-Duration Variations for Level of Service ....................................................... 35 Table 11. Number of Long-Duration Variations for Level of Service........................................................ 36 Table 12. Range of Frequency for the Level of Service ............................................................................. 36 Table 13. Percent Voltage Drop for a Level of Service .............................................................................. 37 Table 14. Ripple for Given Level of Service .............................................................................................. 38 Table 15. Switching Noise for a Given Level of Service ........................................................................... 39 Table 16. Transient Protection for a Given Level of Service ..................................................................... 39 Table 17. Number of Faults Allowed Per Day for a Given Level of Service ............................................. 39
1 This report is available at no cost from the National Renewable Energy Laboratory (NREL) at www.nrel.gov/publications.
1 Introduction One of the key recommendations from a high-level public-private roundtable on mini-grids at the Fourth Clean Energy Ministerial in New Delhi, India, in 2013 was to “develop standards to set a level playing field, encourage investment, and drive down prices.” As a result of this recommendation, the U.S. Department of Energy (DOE) teamed with the National Renewable Energy Laboratory (NREL) to develop a Quality Assurance Framework (QAF) for isolated mini-grid power systems. This project was initiated in 2014 as a central component of the U.S-India Promoting Energy Access to Clean Energy (PEACE) initiative and is also part of the Clean Energy Ministerial’s Global Lighting and Energy Access Partnership (Global LEAP) initiative, Power Africa’s Beyond the Grid initiative, and the Sustainable Energy for All Clean Energy Mini-Grids High Impact Opportunity.
1.1 Definitions Building on the International Electrotechnical Commission (IEC) 62257 series definition of a micro-grid,1 the QAF’s proposed definition for mini-grids2 is as follows:
“A mini-grid is an aggregation of loads and one or more energy sources operating as a single system providing electric power and possibly heat isolated from a main power grid. A modern mini-grid may include renewable and fossil fuel-based generation, energy storage, and load control. Mini-grids are scalable so that additional generation capacity may be added to meet growing loads without compromising the stable operation of the existing mini-grid system.”
This proposed definition encompasses small, AC- and DC-based systems serving multiple customers through community-based power systems typically ranging between approximately 5 kilowatts (kW) to 1 megawatt (MW) in size and with only distribution-level electrical interconnection. System voltage levels are less than or equal to the country’s distribution voltage level (typically 13 kilovolts, or kV, and in some cases 33 kV). Note that in energy access contexts, the terms mini-grid and micro-grid are often used interchangeably, and the proposed definition above captures both terms with respect to isolated (i.e., not grid connected) systems relevant to energy access contexts.
1.2 Mini-Grids to Support Universal Energy Access Providing clean and affordable energy services to the more than 1 billion people globally who lack access to electricity will be a critical driver for poverty reduction, job creation, and improved health and social outcomes. More than 84% of populations without electricity are located in rural areas where traditional grid extension is not cost-effective; therefore, distributed energy solutions such as mini-grids are critical. The International Energy Agency (IEA) projects
1 The IEC 62257 series Recommendations for Renewable Energy and Hybrid Systems for Rural Electrification provides a definition for a micro-grid that focuses more on the distribution network of small, isolated electrical systems (IEC TS 62257-1:2015). 2 The term “micro-grid” has developed added specificity in some circles to include energy systems that typically operate directly connected to a larger central grid but can also operate disconnected from that grid. For this reason, the term “mini-grid” uses generally the same definition but assumes that the power system will not be connected to a larger central grid; and if it eventually is connected, it becomes a subset of that grid or can then become a micro-grid, which can be connected or disconnected from that grid as desired.
2 This report is available at no cost from the National Renewable Energy Laboratory (NREL) at www.nrel.gov/publications.
that to achieve universal energy access by 2030, more than 50% of unserved people will receive service through mini-grids power systems (IEA 2010).
There are several advantages to utilizing mini-grids and other decentralized solutions instead of extending the centralized grid. In some cases, extending the central grid, which is typically a longer-term and resource-intensive effort, may not be economically feasible, particularly for rural and remote populations in the near, mid, or even long term. In contrast, mini-grids can be deployed more rapidly, can be customized to local needs, and can better utilize local energy resources. Mini-grids are also scalable and expandable to match demand as it grows. Hybrid mini-grids—systems that combine renewable energy generation with fossil-fuel-powered generators—can be used to increase reliability and provide 24-hour power. Beyond residential applications, mini-grids can also power productive and community-level uses that drive local socio-economic development. Finally, modern mini-grids incorporate smart and efficient technologies, improving load management and overall system operation.
Despite the growing interest in mini-grids and the relative maturity of the technologies underlying them, there are a number of barriers to scaling up deployment. Demonstrating commercially sustainable models and attracting low-cost financing are two particularly significant challenges. These issues are linked to a number of factors, such as significant up-front investments required, difficulty in assessing local energy needs, uncertainty over a customer’s ability and willingness to pay for service, typically limited local technical capacity, as well as limited proven track record and high perception of risk by investors. In addition, uncertain policy and regulatory environments in many countries (e.g., lack of clarity on grid extension plans, tariff structures, licensing procedures, grid interconnection, and others) significantly impede mini-grid development. Lack of local technical expertise to enable maintenance and ensure long-term sustainability, lack of standardization (most mini-grids are custom designs), and lack of standard operating procedures and quality standards are all barriers. While flexibility must be maintained to allow for local conditions, some level of standardization would decrease risk and cost for system development. Finally, all players (investors, governments, customers, developers) require sufficient data and information about the sector to better evaluate the market and strengthen confidence in mini-grids as a viable electrification pathway.
Many solutions have been proposed to address these concerns, including:
• Encouraging local involvement and ongoing training/capacity building
• Supporting R&D and demonstration projects to enable experimentation with technologies and business models
• Developing approaches to strengthen business models, business practice, and operational efficiencies, such as:
o Including economic development opportunities and incorporating anchor tenants
o Developing and incorporating smart technologies such as theft protection, pre-payment meters, and load management technologies
o Promoting use of super-efficient appliances, equipment, and other end-use technologies.
3 This report is available at no cost from the National Renewable Energy Laboratory (NREL) at www.nrel.gov/publications.
• Increasing public and private financing options, including leveraging public-sector funding to catalyze increased private capital inflows into the sector
• Strengthening enabling policy and regulatory frameworks
• Collecting and sharing information that tracks demand, assessing energy resources, documenting best practices, and allowing new ideas to build on the documented successes and failure of other projects
• Tracking mini-grid development and performance, including through collecting data on existing mini-grid companies and projects and documenting investment flows
• Developing regional development or deployment models to expand the economies of scale through leveraging multiple projects.
These are complex, multi-faceted challenges, but crucial fora such as the Sustainable Energy for All’s High Impact Opportunity on Clean Energy Mini-Grids3 are working to convene stakeholders to strengthen the overall ecosystem for mini-grid development. The remainder of this report will focus on the QAF for mini-grids, an effort that aims to address a few of the root challenges discussed above.
1.3 Key Barriers to Scaling up Mini-Grids While the fundamental electrical engineering principles of mini-grids are well established, the details of mini-grid construction and operation vary considerably in practice, and projects can experience extreme variations in power quality and reliability. The lack of common operation, reporting, and financial practices results in a high-risk market of many individual projects that discourages private investment, which limits funding opportunities. Demand for electrification through mini-grids is hampered by uncertainty about the quality of service, accurate billing, low reliability, and safety. This creates a major barrier to the scale-up and aggregation needed to reduce transaction costs and attract the commercial financial investments that are required for rapid and widespread deployment. Developing successful business models that will allow this scale-up remains challenging.
Business models for utilities in mature energy markets work because the foundational roles and relationships among the stakeholder groups are well defined. Although a wide array of viable business concepts are used in rural energy markets, all of these have been developed based on a standard set of foundational principles. In the case of rural electrification, the utility models break down as a result of three main challenges:
• The high cost of providing power to remote customers
• Inconsistent cash flows from customers to the power supplier
• Poorly understood investment risk profile due to the small number and high variability of projects.
Mini-grids also differ based on the region, customers, and the available resources, which complicate the investment and development landscape. Because of their unique characteristics, mini-grids require separate development and performance guidelines that address those 3 http://www.se4all.org/hio_clean-energy-mini-grids
4 This report is available at no cost from the National Renewable Energy Laboratory (NREL) at www.nrel.gov/publications.
differences. Additionally, traditional large-utility regulations could make mini-grid options unaffordable and do not address the unique needs of rural and remote regions, such as operations and maintenance (O&M) challenges.
1.4 Mini-Grids as Mini-Utilities The modern utility sector is a model developed to address many of the challenges identified in this sector. Although this may seem obvious, many of the simple processes that are employed in the utility sector are not employed in the development or consideration of mini-grids. Some of these standard practices include:
• Standard customer classifications
• Defined power-quality provisions
• Defined contractual relations between the customer and the utility
• Collection and maintenance of customer and other general information
• Development of economies of scale to reduce development, deployment, and operational costs.
Although it is understood that the utility sector is not considered a model of best practice globally (many utilities in developing countries struggle to provide basic energy services while maintaining a viable business model), the sector in many mature economies such as the United States and Europe has been very successful. One of the goals for the QAF is to help lay the foundation in the mini-grid sector, allowing the market to develop by incorporating many of the successful features of the developed-world utility model.
Given that mini-grids are generally small, support a clearly defined service area, and are typically being implemented as new power systems, the use of utility principles as defined in the QAF will help ensure wider success of the sector, even if the larger electric utility industry for that region is struggling. There are many aspects of a small, community-based mini-grid-style power system that may make it more successful than larger utility-style systems.
There are several qualities of a utility model that, if applied to the off-grid market sector in a consistent way, will help the industry sustainably expand. These include:
• Standardization of customers: Since energy use is quite uniform across families and communities (i.e., the statistical distribution of energy needs in one community is unlikely to be that different from its neighbors), the classification of user energy needs allows for easy aggregation of customers. This aggregation allows economies of scale as well as making it much easier to plan and predict future energy needs once a baseline of information has been obtained. Because of this standardization of customer information, data collected from communities served by other providers can be used in planning for both initial implementation and growth, further reducing known risks.
• Diversification of risk: Utilities are typically well diversified, with many customers over relatively large areas. This partially insulates utilities from micro-scale market and technology changes. In rural electrification, diversification also assists in reducing overall risk; a power plant or transmission line may stop working, but if the utility is diversified,
5 This report is available at no cost from the National Renewable Energy Laboratory (NREL) at www.nrel.gov/publications.
the revenue streams and economies of scale of the larger supply network help limit impacts on customers. By its nature, one mini-grid is very dependent on local conditions, but a mini-utility or investor that operates multiple mini-grids with the same development and reporting structures (even if the technology is different) gains diversification that will help define the sustainability of all the mini-grids.
• Long-term data gathering: Successful utilities collect information about current energy usage. This information (power generation, sales, payment and disconnect rates, losses, load growth by customer class, etc.) not only allows the utility to operate more efficiently but also greatly improves planning and provides a solid record of account balances, which greatly reduces the potential risks that concern investors.
• Economies of scale across a utility system: The ability of a utility system to aggregate large numbers of customers allows increasing economies of scale throughout the O&M system.
Mini-grids deployed to date, however, typically lack many of the successful characteristics found in modern utilities. First, mini-grids deployed to provide initial energy services in under-developed areas provide a high-cost service to customers who are, in general, economically challenged. Although additional funding sources can be used to make providing services more affordable (subsidies, development grants, identification of anchor clients,4 economic development assistance, etc.), the basic business model of energy supply for remote, rural electrification remains challenging. In addition, the small number of customers for each mini-grid and the lack of economies of scale for most remote power applications can lead to reduced power quality and reliability, typically resulting in reduced project income as customers are reluctant to pay for low-quality service; this situation in turn compounds issues associated with company viability and equipment reliability. Lastly, a small number of projects results in the limited availability or transparency in performance information, which further limits economic investment in the companies that make up this sector. The implementation of a stronger utility model, including the bundling of multiple projects, can address some of these challenges.
Although the QAF does not provide a direct solution to all of these issues, its standard level of service tiers and accountability and performance reporting elements provide a consistent foundational framework to help address many of the critical faults currently found in the mini-grid market sector while retaining much-needed flexibility.
1.5 Standards Associated with Mini-Grid Power Systems International and domestic standards5 are a major force in the development and implementation of the electric sector, helping to ensure high-quality, safe, and reliable energy services. 4 An anchor client in the context of isolated power systems is a large private (or in some contexts public) energy customer that can provide a consistent source of project income from high-value energy sales. In many rural communities, a local industry, cellular provider, or government services (e.g., schools or health clinics) can act as anchor clients if they pay promptly. In many cases, power can be provided to such clients at a lower cost than the entities are paying for energy services directly, creating additional benefits across the community. The existence of strong anchor clients can help reduce the perceived risk by private sector investors as they can provide a defined source of long-term revenue. 5 The generic term “standards” typically encompasses a wide array of accepted and agreed-upon conditions that can cover a range of different understandings, including guidelines, technical specifications, and actual standards. Each of these terms designates a different level of general market consensus that new or differing results will not be
6 This report is available at no cost from the National Renewable Energy Laboratory (NREL) at www.nrel.gov/publications.
International standards typically try to set common frameworks that allow equipment and services to be applied widely, creating economies of scale across the power sector. Domestic standards expand upon and in some cases modify international standards based on local needs and design practices. International standards may be applied in the absence of a national standard or if a project will be applied over several nation states, again lowering overall project costs.
The role that international standards have played in the development of the power sector should not be underestimated. The ability of equipment to be designed and built universally and then applied almost globally allows companies to provide lower-cost products that can be sourced almost anywhere. Common design standards allow power sector workers to move freely, building or repairing consistent systems and equipment. Without such common frameworks, the world would be a very different place.
Some of the more accepted standards include those by the IEC6 and the Institute of Electrical and Electronic Engineers (IEEE).7 The National Fire Protection Association8 using American National Standards Institute (ANSI)9 procedures developed the U.S. National Electrical Code that is used widely in the international deployment of power systems. Additionally, organizations such as the World Bank have funded best practice guides which, although not standards, have been adopted widely across the developing world and in many ways serve a similar function in the absence of international standards.
In the design and development of mini-grid power systems, several types of standards are applicable. Initially the IEC developed design and safety standards for many of the components that make up power systems, such as IEC 61215, Crystalline Silicon Terrestrial Photovoltaic (PV) Modules- Design Qualification and Type Approval.10 Other standards help ensure that the additional elements of the power system are designed in a consistent way (e.g., IEC 60287, which specifies the ratings of electrical cables that may interconnect equipment, or IEC 60364-7-712:2002, Electrical Installations of Buildings, which addresses the electrical interconnection of a building).
The IEC is divided into Technical Committees (TCs) and Project Committees (PCs) that develop standards.11 Although not an exhaustive list, the committees of primary interest for mini-grid power systems are the following:
• TC 2: Rotating machinery
• TC 4: Hydraulic turbines (hydropower)
• TC 8: Systems aspects for electrical energy supply
found. For example, a guideline is issued when the developing organization feels that a specification is warranted but new ideas or technologies may be identified that would fall outside of or make the guideline obsolete. This document uses the words “standard” or “standards” to cover all of these descriptions. 6 http://www.iec.ch/ 7 http://www.ieee.org/index.html 8 http://www.nfpa.org/ 9 https://www.ansi.org/ 10 http://ulstandards.ul.com/standard/?id=61215_1 11 A list is available at http://www.iec.ch
7 This report is available at no cost from the National Renewable Energy Laboratory (NREL) at www.nrel.gov/publications.
• TC 13: Electrical energy measurement and control
• TC 21: Secondary cells and batteries
• TC 64: Electrical installations and protection against electric shock
• TC 82: Solar photovoltaic energy systems
• TC 88: Wind energy generation systems
• TC 114: Marine energy – wave, tidal, and other water current converters
• PC 118: Smart grid user interface
• TC 120: Electrical energy storage systems. Other standards, such as ANSI C84.1: Voltage Ratings for Electric Power Systems and Equipment12 and IEEE 1159: Recommended Practice for Monitoring Electric Power Quality,13 provide guidance on the electrical output of power systems and how they should be monitored. Lastly, standards such as IEC technical specification TS/62257: Recommendations for Small Renewable Energy and Hybrid Systems for Rural Electrification (IEC 2005) provide design guidance on the development and installation of mini-grid power systems, although they do not provide strong guidance on the interconnection and integration of different generation sources as part of an isolated power system.
As described in Section 1.1, micro-grid technology has developed quite extensively, and currently there are efforts to develop more defined best practices and standards for these systems. Because these power systems are designed to connect and disconnect from the grid, the need for more advanced technology, control, and communications is required. At the time of this writing, no defined international accepted standards with respect to micro-grids have been developed. It is also unclear if these standards would be applicable to isolated power systems.
For the benefits of standards to be realized, they need to be enforced. In areas with strong governmental control and institutional functionality, power system developers and operators must operate within defined national standards. A process to document adherence to the appropriate standards is clearly defined and implemented. In other locations, especially in rural areas, government regulations are weak and in many cases not applied. However, to be successful over the longer term, companies, funding agencies, and the population should insist on the incorporation of standards, even if they are enforced by government procedures.
The QAF was envisioned to fill a known gap in the wide deployment of mini-grid power systems that largely lies outside of existing standards. In fact, it is not appropriate for many of the QAF concepts to become standards because they lack technical specificity and there is a need to maintain reporting flexibility. Although not defined as standards, expanded uniformity in performance requirements, consumer needs identification, and data collection is helpful. The development of the QAF also helps the industry by introducing a more common language in reference to mini-grid power systems, allowing comparisons between different market suppliers and solution providers.
12 https://www.nema.org/Standards/ComplimentaryDocuments/Contents-and-Scope-ANSI-C84-1-2011.pdf 13 https://standards.ieee.org/develop/project/1159.html
8 This report is available at no cost from the National Renewable Energy Laboratory (NREL) at www.nrel.gov/publications.
2 Introduction to the Quality Assurance Framework In order for mini-grid business models to be effective as a means to expanding energy access, power must be affordable to a customer base that is typically cost sensitive (limited ability to pay) and provide quality and reliable service that meet the customer’s needs (willingness to pay). As a result, the ability to deliver value while minimizing costs is a key determinant of the success of mini-grid projects. Yet achieving this balance is challenging due to the high up-front costs for mini-grids and is exacerbated by the ad-hoc and fragmented approach to developing mini-grids, characterized by a lack of standard technologies and operational best practices, limited sector data, and lack of enabling environments.
The QAF for mini-grids aims to address some of the root challenges of providing quality and affordable power to remote customers through financially viable mini-grids by defining (1) standard technical specifications for power quality, reliability, and availability that are appropriate for different tiers of end-user service, and (2) a standard accountability and performance reporting framework that will provide a clear process of validating power delivery to customers, funders, and/or regulators. The framework addresses both AC and DC mini-grids and is applicable to renewable, fossil-fuel, and hybrid systems. The concepts behind the QAF are also independent of the business models used for operating a mini-grid business, but they help define several of the foundational concepts on which the businesses can be built. The QAF will provide a flexible alternative to rigid top-down standards for mini-grids in energy access contexts, outlining a standard set of tiers of end-user service and linking them to relevant technical parameters, coupled with a complementary framework for performance tracking and reporting. These core elements of the QAF aim to preserve flexibility while providing a foundational structure that can put the sector on track to resemble a mature utility in scale and sophistication. In addition, data generated through implementation of the QAF will provide the foundation for comparisons across projects, assessment of impacts, and greater confidence that will drive investment and scale-up in this sector.
2.1 Overview of the Quality Assurance Framework The QAF has two components:
• It defines different levels of service, including appropriate thresholds for power quality, reliability, and availability, which can be used throughout the energy supply process, from community assessment through system operations and long-term planning. These levels of service span the entire energy ladder, from basic energy service to high-quality, high reliability, and high-availability service (the equivalent to what is available in most central grid power systems, sometimes referred to as “grid parity”) and provide a common technical basis for classifying mini-grids and energy customer. It should also be understood that the definitions of the different levels are intended to be notional (though in some cases with legal or regulatory backing) and should not be considered absolute.
• It will specify a common accountability and performance reporting framework based on utility models in developed energy markets that will define a clear process for validating power delivery by providing trusted information to customers, funders, and regulators. The performance reporting protocol can also serve as a robust monitoring and evaluation tool for mini-grid operators and funding organizations. This framework will
9 This report is available at no cost from the National Renewable Energy Laboratory (NREL) at www.nrel.gov/publications.
lay the foundation for sustainable business models in the mini-grid space by clearly defining the roles and relationships of the various stakeholders.
The goal of the QAF is not to mandate a specific level of service but rather to define service levels that ensure safe, quality, and affordable delivery of basic grid parity service and to provide an accountability framework that can be used to determine whether an agreed-upon level of service is delivered.
It is also understood that any such framework, even if adopted as an international standard, would not supersede domestic standards but would be applied or adapted to support those standards.
2.2 Levels of Service Framework Overview The QAF levels of energy service have three components covering power quality, reliability, and availability. For each of these, the QAF defines technical specifications corresponding to different service tiers. An expanded discussion of the elements that define the levels of service is provided in Section 3 of this document, while discussions on how the levels of service would be applied are presented in Section 4 The suggested range for key parameters presented in the QAF has been determined through literature searches into similar codes, stakeholder meetings, and interviews with mini-grid installers.
The value of a common definition of levels of service goes well beyond simply codifying an agreement between a supplier and consumer of energy services. The following provides some examples of the benefits of the levels of service framework:
• Allows a regulator or project funder to define minimum performance criteria for energy supply
• Allows a utility to aggregate customers within and across disparate power systems
• Provides a common methodology to classify energy users and assess energy needs across communities, nations, or regions
• Allows a common methodology for reporting energy usage and assessing trends over time, informing planning activities by project developers, operators, and rural electrification agencies.
2.2.1 Power Quality This section of the guidelines defines power quality parameters using common electrical codes in the United States and Europe as the upper bounds and the minimum power quality that will not damage common electrical appliances (lighting, household appliances, etc.) as the lower bound. As appropriate, this defined range is also segmented to reflect differing power quality needs based on the expected load types. Both AC and DC systems are addressed from a power quality perspective.
Power quality in the QAF is characterized by the following elements:
• Voltage imbalance (AC)
• Transients often caused by lightning (AC, DC)
10 This report is available at no cost from the National Renewable Energy Laboratory (NREL) at www.nrel.gov/publications.
• Short-duration variations (AC, DC)
• Long-duration variations (AC, DC)
• Frequency variations (AC)
• Resistive voltage drop (DC)
• DC ripple (DC)
• Switching noise (DC).
2.2.2 Power Availability Power availability can be defined by three basic parameters, as introduced in the World Bank’s multi-tier framework developed by Mikul Bhatia and Nicolina Angelou (Bhatia and Angelou 2015):
• Power draw (in amps or watts): The maximum power draw in amps or watts available to a customer or a class of customers. Six service levels are specified between a minimum of 3 watts through greater than 5,000 watts. Although 3 watts is considered small in terms of service for mini-grids, conversations with system operators indicate that systems providing service as low as 20 watts are being implemented and 3 watts maintains consistency with the multi-tier framework.
• Energy available (over a time period): The amount of energy available that a customer or class of customers would be expected to use. This is independent of how the customer is charged for energy consumption. Expanding on the ranges provided in the multi-tier framework structure, aggregated energy usage starting from 365 Watt-hour/month (12 Watt-hour/day and 4.38 kWh/year) through greater than 600 kWh/month (20 kWh/day and 7,300 kWh/year) is currently being considered. This value is high for a standard rural residence but may not be appropriate for a home with an integrated small business.
• Duration of daily service: Independent of system reliability, energy service can be provided for full-service power 24 hours per day or may only be provided for specific hours per day. Additionally, the specific time of day when service is provided is also relevant. Duration and time of day can be defined on a consumer needs basis. Service tiers under this category are defined based on the level of certainty with which hours of service are guaranteed.
These parameters will directly impact the size and type of power system that will optimally provide the specified levels of service. Additionally, an increase in any of these parameters means an increased level of service that could result in a different service charge due to additional power system capacity required to provide that service. The QAF does not attempt to specify a price for service or even the means for collection, serving only as a framework that specifies different expectations of service for both the consumer and provider.
2.2.3 Power Reliability Beyond power quality, the reliability of that power is also relevant. In the context of a mini-grid, power reliability can be addressed through two common assessment terms for electrical outages, considering both the frequency and duration of those outages:
11 This report is available at no cost from the National Renewable Energy Laboratory (NREL) at www.nrel.gov/publications.
• System Average Interruption Frequency Index (SAIFI)
• System Average Interruption Duration Index (SAIDI). These terms were developed in the context of utility grid systems and are defined in more detail in Section 3. These common terms of use in the utility industry are defined in the mini-grid context with an applicable range anchored on one end by grid quality. Modified terms, using a subscript to identify the number of hours per day that service is provided, are also defined for mini-grid systems that are not designed for 24/7 power supply.
Providing different measures for planned and unplanned power outages is especially important for renewable-only power systems that may have a large amount of planned energy outages, especially during specified low-resource times of the year or if the system is only designed to provide energy for part of the day, such as for evening lighting. In some instances, especially if there is industrial or other process energy usage, knowledge or pre-announcements of energy outages can be much less disruptive.
2.3 Accountability Framework Overview The accountability framework has two elements to ensure truth in advertising: a specification of the quality of service and the articulation of a standard assessment method. This accountability framework helps strengthen customer, investor, and regulator confidence by documenting and reporting operational performance. An expanded discussion of the QAF elements is provided in Section 4.
2.3.1 Customer Accountability Customer accountability defines a process to provide customers with trusted information on the level of service they are receiving and a clear way to confirm that they are receiving that service. Without an ability to understand personal energy usage (or in the extreme case, the potential damage of appliances due to poor power quality), the value and thus willingness to pay for energy services will be reduced. To help maintain strong customer support, processes must be available for customers to know whether they are receiving the service that they agreed to pay for, and mechanisms must be in place to verify power delivery to customers. This section of the QAF defines a set of performance concepts and the equipment that will be needed to implement the procedures.
Performance parameters include:
• Ability to check voltage levels at service drops
• Periodic recorded voltage surveys conducted to ensure compliance
• Ability to record hours of service at service drops
• Documented technical summary of energy services including power and consumption.
2.3.2 Utility Accountability In all mature energy markets, an entity is responsible for ensuring appropriate safety and provision of a specified level of service, even if that organization is not an active participant in the energy market (such as a state or federal regulator or electrical standards body). Formal
12 This report is available at no cost from the National Renewable Energy Laboratory (NREL) at www.nrel.gov/publications.
reporting also allows regulators, funders, and other organizations a better understanding of the near- and long-term condition of businesses in the utility sector, both technical and financial. This allows a better understanding of the market risks for current and future investments and is documented through two levels of formal performance reporting:
• Technical information: Measurements addressing system performance, energy usage, safety concerns, and operational issues, such as:
o Periodic, random, and documented end user voltage surveys to ensure proper service, primarily focused on customer power quality
o Central station power quality
o System efficiency (including measures of distribution losses [kWh generated vs. kWh sold] and power production [kWh generated vs. measure of fuel])
o Percent of renewable energy contribution over a defined time period.
• Business (non-technical) information: Measurements that allow an understanding of overall energy usage, payment rates, and cost of system operations, such as:
o Electrification and payment rates of customer
o Customer characteristics, including load growth by market sector
o O&M, repair, and management costs
o Safety issues or incident reports.
In addition to the above-mentioned operation and financial reporting, other documents should be ready available, such as generic user agreements, system commissioning reports, O&M logs, and standard rate schedules.
2.3.3 Monitoring and Performance Reporting Process General accountability will only be achieved if a defined and validated process of data collection and reporting is maintained. This monitoring and performance reporting process would likely include a combination of automated and manual data recording, with defined reporting systems that would be independently verified. If the QAF is implemented as part of a national or sub-national, multi-community electrification program, developing and documenting the data collection, reporting, and validation process will need to be implemented as part of early program development. Additional guidance on monitoring and reporting processes is provided in Section 4, and sample technical and business reporting forms are provided in Appendices C and D. This guidance is based on a combination of industry best practices from the mature utility sector and input from mini-grid stakeholders during QAF consultation workshops. However, while the QAF provides general guidance and recommendations, it does not prescribe detailed monitoring and reporting procedures (e.g., instrumentation, measurement frequency, data management, etc.) in order to preserve flexibility on the part of project regulators, investors, and developers. The base level of information recommended may be extensive and too costly for a small, low-cost system but insufficient for a larger, multi-technology mini-grid system. More specific information is being developed as part of the forthcoming QAF implementation guide, technical validation documentation, and through the initial implementation of the QAF on real mini-grid systems. Learning from these activities will be shared widely.
13 This report is available at no cost from the National Renewable Energy Laboratory (NREL) at www.nrel.gov/publications.
3 Levels of Service Framework Section 2 provides an overview of the levels of service and the three related factors: power quality, power availability, and power reliability. Each of these factors is discussed in more detail in the following sections.
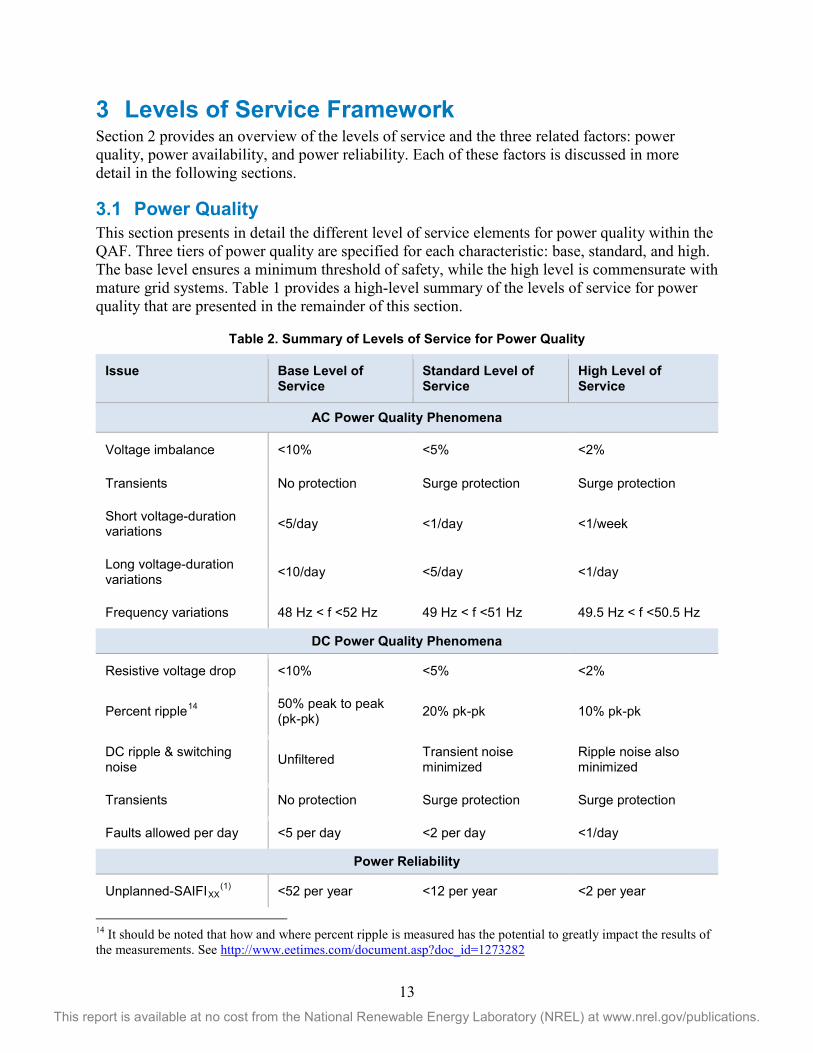
3.1 Power Quality This section presents in detail the different level of service elements for power quality within the QAF. Three tiers of power quality are specified for each characteristic: base, standard, and high. The base level ensures a minimum threshold of safety, while the high level is commensurate with mature grid systems. Table 1 provides a high-level summary of the levels of service for power quality that are presented in the remainder of this section.
Table 2. Summary of Levels of Service for Power Quality
Issue Base Level of Service
Standard Level of Service
High Level of Service
AC Power Quality Phenomena
Voltage imbalance <10% <5% <2%
Transients No protection Surge protection Surge protection
Short voltage-duration variations <5/day <1/day <1/week
Long voltage-duration variations <10/day <5/day <1/day
Frequency variations 48 Hz < f <52 Hz 49 Hz < f <51 Hz 49.5 Hz < f <50.5 Hz
DC Power Quality Phenomena
Resistive voltage drop <10% <5% <2%
Percent ripple14 50% peak to peak (pk-pk) 20% pk-pk 10% pk-pk
DC ripple & switching noise Unfiltered Transient noise
minimized Ripple noise also minimized
Transients No protection Surge protection Surge protection
Faults allowed per day <5 per day <2 per day <1/day
Power Reliability
Unplanned-SAIFIXX(1) <52 per year <12 per year <2 per year
14 It should be noted that how and where percent ripple is measured has the potential to greatly impact the results of the measurements. See http://www.eetimes.com/document.asp?doc_id=1273282
14 This report is available at no cost from the National Renewable Energy Laboratory (NREL) at www.nrel.gov/publications.
Issue Base Level of Service
Standard Level of Service
High Level of Service
Unplanned-SAIDIXX(1) <876 hours (90%
reliability) <438 hours (95% reliability)
<1.5 hours (99.99% reliability
Planned-SAIFIXX(1) No requirement but
should be defined No requirement but should be defined <2 per year
Planned-SAIDIXX(1) No requirement but
should be defined No requirement but should be defined
<30 minutes - 100% reliability
(1) SAIFI and SAIDI are typically assumed for power systems that are specified to provide full time, 24 hours/day, of energy service. A subscript is used in this report for systems that provide partial hours/day service since the number of planned and unplanned interruptions and length of any interruptions should be normalized by the percent of hours of service.
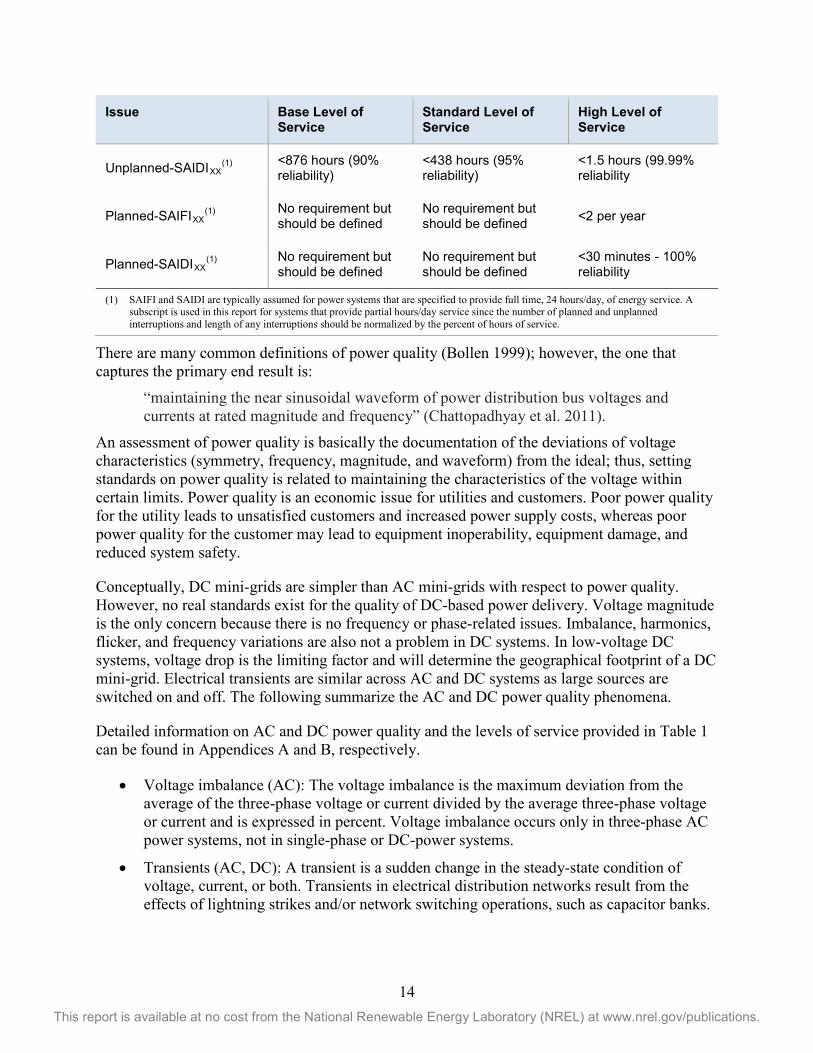
There are many common definitions of power quality (Bollen 1999); however, the one that captures the primary end result is:
“maintaining the near sinusoidal waveform of power distribution bus voltages and currents at rated magnitude and frequency” (Chattopadhyay et al. 2011).
An assessment of power quality is basically the documentation of the deviations of voltage characteristics (symmetry, frequency, magnitude, and waveform) from the ideal; thus, setting standards on power quality is related to maintaining the characteristics of the voltage within certain limits. Power quality is an economic issue for utilities and customers. Poor power quality for the utility leads to unsatisfied customers and increased power supply costs, whereas poor power quality for the customer may lead to equipment inoperability, equipment damage, and reduced system safety.
Conceptually, DC mini-grids are simpler than AC mini-grids with respect to power quality. However, no real standards exist for the quality of DC-based power delivery. Voltage magnitude is the only concern because there is no frequency or phase-related issues. Imbalance, harmonics, flicker, and frequency variations are also not a problem in DC systems. In low-voltage DC systems, voltage drop is the limiting factor and will determine the geographical footprint of a DC mini-grid. Electrical transients are similar across AC and DC systems as large sources are switched on and off. The following summarize the AC and DC power quality phenomena.
Detailed information on AC and DC power quality and the levels of service provided in Table 1 can be found in Appendices A and B, respectively.
• Voltage imbalance (AC): The voltage imbalance is the maximum deviation from the average of the three-phase voltage or current divided by the average three-phase voltage or current and is expressed in percent. Voltage imbalance occurs only in three-phase AC power systems, not in single-phase or DC-power systems.
• Transients (AC, DC): A transient is a sudden change in the steady-state condition of voltage, current, or both. Transients in electrical distribution networks result from the effects of lightning strikes and/or network switching operations, such as capacitor banks.
15 This report is available at no cost from the National Renewable Energy Laboratory (NREL) at www.nrel.gov/publications.
• Short-duration voltage variations (AC, DC): Short-duration voltage variations encompass root-mean-square (rms) deviations at power frequencies for less than 1 minute and are caused by fault conditions, energizing large loads that require high starting currents, or intermittent loose connections in power wiring.
• Long-duration voltage variations (AC, DC): Long-duration variations encompass rms deviations at power frequencies for longer than 1 minute. When the supply voltage has been zero for a period of time in excess of 1 minute, the long-duration voltage variation is considered a sustained interruption.
• Frequency variations (AC): Deviation of power system supply frequency from the specified nominal value is directly related to rotational speed of generators. The main causes of frequency variations are faults on bulk transmission system, large loss of load, and large loss of generation. This is more likely to be a problem in a system with a high contribution of variable generation sources and often occurs in an isolated system.
• Resistive voltage drop (DC): Electrical resistance increases the farther current flows through an electrical wire; a higher resistance reduces the voltage. Therefore the farther the load is from the power source, the higher a distribution system-induced resistive voltage drop will be, simply decreasing the DC voltage at the load. Voltage drop will limit the geographical footprint of a DC mini-grid.
• DC ripple (DC): DC ripple is an artifact of the AC-to-DC conversion process as it is difficult to remove all variation in the alternating current. This is a concern only if AC-to-DC conversion (rectification) is employed. DC ripple can cause additional wear on devices designed to operate at a fixed DC voltage, including radios and televisions. DC ripple should not be a concern for DC-only power systems.
• Switching noise (DC): Switching noise, a higher-speed variation in the DC voltage, is caused by operation of power electronic switches. Switching noise can be eliminated or reduced by expanded filtering, but this increases equipment costs so it is more of a problem with low-quality power electronics.
3.2 Power Availability Power availability is the amount of energy services being provided to customers and should be associated to the customers’ ability and willingness to pay for that service. The power availability can be expected to change over the life of the utility-customer relationship.
Three main criteria drive power availability:
• Power: Maximum draw in amps or watts
• Energy: Total energy available (kWh) over a defined time period (month, year)
• Duration of daily service: Number of hours in a day that power is available (hours/day). In developing the different levels of service defined below, we used the multi-tier framework (Bhatia and Angelou 2015) as a guide. Unlike the QAF, the multi-tier framework does not provide sufficient detail to inform technical specifications for power system design because it combines all attributes into one tier, which reduces the information that is used by project designers and developers. The multi-tier framework provides a very good methodology to
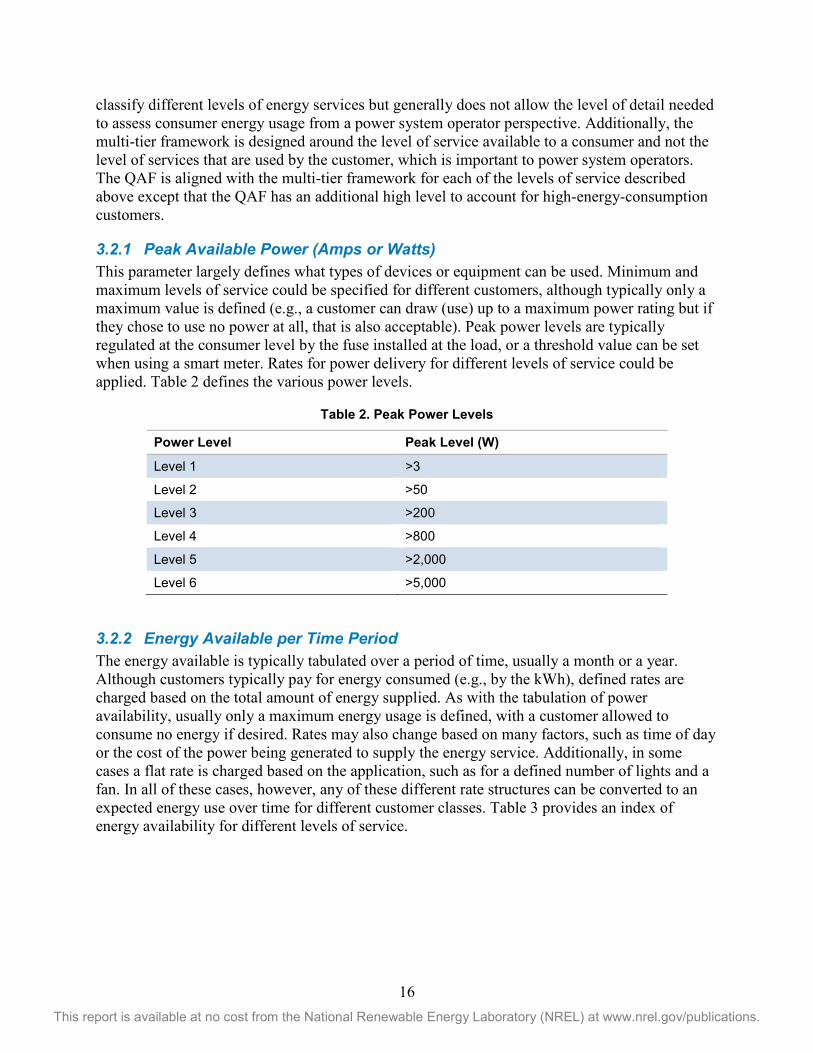
16 This report is available at no cost from the National Renewable Energy Laboratory (NREL) at www.nrel.gov/publications.
classify different levels of energy services but generally does not allow the level of detail needed to assess consumer energy usage from a power system operator perspective. Additionally, the multi-tier framework is designed around the level of service available to a consumer and not the level of services that are used by the customer, which is important to power system operators. The QAF is aligned with the multi-tier framework for each of the levels of service described above except that the QAF has an additional high level to account for high-energy-consumption customers.
3.2.1 Peak Available Power (Amps or Watts) This parameter largely defines what types of devices or equipment can be used. Minimum and maximum levels of service could be specified for different customers, although typically only a maximum value is defined (e.g., a customer can draw (use) up to a maximum power rating but if they chose to use no power at all, that is also acceptable). Peak power levels are typically regulated at the consumer level by the fuse installed at the load, or a threshold value can be set when using a smart meter. Rates for power delivery for different levels of service could be applied. Table 2 defines the various power levels.
Table 2. Peak Power Levels
Power Level Peak Level (W)
Level 1 >3
Level 2 >50
Level 3 >200
Level 4 >800
Level 5 >2,000
Level 6 >5,000
3.2.2 Energy Available per Time Period The energy available is typically tabulated over a period of time, usually a month or a year. Although customers typically pay for energy consumed (e.g., by the kWh), defined rates are charged based on the total amount of energy supplied. As with the tabulation of power availability, usually only a maximum energy usage is defined, with a customer allowed to consume no energy if desired. Rates may also change based on many factors, such as time of day or the cost of the power being generated to supply the energy service. Additionally, in some cases a flat rate is charged based on the application, such as for a defined number of lights and a fan. In all of these cases, however, any of these different rate structures can be converted to an expected energy use over time for different customer classes. Table 3 provides an index of energy availability for different levels of service.
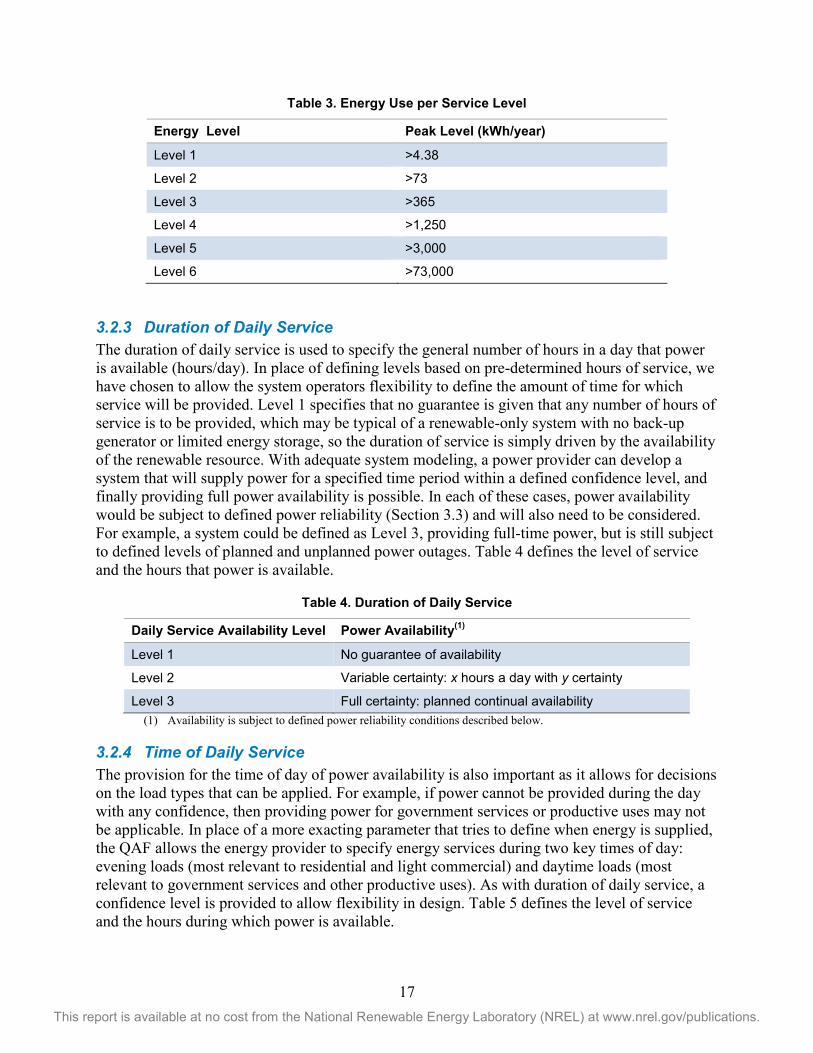
17 This report is available at no cost from the National Renewable Energy Laboratory (NREL) at www.nrel.gov/publications.
Table 3. Energy Use per Service Level
Energy Level Peak Level (kWh/year)
Level 1 >4.38
Level 2 >73
Level 3 >365
Level 4 >1,250
Level 5 >3,000
Level 6 >73,000
3.2.3 Duration of Daily Service The duration of daily service is used to specify the general number of hours in a day that power is available (hours/day). In place of defining levels based on pre-determined hours of service, we have chosen to allow the system operators flexibility to define the amount of time for which service will be provided. Level 1 specifies that no guarantee is given that any number of hours of service is to be provided, which may be typical of a renewable-only system with no back-up generator or limited energy storage, so the duration of service is simply driven by the availability of the renewable resource. With adequate system modeling, a power provider can develop a system that will supply power for a specified time period within a defined confidence level, and finally providing full power availability is possible. In each of these cases, power availability would be subject to defined power reliability (Section 3.3) and will also need to be considered. For example, a system could be defined as Level 3, providing full-time power, but is still subject to defined levels of planned and unplanned power outages. Table 4 defines the level of service and the hours that power is available.
Table 4. Duration of Daily Service
Daily Service Availability Level Power Availability(1)
Level 1 No guarantee of availability
Level 2 Variable certainty: x hours a day with y certainty
Level 3 Full certainty: planned continual availability (1) Availability is subject to defined power reliability conditions described below.
3.2.4 Time of Daily Service The provision for the time of day of power availability is also important as it allows for decisions on the load types that can be applied. For example, if power cannot be provided during the day with any confidence, then providing power for government services or productive uses may not be applicable. In place of a more exacting parameter that tries to define when energy is supplied, the QAF allows the energy provider to specify energy services during two key times of day: evening loads (most relevant to residential and light commercial) and daytime loads (most relevant to government services and other productive uses). As with duration of daily service, a confidence level is provided to allow flexibility in design. Table 5 defines the level of service and the hours during which power is available.
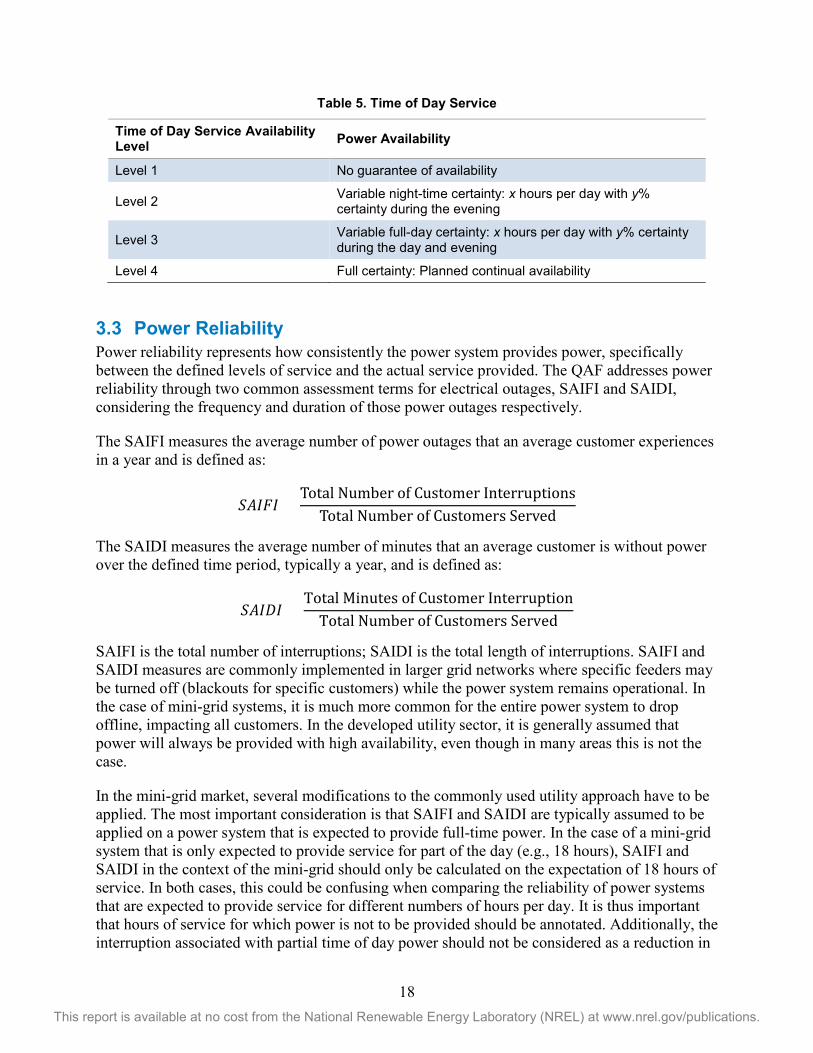
18 This report is available at no cost from the National Renewable Energy Laboratory (NREL) at www.nrel.gov/publications.
Table 5. Time of Day Service
Time of Day Service Availability Level Power Availability
Level 1 No guarantee of availability
Level 2 Variable night-time certainty: x hours per day with y% certainty during the evening
Level 3 Variable full-day certainty: x hours per day with y% certainty during the day and evening
Level 4 Full certainty: Planned continual availability
3.3 Power Reliability Power reliability represents how consistently the power system provides power, specifically between the defined levels of service and the actual service provided. The QAF addresses power reliability through two common assessment terms for electrical outages, SAIFI and SAIDI, considering the frequency and duration of those power outages respectively.
The SAIFI measures the average number of power outages that an average customer experiences in a year and is defined as:
𝑆𝑆𝑆𝑆𝑆𝑆𝑆𝑆𝑆𝑆 =Total Number of Customer Interruptions
Total Number of Customers Served
The SAIDI measures the average number of minutes that an average customer is without power over the defined time period, typically a year, and is defined as:
𝑆𝑆𝑆𝑆𝑆𝑆𝑆𝑆𝑆𝑆 =Total Minutes of Customer Interruption
Total Number of Customers Served
SAIFI is the total number of interruptions; SAIDI is the total length of interruptions. SAIFI and SAIDI measures are commonly implemented in larger grid networks where specific feeders may be turned off (blackouts for specific customers) while the power system remains operational. In the case of mini-grid systems, it is much more common for the entire power system to drop offline, impacting all customers. In the developed utility sector, it is generally assumed that power will always be provided with high availability, even though in many areas this is not the case.
In the mini-grid market, several modifications to the commonly used utility approach have to be applied. The most important consideration is that SAIFI and SAIDI are typically assumed to be applied on a power system that is expected to provide full-time power. In the case of a mini-grid system that is only expected to provide service for part of the day (e.g., 18 hours), SAIFI and SAIDI in the context of the mini-grid should only be calculated on the expectation of 18 hours of service. In both cases, this could be confusing when comparing the reliability of power systems that are expected to provide service for different numbers of hours per day. It is thus important that hours of service for which power is not to be provided should be annotated. Additionally, the interruption associated with partial time of day power should not be considered as a reduction in
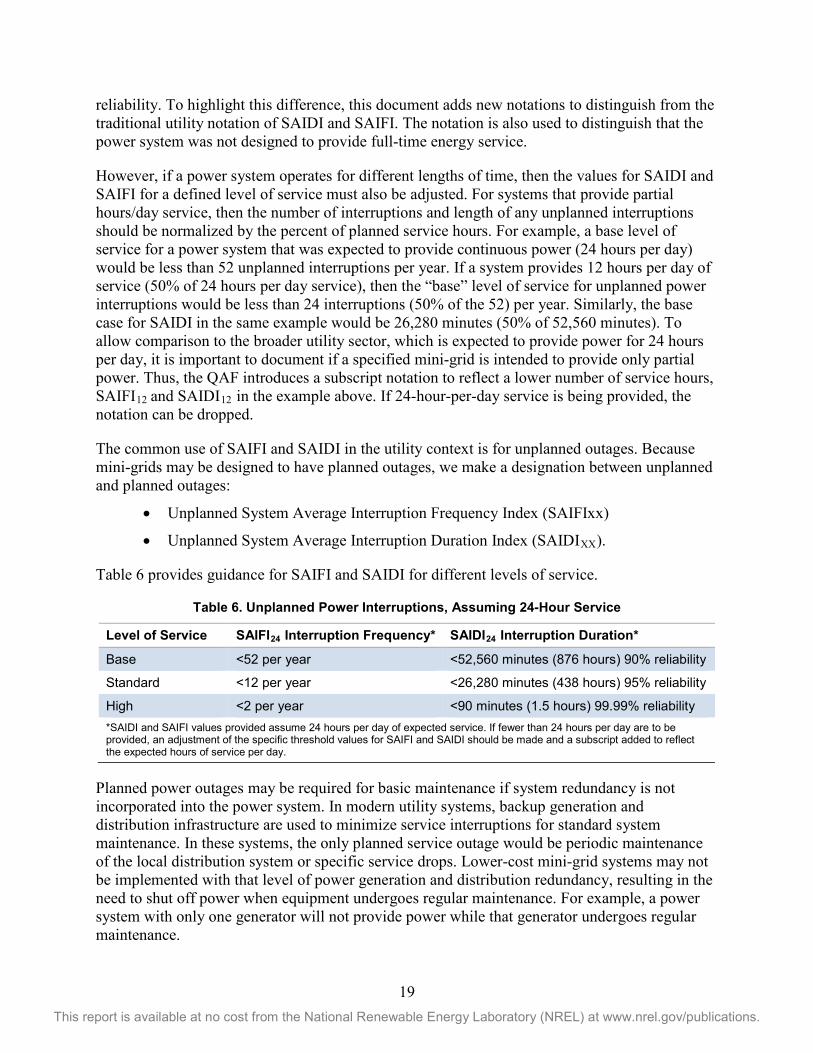
19 This report is available at no cost from the National Renewable Energy Laboratory (NREL) at www.nrel.gov/publications.
reliability. To highlight this difference, this document adds new notations to distinguish from the traditional utility notation of SAIDI and SAIFI. The notation is also used to distinguish that the power system was not designed to provide full-time energy service.
However, if a power system operates for different lengths of time, then the values for SAIDI and SAIFI for a defined level of service must also be adjusted. For systems that provide partial hours/day service, then the number of interruptions and length of any unplanned interruptions should be normalized by the percent of planned service hours. For example, a base level of service for a power system that was expected to provide continuous power (24 hours per day) would be less than 52 unplanned interruptions per year. If a system provides 12 hours per day of service (50% of 24 hours per day service), then the “base” level of service for unplanned power interruptions would be less than 24 interruptions (50% of the 52) per year. Similarly, the base case for SAIDI in the same example would be 26,280 minutes (50% of 52,560 minutes). To allow comparison to the broader utility sector, which is expected to provide power for 24 hours per day, it is important to document if a specified mini-grid is intended to provide only partial power. Thus, the QAF introduces a subscript notation to reflect a lower number of service hours, SAIFI12 and SAIDI12 in the example above. If 24-hour-per-day service is being provided, the notation can be dropped.
The common use of SAIFI and SAIDI in the utility context is for unplanned outages. Because mini-grids may be designed to have planned outages, we make a designation between unplanned and planned outages:
• Unplanned System Average Interruption Frequency Index (SAIFIxx)
• Unplanned System Average Interruption Duration Index (SAIDIXX).
Table 6 provides guidance for SAIFI and SAIDI for different levels of service.
Table 6. Unplanned Power Interruptions, Assuming 24-Hour Service
Level of Service SAIFI24 Interruption Frequency* SAIDI24 Interruption Duration*
Base <52 per year <52,560 minutes (876 hours) 90% reliability
Standard <12 per year <26,280 minutes (438 hours) 95% reliability
High <2 per year <90 minutes (1.5 hours) 99.99% reliability *SAIDI and SAIFI values provided assume 24 hours per day of expected service. If fewer than 24 hours per day are to be provided, an adjustment of the specific threshold values for SAIFI and SAIDI should be made and a subscript added to reflect the expected hours of service per day.
Planned power outages may be required for basic maintenance if system redundancy is not incorporated into the power system. In modern utility systems, backup generation and distribution infrastructure are used to minimize service interruptions for standard system maintenance. In these systems, the only planned service outage would be periodic maintenance of the local distribution system or specific service drops. Lower-cost mini-grid systems may not be implemented with that level of power generation and distribution redundancy, resulting in the need to shut off power when equipment undergoes regular maintenance. For example, a power system with only one generator will not provide power while that generator undergoes regular maintenance.
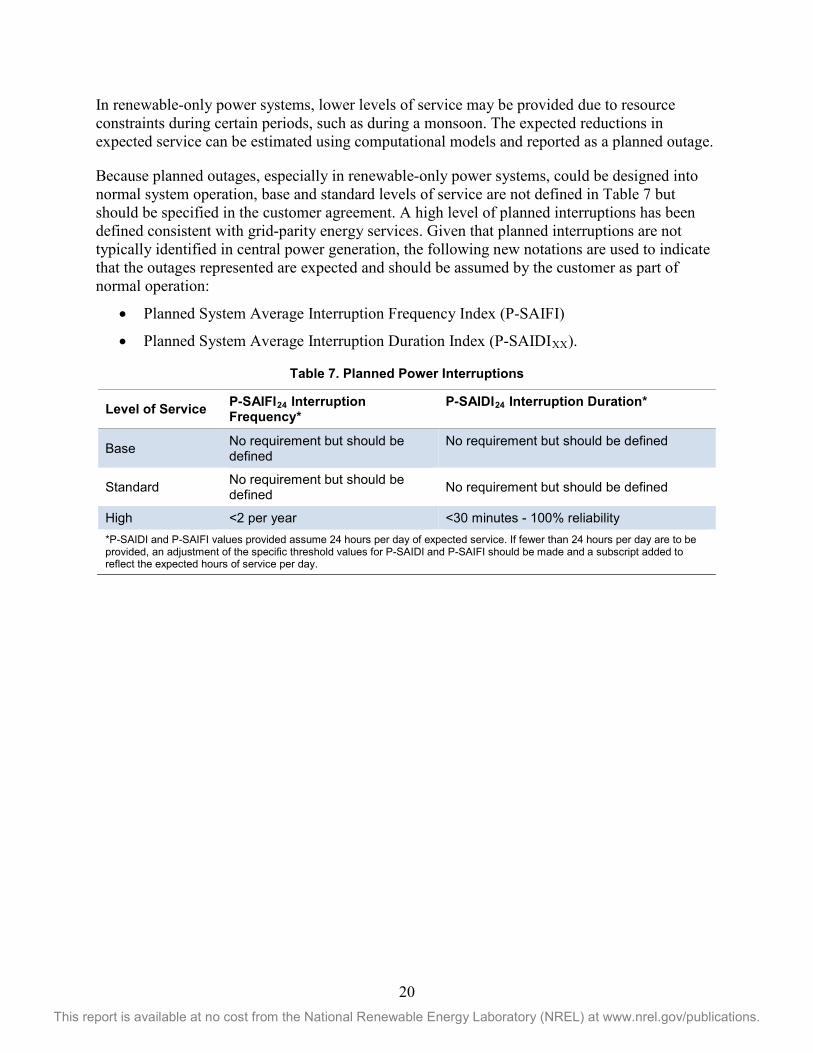
20 This report is available at no cost from the National Renewable Energy Laboratory (NREL) at www.nrel.gov/publications.
In renewable-only power systems, lower levels of service may be provided due to resource constraints during certain periods, such as during a monsoon. The expected reductions in expected service can be estimated using computational models and reported as a planned outage.
Because planned outages, especially in renewable-only power systems, could be designed into normal system operation, base and standard levels of service are not defined in Table 7 but should be specified in the customer agreement. A high level of planned interruptions has been defined consistent with grid-parity energy services. Given that planned interruptions are not typically identified in central power generation, the following new notations are used to indicate that the outages represented are expected and should be assumed by the customer as part of normal operation:
• Planned System Average Interruption Frequency Index (P-SAIFI)
• Planned System Average Interruption Duration Index (P-SAIDIXX).
Table 7. Planned Power Interruptions
Level of Service P-SAIFI24 Interruption Frequency*
P-SAIDI24 Interruption Duration*
Base No requirement but should be defined
No requirement but should be defined
Standard No requirement but should be defined No requirement but should be defined
High <2 per year <30 minutes - 100% reliability *P-SAIDI and P-SAIFI values provided assume 24 hours per day of expected service. If fewer than 24 hours per day are to be provided, an adjustment of the specific threshold values for P-SAIDI and P-SAIFI should be made and a subscript added to reflect the expected hours of service per day.
21 This report is available at no cost from the National Renewable Energy Laboratory (NREL) at www.nrel.gov/publications.
4 Accountability and Performance Reporting Framework
The accountability framework has two elements to ensure long-term project sustainability. The first is to formalize the relationships and information exchange among the parties involved in mini-grid system development and operations (developers/operators, funders, regulators, and customers), which are conceptually similar to more conventional utility systems. Second, it also defines processes for formal collection and dissemination of information from these mini-grid systems, allowing increased knowledge of the systems not only internally to the organizations developing or operating them but also to the wider mini-grids sector.
These goals are upheld through two mechanisms: (1) a specification of the quality of service (defined in accordance with the levels of service component of the QAF) and (2) a method to assess the technical and business condition of the power system or its operating utility. The QAF accountability framework will thus define a clear process for validating power delivery by providing trusted information to developers/operators, customers, funders, and regulators. Access to this information yields a number of wide-ranging benefits for these mini-grid sector stakeholders, including facilitating increased transparency, long-term performance tracking and forecasting, demonstrating a track record, improving risk assessment, and laying the foundation for aggregation and bundling of mini-grids projects. Figure 2 provides a summary of these benefits.
As discussed in Section 1.4, although applicable to any business model, the QAF is modeled on best practices from conventional utilities in mature markets, with the view of mini-grids as mini-utilities. These best practices include establishing a defined contractual relationship with customers, employing standard classification of customers, gathering long-term data, and unlocking aggregation and economies of scale. With this in mind, the QAF accountability framework has two components:
• Consumer accountability: Focusing on the agreement between the customer and provider of energy services, consumer accountability helps to ensure that the service expected is rendered through appropriate checks and balances, strengthening consumer confidence. Improved confidence will increase a customer’s willingness to pay for service since there is a documented understanding of the service being provided for the payments being made. Additionally, a defined project-specific process outlines recourse for customers who do not believe they are receiving the level of service expected. This documentation reduces the risks of customers stopping payment, which in turn improves the bankability of projects. This also solidifies the concept of a business relationship between a buyer and seller of a commodity, in this case energy services.
• Utility accountability: Focusing primarily on the agreement between the provider of energy services and either the government, regulator, or funders, utility accountability describes the systematic collection and dispersal of information about the system. This information can be used by the service provider (i.e., mini-utility) to improve operational management and facilitate long-term energy planning, as well as externally via reporting to regulators, funders, or other interested parties as appropriate. The collection of this information must be completed in a way to ensure high quality and reliability. This
22 This report is available at no cost from the National Renewable Energy Laboratory (NREL) at www.nrel.gov/publications.
reporting should depend on but be independent of the business model used to manage the power system.
The type and quality of data collected through the accountability framework will depend on the users and uses of the data. In this document we have compiled a complete set of likely parameters, but it should not be assumed that all systems need to collect all data parameters described or that all parties of a specific project (the customer, utility, regulator, and investor) will want or need all identified data. Additionally, the resolution of the data collection in terms of accuracy and frequency of collection and reporting will also vary by parameter, system size, and the intended use of that data. In addition, this document does not mandate methods of data collection (e.g., automated vs. manual) and the corresponding instrumentation, as this will also vary. Maintaining flexibility is critical given the inherent diversity and relative nascence of the mini-grids sector. Note that additional guidelines and recommendations detailing QAF implementation in a range of theoretical scenarios will be published as a complement to this main QAF technical document. In addition, subsequent QAF technical validation and implementation pilots will provide examples based on operating mini-grid systems.
The following sections provide further details on the QAF accountability framework, divided by consumer and utility accountability.
4.1 Consumer Accountability The consumer accountability defines, demonstrates, and validates that a specific level of service is being provided to a customer. Information collected on customer energy usage can also be used to better understand local and regional energy usage over time, allowing the utility and other organizations to better manage power system operation and plans for long-term usage growth. The two main elements of the QAF consumer accountability are discussed below.
4.1.1 Level of Service Verification The level of service verification must have the following capabilities at each customer point of connection:
• Ability to check voltage at service drops
• Ability to record energy consumption
• Ability to record hours of service at service drops. The three attributes above will give an indication of power quality, energy availability, and power reliability at the customer point of connection. Note that the level of service verification under the QAF does not require that all of these are measured continuously, although it is important to monitor these attributes at the customer level at least periodically, as well as maintain a historical record over time. The use of smart meters would facilitate the collection of robust real-time data across some or all of these domains but may be cost-prohibitive. Alternatively, periodic surveys using temporary meters are recommended, though the frequency, duration, and size of these surveys would vary depending on cost constraints, regulatory arrangements, and other factors. Level of service verification assessments may also be triggered by a customer complaint and would also include a review of the historical records.
23 This report is available at no cost from the National Renewable Energy Laboratory (NREL) at www.nrel.gov/publications.
Note that the relevant metric for measuring energy consumption at the customer level could vary depending on the business model. For example, tariffs may be structured on the basis of kilowatt hours consumed, services or appliances supported, or a flat fee in some cases (although this is not recommended). Related to the hours of service attribute, it is important to track the outages that customers experience. For small mini-grids, this will likely be tracked at a system-wide level (see utility accountability section below), though ability to record more granular customer-level outages (e.g., impacting specific feeders or even specific service drops) is most ideal where possible. Finally, although voltage must be measured at the customer point of connection, system frequency and, if appropriate, other power-quality-related parameters should also be monitored and recorded; the location of this monitoring will depend on the parameter.
4.1.2 Service Agreement To ensure a common understanding, a service agreement that defines the expectation between the consumer and provider of energy services must be in place. The service agreement must define the terms of service including the details of the level of service to be delivered, tariffs and fees, payment processes, compliance with applicable standards and regulations, customer responsibilities, customer complaint procedure, and other relevant information. For full transparency, the service agreement should also specify the type and frequency of service data that the utility will provide to the customer, as well as clear processes for addressing customer concerns if the appropriate service is not provided.
A process to file complaints directly with the utility as well as an independent third party, such as the national regulator, should also be described. The service agreement must also describe how to address power quality impacts caused by the customer versus those caused by the power system. Appendix C provides a sample customer disturbance recording form. A service agreement should be provided to each new customer15 and made available through a public process, such as available online and posted at the powerhouse or local office in the local language. The legal justification of the agreement will depend on the jurisdiction and applicable local regulations but should, if possible, have some strong legal basis.
4.2 Utility Accountability Utility accountability allows funding or regulatory organizations to understand if the mini-grid system is safe and providing contracted service. Technical and business reporting specified under this framework provides a defined and secure methodology for utilities to provide relevant information to regulators and project financiers that will allow a good understanding of the utility business. This information is also important for internal use by the utility to improve operational management and facilitate long-term planning. In general, the reporting of this standard information also provides the wider industry important sector data that will help reduce risks, facilitate bundling and aggregation, and inform effective interventions in the sector.
As discussed earlier, the QAF does not mandate the collection or reporting of all of these attributes, which will vary depending on the size of the intended users and uses of the data. In the implementation of a project, the various project participants will need to determine the metrics of interest for each of the parties involved. For example, regulators may be most interested in issues 15 E.g., Wise Electric Cooperative in Decatur, Texas, provides a customer service agreement: http://www.wiseec.com/content/uploads/2015/09/WEC_Service_Agreement.pdf
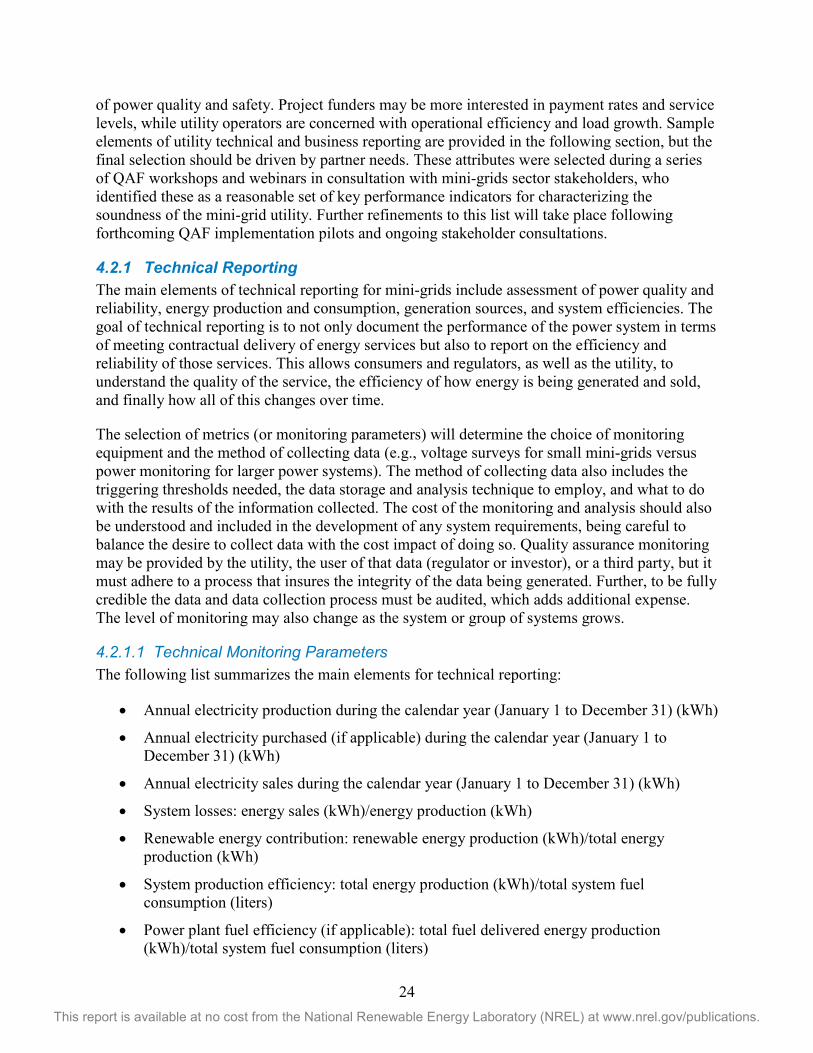
24 This report is available at no cost from the National Renewable Energy Laboratory (NREL) at www.nrel.gov/publications.
of power quality and safety. Project funders may be more interested in payment rates and service levels, while utility operators are concerned with operational efficiency and load growth. Sample elements of utility technical and business reporting are provided in the following section, but the final selection should be driven by partner needs. These attributes were selected during a series of QAF workshops and webinars in consultation with mini-grids sector stakeholders, who identified these as a reasonable set of key performance indicators for characterizing the soundness of the mini-grid utility. Further refinements to this list will take place following forthcoming QAF implementation pilots and ongoing stakeholder consultations.
4.2.1 Technical Reporting The main elements of technical reporting for mini-grids include assessment of power quality and reliability, energy production and consumption, generation sources, and system efficiencies. The goal of technical reporting is to not only document the performance of the power system in terms of meeting contractual delivery of energy services but also to report on the efficiency and reliability of those services. This allows consumers and regulators, as well as the utility, to understand the quality of the service, the efficiency of how energy is being generated and sold, and finally how all of this changes over time.
The selection of metrics (or monitoring parameters) will determine the choice of monitoring equipment and the method of collecting data (e.g., voltage surveys for small mini-grids versus power monitoring for larger power systems). The method of collecting data also includes the triggering thresholds needed, the data storage and analysis technique to employ, and what to do with the results of the information collected. The cost of the monitoring and analysis should also be understood and included in the development of any system requirements, being careful to balance the desire to collect data with the cost impact of doing so. Quality assurance monitoring may be provided by the utility, the user of that data (regulator or investor), or a third party, but it must adhere to a process that insures the integrity of the data being generated. Further, to be fully credible the data and data collection process must be audited, which adds additional expense. The level of monitoring may also change as the system or group of systems grows.
4.2.1.1 Technical Monitoring Parameters The following list summarizes the main elements for technical reporting:
• Annual electricity production during the calendar year (January 1 to December 31) (kWh)
• Annual electricity purchased (if applicable) during the calendar year (January 1 to December 31) (kWh)
• Annual electricity sales during the calendar year (January 1 to December 31) (kWh)
• System losses: energy sales (kWh)/energy production (kWh)
• Renewable energy contribution: renewable energy production (kWh)/total energy production (kWh)
• System production efficiency: total energy production (kWh)/total system fuel consumption (liters)
• Power plant fuel efficiency (if applicable): total fuel delivered energy production (kWh)/total system fuel consumption (liters)
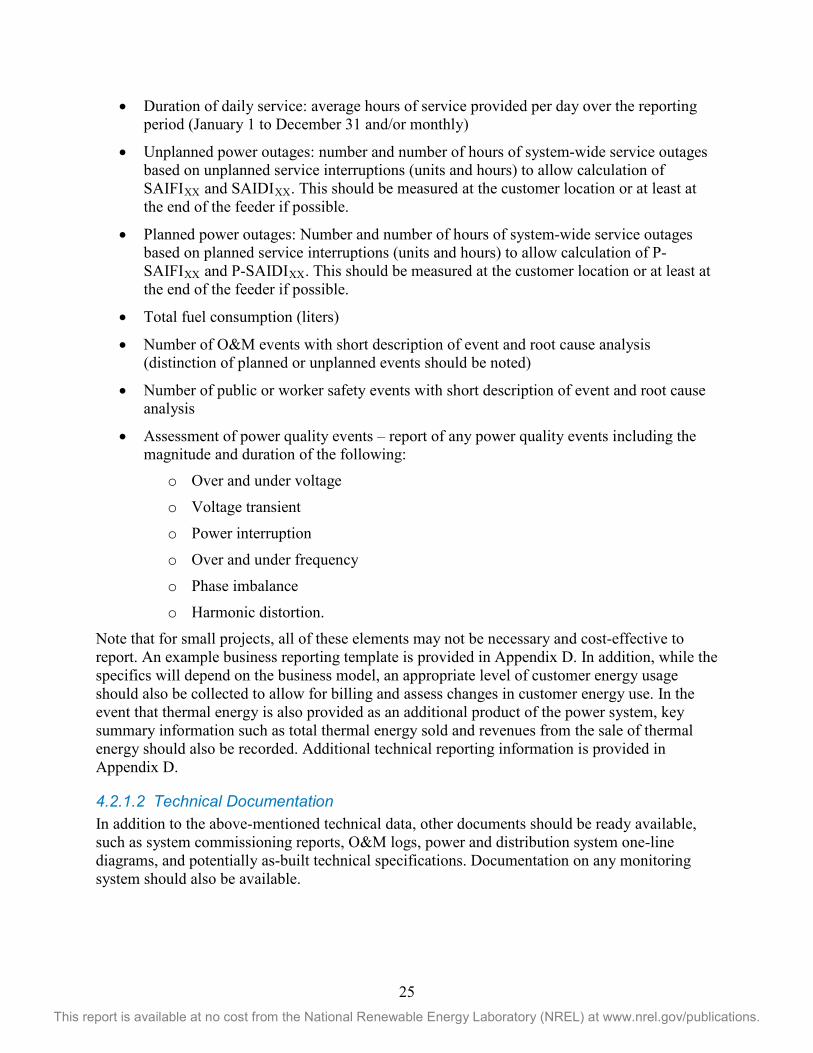
25 This report is available at no cost from the National Renewable Energy Laboratory (NREL) at www.nrel.gov/publications.
• Duration of daily service: average hours of service provided per day over the reporting period (January 1 to December 31 and/or monthly)
• Unplanned power outages: number and number of hours of system-wide service outages based on unplanned service interruptions (units and hours) to allow calculation of SAIFIXX and SAIDIXX. This should be measured at the customer location or at least at the end of the feeder if possible.
• Planned power outages: Number and number of hours of system-wide service outages based on planned service interruptions (units and hours) to allow calculation of P-SAIFIXX and P-SAIDIXX. This should be measured at the customer location or at least at the end of the feeder if possible.
• Total fuel consumption (liters)
• Number of O&M events with short description of event and root cause analysis (distinction of planned or unplanned events should be noted)
• Number of public or worker safety events with short description of event and root cause analysis
• Assessment of power quality events – report of any power quality events including the magnitude and duration of the following:
o Over and under voltage
o Voltage transient
o Power interruption
o Over and under frequency
o Phase imbalance
o Harmonic distortion.
Note that for small projects, all of these elements may not be necessary and cost-effective to report. An example business reporting template is provided in Appendix D. In addition, while the specifics will depend on the business model, an appropriate level of customer energy usage should also be collected to allow for billing and assess changes in customer energy use. In the event that thermal energy is also provided as an additional product of the power system, key summary information such as total thermal energy sold and revenues from the sale of thermal energy should also be recorded. Additional technical reporting information is provided in Appendix D.
4.2.1.2 Technical Documentation In addition to the above-mentioned technical data, other documents should be ready available, such as system commissioning reports, O&M logs, power and distribution system one-line diagrams, and potentially as-built technical specifications. Documentation on any monitoring system should also be available.
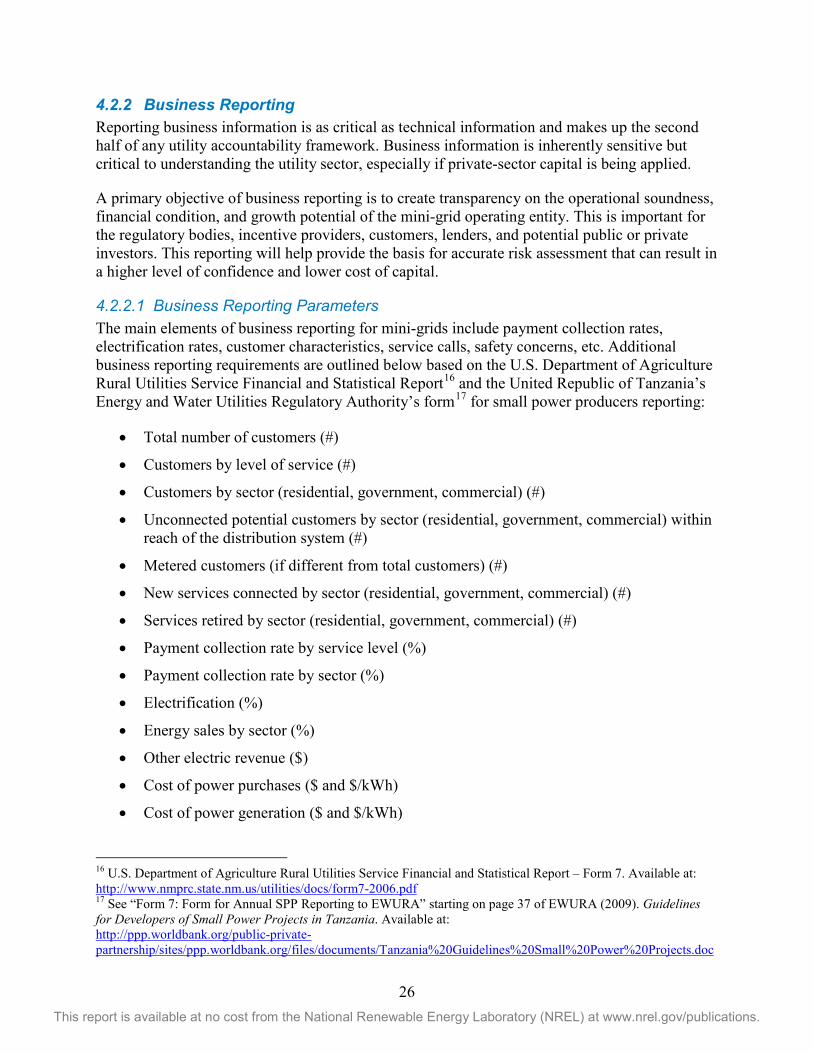
26 This report is available at no cost from the National Renewable Energy Laboratory (NREL) at www.nrel.gov/publications.
4.2.2 Business Reporting Reporting business information is as critical as technical information and makes up the second half of any utility accountability framework. Business information is inherently sensitive but critical to understanding the utility sector, especially if private-sector capital is being applied.
A primary objective of business reporting is to create transparency on the operational soundness, financial condition, and growth potential of the mini-grid operating entity. This is important for the regulatory bodies, incentive providers, customers, lenders, and potential public or private investors. This reporting will help provide the basis for accurate risk assessment that can result in a higher level of confidence and lower cost of capital.
4.2.2.1 Business Reporting Parameters The main elements of business reporting for mini-grids include payment collection rates, electrification rates, customer characteristics, service calls, safety concerns, etc. Additional business reporting requirements are outlined below based on the U.S. Department of Agriculture Rural Utilities Service Financial and Statistical Report16 and the United Republic of Tanzania’s Energy and Water Utilities Regulatory Authority’s form17 for small power producers reporting:
• Total number of customers (#)
• Customers by level of service (#)
• Customers by sector (residential, government, commercial) (#)
• Unconnected potential customers by sector (residential, government, commercial) within reach of the distribution system (#)
• Metered customers (if different from total customers) (#)
• New services connected by sector (residential, government, commercial) (#)
• Services retired by sector (residential, government, commercial) (#)
• Payment collection rate by service level (%)
• Payment collection rate by sector (%)
• Electrification (%)
• Energy sales by sector (%)
• Other electric revenue ($)
• Cost of power purchases ($ and $/kWh)
• Cost of power generation ($ and $/kWh)
16 U.S. Department of Agriculture Rural Utilities Service Financial and Statistical Report – Form 7. Available at: http://www.nmprc.state.nm.us/utilities/docs/form7-2006.pdf 17 See “Form 7: Form for Annual SPP Reporting to EWURA” starting on page 37 of EWURA (2009). Guidelines for Developers of Small Power Projects in Tanzania. Available at: http://ppp.worldbank.org/public-private-partnership/sites/ppp.worldbank.org/files/documents/Tanzania%20Guidelines%20Small%20Power%20Projects.doc
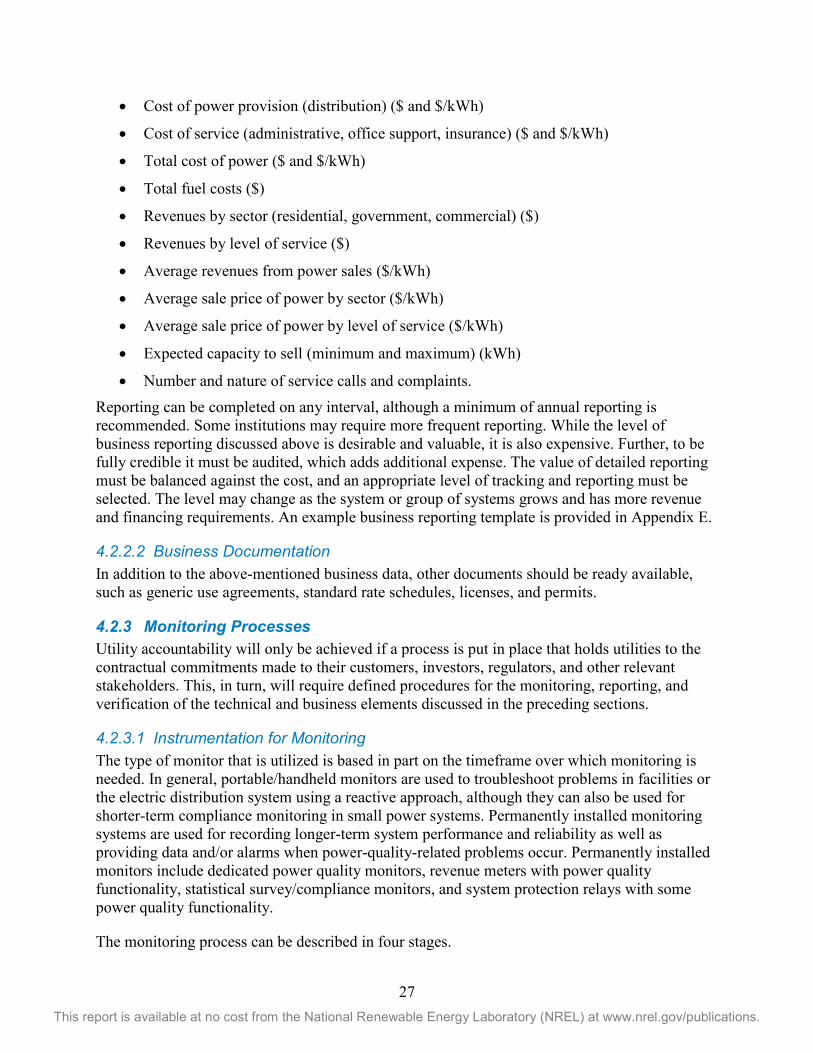
27 This report is available at no cost from the National Renewable Energy Laboratory (NREL) at www.nrel.gov/publications.
• Cost of power provision (distribution) ($ and $/kWh)
• Cost of service (administrative, office support, insurance) ($ and $/kWh)
• Total cost of power ($ and $/kWh)
• Total fuel costs ($)
• Revenues by sector (residential, government, commercial) ($)
• Revenues by level of service ($)
• Average revenues from power sales ($/kWh)
• Average sale price of power by sector ($/kWh)
• Average sale price of power by level of service ($/kWh)
• Expected capacity to sell (minimum and maximum) (kWh)
• Number and nature of service calls and complaints. Reporting can be completed on any interval, although a minimum of annual reporting is recommended. Some institutions may require more frequent reporting. While the level of business reporting discussed above is desirable and valuable, it is also expensive. Further, to be fully credible it must be audited, which adds additional expense. The value of detailed reporting must be balanced against the cost, and an appropriate level of tracking and reporting must be selected. The level may change as the system or group of systems grows and has more revenue and financing requirements. An example business reporting template is provided in Appendix E.
4.2.2.2 Business Documentation In addition to the above-mentioned business data, other documents should be ready available, such as generic use agreements, standard rate schedules, licenses, and permits.
4.2.3 Monitoring Processes Utility accountability will only be achieved if a process is put in place that holds utilities to the contractual commitments made to their customers, investors, regulators, and other relevant stakeholders. This, in turn, will require defined procedures for the monitoring, reporting, and verification of the technical and business elements discussed in the preceding sections.
4.2.3.1 Instrumentation for Monitoring The type of monitor that is utilized is based in part on the timeframe over which monitoring is needed. In general, portable/handheld monitors are used to troubleshoot problems in facilities or the electric distribution system using a reactive approach, although they can also be used for shorter-term compliance monitoring in small power systems. Permanently installed monitoring systems are used for recording longer-term system performance and reliability as well as providing data and/or alarms when power-quality-related problems occur. Permanently installed monitors include dedicated power quality monitors, revenue meters with power quality functionality, statistical survey/compliance monitors, and system protection relays with some power quality functionality.
The monitoring process can be described in four stages.
28 This report is available at no cost from the National Renewable Energy Laboratory (NREL) at www.nrel.gov/publications.
• The first stage in the process is data acquisition. Acquiring the data for a mini-grid power system will likely be a combination of hand-recording specific values and automated data acquisition systems. Operational data, detailed diagnostic data, and calculated parameters will likely be collected and maintained at the power system by power system operators. Additional simple analysis and characterization of the data may also be completed on site by power system operators. Data may be transferred for storage to a central company office. Advanced automated data collection is likely to include local data storage and potential electronic transfer to national or regional offices for expanded analysis and long-term storage.
• Data summation is the second stage of the process. Based on informational needs, the type of data collection, and data delivery options, raw plant data collected in the first stage will be analyzed and summarized either locally or at a corporate headquarters. Although different stakeholders may have different data needs, efforts should be made to align the reporting requirements of the different accepting parties so as to reduce overhead burden on small utility systems. Some form of local data storage and potentially additional processing may also be likely on the part of the utility for their own operational use.
• Summary information about the operation of the power system can then be communicated to project stakeholders at specific intervals. Since different stakeholders require different information, data systems can be created for larger programs to ensure that the specific information is transferred securely to each of the different project stakeholders in a similar and thus more useful manor. Data submittal could be done through web portals, automatic transmittal of data from data acquisition systems, or on paper and entered by program administrators. Reports should be generated regularly for specific systems or wider deployment efforts, documenting the performance of different technologies and system developers.
• For larger or multi-system projects, such as national rural electrification projects additional operations such as aggregation of data from multiple site, long-term data retention, and expanded analysis of some parameters may be needed to provide insight into longer trends. The availability of such expanded long-term data will allow the wider industry to analyze the performance of mini-grid systems with high renewable energy content, which is an important step in unlocking private-sector capital for such systems. The security of data provided by individual projects will likely be a topic of some discussion and may need to be stipulated as part of the development of larger rural electrification projects.
4.2.3.2 Reporting Beyond the collection of information around power system operation, a reporting requirement should be developed based on national or programmatic needs. Different governmental organizations may already have reporting requirements for the power sector, which may generally be applicable for mini-grid power systems. In some cases, requirements have been developed for the mini-grids sector or some segments may be exempt from regulation altogether. Refer to Sections 4.2.1 and 4.2.2 for more information about the kinds of reporting information and templates that could be of interest to various stakeholders.
29 This report is available at no cost from the National Renewable Energy Laboratory (NREL) at www.nrel.gov/publications.
The frequency of technical data collection and reporting will also be driven largely by the uses of the data and will vary by parameter and recipient. Energy regulators may only need annual data of specific parameters, while project operators may desire hourly or even sub-hourly data collection to tune system performance. Other organizations may require reports following power quality or safety incidents.
4.2.3.3 Verification Independent verification is a critical part of any accountability framework. Verification processes should cover the entire project timeline, incorporating a formal commissioning of the power system, commissioning of any data collection processes, and ongoing assessment of system performance and more general reporting.
The intended verification process should be developed in the early stages of wider project development so that it can be integrated and implemented as part of the project development. It is also important that project developers understand the data acquisition, reporting, and verification requirements at the start of any development so that the costs of these components can be included in any project development and operational cost projections.
Finally, the organization(s) implementing the larger data monitoring and verification process must understand and prepare for the implementation of this process. Not only will new systems (both organizational and data management) need to be developed, but also new hardware will likely need to be procured, processes developed and implemented, and staff trained to implement each new step in the development process. Organizational oversight of the verification process, both in terms of commissioning of new power system projects and long-term verification processes for the operation of the power systems, will require the development of in-house capacities or procedures to hire independent third parties to provide oversight of the verification process.
30 This report is available at no cost from the National Renewable Energy Laboratory (NREL) at www.nrel.gov/publications.
5 Conclusion The QAF for mini-grid power systems aims to provide a similar structure and transparency for isolated mini-grids as is offered by successful utility models. The QAF defines different levels of service, including appropriate thresholds for power quality, reliability, and availability to meet the needs of different segments of the off-grid consumer base. The framework’s goal is not to set a standard level of service but rather to clarify and advance the mini-grid sector by specifying a range of service levels—from basic energy services to grid-parity service—and providing mechanisms for assessment and reporting to determine whether an agreed level of service is delivered.
These core elements of the QAF for mini-grid power systems aim to preserve flexibility while providing a foundational structure that can put the sector on track to resemble a mature utility in scale and sophistication. In addition, data generated through implementation of the QAF will provide the foundation for comparisons across projects, assessment of impacts, and greater confidence that will drive investment and scale-up in this sector.
It should be remembered that the term “framework” in the QAF was chosen intentionally. This effort does not provide a clear recipe; rather, it is a set of ingredients that various parties, public or private, could use based on their specific needs and goals. The QAF is also a work in progress and will develop as it is applied in different contexts. The QAF team and partners will continue to take steps to advance the project, including development of an implementation toolkit, technical validation pilots, demonstration pilots, and additional supporting technical resources.
More QAF documents will be developed over time, supporting the expanded application of the framework in individual system or large-scale deployment projects. The Clean Energy Solutions Center18 provides an initial gateway to information that supports the development of isolated power systems.
18 https://cleanenergysolutions.org/
31 This report is available at no cost from the National Renewable Energy Laboratory (NREL) at www.nrel.gov/publications.
References Bhatia, M.; Angelou, N. 2015. “Beyond Connections, Energy Access Redefined.” Energy Sector Management Assistance Program (ESMAP), The World Bank Group, Washington, DC, USA. https://openknowledge.worldbank.org/bitstream/handle/10986/24368/Beyond0connect0d000technical0report.pdf?sequence=1&isAllowed=y
Bollen, M.H.J. (1999). Understanding Power Quality Problems: Voltage Sags and Interruptions. Wiley-IEEE Press. http://www.wiley.com/WileyCDA/WileyTitle/productCd-0780347137,miniSiteCd-IEEE2.html
Chattopadhyay, S; Mitra, M.; and S. Samarjit. (2011). Electric Power Quality. ISBN 978-94-007-0634-7. Springer Science and Business.
International Electrotechnical Commission. (2005). Recommendations for Renewable Energy and Hybrid Systems for Rural Electrification, Part 1: General Introduction to IEC 62257 Series and Rural Electrification. IEC/TS 62257-2:2005 (E). Geneva, Switzerland: International Electrotechnical Commission. https://webstore.iec.ch/publication/23502
International Energy Agency. 2010. “Energy Poverty: How to Make Modern Energy Access Universal.” Available at http://www.iea.org/publications/freepublications/publication/weo-2010---special-report---how-to-make-modern-energy-access-universal.html
National Fire Protection Association. (2014). NFPA 70: National Electric Code. Quincy, Massachusetts, USA: National Fire Protection Association. http://www.nfpa.org/codes-and-standards/all-codes-and-standards/list-of-codes-and-standards?mode=code&code=70&tab=about
32 This report is available at no cost from the National Renewable Energy Laboratory (NREL) at www.nrel.gov/publications.
Bibliography Africa-EU Renewable Energy Cooperation Programme (RECP). Mini-Grid Policy Toolkit: Policy and Business Frameworks for Successful Mini-Grid Roll-outs. (2015). Eschborn, Germany: European Union Energy Initiative Partnership Dialogue Facility. http://www.ren21.net/Portals/0/documents/Resources/MGT/MinigridPolicyToolkit_Sep2014_EN.pdf
Greacen, C.; Engel, R., Quetchenbach, T. (2013). A Guidebook on Grid Interconnection and Islanded Operation of Mini-Grid Power Systems Up to 200 kW. LBNL-6224E. Berkeley, California: Lawrence Berkeley National Laboratory. https://building-microgrid.lbl.gov/publications/guidebook-grid-interconnection-and
International Renewable Energy Agency (IRENA). (2015). Accelerating Off-Grid Renewable Energy: International Off-Grid Renewable Energy Conference & Exhibition 2014: Key Findings and Recommendations. Abu Dhabi, United Arab Emirates. IRENA. http://www.irena.org/DocumentDownloads/Publications/IRENA_2nd_IOREC_2015.pdf
Layton, L. (2004). Electric System Reliability Indices. Self-published. http://l2eng.com/Reliability_Indices_for_Utilities.pdf
Schnitzer, D.; Lounsbury, D. S.; Carvallo, J. P.; Deshmukh, R.; Apt, J.; and D.M. Kammen. (2014). Microgrids for Rural Electrification: A Critical Review of Best Practices Based on Seven Case Studies. United Nations Foundation. https://rael.berkeley.edu/publication/microgrids-for-rural-electrification-a-critical-review-of-best-practices-based-on-seven-case-studies/
Tenenbaum, B.; Greacen, C.; Siyambalapitiya, T.; and J. Knuckles. (2014). From the Bottom Up: How Small Power Producers and Mini-Grids Can Deliver Electrification and Renewable Energy in Africa. Washington, DC: World Bank. https://openknowledge.worldbank.org/handle/10986/16571
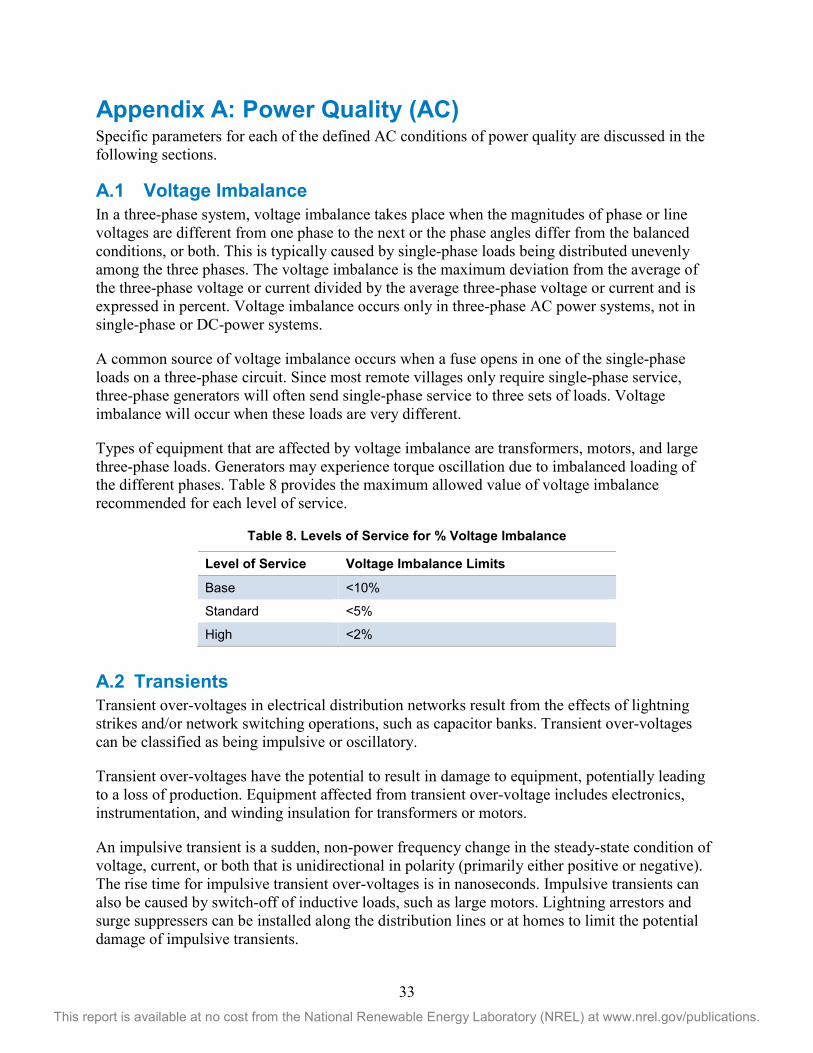
33 This report is available at no cost from the National Renewable Energy Laboratory (NREL) at www.nrel.gov/publications.
Appendix A: Power Quality (AC) Specific parameters for each of the defined AC conditions of power quality are discussed in the following sections.
A.1 Voltage Imbalance In a three-phase system, voltage imbalance takes place when the magnitudes of phase or line voltages are different from one phase to the next or the phase angles differ from the balanced conditions, or both. This is typically caused by single-phase loads being distributed unevenly among the three phases. The voltage imbalance is the maximum deviation from the average of the three-phase voltage or current divided by the average three-phase voltage or current and is expressed in percent. Voltage imbalance occurs only in three-phase AC power systems, not in single-phase or DC-power systems.
A common source of voltage imbalance occurs when a fuse opens in one of the single-phase loads on a three-phase circuit. Since most remote villages only require single-phase service, three-phase generators will often send single-phase service to three sets of loads. Voltage imbalance will occur when these loads are very different.
Types of equipment that are affected by voltage imbalance are transformers, motors, and large three-phase loads. Generators may experience torque oscillation due to imbalanced loading of the different phases. Table 8 provides the maximum allowed value of voltage imbalance recommended for each level of service.
Table 8. Levels of Service for % Voltage Imbalance
Level of Service Voltage Imbalance Limits
Base <10%
Standard <5%
High <2%
A.2 Transients Transient over-voltages in electrical distribution networks result from the effects of lightning strikes and/or network switching operations, such as capacitor banks. Transient over-voltages can be classified as being impulsive or oscillatory.
Transient over-voltages have the potential to result in damage to equipment, potentially leading to a loss of production. Equipment affected from transient over-voltage includes electronics, instrumentation, and winding insulation for transformers or motors.
An impulsive transient is a sudden, non-power frequency change in the steady-state condition of voltage, current, or both that is unidirectional in polarity (primarily either positive or negative). The rise time for impulsive transient over-voltages is in nanoseconds. Impulsive transients can also be caused by switch-off of inductive loads, such as large motors. Lightning arrestors and surge suppressers can be installed along the distribution lines or at homes to limit the potential damage of impulsive transients.
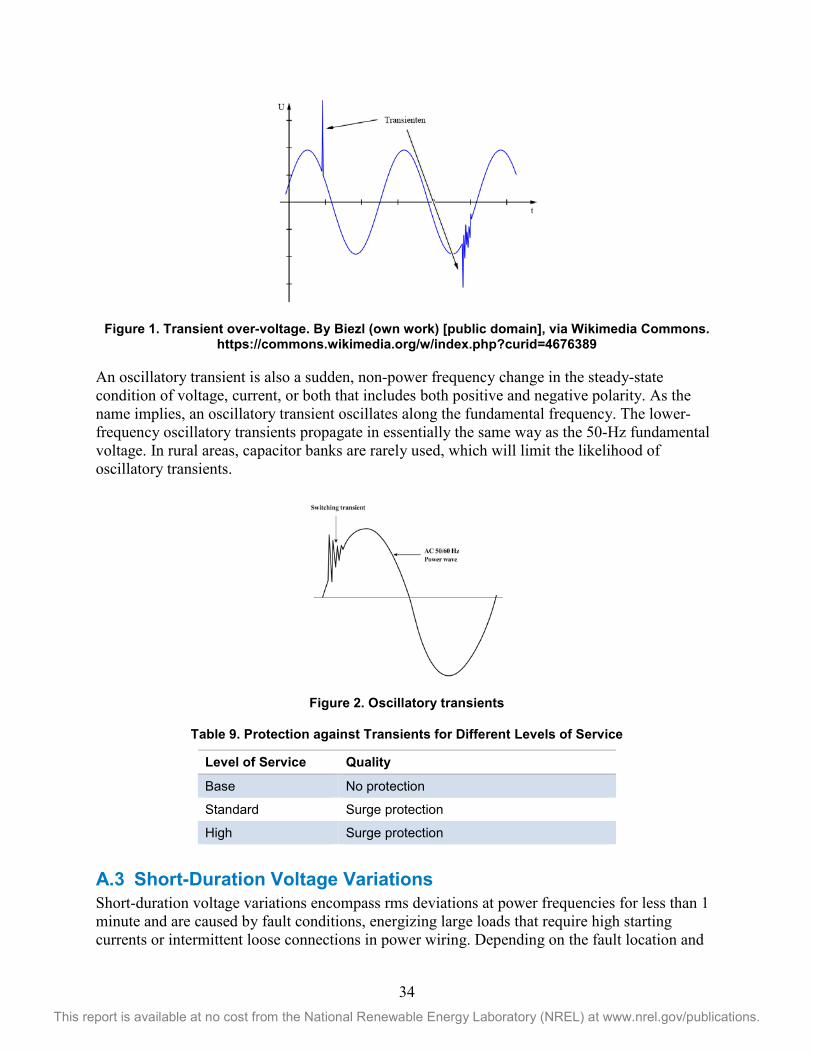
34 This report is available at no cost from the National Renewable Energy Laboratory (NREL) at www.nrel.gov/publications.
Figure 1. Transient over-voltage. By Biezl (own work) [public domain], via Wikimedia Commons.
https://commons.wikimedia.org/w/index.php?curid=4676389
An oscillatory transient is also a sudden, non-power frequency change in the steady-state condition of voltage, current, or both that includes both positive and negative polarity. As the name implies, an oscillatory transient oscillates along the fundamental frequency. The lower-frequency oscillatory transients propagate in essentially the same way as the 50-Hz fundamental voltage. In rural areas, capacitor banks are rarely used, which will limit the likelihood of oscillatory transients.
Figure 2. Oscillatory transients
Table 9. Protection against Transients for Different Levels of Service
Level of Service Quality
Base No protection
Standard Surge protection
High Surge protection
A.3 Short-Duration Voltage Variations Short-duration voltage variations encompass rms deviations at power frequencies for less than 1 minute and are caused by fault conditions, energizing large loads that require high starting currents or intermittent loose connections in power wiring. Depending on the fault location and
35 This report is available at no cost from the National Renewable Energy Laboratory (NREL) at www.nrel.gov/publications.
the system conditions, the fault can cause temporary voltage drops (sags), voltage rises (swells), or a complete loss of voltage (interruptions). The fault condition can be close to or remote from the point of interest. In either case, the impact on the voltage during the fault condition is of the short-duration variation until protective devices operate to clear the fault.
Fault can cause sag, swell, or interruption based on fault intensity, location, and duration.
• A sag is a decrease in voltage to between 0.1 and 0.9 percent nominal per unit (pu) in rms voltage or current at the power frequency for durations from 0.5 cycle to 1 minute.
• A swell is an increase in voltage from 1.1 pu to 1.8 pu from 0.5 cycle to 1 minute.
• An interruption is voltage <0.1 pu for <1 minute. Table 10 lists the number of short-duration variations per time period that is recommended in each level of service.
Table 10. Number of Short-Duration Variations for Level of Service
Level of Service Quality
Base <5/day
Standard <1/day
High <1/week
A.4 Long Duration Variations Long-duration variations encompass rms deviations at power frequencies for longer than 1 minute. ANSI C84.1 specifies the steady-state voltage tolerances expected on a power system. A voltage variation is considered to be long duration when the ANSI limits are exceeded for greater than 1 minute.
Long-duration variations can be over-voltages or under-voltages. Over-voltages and under-voltages generally are not the results of system faults but are caused by load variations on the system and system-switching operations.
An over-voltage is an increase in the rms AC voltage to greater than 110% of the nominal voltage for longer than 1 minute. Over-voltage is usually the result of load switching (e.g., switching off a large load or energizing a capacitor bank). The over-voltages result because either the system is too weak or voltage controls are inadequate. Incorrect tap settings on transformers can also result in system over-voltages.
An under-voltage is a decrease in the rms AC voltage to less than 90% of the nominal voltage for longer than 1 minute. Under-voltages are the results of switching events that are the opposite of the events that cause over-voltages. A load switching on can cause an under-voltage until voltage regulation equipment on the system can bring the voltage back to within tolerances. Overloaded circuits can also result in under-voltages.
When the supply voltage has been zero for a period of time in excess of 1 minute, the long-duration voltage variation is considered a sustained interruption. Voltage interruptions longer
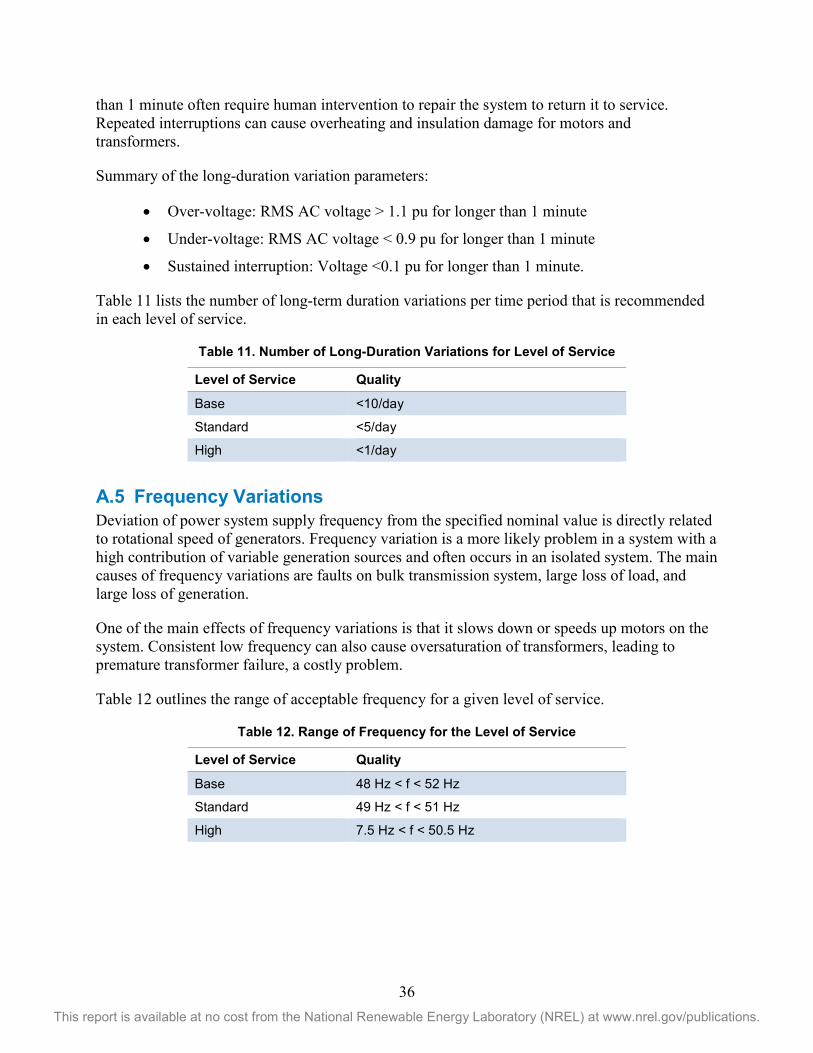
36 This report is available at no cost from the National Renewable Energy Laboratory (NREL) at www.nrel.gov/publications.
than 1 minute often require human intervention to repair the system to return it to service. Repeated interruptions can cause overheating and insulation damage for motors and transformers.
Summary of the long-duration variation parameters:
• Over-voltage: RMS AC voltage > 1.1 pu for longer than 1 minute
• Under-voltage: RMS AC voltage < 0.9 pu for longer than 1 minute
• Sustained interruption: Voltage <0.1 pu for longer than 1 minute.
Table 11 lists the number of long-term duration variations per time period that is recommended in each level of service.
Table 11. Number of Long-Duration Variations for Level of Service
Level of Service Quality
Base <10/day
Standard <5/day
High <1/day
A.5 Frequency Variations Deviation of power system supply frequency from the specified nominal value is directly related to rotational speed of generators. Frequency variation is a more likely problem in a system with a high contribution of variable generation sources and often occurs in an isolated system. The main causes of frequency variations are faults on bulk transmission system, large loss of load, and large loss of generation.
One of the main effects of frequency variations is that it slows down or speeds up motors on the system. Consistent low frequency can also cause oversaturation of transformers, leading to premature transformer failure, a costly problem.
Table 12 outlines the range of acceptable frequency for a given level of service.
Table 12. Range of Frequency for the Level of Service
Level of Service Quality
Base 48 Hz < f < 52 Hz
Standard 49 Hz < f < 51 Hz
High 7.5 Hz < f < 50.5 Hz
37 This report is available at no cost from the National Renewable Energy Laboratory (NREL) at www.nrel.gov/publications.
Appendix B: Power Quality (DC) Because there is no frequency or phase-related issues in DC power systems, including phase imbalance, harmonics, or flicker, they are conceptually much simpler than AC mini-grids with respect to power quality. Variations in voltage magnitude, including voltage drop on distribution lines and induced transients on the DC voltage, are the primary concerns. Electrical variations superimposed on the DC voltage are broken into two types based on their frequency. DC ripple is low frequency, an artifact of AC to DC rectification. Switching noise is generally much higher frequency (in the kHz or above) and is caused by the rapid switching of semiconductors, such as field effect transistors. DC transients are similar to transients in AC systems as both result from the effects of lightning strikes and/or network-switching operations. The following section reviews the common DC power-quality issues and proposed level of service thresholds.
B.1 Resistive Voltage Drop The farther the load is from the power source, the higher a distribution system-induced resistive voltage drop, simply decreasing the DC voltage at the load. Voltage drop will limit the geographical footprint of a DC mini-grid.
Voltage drop depends on:
• Length of conductor
• Area of conductor wire
• Conductor material (copper/aluminum)
• Power flowing through the line. The causes of excessive voltage drop are:
• Overdraw of power
• Improper conductor choice, poor-quality conductors
• Poor connections. There are no defined standards that address voltage drop, so the following values in Table 13 should act as an approximate guide.
Table 13. Percent Voltage Drop for a Level of Service
Level of Service Quality
Base Within 30% of sending-end voltage
Standard Within 20%
High Within 10%
B.2 DC Ripple DC ripple is an artifact of the AC-to-DC conversion process as it is difficult to remove all variation in the alternating current. This is a concern only if AC-to-DC conversion (rectification)
38 This report is available at no cost from the National Renewable Energy Laboratory (NREL) at www.nrel.gov/publications.
is employed. DC ripple can cause additional wear on devices designed to operate at a fixed DC voltage, including radios and televisions. DC ripple should not be a concern for DC-only power systems.
The DC output of the AC-to-DC conversion process is shown in Figure 3 below with the dashed line showing the simple rectified ripple. Smoothing is accomplished by using a capacitor at the output of the rectifier, as shown in the red line, but it never completely removes all high-speed variation in the final DC voltage. Increased ripple is typically due to a lack of filtering and is more prevalent in low-quality charge controllers or power converters.
Figure 3. DC ripple based on the output of a rectified AC power source. Image from Spinning
Spark, https://en.wikipedia.org/wiki/File:Smoothed_ripple_gray_background.svg
Table 14 provides the percent pk-pk ripple allowed for a given level of service.
Table 14. Ripple for Given Level of Service
Level of Service Quality
Base 10% of pk-pk
Standard 5% of pk-pk
High 2% of pk-pk
B.3 Switching Noise Switching noise, a higher-speed variation in the DC voltage, is caused by operation of power electronic switches. The potential problem with switching noise is electromagnetic interference. Switching noise can be eliminated or reduced by expanded filtering, but this increases equipment costs so is more of a problem with low-quality power electronics. Table 15 provides a general guide for switching noise in mini-grid power systems.
39 This report is available at no cost from the National Renewable Energy Laboratory (NREL) at www.nrel.gov/publications.
Table 15. Switching Noise for a Given Level of Service
Level of Service Quality
Base Unfiltered
Standard Transient noise minimized
High Ripple noise minimized
B.4 Transients DC voltage transients are similar to what is found in AC systems and can occur when loads or generation sources are switched on or off, causing sudden changes in system voltage. Higher-speed voltage transients can also be caused by lightning strikes or other sudden external events.
As with AC systems, DC transients can be addressed by the purchase of loads that include some sort of power smoothing (soft starts) and by the inclusion of surge suppressors to address the more damaging high-voltage transients. Table 16 provides a general guide for the type of transient protection to be used in mini-grid power systems.
Table 16. Transient Protection for a Given Level of Service
Level of Service Quality
Base No additional protection
Standard Surge suppressors
High Surge suppressors
B.5 Short- and Long-Duration Variations By their nature, voltage variations are common in DC-based power systems. DC voltage will vary between defined thresholds based on battery state of charge and power system currents coming into and out of the system. These voltage variations are normal and typically kept within a safe range, using charge controllers on the upper level and low-voltage disconnects to protect against low voltages. Short-term voltage variations can be caused by changes in large loads (specifically motors, electrical shorts, or during the transitions between battery charging and discharging states). Longer-term variations, over approximately a minute, are more likely the result of the application of large loads or the failure of specific protection systems, such as low-voltage disconnects or charge regulators. Table 17 provides a general guide for the frequency of faults in mini-grid power systems.
Table 17. Number of Faults Allowed Per Day for a Given Level of Service
Level of Service Quality
Base <5 per day
Standard <2 per day
High <1 per day
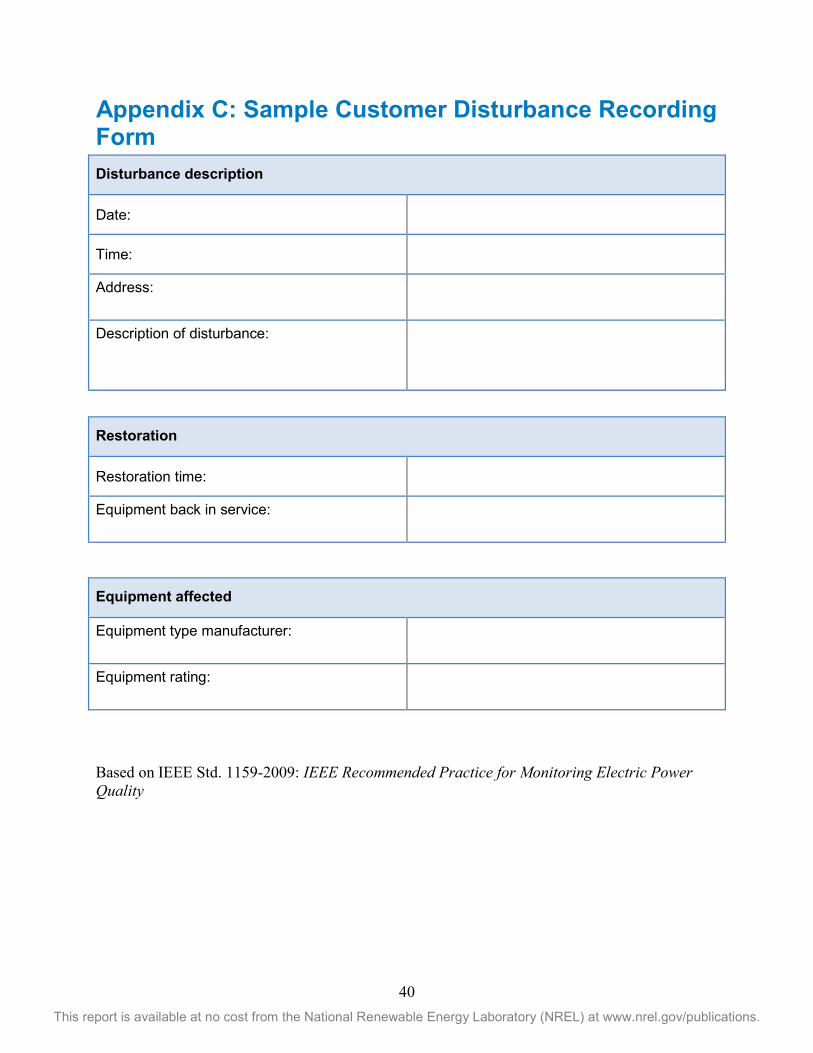
40 This report is available at no cost from the National Renewable Energy Laboratory (NREL) at www.nrel.gov/publications.
Appendix C: Sample Customer Disturbance Recording Form Disturbance description
Date:
Time:
Address:
Description of disturbance:
Restoration
Restoration time:
Equipment back in service:
Equipment affected
Equipment type manufacturer:
Equipment rating:
Based on IEEE Std. 1159-2009: IEEE Recommended Practice for Monitoring Electric Power Quality
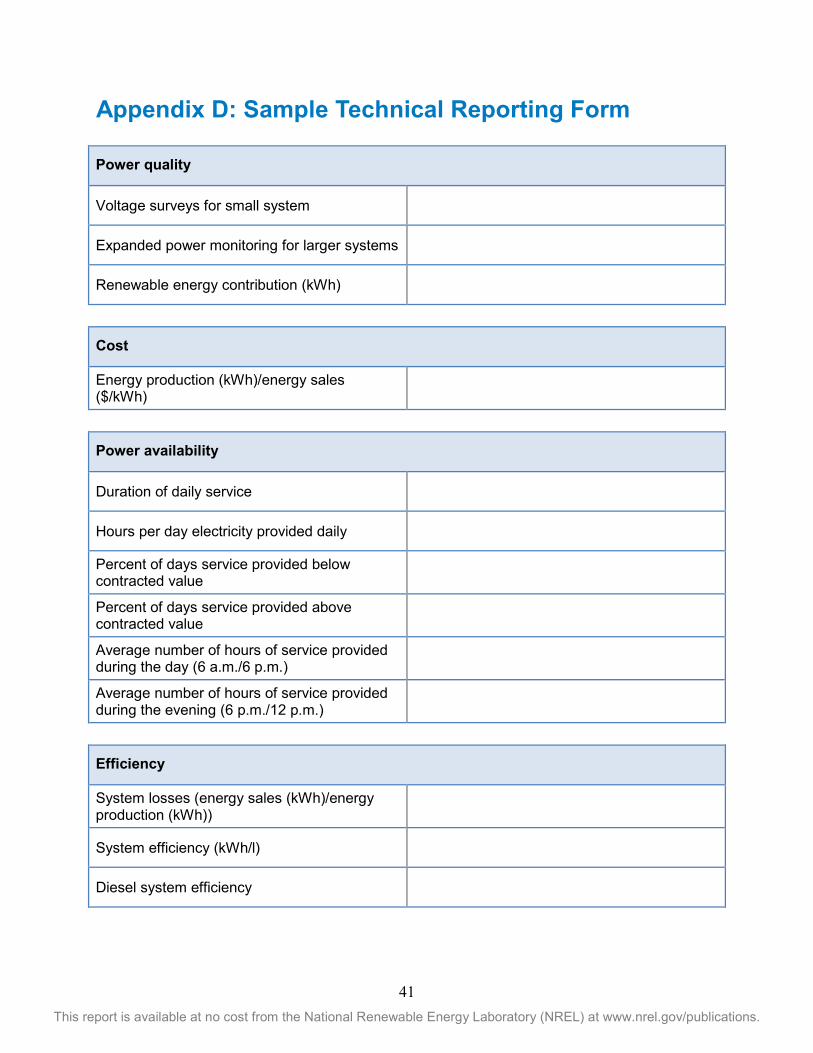
41 This report is available at no cost from the National Renewable Energy Laboratory (NREL) at www.nrel.gov/publications.
Appendix D: Sample Technical Reporting Form
Power quality
Voltage surveys for small system
Expanded power monitoring for larger systems
Renewable energy contribution (kWh)
Cost
Energy production (kWh)/energy sales ($/kWh)
Power availability
Duration of daily service
Hours per day electricity provided daily
Percent of days service provided below contracted value
Percent of days service provided above contracted value
Average number of hours of service provided during the day (6 a.m./6 p.m.)
Average number of hours of service provided during the evening (6 p.m./12 p.m.)
Efficiency
System losses (energy sales (kWh)/energy production (kWh))
System efficiency (kWh/l)
Diesel system efficiency
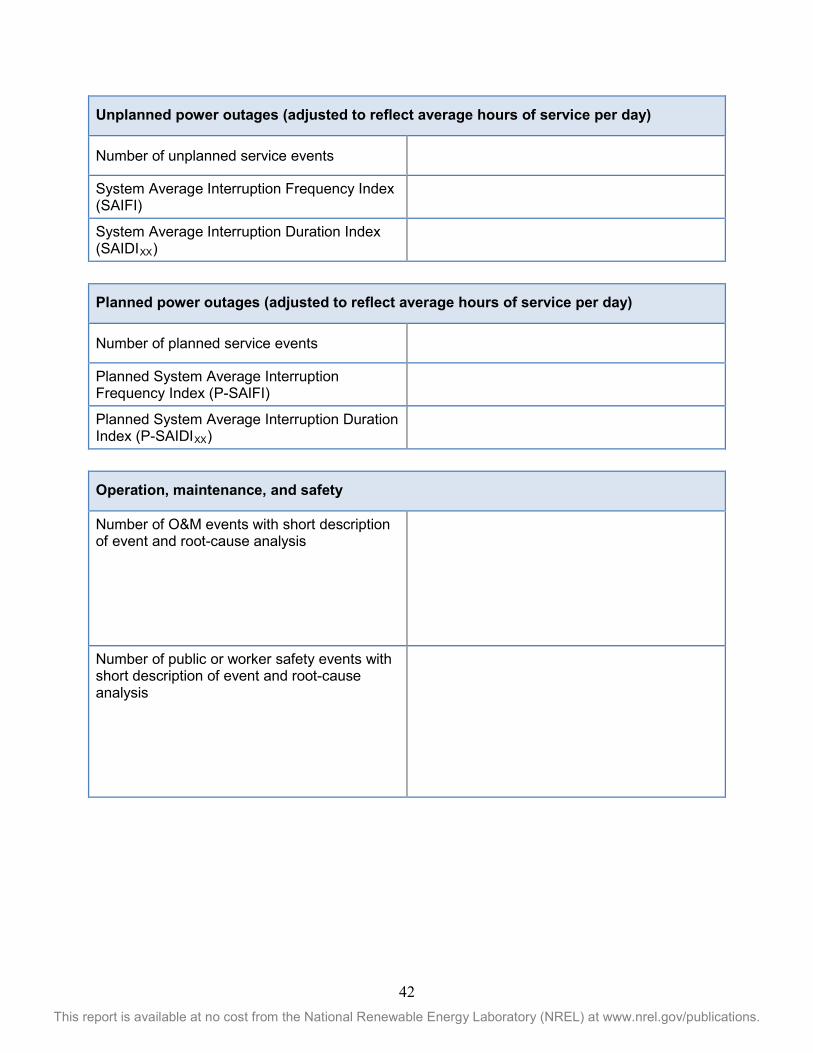
42 This report is available at no cost from the National Renewable Energy Laboratory (NREL) at www.nrel.gov/publications.
Unplanned power outages (adjusted to reflect average hours of service per day)
Number of unplanned service events
System Average Interruption Frequency Index (SAIFI)
System Average Interruption Duration Index (SAIDIXX)
Planned power outages (adjusted to reflect average hours of service per day)
Number of planned service events
Planned System Average Interruption Frequency Index (P-SAIFI)
Planned System Average Interruption Duration Index (P-SAIDIXX)
Operation, maintenance, and safety
Number of O&M events with short description of event and root-cause analysis
Number of public or worker safety events with short description of event and root-cause analysis
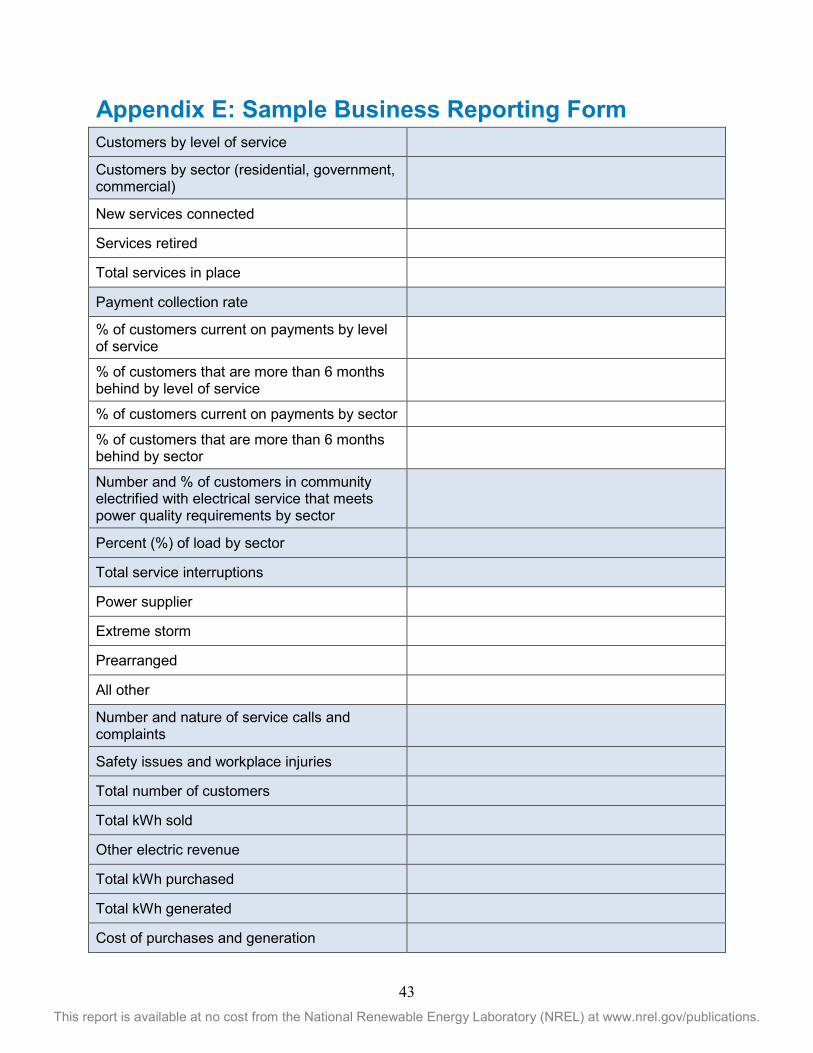
43 This report is available at no cost from the National Renewable Energy Laboratory (NREL) at www.nrel.gov/publications.
Appendix E: Sample Business Reporting Form Customers by level of service
Customers by sector (residential, government, commercial)
New services connected
Services retired
Total services in place
Payment collection rate
% of customers current on payments by level of service
% of customers that are more than 6 months behind by level of service
% of customers current on payments by sector
% of customers that are more than 6 months behind by sector
Number and % of customers in community electrified with electrical service that meets power quality requirements by sector
Percent (%) of load by sector
Total service interruptions
Power supplier
Extreme storm
Prearranged
All other
Number and nature of service calls and complaints
Safety issues and workplace injuries
Total number of customers
Total kWh sold
Other electric revenue
Total kWh purchased
Total kWh generated
Cost of purchases and generation
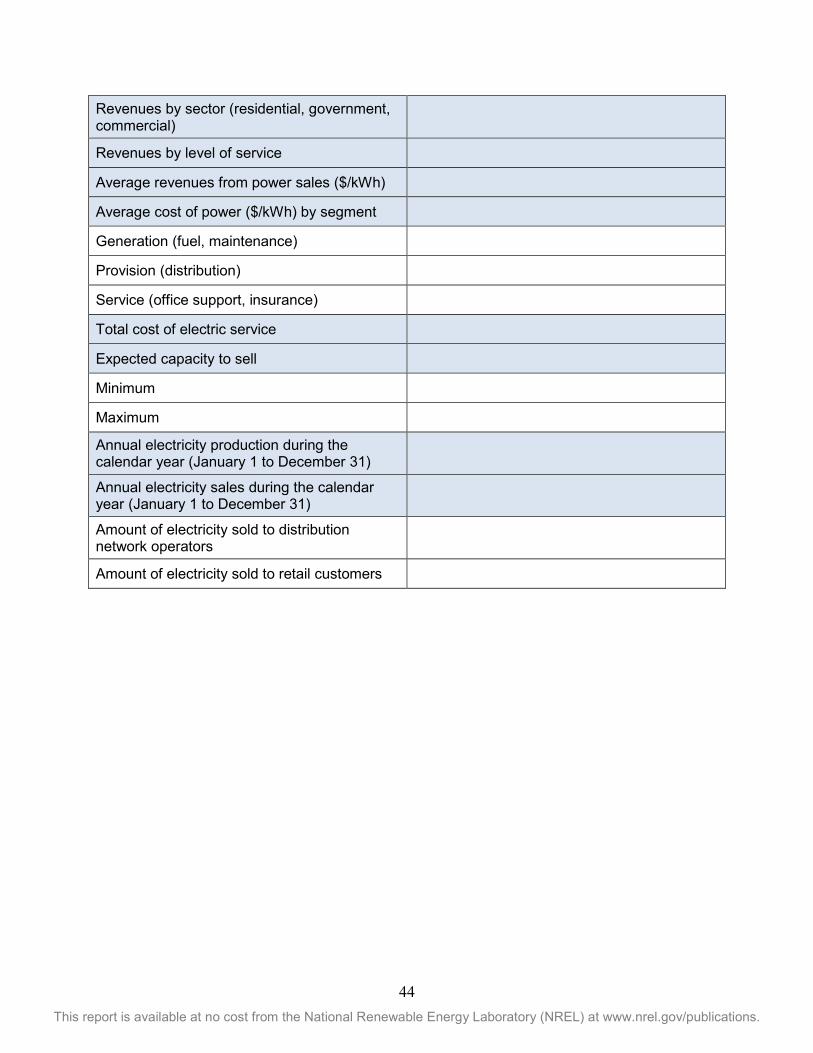
44 This report is available at no cost from the National Renewable Energy Laboratory (NREL) at www.nrel.gov/publications.
Revenues by sector (residential, government, commercial)
Revenues by level of service
Average revenues from power sales ($/kWh)
Average cost of power ($/kWh) by segment
Generation (fuel, maintenance)
Provision (distribution)
Service (office support, insurance)
Total cost of electric service
Expected capacity to sell
Minimum
Maximum
Annual electricity production during the calendar year (January 1 to December 31)
Annual electricity sales during the calendar year (January 1 to December 31)
Amount of electricity sold to distribution network operators
Amount of electricity sold to retail customers