ministry of economic development of georgia - oecd.org · ministry of economic development of...
TRANSCRIPT

Georgian Economic Outlook
Ministry of Economic Development of
Georgia

Ministry of Economic Development of Georgia
Country Overview
Area: 69 700 sq km
Population 2008 E: 4 630 841
Life expectancy: 76.51 years
Official language: Georgian
Literacy: 100%
Capital: Tbilisi
Currency (code): Lari (GEL)
GDP 2008E: US$ 12.80 billion
GDP - real growth rate 2008E: 2.1%
GDP - Per Capita 2008 US$ 2 920.3
Inflation rate 2008 (average annual): 10.0%
External debt to GDP 2008: 21.4%

Ministry of Economic Development of Georgia
Liberal Reforms for Long Term Sustainable Growth
• Liberal Tax Code
Only 6 taxes left
Significant procedural and institutional reforms
Simplified system of tax disputes discussion
• Customs Reform
Simplified customs procedures
Simplified and sharply reduced the costs connected to the foreign trade
Number of import tariffs were abolished on approximetaly 90% of products
3 tariff rates (0%, 5%, 12%) remained
No quantitative restrictions (quotas) on imports and exports
• Modernized system of Licenses and Permits
Number of licenses and permits reduced by 84%
Licenses and permits are only used in the production of highly risky goods and services, usage of natural
resources and other specific activities
Significantly simplified procedures of issuing licenses and permits
Introduced “one-stop shop” and “silence is consent” principles

Ministry of Economic Development of Georgia
Liberal Reforms for Long Term Sustainable Growth
• The reform of Technical Regulation System
National mandatory standards system was replaced by the voluntary standards, giving entrepreneurs
the possibility:
– To select the standard for his activities registered in the country
– To use the standard of any country or any regional or international standard
– To register standards in Georgian National Agency for Standards, Technical Regulations and
Metrology and to use them for entrepreneurial activities
– To elaborate own standard for new goods, register it in the national agency and use it in
entrepreneurial activity
– To obtain consultations for the selection and elaboration of standards
Declined role of state in the system of technical regulation
• Liberal Labor Code – one of the most liberal in the world
Simplified relations between employers and employees
Significantly reduced hiring and firing expenses
Ministry of Economic Development of Georgia
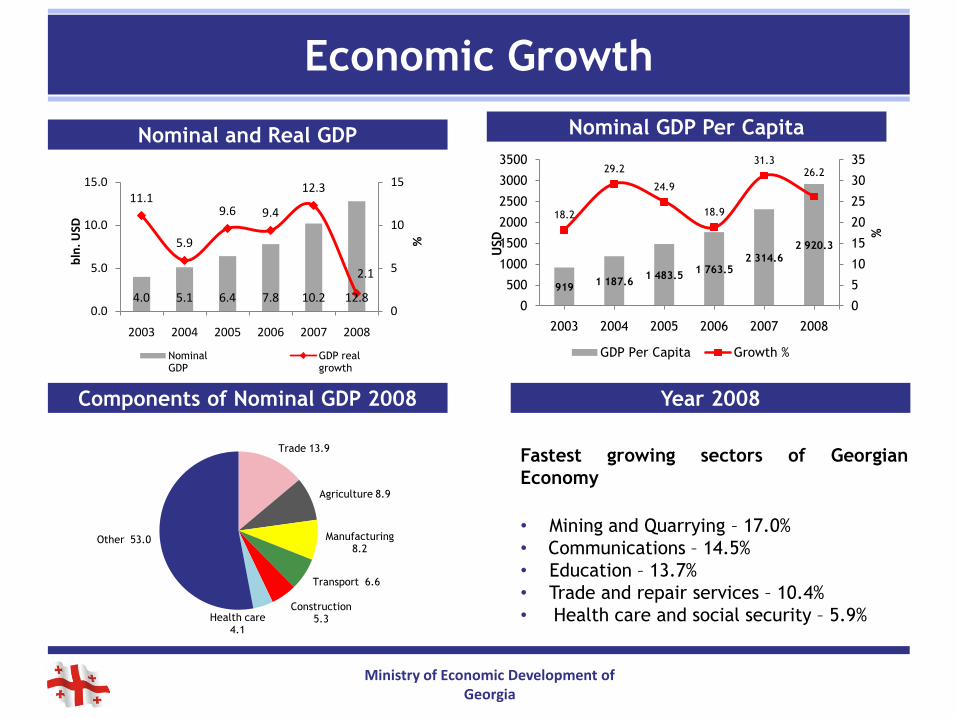
Economic Growth
4.0 5.1 6.4 7.8 10.2 12.8
11.1
5.9
9.6 9.4
12.3
2.1
0
5
10
15
0.0
5.0
10.0
15.0
2003 2004 2005 2006 2007 2008
%
bln
. USD
Nominal GDP
GDP real growth
Nominal and Real GDP
Year 2008
Fastest growing sectors of Georgian
Economy
• Mining and Quarrying – 17.0%
• Communications – 14.5%
• Education – 13.7%
• Trade and repair services – 10.4%
• Health care and social security – 5.9%
Components of Nominal GDP 2008
Nominal GDP Per Capita
Trade 13.9
Agriculture 8.9
Manufacturing 8.2
Transport 6.6
Construction 5.3Health care
4.1
Other 53.0
9191 187.6
1 483.51 763.5
2 314.6
2 920.3
18.2
29.2
24.9
18.9
31.326.2
0
5
10
15
20
25
30
35
0
500
1000
1500
2000
2500
3000
3500
2003 2004 2005 2006 2007 2008
%
USD
GDP Per Capita Growth %
Ministry of Economic Development of Georgia
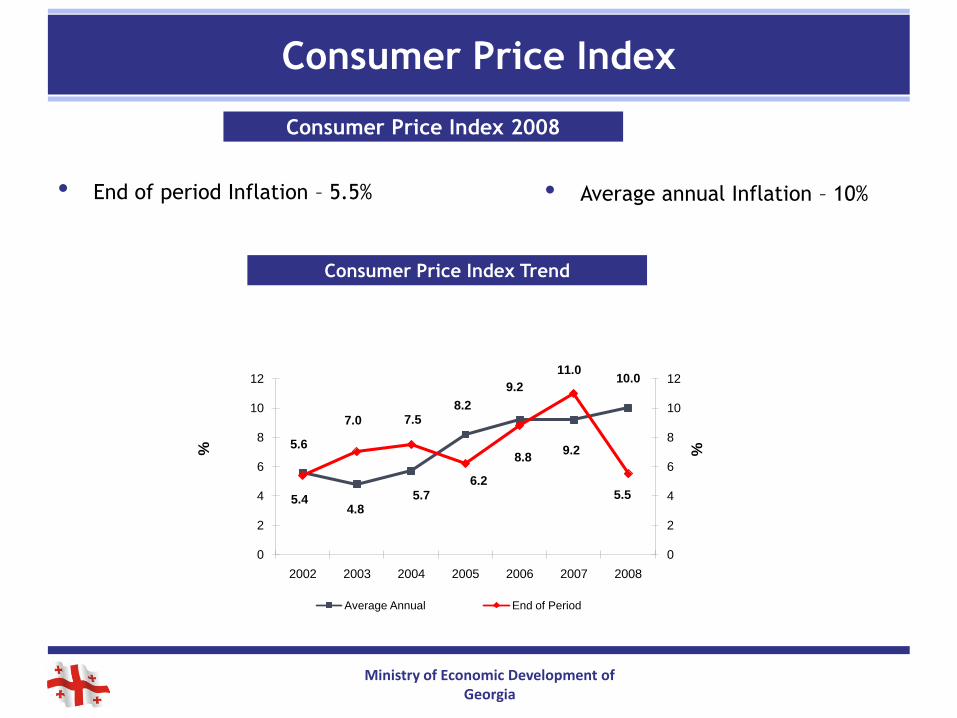
Consumer Price Index
Consumer Price Index 2008
• End of period Inflation – 5.5%
Consumer Price Index Trend
5.6
4.85.7
8.2
9.2
9.2
10.0
5.4
7.0 7.5
6.2
8.8
11.0
5.5
0
2
4
6
8
10
12
0
2
4
6
8
10
12
2002 2003 2004 2005 2006 2007 2008
%%
Average Annual End of Period
• Average annual Inflation – 10%

Ministry of Economic Development of Georgia
Labour Market
• Challenge: structural unemployment/job mismatch
• Response: State Programs:
Vocational Training and Retraining, Development of
Professional Training Infrastructure “Professional
Education for Employment” (PPP format)
“Cheap Credit”, “100 new Agro Industry
Enterprises”
11.5
12.6 13.8 13.613.3
0
2
4
6
8
10
12
14
16
18
20
2003 2004 2005 2006 2007
%
• Unemployment rate declined to 13.3% in
2007, down 0.3% y-o-y
• Employed population – 1 678.7 thousand, among
which:
Salaried employees – 625.4 thousand (+3.5%
07/’06)
• Accelerated growth rate of the number of salaried
employed and decrease of the number of self-
employed
Unemployment Rate %
Monthly Salary of Employed in
State and Non-state Enterprises
141 158
194
265
306
138165
212
307
442
0
100
200
300
400
500
2003 2004 2005 2006 2007
GE
L
State Sector Private Sector
Ministry of Economic Development of Georgia
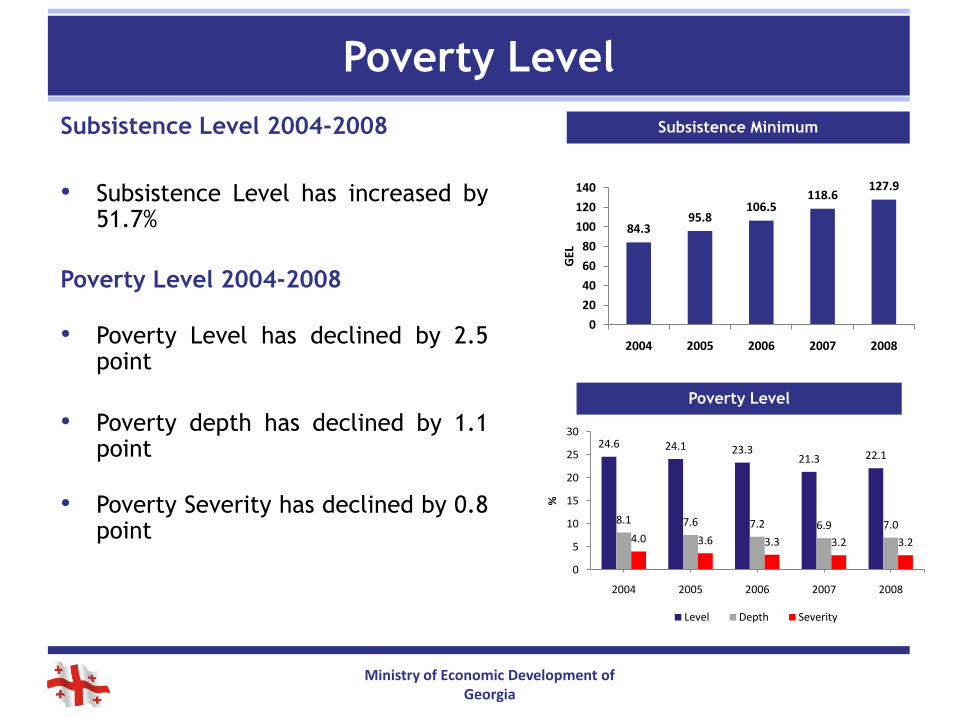
Poverty Level
Subsistence Level 2004-2008
• Subsistence Level has increased by51.7%
Poverty Level 2004-2008
• Poverty Level has declined by 2.5point
• Poverty depth has declined by 1.1point
• Poverty Severity has declined by 0.8point
Subsistence Minimum
Poverty Level
84.395.8
106.5118.6
127.9
0
20
40
60
80
100
120
140
2004 2005 2006 2007 2008
GEL
24.6 24.1 23.321.3 22.1
8.1 7.6 7.2 6.9 7.04.0 3.6 3.3 3.2 3.2
0
5
10
15
20
25
30
2004 2005 2006 2007 2008
%
Level Depth Severity
Ministry of Economic Development of Georgia
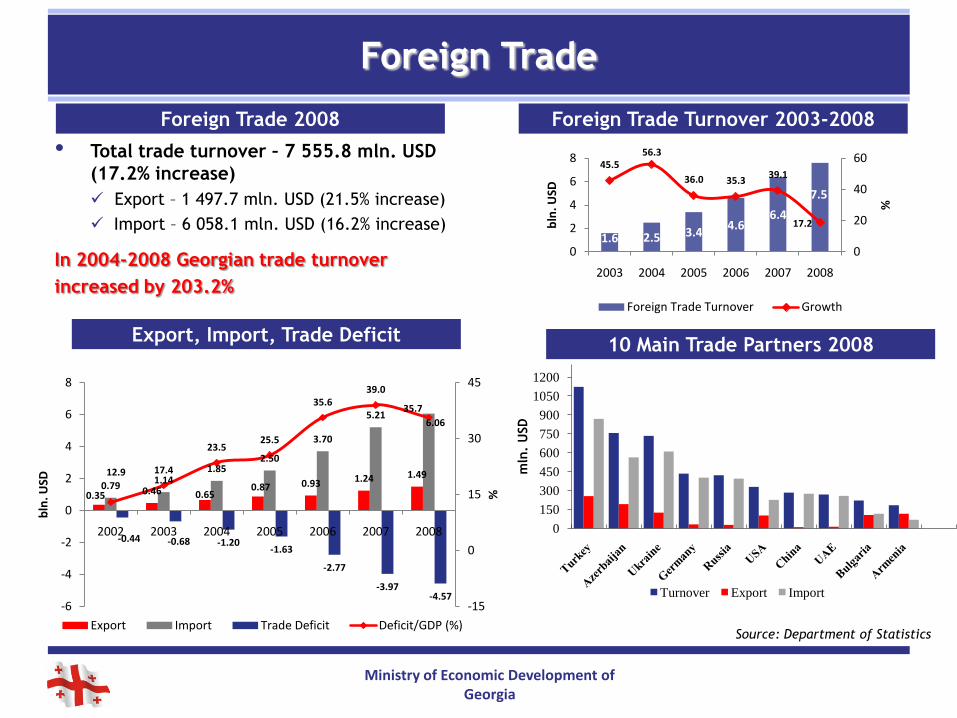
Foreign Trade
0
150
300
450
600
750
900
1050
1200
mln
. U
SD
Turnover Export Import
Source: Department of Statistics
10 Main Trade Partners 2008
Foreign Trade Turnover 2003-2008
• Total trade turnover – 7 555.8 mln. USD
(17.2% increase)
Export – 1 497.7 mln. USD (21.5% increase)
Import – 6 058.1 mln. USD (16.2% increase)
In 2004-2008 Georgian trade turnover
increased by 203.2%
Foreign Trade 2008
0.35 0.46 0.650.87 0.93 1.24 1.49
0.791.14
1.852.50
3.70
5.216.06
-0.44 -0.68 -1.20-1.63
-2.77
-3.97-4.57
12.9 17.4
23.525.5
35.639.0
35.7
-15
0
15
30
45
-6
-4
-2
0
2
4
6
8
2002 2003 2004 2005 2006 2007 2008
%
bln
. USD
Export Import Trade Deficit Deficit/GDP (%)
Export, Import, Trade Deficit
1.6 2.5 3.44.6
6.4
7.5
45.556.3
36.0 35.339.1
17.2
0
20
40
60
0
2
4
6
8
2003 2004 2005 2006 2007 2008
%
bln
. USD
Foreign Trade Turnover Growth
Ministry of Economic Development of Georgia
Foreign Trade
Foreign Trade With Country Groups 2008
Source: Department of Statistics of Georgia
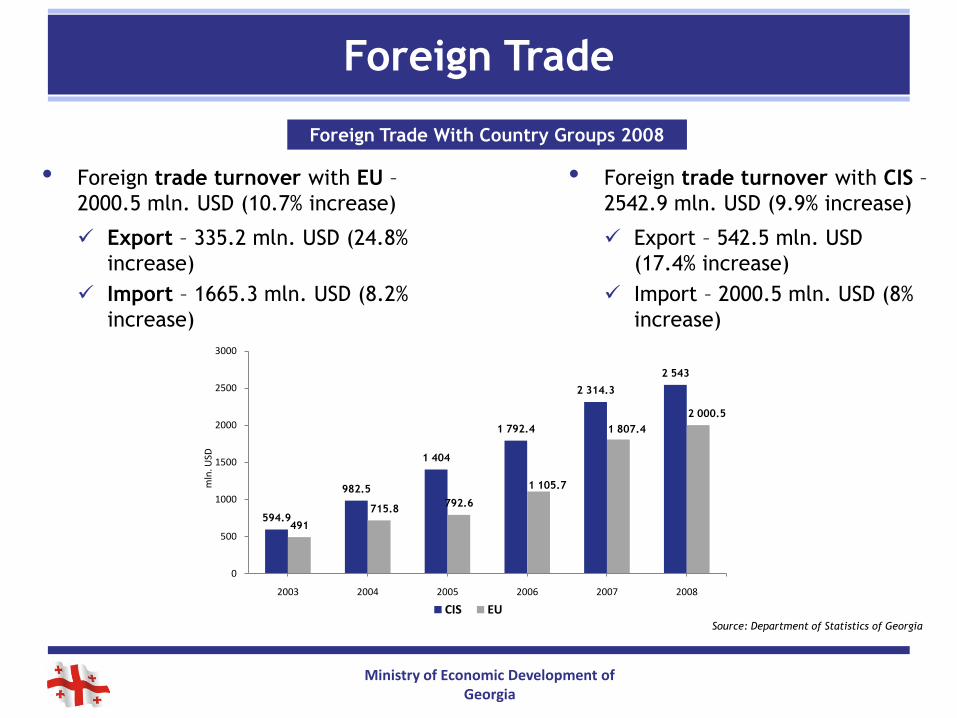
• Foreign trade turnover with EU –
2000.5 mln. USD (10.7% increase)
Export – 335.2 mln. USD (24.8%
increase)
Import – 1665.3 mln. USD (8.2%
increase)
• Foreign trade turnover with CIS –
2542.9 mln. USD (9.9% increase)
Export – 542.5 mln. USD
(17.4% increase)
Import – 2000.5 mln. USD (8%
increase)
594.9
982.5
1 404
1 792.4
2 314.3
2 543
491
715.8792.6
1 105.7
1 807.4
2 000.5
0
500
1000
1500
2000
2500
3000
2003 2004 2005 2006 2007 2008
mln
. USD
CIS EU
Ministry of Economic Development of Georgia
Diversified Trade Structure
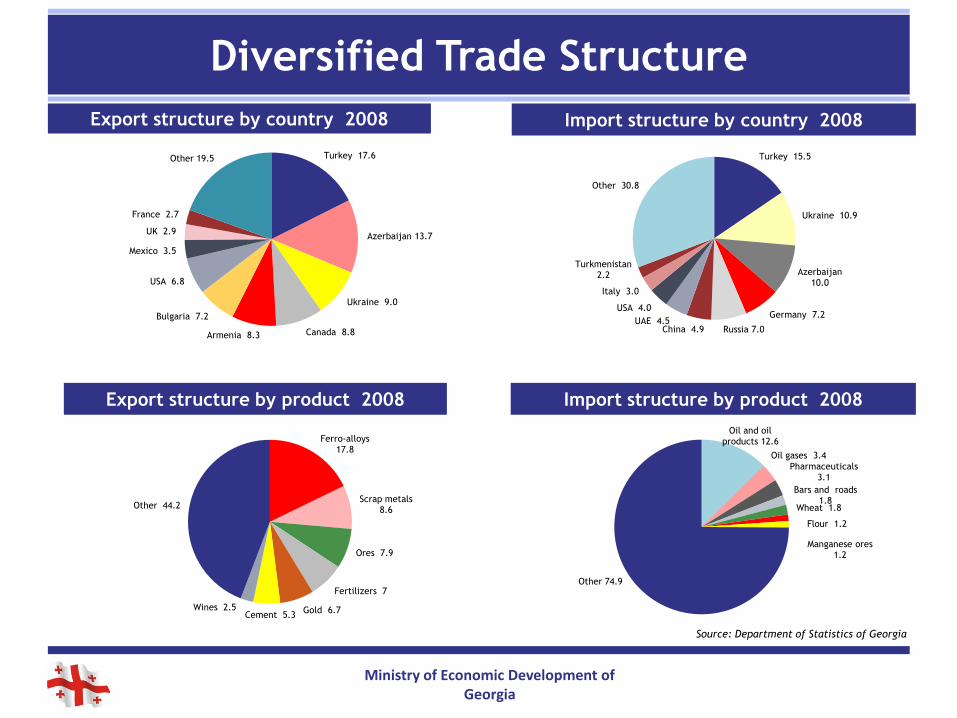
Export structure by country 2008 Import structure by country 2008
Export structure by product 2008 Import structure by product 2008
Source: Department of Statistics of Georgia
Turkey 17.6
Azerbaijan 13.7
Ukraine 9.0
Canada 8.8Armenia 8.3
Bulgaria 7.2
USA 6.8
Mexico 3.5
UK 2.9
France 2.7
Other 19.5 Turkey 15.5
Ukraine 10.9
Azerbaijan 10.0
Germany 7.2
Russia 7.0China 4.9UAE 4.5
USA 4.0
Italy 3.0
Turkmenistan 2.2
Other 30.8
Ferro-alloys 17.8
Scrap metals 8.6
Ores 7.9
Fertilizers 7
Gold 6.7Cement 5.3
Wines 2.5
Other 44.2
Oil and oil products 12.6
Oil gases 3.4
Pharmaceuticals3.1
Bars and roads 1.8
Wheat 1.8
Flour 1.2
Manganese ores 1.2
Other 74.9

Ministry of Economic Development of Georgia
Trade Policy
• Free Trade Regime – with CIS countries and Turkey (since November 1, 2008)
• Most Favored Nation Regime (MFN) – with World Trade Organization (WTO) member countries
• Preferential Regime (GSP) – with USA, Canada, Japan, Switzerland, Norway
• Preferential Regime (GSP+) – with EU (7200 items) since 2005
Possibility of FTA with EU in nearest future
Competitive Trade Regimes
• Low import tariffs (90% of goods free from import tariff)
• Few export/import licenses and permits
• No quantitative restrictions on import and export
• No customs tariff on export and re-export
• No VAT on export
• Simplified export and import procedures
Export Promotion Department was established for export facilitation
Main Features of Georgian Trade Policy
Ministry of Economic Development of Georgia
13
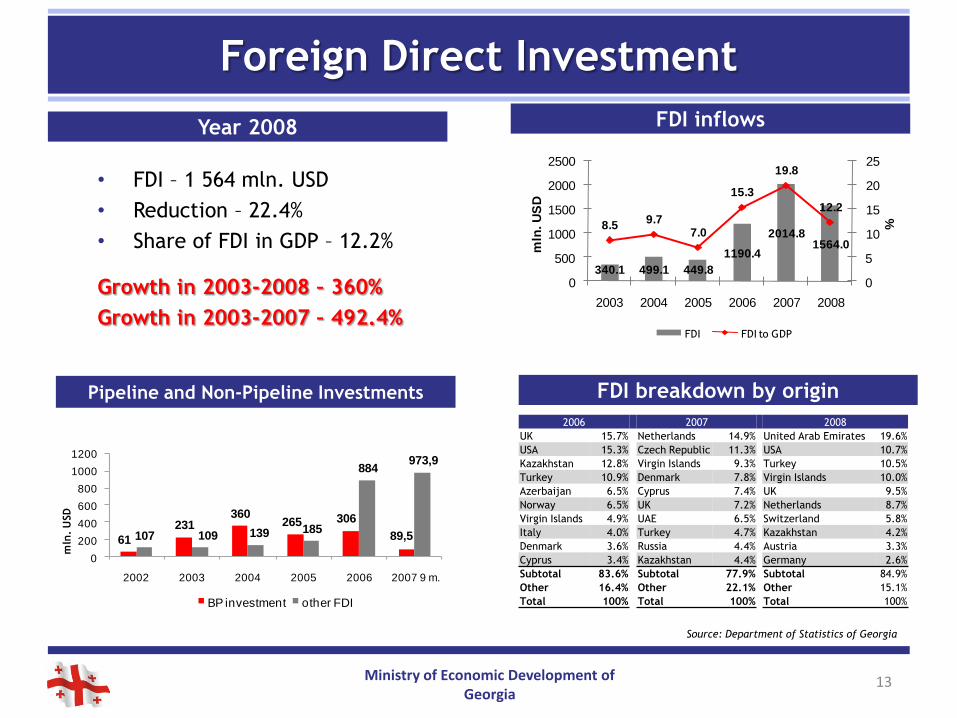
Foreign Direct Investment
FDI inflows
FDI breakdown by origin
Source: Department of Statistics of Georgia
• FDI – 1 564 mln. USD
• Reduction – 22.4%
• Share of FDI in GDP – 12.2%
Growth in 2003-2008 – 360%
Growth in 2003-2007 – 492.4%
Year 2008
Pipeline and Non-Pipeline Investments
61
231360
265 306
89,5107 109 139 185
884973,9
0
200
400
600
800
1000
1200
2002 2003 2004 2005 2006 2007 9 m.
mln
. U
SD
BP investment other FDI
2006 2007 2008
UK 15.7% Netherlands 14.9% United Arab Emirates 19.6%
USA 15.3% Czech Republic 11.3% USA 10.7%
Kazakhstan 12.8% Virgin Islands 9.3% Turkey 10.5%
Turkey 10.9% Denmark 7.8% Virgin Islands 10.0%
Azerbaijan 6.5% Cyprus 7.4% UK 9.5%
Norway 6.5% UK 7.2% Netherlands 8.7%
Virgin Islands 4.9% UAE 6.5% Switzerland 5.8%
Italy 4.0% Turkey 4.7% Kazakhstan 4.2%
Denmark 3.6% Russia 4.4% Austria 3.3%
Cyprus 3.4% Kazakhstan 4.4% Germany 2.6%
Subtotal 83.6% Subtotal 77.9% Subtotal 84.9%
Other 16.4% Other 22.1% Other 15.1%
Total 100% Total 100% Total 100%
340.1 499.1 449.8
1190.4
2014.81564.0
8.59.7
7.0
15.3
19.8
12.2
0
5
10
15
20
25
0
500
1000
1500
2000
2500
2003 2004 2005 2006 2007 2008
%
mln
. U
SD
FDI FDI to GDP
Ministry of Economic Development of Georgia
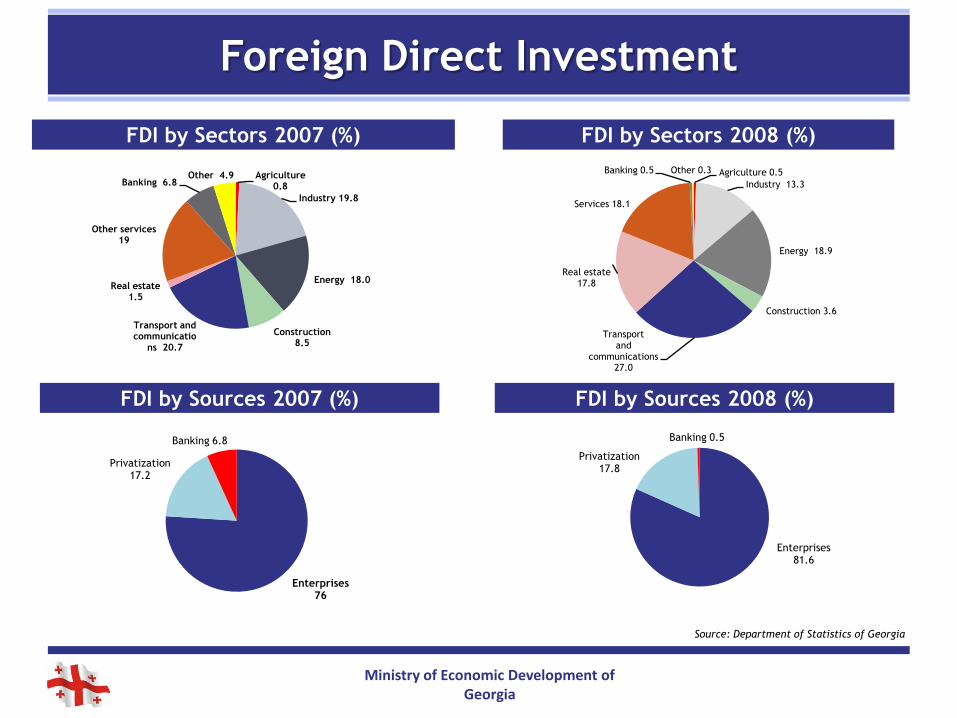
Foreign Direct Investment
FDI by Sectors 2007 (%)
Agriculture 0.8
Industry 19.8
Energy 18.0
Construction 8.5
Transport and communicatio
ns 20.7
Real estate 1.5
Other services 19
Banking 6.8Other 4.9
FDI by Sectors 2008 (%)
FDI by Sources 2007 (%)
Enterprises 76
Privatization 17.2
Banking 6.8
FDI by Sources 2008 (%)
Source: Department of Statistics of Georgia
Enterprises 81.6
Privatization 17.8
Banking 0.5
Agriculture 0.5
Industry 13.3
Energy 18.9
Construction 3.6
Transport and
communications27.0
Real estate 17.8
Services 18.1
Banking 0.5 Other 0.3
Ministry of Economic Development of Georgia
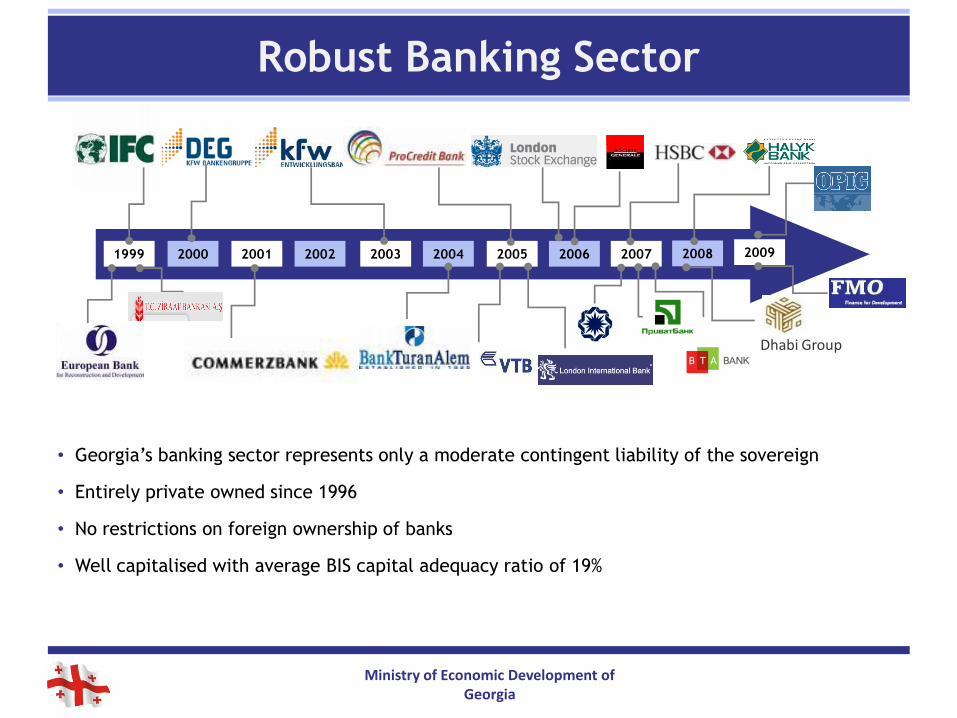
1999 2000 2001 2002 2003 2004 2005 2006 2007 2008 2009
Dhabi Group
• Georgia’s banking sector represents only a moderate contingent liability of the sovereign
• Entirely private owned since 1996
• No restrictions on foreign ownership of banks
• Well capitalised with average BIS capital adequacy ratio of 19%
Robust Banking Sector

Ministry of Economic Development of Georgia
FDI attraction – one of the main priorities of state
FDI supportive policy
• Georgian National Investment Agency
• Simplified regulations
• Reduced taxes
• Legislative basis
Law on State Support of Investments
Law on Free Industrial Zones
• Free Industrial Zones – preferences for investors
Tax incentives
Simplified procedures
• Free Trade Agreements with US and EU in the future
Foreign Direct Investment
Establishment of Free Industrial Zones – new possibility for investors
Ministry of Economic Development of Georgia
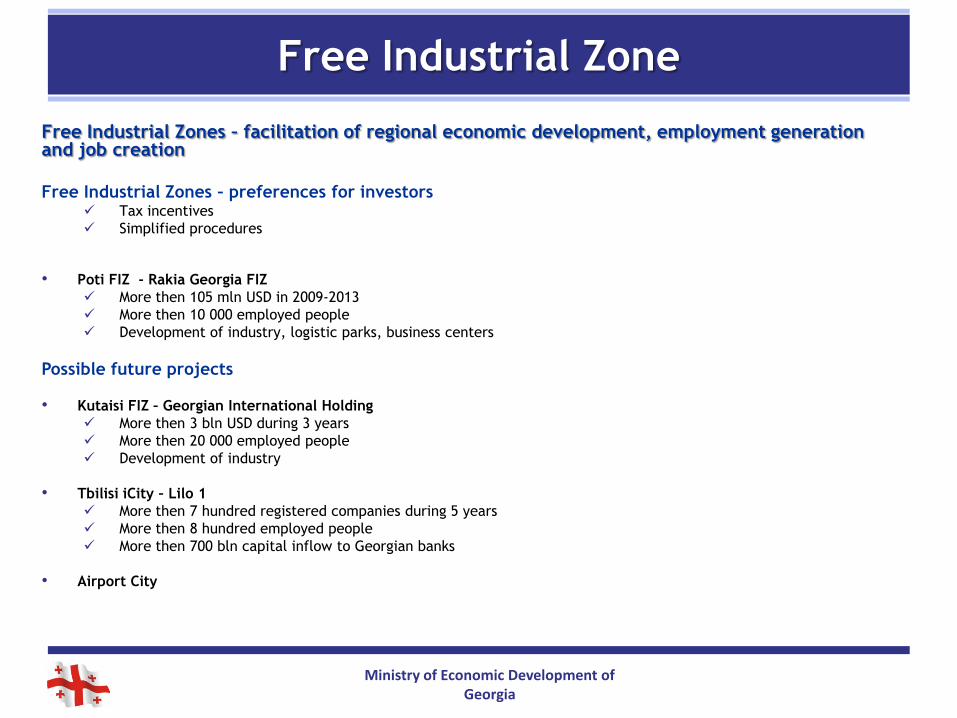
Free Industrial Zone
Free Industrial Zones – facilitation of regional economic development, employment generation and job creation
Free Industrial Zones – preferences for investors Tax incentives
Simplified procedures
• Poti FIZ - Rakia Georgia FIZ
More then 105 mln USD in 2009-2013
More then 10 000 employed people
Development of industry, logistic parks, business centers
Possible future projects
• Kutaisi FIZ – Georgian International Holding
More then 3 bln USD during 3 years
More then 20 000 employed people
Development of industry
• Tbilisi iCity – Lilo 1
More then 7 hundred registered companies during 5 years
More then 8 hundred employed people
More then 700 bln capital inflow to Georgian banks
• Airport City
Ministry of Economic Development of Georgia
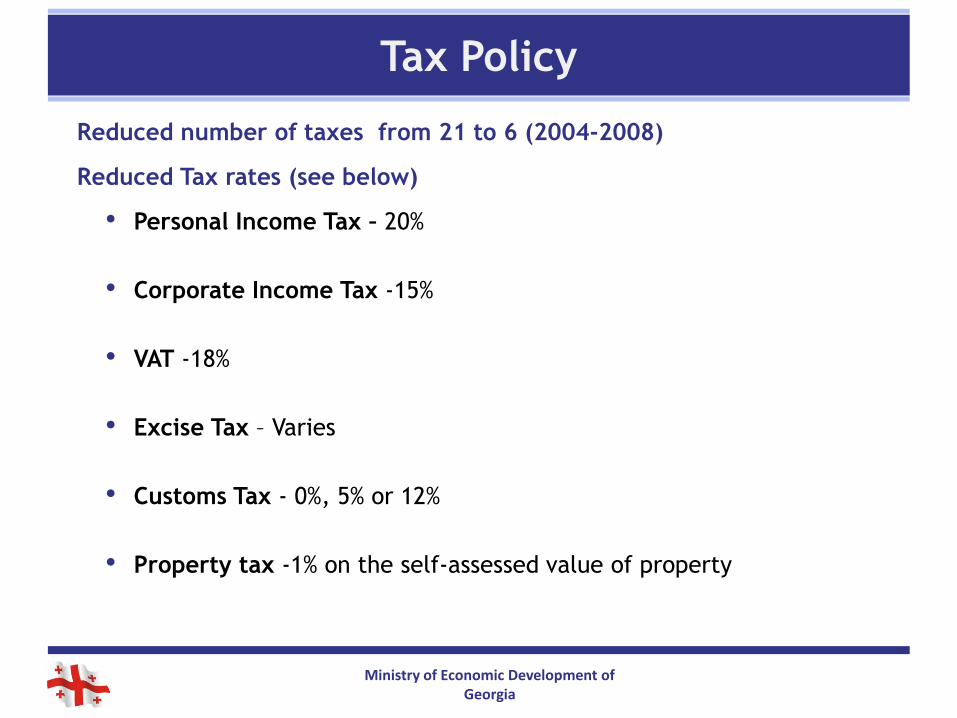
Tax Policy
Reduced number of taxes from 21 to 6 (2004-2008)
Reduced Tax rates (see below)
• Personal Income Tax – 20%
• Corporate Income Tax -15%
• VAT -18%
• Excise Tax – Varies
• Customs Tax - 0%, 5% or 12%
• Property tax -1% on the self-assessed value of property
Ministry of Economic Development of Georgia
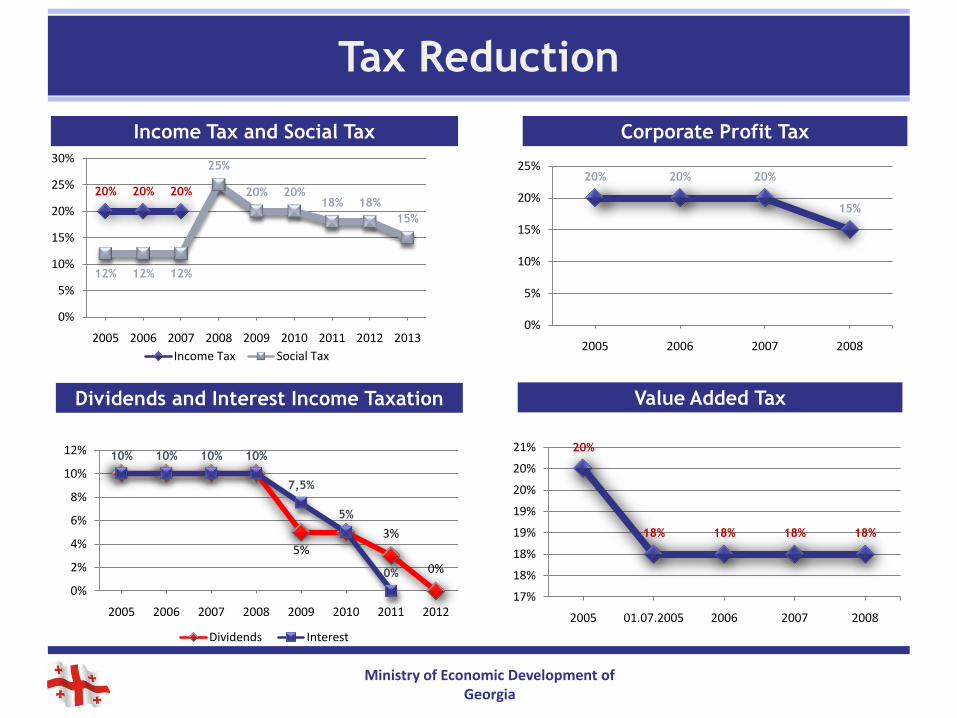
Tax Reduction
20% 20% 20%
12% 12% 12%
25%
20% 20%18% 18%
15%
0%
5%
10%
15%
20%
25%
30%
2005 2006 2007 2008 2009 2010 2011 2012 2013
Income Tax Social Tax
20% 20% 20%
15%
0%
5%
10%
15%
20%
25%
2005 2006 2007 2008
5%3%
0%
10% 10% 10% 10%
7,5%
5%
0%
0%
2%
4%
6%
8%
10%
12%
2005 2006 2007 2008 2009 2010 2011 2012
Dividends Interest
20%
18% 18% 18% 18%
17%
18%
18%
19%
19%
20%
20%
21%
2005 01.07.2005 2006 2007 2008
Income Tax and Social Tax Corporate Profit Tax
Dividends and Interest Income Taxation Value Added Tax
Ministry of Economic Development of Georgia
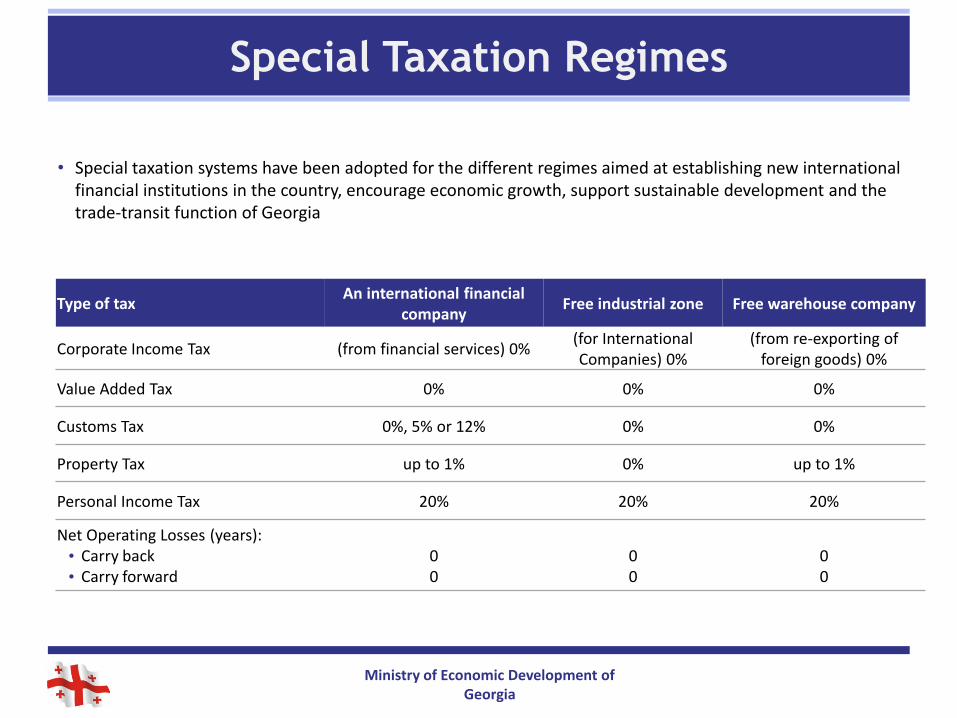
• Special taxation systems have been adopted for the different regimes aimed at establishing new international financial institutions in the country, encourage economic growth, support sustainable development and the trade-transit function of Georgia
Type of taxAn international financial
companyFree industrial zone Free warehouse company
Corporate Income Tax (from financial services) 0%(for International Companies) 0%
(from re-exporting of foreign goods) 0%
Value Added Tax 0% 0% 0%
Customs Tax 0%, 5% or 12% 0% 0%
Property Tax up to 1% 0% up to 1%
Personal Income Tax 20% 20% 20%
Net Operating Losses (years):• Carry back• Carry forward
00
00
00
Special Taxation Regimes
Ministry of Economic Development of Georgia
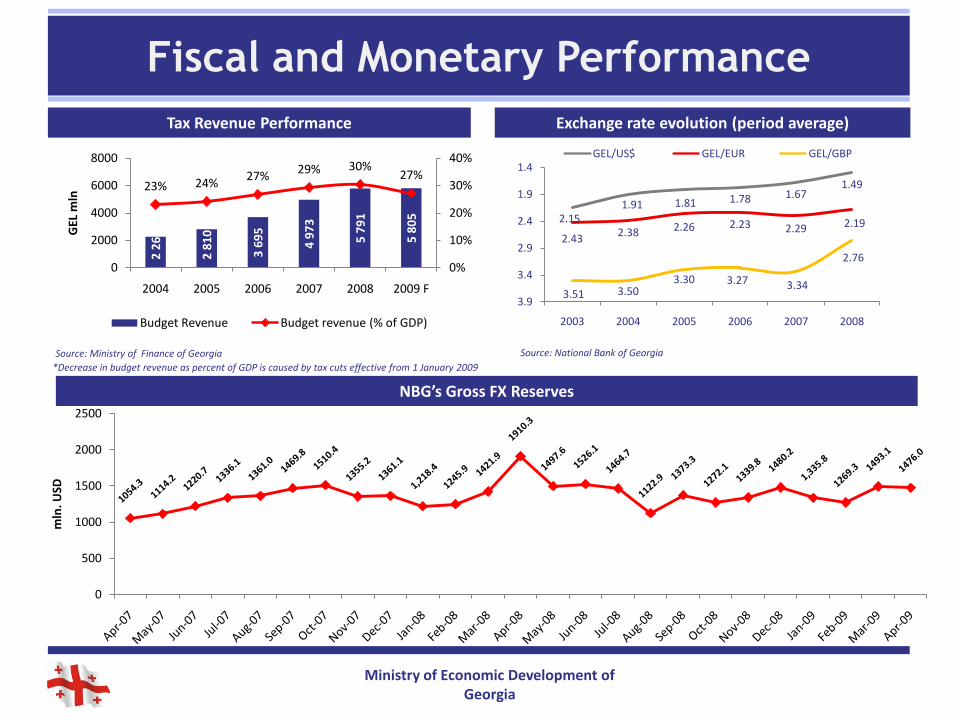
Fiscal and Monetary Performance
Tax Revenue Performance
*Decrease in budget revenue as percent of GDP is caused by tax cuts effective from 1 January 2009
Source: Ministry of Finance of Georgia
Exchange rate evolution (period average)
Source: National Bank of Georgia
2.151.91 1.81 1.78 1.67
1.49
2.432.38 2.26 2.23 2.29 2.19
3.51 3.503.30 3.27 3.34
2.76
1.4
1.9
2.4
2.9
3.4
3.9
2003 2004 2005 2006 2007 2008
GEL/US$ GEL/EUR GEL/GBP
NBG’s Gross FX Reserves
0
500
1000
1500
2000
2500
mln
. USD
2 2
67
2 8
10
3 6
95
4 9
73
5 7
91
5 8
05
23% 24%27%
29% 30%27%
0%
10%
20%
30%
40%
0
2000
4000
6000
8000
2004 2005 2006 2007 2008 2009 F
GEL
mln
Budget Revenue Budget revenue (% of GDP)
Ministry of Economic Development of Georgia
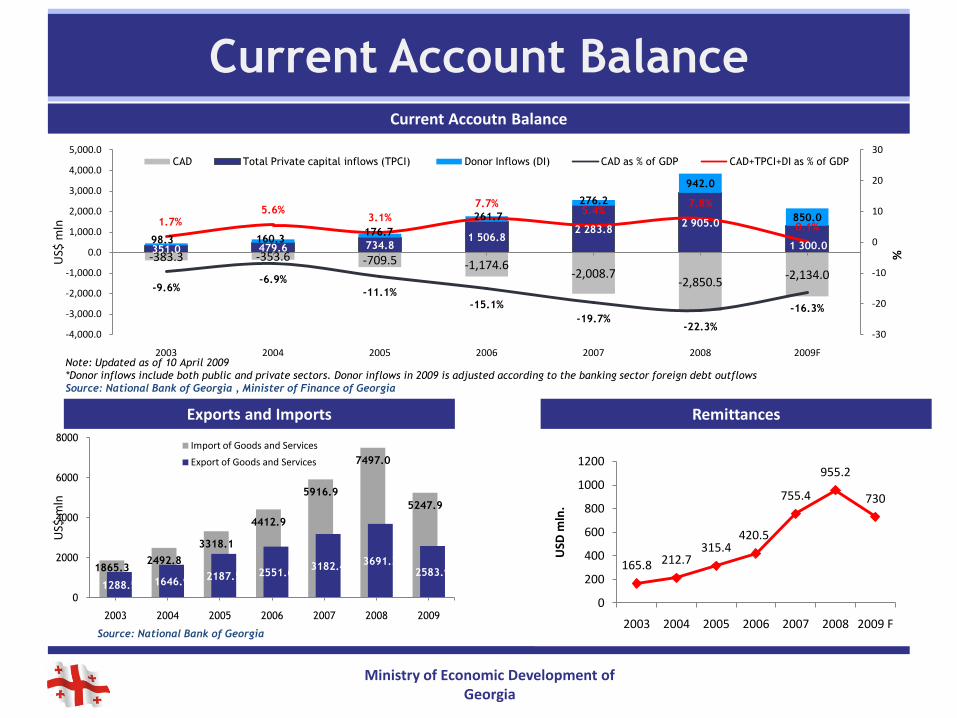
Current Account BalanceCurrent Accoutn Balance
Exports and Imports
-383.3 -353.6 -709.5 -1,174.6-2,008.7
-2,850.5-2,134.0
351.0 479.6 734.81 506.8
2 283.82 905.0
1 300.098.3 160.3
176.7
261.7
276.2
942.0
850.0
-9.6%-6.9%
-11.1%-15.1%
-19.7%-22.3%
-16.3%
1.7%5.6%
3.1%
7.7%5.4%
7.8%
0.1%
-30
-20
-10
0
10
20
30
-4,000.0
-3,000.0
-2,000.0
-1,000.0
0.0
1,000.0
2,000.0
3,000.0
4,000.0
5,000.0
2003 2004 2005 2006 2007 2008 2009F
%US$
mln
CAD Total Private capital inflows (TPCI) Donor Inflows (DI) CAD as % of GDP CAD+TPCI+DI as % of GDP
1865.32492.8
3318.1
4412.9
5916.9
7497.0
5247.9
1288.5 1646.92187.5 2551.6
3182.43691.3
2583.9
0
2000
4000
6000
8000
2003 2004 2005 2006 2007 2008 2009
US$
mln
Import of Goods and Services
Export of Goods and Services
Note: Updated as of 10 April 2009
*Donor inflows include both public and private sectors. Donor inflows in 2009 is adjusted according to the banking sector foreign debt outflows
Source: National Bank of Georgia , Minister of Finance of Georgia
Source: National Bank of Georgia
Remittances
165.8 212.7315.4
420.5
755.4
955.2
730
0
200
400
600
800
1000
1200
2003 2004 2005 2006 2007 2008 2009 F
USD
mln
.

Ministry of Economic Development of Georgia
Global Financial Crisis• In October 2008, Global Financial Crisis impact on Georgia’s macroeconomic
outlook through decreasing export and other related indicators
23
Real GDP growth - 2008
Source: Department of Statistics
-1.8
%
-1.5
% -0.9
%
0.3
% 0.7
%
0.7
%
0.8
%
1.0
%
1.0
% 1.4
%
1.6
%
1.8
%
1.9
%
2.0
%
2.1
% 2.5
% 2.9
%
3.0
%
3.0
%
3.3
%
4.7
%
-3%
-2%
-1%
0%
1%
2%
3%
4%
5%
6%
Irel
and
Esto
nia
Latv
ia
Icel
and
Jap
an
Can
ada
Fran
ce UK
Den
mar
k
Bel
giu
m
USA
Ger
man
y
Hu
nga
ry
Au
stri
a
Geo
rgia
*
Fin
lan
d
Lith
uan
ia
Ru
ssia
Ro
man
ia
Bu
lgar
ia
Ch
ina
Ministry of Economic Development of Georgia
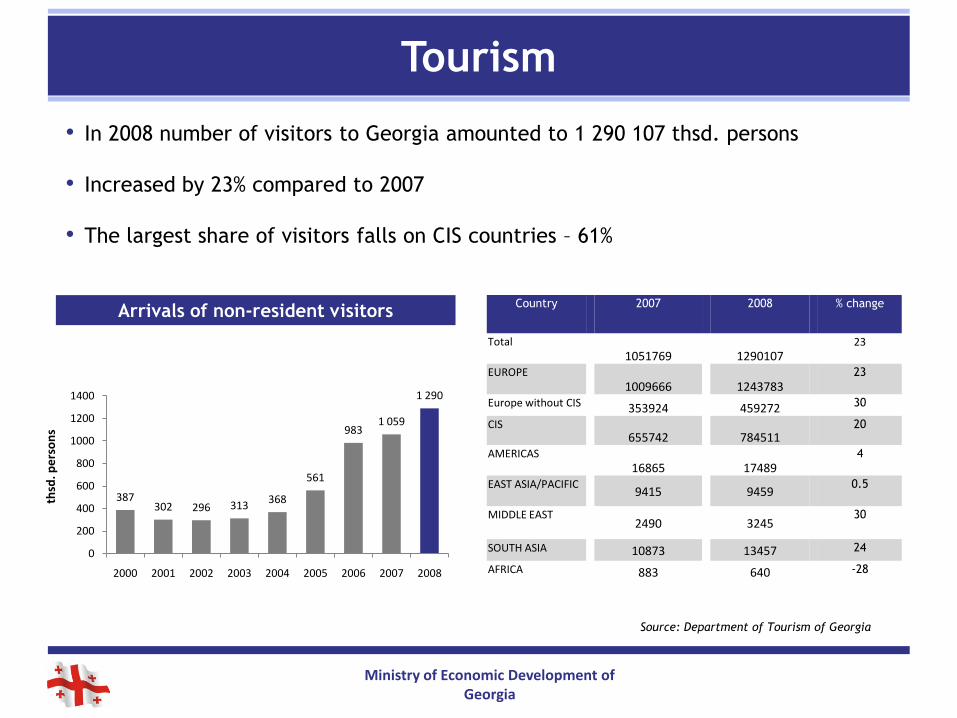
Tourism
Arrivals of non-resident visitorsCountry 2007 2008 % change
Total1051769 1290107
23
EUROPE 1009666 1243783
23
Europe without CIS 353924 459272 30
CIS655742 784511
20
AMERICAS16865 17489
4
EAST ASIA/PACIFIC9415 9459
0.5
MIDDLE EAST2490 3245
30
SOUTH ASIA 10873 13457 24
AFRICA 883 640 -28
• In 2008 number of visitors to Georgia amounted to 1 290 107 thsd. persons
• Increased by 23% compared to 2007
• The largest share of visitors falls on CIS countries – 61%
Source: Department of Tourism of Georgia
387302 296 313
368
561
9831 059
1 290
0
200
400
600
800
1000
1200
1400
2000 2001 2002 2003 2004 2005 2006 2007 2008
thsd
. pe
rso
ns

Ministry of Economic Development of Georgia
• 2003-2008 - 3 494 items were privatized
• Total amount - more then 2,27 bn. GEL
Privatization
761
267
776
441
595654
2473
419
565
644
551
0
100
200
300
400
500
600
700
800
900
2003 2004 2005 2006 2007 2008
Items Income mln.GEL
Privatization 2003-2008

Ministry of Economic Development of Georgia
Communications
• New Numbering System and Plan for E-Communications Network ofGeorgia has been elaborated by the MoED and currently takes proceduresforced by law
• The Law of Georgia on E-signature and E-documents was adopted inApril, 2008
• Georgian Government has launched new Georgian Government Network(GGN) project from November, 2006
At the end of 2008, “Magticom” LTD 3 months ahead completed first phase building process of GGN
More than 400 Ministries and other entities are involved in the process
The project considers building the governmental network between state bodies
Ministry of Economic Development of Georgia
Statistics
• Main aim
Set up independent statistics body
Ensure high quality and reliability of statistical data
Consider international best practices
• Preparation Process
Creation of special task force by special decree of the Government(December, 2008)
Elaboration of the concept for the reform and submit it to the public andGovernment for discussion
Task Force consists of independent experts, representatives of internationalorganizations and non-governmental institutions
Reform of the National Statistics System (NSS)

Ministry of Economic Development of Georgia
Technical Regulations
• Georgian National Agency for Standards, Technical Regulations and Metrology has becomean affiliated member of European Committee for Standardization (CEN) from April1, 2008
• Georgia has been an associate member of General Conference of Weights and Measures(GCPM) from 1st of April 2008
• A bilateral project with German National Metrology Institute PTB – “Promotion ofQuality Infrastructure in Georgia with special regard to Legal Metrology” started inFebruary, 2008
• Implementation phase of EC TACIC project “Support to Implementation of Art. 51”(Quality Management System) has started
• Permanent analysis of Georgian legislation is carried out. 75 laws, applied in the field oftechnical regulation, are registered in the register of standards and technical regulations
• The New and Global Approach Directives and standards harmonized with them (Georgianversion) are being gradually updated on the web page of the Agency
Standardization
Ministry of Economic Development of Georgia
Technical Regulations
• Signing of “Cooperation Agreement” between European Cooperation ofAccreditation (EA) and Georgian Accreditation Center
• On April 26, 2008 was sighed an “Agreement between Turkish AccreditationAgency (TURKAK) and The Georgian National Body on Accreditation - Center ofAccreditation (GAC) on Cooperation in the Field of Accreditation”
• A list of international standards in the field of accreditation was translatedand is officially registered by Accreditation Center
• National Accreditation Center and The State Standardization Committee ofByelorussia conducted inter laboratory testing for the accredited laboratoriesof Georgia and Byelorussia in 2008. Test was carried out in accordance withinternational standards and confirmed (wine, brandy) high quality of Georgianproducts and their conformity with international standards
Accreditation

Ministry of Economic Development of Georgia
30
Poti
Sarpi
Larsi
Vale
GugutiSadakhl
o
Red bridge
LagodekhiBatumi
Samtredia
Khashur
i
Kartsakhi
Senak
i
Zugdidi
Gantiadi
Gori
Rok
i
Armenia
Azerbaijan
Russia
Turkey
Black
Sea
Kutais
iTelavi
NinotsmindaPartskhisi
TerjolaTbilisi
Bypass
MRN
RailwayRailway – under construction
International Airports
Kulevi
Inoperative Airports
Akhaltsikh
e
Tbilisi
Zhdanovi
Akhalkalaki
Georgian Transport Network
49.8 49.7
49.0
290.1
298.1
305.6
280.0
285.0
290.0
295.0
300.0
305.0
310.0
47.0
47.4
47.8
48.2
48.6
49.0
49.4
49.8
50.2
I-XII'06 I-XII'07 I-XII'08
Total Cargo and Passenger Transportation
Cargo mln. tons (LHS) Passenger mln.(RHS)
Ministry of Economic Development of Georgia
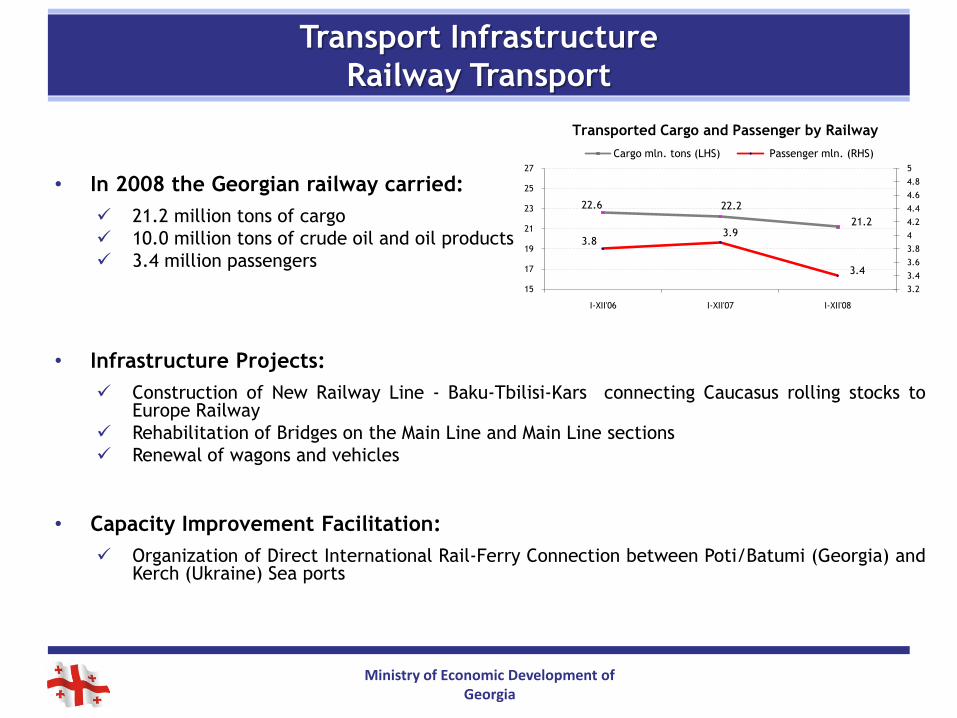
Transport Infrastructure
Railway Transport
• In 2008 the Georgian railway carried:
21.2 million tons of cargo
10.0 million tons of crude oil and oil products
3.4 million passengers
• Infrastructure Projects:
Construction of New Railway Line - Baku-Tbilisi-Kars connecting Caucasus rolling stocks toEurope Railway
Rehabilitation of Bridges on the Main Line and Main Line sections
Renewal of wagons and vehicles
• Capacity Improvement Facilitation:
Organization of Direct International Rail-Ferry Connection between Poti/Batumi (Georgia) andKerch (Ukraine) Sea ports
22.6 22.2
21.2
3.83.9
3.4
3.2
3.4
3.6
3.8
4
4.2
4.4
4.6
4.8
5
15
17
19
21
23
25
27
I-XII'06 I-XII'07 I-XII'08
Transported Cargo and Passenger by Railway
Cargo mln. tons (LHS) Passenger mln. (RHS)
Ministry of Economic Development of Georgia
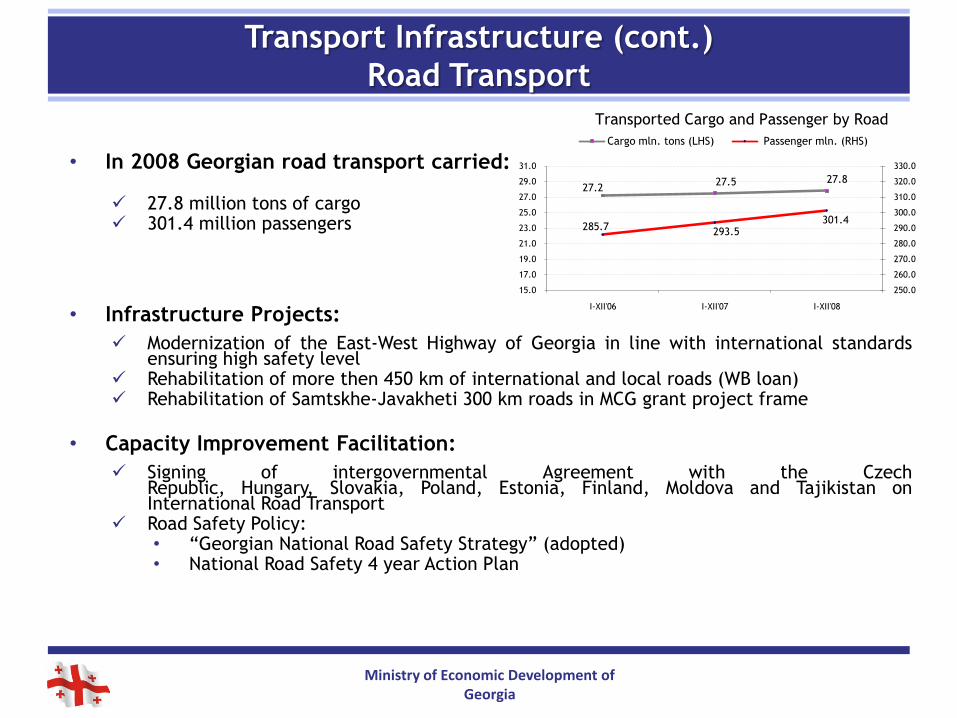
Transport Infrastructure (cont.)
Road Transport
• In 2008 Georgian road transport carried:
27.8 million tons of cargo 301.4 million passengers
• Infrastructure Projects:
Modernization of the East-West Highway of Georgia in line with international standardsensuring high safety level
Rehabilitation of more then 450 km of international and local roads (WB loan) Rehabilitation of Samtskhe-Javakheti 300 km roads in MCG grant project frame
• Capacity Improvement Facilitation:
Signing of intergovernmental Agreement with the CzechRepublic, Hungary, Slovakia, Poland, Estonia, Finland, Moldova and Tajikistan onInternational Road Transport
Road Safety Policy:• “Georgian National Road Safety Strategy” (adopted)• National Road Safety 4 year Action Plan
27.227.5 27.8
285.7293.5
301.4
250.0
260.0
270.0
280.0
290.0
300.0
310.0
320.0
330.0
15.0
17.0
19.0
21.0
23.0
25.0
27.0
29.0
31.0
I-XII'06 I-XII'07 I-XII'08
Transported Cargo and Passenger by Road
Cargo mln. tons (LHS) Passenger mln. (RHS)
Ministry of Economic Development of Georgia
Transport Infrastructure (cont.)
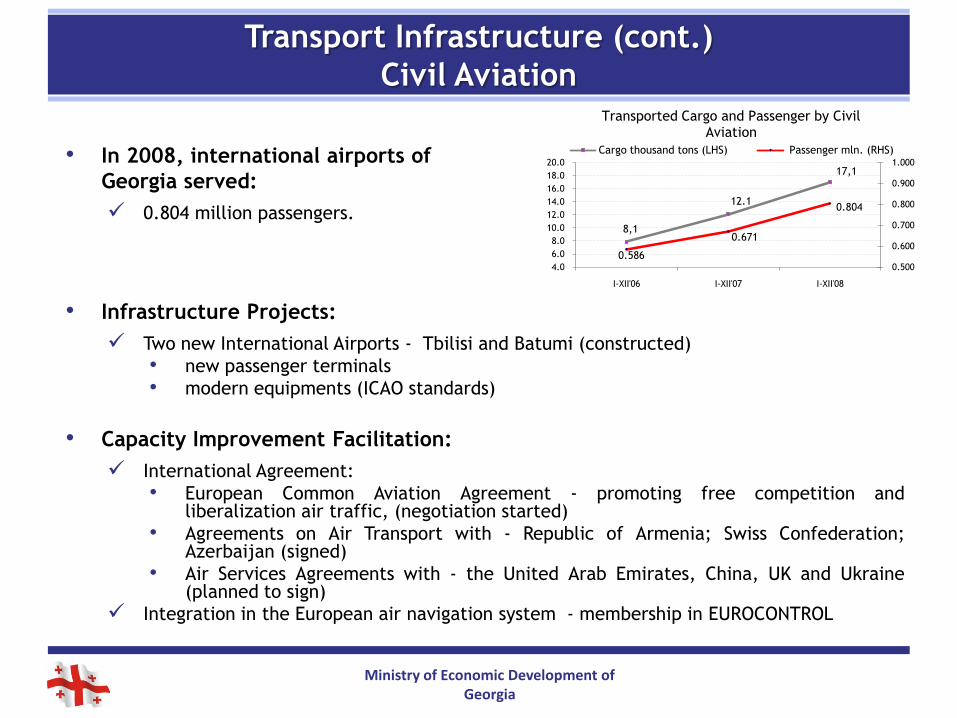
Civil Aviation
• In 2008, international airports of
Georgia served:
0.804 million passengers.
• Infrastructure Projects:
Two new International Airports - Tbilisi and Batumi (constructed)
• new passenger terminals
• modern equipments (ICAO standards)
• Capacity Improvement Facilitation:
International Agreement:
• European Common Aviation Agreement - promoting free competition andliberalization air traffic, (negotiation started)
• Agreements on Air Transport with - Republic of Armenia; Swiss Confederation;Azerbaijan (signed)
• Air Services Agreements with - the United Arab Emirates, China, UK and Ukraine(planned to sign)
Integration in the European air navigation system - membership in EUROCONTROL
8,1
12.1
17,1
0.586
0.671
0.804
0.500
0.600
0.700
0.800
0.900
1.000
4.0
6.0
8.0
10.0
12.0
14.0
16.0
18.0
20.0
I-XII'06 I-XII'07 I-XII'08
Transported Cargo and Passenger by Civil Aviation
Cargo thousand tons (LHS) Passenger mln. (RHS)
Ministry of Economic Development of Georgia
Transport Infrastructure (cont.)
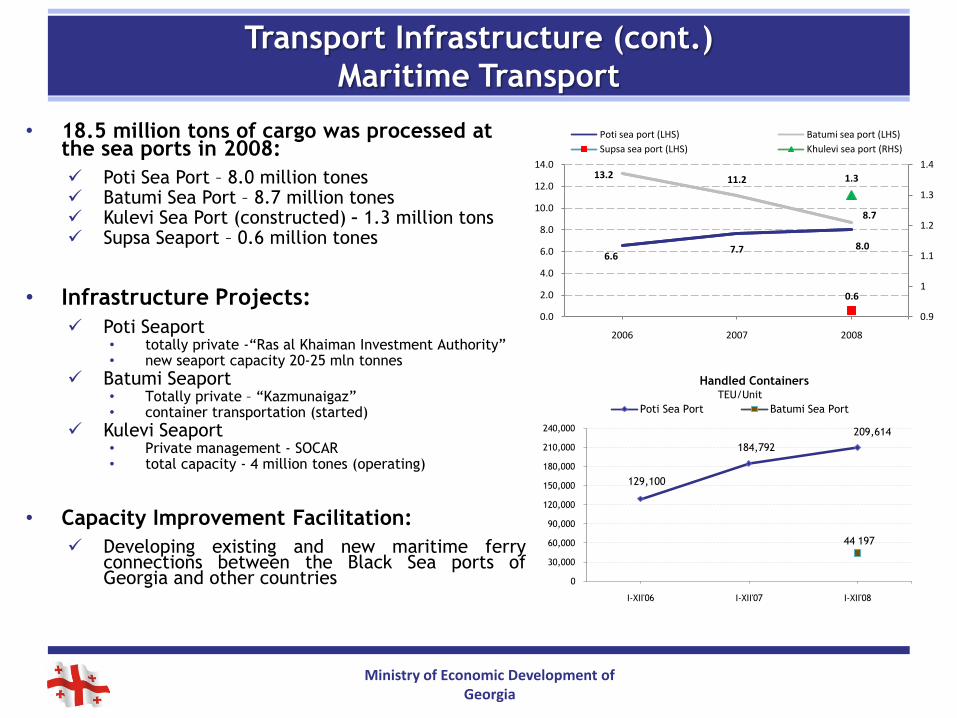
Maritime Transport
• 18.5 million tons of cargo was processed at the sea ports in 2008:
Poti Sea Port – 8.0 million tones Batumi Sea Port – 8.7 million tones Kulevi Sea Port (constructed) – 1.3 million tons Supsa Seaport – 0.6 million tones
• Infrastructure Projects:
Poti Seaport• totally private -“Ras al Khaiman Investment Authority”• new seaport capacity 20-25 mln tonnes
Batumi Seaport• Totally private – “Kazmunaigaz”• container transportation (started)
Kulevi Seaport• Private management - SOCAR• total capacity - 4 million tones (operating)
• Capacity Improvement Facilitation:
Developing existing and new maritime ferryconnections between the Black Sea ports ofGeorgia and other countries
129,100
184,792
209,614
44 197
0
30,000
60,000
90,000
120,000
150,000
180,000
210,000
240,000
I-XII'06 I-XII'07 I-XII'08
TEU/Unit
Handled Containers
Poti Sea Port Batumi Sea Port
6.67.7 8.0
0.6
13.2 11.2
8.7
1.3
0.9
1
1.1
1.2
1.3
1.4
0.0
2.0
4.0
6.0
8.0
10.0
12.0
14.0
2006 2007 2008
Poti sea port (LHS) Batumi sea port (LHS)
Supsa sea port (LHS) Khulevi sea port (RHS)
Ministry of Economic Development of Georgia
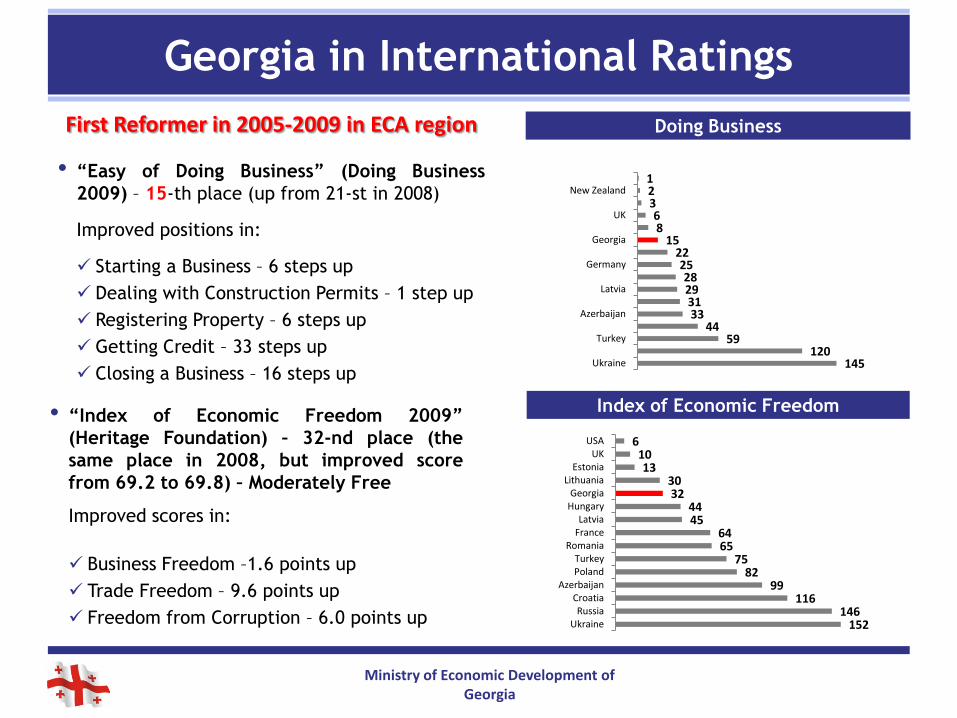
Georgia in International Ratings
• “Easy of Doing Business” (Doing Business
2009) – 15-th place (up from 21-st in 2008)
Improved positions in:
Starting a Business – 6 steps up
Dealing with Construction Permits – 1 step up
Registering Property – 6 steps up
Getting Credit – 33 steps up
Closing a Business – 16 steps up
• “Index of Economic Freedom 2009”
(Heritage Foundation) – 32-nd place (the
same place in 2008, but improved score
from 69.2 to 69.8) – Moderately Free
Improved scores in:
Business Freedom –1.6 points up
Trade Freedom – 9.6 points up
Freedom from Corruption – 6.0 points up
Doing Business
Index of Economic Freedom
145120
5944
33312928
2522
1586
321
Ukraine
Turkey
Azerbaijan
Latvia
Germany
Georgia
UK
New Zealand
152146
11699
8275
6564
4544
3230
1310
6
UkraineRussia
CroatiaAzerbaijan
PolandTurkey
RomaniaFranceLatvia
HungaryGeorgia
LithuaniaEstonia
UKUSA
First Reformer in 2005-2009 in ECA region

Ministry of Economic Development of Georgia
Georgia in International Ratings
• “Index of Economic Freedom 2008” (Fraser
Institute) – 39-th place (up from 44-th in 2007)
Improved scores in:
Legal Structure and Security of Property
Rights – 0.25 points up
Access to Sound Money – 0.07 points up
Freedom to Trade Internationally – 0.74 points
up
Regulation of Credit, Labor and Business –
0.05 points up
• “Inward FDI Performance Index 2007”
(UNCTAD World Investment Report) – 9-th
place (up from 15-th in 2006)
Improved positions because of:
Positive reform
Increased investors protection
Index of Economic Freedom
121118
10190
6967
454039
3128
1711
Ukraine
Azerbaijan
Russia
Turkey
Poland
Armenia
France
Latvia
Georgia
Lithuania
Hungary
Germany
Estonia
2019
1817
1615
1413
1211
109
87
65
43
21
Egypt
Moldova
Cyprus
Tajikistan
Mongolia
Panama
Gambia
Belgium
Bahrain
Guyana
Lebanon
Georgia
Estonia
Singapore
Jordan
Bahamas
Malta
Iceland
Bulgaria
Hong …
Inward FDI Performance Index
Ministry of Economic Development of Georgia
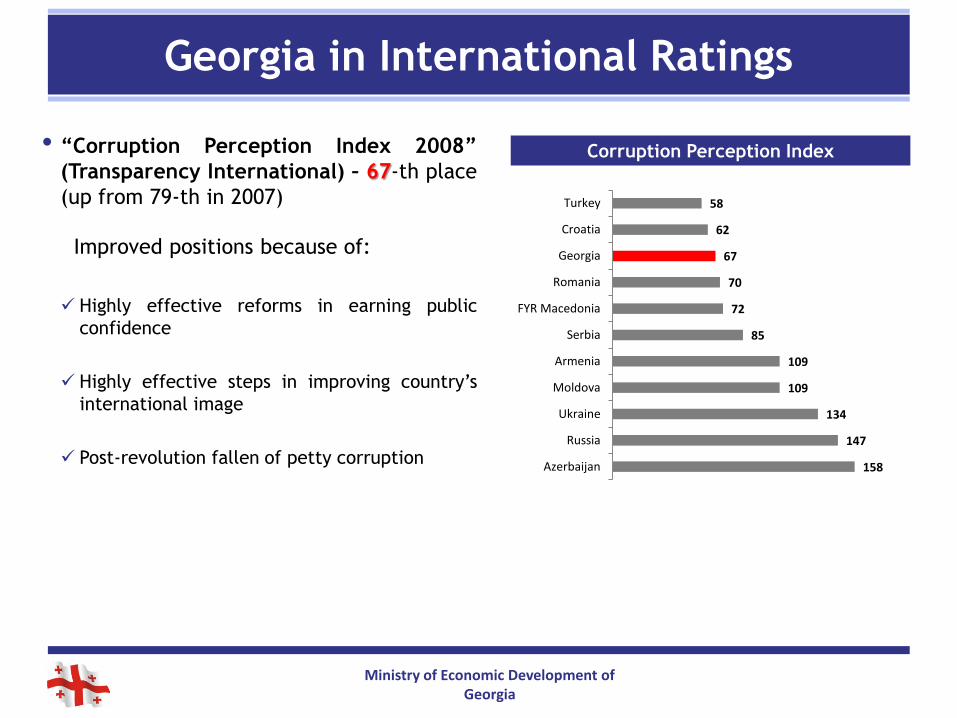
Georgia in International Ratings
• “Corruption Perception Index 2008”
(Transparency International) – 67-th place
(up from 79-th in 2007)
Improved positions because of:
Highly effective reforms in earning public
confidence
Highly effective steps in improving country’s
international image
Post-revolution fallen of petty corruption
Corruption Perception Index
158
147
134
109
109
85
72
70
67
62
58
Azerbaijan
Russia
Ukraine
Moldova
Armenia
Serbia
FYR Macedonia
Romania
Georgia
Croatia
Turkey

Ministry of Economic Development of Georgia
Georgia in International Ratings
• “Bertelsmann Transformation 2008”
(Bertelsmann Foundation):
Status Index – 38-th place (up from
61-th in 2006)
Management Index – 23-th place (up
from 35-th in 2006)
Improved scores in:
• Status index:
Political transformation – 0.75 points
up
Economic transformation – 0.99 points
up
• Management index:
Management performance – 0.55
points up
Status Index
Management Index
87
60
59
41
38
35
32
13
11
3
Azerbaijan
Moldova
Russia
Armenia
Georgia
Ukraine
Turkey
Latvia
Poland
Estonia
99
98
87
56
55
53
24
23
10
2
Azerbaijan
Russia
Moldova
Armenia
Ukraine
Poland
Turkey
Georgia
Latvia
Estonia
Ministry of Economic Development of Georgia2009
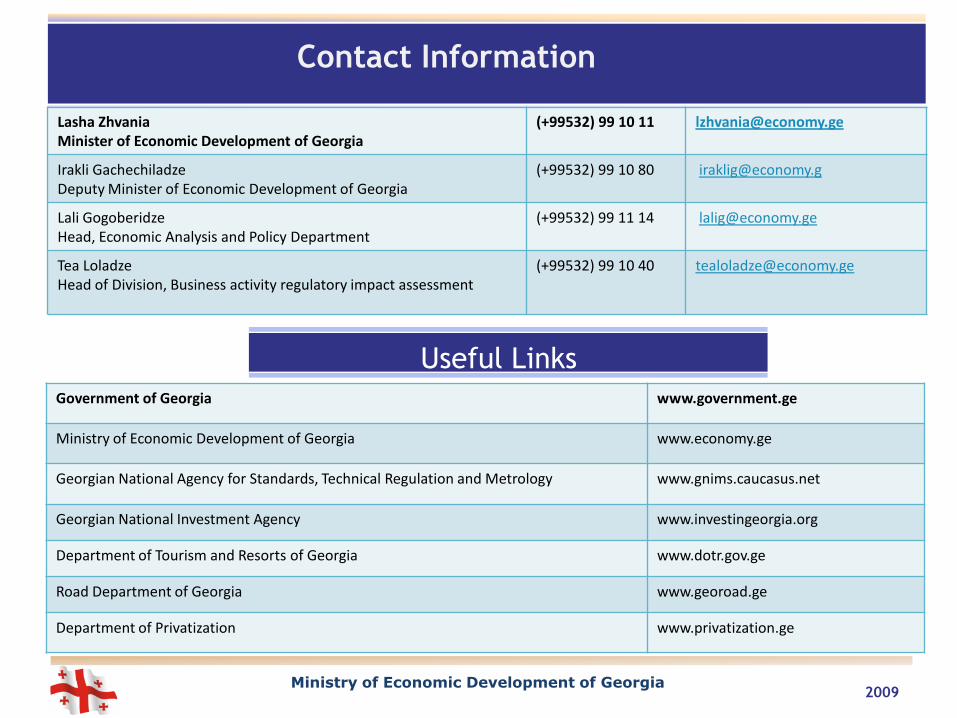
Contact Information
Lasha ZhvaniaMinister of Economic Development of Georgia
(+99532) 99 10 11 [email protected]
Irakli GachechiladzeDeputy Minister of Economic Development of Georgia
(+99532) 99 10 80 [email protected]
Lali GogoberidzeHead, Economic Analysis and Policy Department
(+99532) 99 11 14 [email protected]
Tea LoladzeHead of Division, Business activity regulatory impact assessment
(+99532) 99 10 40 [email protected]
Government of Georgia www.government.ge
Ministry of Economic Development of Georgia www.economy.ge
Georgian National Agency for Standards, Technical Regulation and Metrology www.gnims.caucasus.net
Georgian National Investment Agency www.investingeorgia.org
Department of Tourism and Resorts of Georgia www.dotr.gov.ge
Road Department of Georgia www.georoad.ge
Department of Privatization www.privatization.ge
Useful Links