ministry of education early reading - ontario · effective improvement plans ... lecture au...
TRANSCRIPT
Ministry of Education
Early ReadingA Guide to Setting Targets for Student Achievement
2 0 0 1

Introduction ......................................................................................................................................... 3
1. Understanding the Ontario Early Reading Strategy ...................................................... 4The Importance of the Strategy .......................................................................................................... 4The Targets ........................................................................................................................................ 5The Target-Setting Process................................................................................................................. 5The Accountability Cycle .................................................................................................................... 6
2. Gathering Information.............................................................................................................. 7Kinds of Data ..................................................................................................................................... 7Data on Student Achievement ............................................................................................................ 7Data on the Schools and Their Community Context ........................................................................... 10
3. Analysing Information.............................................................................................................. 11Effective Use of Data .......................................................................................................................... 11Aggregate Data................................................................................................................................... 11Data on High-Achieving Schools ........................................................................................................ 12Patterns in Data ................................................................................................................................. 12Trends ............................................................................................................................................... 13
4. Setting Targets............................................................................................................................. 14Effective Targets ................................................................................................................................. 14Evidence-Based Targets ..................................................................................................................... 14
5. Planning and Monitoring Improvements ........................................................................... 16Effective Improvement Plans.............................................................................................................. 16Strategies and Resources ................................................................................................................... 16Monitoring and Evaluation................................................................................................................. 17Reviews and Refinements................................................................................................................... 17
6. Reporting Targets and Results ............................................................................................... 18Requirements for Reporting .............................................................................................................. 18Sample Report Template.................................................................................................................... 18Requirements for Completing the Report........................................................................................... 20
Suggested Resources ....................................................................................................................... 23
Cette publication est également offerte en français sous le titre suivant : Lecture au primaire : Un guide sur l’établissement des cibles relatives au rendement des élèves.
This publication is available on the Ministry of Education’s website at http://www.edu.gov.on.ca.
ContentsContents
1


IntroductionIntroduction
The Ontario Early Reading Strategy marks the government’s commitment to ensuring that every primarystudent is an effective reader by the end of Grade 3.
Starting in the 2001–02 school year, the Early Reading Strategy requires all school boards1 in Ontario to settargets for improving the reading achievement of their students in Junior Kindergarten to Grade 3. Boardsare accountable to the Minister of Education for ensuring that the strategy is implemented in their schools.
The purpose of this guide is to assist school boards in setting targets for student achievement in reading, asrequired by the Early Reading Strategy. It offers numerous suggestions that board administrators may finduseful in setting targets at the board level and the school level. It provides advice on setting targets, onmonitoring progress, and on reporting results to the school community and the Ministry of Education.
Although reference is made to techniques for effective planning, boards are not required to follow eachspecific suggestion in this guide. In addition, boards should not regard the target-setting process as a newand separate improvement-planning activity. Boards are encouraged to integrate the target-setting processwith their other school-improvement initiatives.
The Ministry of Education continues to gather information on effective target setting that will complementand expand on the suggestions and advice contained in this guide. The ministry is also gathering the latestinformation on reading assessment instruments, reading interventions, and other topics related to theimplementation of the Early Reading Strategy. This information will be shared with boards and others as itbecomes available.
For additional resources related to data analysis, target setting, improvement planning, and resultsreporting, see “Suggested Resources” on page 23.
3
1. In this document, school boards and boards refer to district school boards and school authorities.

1. Understanding the Ontario Early Reading Strategy
1. Understanding the Ontario Early Reading Strategy
The Importance of the Strategy
Student achievement in reading is assessed by the reading portion of the Grade 3 Assessment of Reading,Writing and Mathematics – one of the province-wide assessments administered annually by the EducationQuality and Accountability Office (EQAO). In the 1999–2000 school year, only 49 per cent of Grade 3students met or exceeded the provincial standard for reading. Figure 1 shows that these results were only a slight improvement over the results of the previous two years.
Source: Assessment results, Education Quality and Accountability Office
0
10
20
30
40
50
60
70
80
90
100
Figure 1. Grade 3 students who met or exceeded the provincial standard
for reading in EQAO assessments, 1997–98 to 1999–2000
46% 44% 49%
% S
tude
nts*
School Year
1997–1998 1998–1999 1999–2000
*The denominator used in the calculation is all students in the grade.
Children who cannot read by the end of Grade 3 are more likely to fall behind in other subjects and toexperience low self-esteem. They lack a basic skill that they need to become independent learners in alldisciplines. Research shows the following:
• A student’s reading skills in Grade 3 can be a reliable indicator of the student’s academic success in later years.
• Good reading skills help students to be effective learners throughout their school years.
• Effective target setting and school improvement planning can lead to higher levels of student achievementin reading.
4

51 . U n d e r s t a n d i n g t h e O n t a r i o E a r l y R e a d i n g S t r a t e g y
The Targets
In the context of the Early Reading Strategy, a target represents the percentage of Grade 3 studentswho will meet the provincial standard for reading in the EQAO reading assessment. Boards willforecast targets for three years and update their targets annually. Each target is an informed prediction ofthe results that can be achieved by students, given the focused efforts of staff, parents, and studentsthemselves.
Targets are the means to an end, not the end itself. The ultimate goal is to improve the reading skills ofstudents so that they become successful learners throughout their school years and beyond.
The Target-Setting Process
Target setting is not new to Ontario. Some boards already follow similar practices, and they have shownthat this approach is both practical and effective. For these boards, the Early Reading Strategy provides away to build on their successes.
Target setting works best as part of regular planning to improve student achievement. An effective processinvolves the following steps in a continuing cycle:
• Gather appropriate information about student achievement and about the context of the board and itscommunity.
• Analyse the information in context – looking at individual students, groups of students, grade levels,schools, and the board – to take stock of the current situation, establish an expectation for futureachievement, and identify where improvement is needed.
• Set clear and measurable achievement targets as part of the regular school-year cycle.
• Use achievement targets to guide improvement planning. This involves:
– identifying strategies and resources to help reach the targets;
– monitoring progress towards the targets;
– refining the targets and improvement strategies on the basis of experience and results.
• Report targets and results to ensure accountability.
6 E a r l y R e a d i n g : A G u i d e t o S e t t i n g Ta r g e t s f o r S t u d e n t A c h i e v e m e n t
The Accountability Cycle
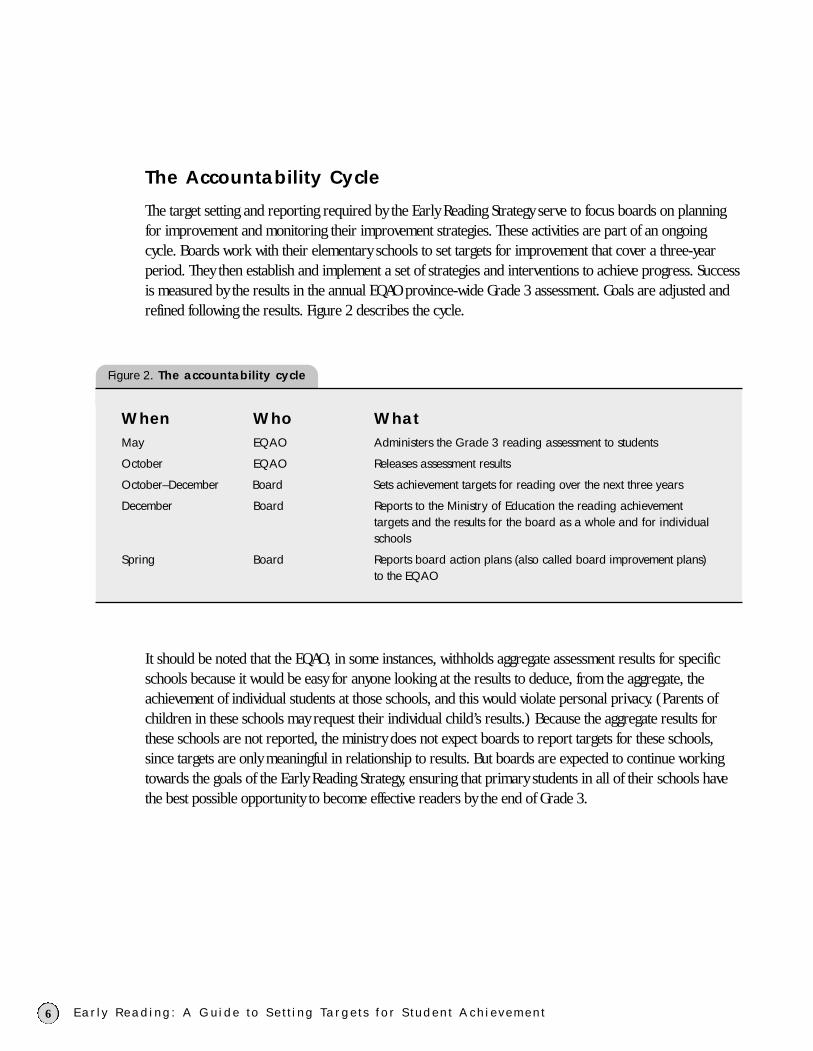
The target setting and reporting required by the Early Reading Strategy serve to focus boards on planningfor improvement and monitoring their improvement strategies. These activities are part of an ongoingcycle. Boards work with their elementary schools to set targets for improvement that cover a three-yearperiod. They then establish and implement a set of strategies and interventions to achieve progress. Successis measured by the results in the annual EQAO province-wide Grade 3 assessment. Goals are adjusted andrefined following the results. Figure 2 describes the cycle.
When Who WhatMay EQAO Administers the Grade 3 reading assessment to students
October EQAO Releases assessment results
October–December Board Sets achievement targets for reading over the next three years
December Board Reports to the Ministry of Education the reading achievementtargets and the results for the board as a whole and for individualschools
Spring Board Reports board action plans (also called board improvement plans) to the EQAO
Figure 2. The accountability cycle
It should be noted that the EQAO, in some instances, withholds aggregate assessment results for specificschools because it would be easy for anyone looking at the results to deduce, from the aggregate, theachievement of individual students at those schools, and this would violate personal privacy. (Parents ofchildren in these schools may request their individual child’s results.) Because the aggregate results forthese schools are not reported, the ministry does not expect boards to report targets for these schools,since targets are only meaningful in relationship to results. But boards are expected to continue workingtowards the goals of the Early Reading Strategy, ensuring that primary students in all of their schools havethe best possible opportunity to become effective readers by the end of Grade 3.

7
The first step in target setting is to gather information about the level of student achievement and thereasons why students are achieving at that level. Clear, reliable, specific, and regular measures can pointboards to what is working and what needs improvement.
Kinds of Data
Broadly speaking, two kinds of data can help boards set targets: (1) data on student achievement ; and (2) data on the schools and their community context. Information about student achievement isessential. Information on the schools and their community context can help boards understand otherfactors that may influence students’ level of achievement.
Data on Student Achievement
The EQAO assessment measures how well children have met the learning expectations of the elementarycurriculum.
For the purposes of the Early Reading Strategy, data may be gathered on the reading achievement levels of students in Junior Kindergarten, Kindergarten, Grade 1, and Grade 2, as well as Grade 3. Today’s JuniorKindergarten students will reach Grade 3 in a few short years. Now is the time to lay the groundwork fortheir future reading achievements.
Student achievement data is derived from three main sources: from the EQAO’s province-wide assessments;from teachers, who gather it at the classroom level; and from boards.
Province-wide assessment data
The EQAO conducts province-wide assessments to determine how well Ontario students are performing.There are four levels of achievement within the EQAO assessment, level 1 being the lowest. A student whoperforms at level 3 meets the provincial standard. Performance at level 4 surpasses the standard.
Figure 3 on page 8 shows the requirements for reading at level 3 as set out in the EQAO’s 2000–2001Grade 3 Assessment of Reading, Writing and Mathematics.
2. Gathering Information2. Gathering Information

8 E a r l y R e a d i n g : A G u i d e t o S e t t i n g Ta r g e t s f o r S t u d e n t A c h i e v e m e n t
Categories/Criteria[The student:]
Reasoning
• selects and describes relevant information usinginformation related to the text to show understanding
• interprets and analyses ideas and information fromthe text
Communication
• relates ideas from reading to [his or her] ownknowledge and experiences and to other readings
Organization of ideas
• identifies and describes different forms of text
• uses knowledge of the organizational conventionsand characteristics of different forms of writing toenhance understanding
Application of language conventions
• understands the conventions of written texts(spelling, grammar, punctuation, and style)
• identifies various conventions (spelling, grammar,punctuation, and style) of texts and explains their use
Achievement at Level 3
• demonstrates general understanding by using ideasof some complexity, beginning to make inferences,and responding with information that is consistentlyrelated to the text
• demonstrates the ability to use ideas in differentcontexts by clearly and precisely supporting themwith personal knowledge/experience
• demonstrates general understanding of differentforms of text by identifying the use of characteristicsand organizational elements of some complexity
• demonstrates general understanding of most of therequired conventions by correctly identifying andexplaining their use
Figure 3. The provincial standard for reading in Grade 3 (level 3)
Source: Education Quality and Accountability Office, Grade 3 and Grade 6 – Administration Guide for Teachers and Principals, 2000–2001
The EQAO provides individual student results of its annual Grade 3 Assessment of Reading, Writing andMathematics to parents and teachers, and it releases board-by-board and provincial results to boards, theministry, and the public. The EQAO also provides contextual data – such as a breakdown by gender – thatboards can use to interpret the results.
EQAO data can be used for target setting in at least two valuable ways:
• to establish the starting position (“How well are our Grade 3 students doing in reading?”)
• to identify, through further analysis, specific areas that need attention

92 . G a t h e r i n g I n f o r m a t i o n
Classroom data
Information gathered by teachers may be used to help predict how well students will perform on theupcoming EQAO assessment. Examples of these sources of information follow:
• Assessment instruments that teachers may use in class measure a student’s ability at a point in time. In some cases, this data may also indicate a course of action that could advance the student’s learning.The data may be summarized to describe the status across classrooms, schools, and boards.
• Tests and quizzes, developed by teachers and administered periodically, are linked to stages in thecurriculum and to the provincial levels of achievement. Results can be used to analyse reading achievementin a class and, to the extent that the tests and quizzes are standardized across a school or board, to gaugeprogress and to identify broad areas that need attention.
• Student work in portfolios and projects can be compared with student work in the reading exemplarsdeveloped by the ministry or the board. (Exemplars provide samples of student work that demonstrateachievement of the provincial expectations at levels 1 through 4.)
• Recorded observations can measure a student’s level of engagement, understanding, and participationin discussions, and the quality of a student’s responses to questions. This type of information can helpshow whether individual students’ needs are being met. It may also elaborate on why students are or arenot meeting reading expectations. Finally, it can show patterns in the classroom and point to areas thatneed attention.
• Tracking records maintained by teachers and schools could include attendance records or studentresponses to a particular unit or teaching method. These records can be linked to assessments conductedin the classroom to identify types of students who may need special attention.
• Report card marks can show individual and class progress by subject or by teaching unit.
Board data
Boards may have access to additional sources of information, such as the following:
• assessment instruments that boards may be applying systematically to measure students’ ability
• aggregate data based on teachers’ tracking records, report cards, etc.

10 E a r l y R e a d i n g : A G u i d e t o S e t t i n g Ta r g e t s f o r S t u d e n t A c h i e v e m e n t
Data on the Schools and Their Community Context
Information about the schools and their community can help boards understand the level of their students’reading achievement – why students are, or are not, making progress. It can also help boards understandthe factors that they may consider when setting achievement targets and the supports they need to improveachievement.
Examples of this contextual data include the following:
• information on students, such as:
– familiarity with English (Is English a student’s first or second language?)
– mobility, as measured by transfers in and out of the school and board
– attendance
• information on the community, such as:
– languages that are spoken in the home
– parental involvement
– average family income
Many boards have developed district (board-wide) profiles and many schools have developed school profiles.Some schools have also developed profiles at the classroom level, which allow them to draw on a range ofcontextual information such as behaviour incident reports and results of parent satisfaction surveys. All ofthis information is helpful in the target-setting exercise.

Boards can use information gathered from standardized and non-standardized sources to identify:
• current levels of achievement;
• areas that need to be addressed to improve levels of achievement;
• strategies needed to address areas of deficiency (the improvement plan);
• the likely outcome of those strategies – in other words, the level of achievement that might be expectedafter the improvement plan is appropriately implemented.
Effective Use of Data
The following guidelines are intended to help boards ensure that they have reliable data to work with and that they use it appropriately:
• Gather the data consistently, using instruments and methods that allow valid comparisons.
• Review the data regularly in order to make timely and informed decisions.
• Consider the quality of the data.
– Is the data clear, measurable, and consistent?
– What is the size of the student population (cohort) being measured? Is it large enough to make generalizations?
– How far back in time can you go to uncover trends?
• Give appropriate weight to the data. For example, give less weight to data that is not standardized or comparable.
• Avoid comparisons that don’t make sense. (Compare apples to apples and oranges to oranges.)
• Protect the privacy of individuals. Don’t publish any information that might identify children or theirfamilies, either directly or by implication.
Aggregate Data
Board and school administrators, teachers, and parents are accustomed to thinking about studentachievement at the individual level; they may be less accustomed to looking at data in an aggregated form,where the achievements of a group of students are summarized. Aggregate data can be used to track theprogress of a class, school, or cohort of students for the purposes of predicting outcomes in later gradesand identifying areas for improvement.
3. Analysing Information3. Analysing Information
11
12 E a r l y R e a d i n g : A G u i d e t o S e t t i n g Ta r g e t s f o r S t u d e n t A c h i e v e m e n t
Data on High-Achieving Schools
To be thorough when analysing data, a board may examine not only the EQAO assessment results for the board and for the province, but also the results for area schools that have similar characteristics –especially schools that demonstrate high levels of achievement. This information can offer a benchmark for target setting and can hint at strategies for achieving those targets.
Patterns in Data
Good data analysis will reveal patterns and explain why they appear. The real story is in the patterns, notthe raw numbers.
Boards can look for these patterns and analyse them to identify issues affecting groups of students. It may be that a group of students would benefit from a similar kind of intervention, and that this kind of intervention would be an important element for a classroom, grade-level, or school-wide strategy.
Boards may consider the following questions:
• Which groups of students are making slower progress than expected? For example, are achievementlevels different for boys and girls? How, and why?
• In which components of reading has student achievement risen or fallen significantly over time, and why?
• Which types of student needs are not being well met?
• What measures are in place to address the learning needs of at-risk students?

Trends
To identify trends in school performance, boards may consider the following steps:
• Graph the data. Graphed data can indicate the direction and consistency of a trend. Boards can see howclose they are to achieving their targets by putting the targets on the graph.
• Note the direction and consistency of trends. Is there a general or consistent trend in the data? Is thetrend positive, negative, or holding steady? In some cases, the data may indicate a shifting trend; forexample, the trend may hold steady for three years and then begin to move upwards.
• Be cautious about concluding that a trend exists where there are only a few data points and thechanges are small. Results often fluctuate from year to year without signifying a clear trend. Thisrandom fluctuation may occur because of measurement error – that is, inaccuracy in collecting andreporting the data. However, change that persists over several years clearly indicates a trend.
• Check for contextual forces, such as demographic changes, that may be responsible for the changes.It is tempting to conclude that an upward trend in the data is the result of the improvement strategiesthat the school implemented. However, it can be difficult to link cause and effect, since studentachievement may be influenced by a complex mix of context and practices. Similarly, a downward trendin the data may not mean that the school’s improvement strategies have failed.
The following questions may help boards investigate the factors that affect student achievement:
• What caused the trends in the data? What factors may have contributed to the results being observed?What important inputs or practices have changed?
• How have improvement strategies been implemented? If improvement strategies may have contributedto the trends, boards could review how the strategies were implemented in specific schools. Were theyimplemented in the way intended? Do all teachers understand and apply the new practices orimprovement strategies in the same way? Is the school supporting implementation of the new practicesor improvement strategies as initially planned?
• How can we be confident that the improvement strategies are working? Is there enough informationto understand the trends in the data? What additional information is needed? Is there strong evidence tosupport changing the current course of action?
133 . A n a l y s i n g I n f o r m a t i o n

Targets provide a goal. The success of improvement strategies can be measured against them, and they canhelp raise a board’s and its community’s expectations of what can be achieved.
Under the Early Reading Strategy, boards set board-wide targets for the percentage of Grade 3 students whowill meet the provincial standard over each of the next three years.
Effective Targets
Research shows that target setting is most effective when the targets are clearly expressed, specific,measurable, time-limited, and ambitious but achievable. Boards may wish to ensure that these criteria are observed when setting targets for early reading achievement.
Evidence-Based Targets
Target setting is accomplished when a board works in partnership with its community to consider all theavailable evidence – including student achievement data and data on the schools and their communitycontext – and then chooses a target that balances the ambitious with the achievable.
Figure 4 describes the target-setting process.
14
4. Setting Targets4. Setting Targets
• Using the selected assessment instrument, assess how well students in JuniorKindergarten to Grade 3 are reading now.
• Analyse all available data.
• Identify the instructional strategies and interventions to be used, tailoring themto students’ needs.
• Estimate the effect of those strategies on reading achievement levels in theschool – in particular, on the results of the EQAO Grade 3 assessment.
• Set targets based on the estimated effect of the strategies.
Figure 4. Board target-setting process

154 . S e t t i n g Ta r g e t s
The board may set its overall targets for Grade 3 reading achievement in either of the following ways:
• Set board-wide targets and direct schools towards these goals.
• Weigh the aggregate effect of individual school targets in order to determine appropriate board-wide targets.
In either case, the board must assure itself that all targets are ambitious but achievable. This assurance willcome about naturally from good communication and a high level of cooperation.
Boards may wish to address the following points:
• ways to document the progress of students who are now in Junior Kindergarten as they proceed throughthe school to Grade 3
• methods used to set targets
• ways to align targets with available resources
• measures to be used to track student progress
• communication with parents
16
5. Planning and Monitoring Improvements5. Planning and Monitoring Improvements
Targets alone will not bring about improvement. Most boards across Ontario have had several years’experience with improvement planning, and many excellent resources on improvement planning exist inthe province. Examples of improvement plans, as well as the EQAO’s Ontario Report and Guide on SchoolImprovement Planning, 1999–2000, can be downloaded from the EQAO’s website, at www.eqao.com.Additional resources are listed in “Suggested Resources”, on page 23.
Effective Improvement Plans
An effective improvement plan should consider past performance, set targets for improvement, andarticulate the strategies for meeting those targets. It could include a comprehensive review of data at alllevels and put this information in context.
Like effective targets, effective improvement plans are clearly expressed, specific, measurable, time-limited,and ambitious but achievable.
Strategies and Resources
Data gathering and analysis can reveal how well students are doing now. They can also be used to predictfuture levels of achievement. Improvement planning attempts to show how boards will cover the distancebetween the status quo and the desired level of achievement.
In trying to bridge this distance, boards could consider the following questions:
• What priority areas need to be addressed to achieve the target?
• What strategies will help students reach the target?
• Who will be responsible for ensuring that these strategies are implemented?
• What resources can be focused on making these strategies work?
• When and how will these strategies be put into effect?
• What milestones can be set, so that progress can be monitored?
• How will success at each milestone be measured?
• At what point in the process will targets, strategies, responsibilities, and resources be revised?

Monitoring and Evaluation
An essential step in the improvement process is the monitoring and evaluation of improvement strategies.Boards might ask themselves regularly if their strategies are working for students, and they can look forevidence in their student achievement data.
Monitoring and evaluation needs to occur on an ongoing basis. It involves:
• identifying the factors that are critical to success;
• gathering information on the factors that may be helping and hindering progress;
• considering the implications of the data.
Reviews and Refinements
The evidence gathered through an ongoing program of monitoring and evaluation helps boards determinewhether their targets are appropriate and whether their strategies and supports are effective. Equipped withthis information, they can review their targets and improvement goals annually and refine them for future years.
175 . P l a n n i n g a n d M o n i t o r i n g I m p r o v e m e n t s

6. Reporting Targets and Results6. Reporting Targets and Results
Accountability is central to the target-setting process. All partners in the education system – the ministry,boards, schools – demonstrate accountability by communicating regularly with the public about studentachievement, targets for improvement, and plans for reaching the targets.
Requirements for Reporting
The Early Reading Strategy requires boards to submit an annual report to the Ministry of Education showingoverall board targets and targets for each school in the board for reading achievement in Grade 3.
This reporting process complements established accountability practices, which include the following:
• Boards are required to report school-by-school assessment results to the community. They areencouraged by EQAO to submit board improvement plans (also called board action plans) to the EQAO and the community.
Sample Report Template
A sample report template for the 2001–02 school year appears in figure 5. The final layout of the reporttemplate may vary from this sample, but the information required will be the same. As the sample indicates,each year the report will include an additional year, so that targets for at least three years will be reportedat a time, as well as the previous years’ results.
More information about completing the report follows the sample template.
For a copy of the final layout of the report template, contact the appropriate Ministry of Education district office.
18

196 . R e p o r t i n g Ta r g e t s a n d R e s u l t s
PART B. Students achieving at level 3 or better (complete both methods)
PART A. This report contains:
Figure 5. Sample report template for boards
Report of Grade 3 Reading Assessment Targets and Results for 2001–02
❏ Board overall targets and results for _ _ _ _ _ _ _ _ _ _ _ _ _ _ _ _ _ _ _ _ _ _ _ _ _ _ _ _ _ _ _ _ _ _ _ _ _ _ _ _ _ _ _ _ _ _ _ _ _ _ _ _ _ _ _ _ _ _ _ _ _ _ _ _ _ _ _ _ _ _ _ _ _ _ _ _ _ _ _ _ [Name of board or school authority]
or
❏ School targets and results for _ _ _ _ _ _ _ _ _ _ _ _ _ _ _ _ _ _ _ _ _ _ _ _ _ _ _ _ _ _ _ _ _ _ _ _ _ _ _ _ _ _ _ _ _ _ _ _ _ _ _ _ _ _ _ _ _ _ _ _ _ _ _ _ _ _ _ [Name of school]
DIFFERENCE
Method 1 Method 2
based onGrade 3 students eligible to participate
(total enrolment for Grade 3)
based onGrade 3 students actually
participating/likely to participate(excluding absences, exemptions, and deferrals)
Schoolyear
ending
2001
2002
2003
2004
#
Total%
#
Total% % %
#
Total%
#
Total%
DIFFERENCETARGET TARGETACTUAL ACTUAL
Please specify:• Number of schools in the board that offer JK to Grade 3 _ _ _ _ _ _ _ _ _ _ _ _ _ _ _ _ _ _ _ _ _ _ _ _ _ _ _ _ _ _ _ _ _ _ _ _ _ _ _ _ _ _ _ _ • Number of schools for which EQAO data is withheld from public
release, according to EQAO rules _ _ _ _ _ _ _ _ _ _ _ _ _ _ _ _ _ _ _ _ _ _ _ _ _ _ _ _ _ _ _ _ _ _ _ _ _ _ _ _ _ _ _ _ _ _ _ _ _ _ _ _ _ _ _ _ _ _ _ _ _ _ _ _ _ _

20 E a r l y R e a d i n g : A G u i d e t o S e t t i n g Ta r g e t s f o r S t u d e n t A c h i e v e m e n t
Requirements for Completing the Report
EQAO assessment results are an important source of information for improvement planning. However,when analysing assessment data and drawing conclusions from it, boards need to take into considerationthe participation rate of their students in the EQAO assessment. Because of the importance of thisinformation, boards are asked to express their achievement targets in two ways, using two methods. These methods correspond to the two methods used by the EQAO in reporting its assessment results.
• Method 1 expresses the target as a fraction or percentage of the total number of students eligibleto participate in the Grade 3 assessment in a given year – in other words, the projected Grade 3enrolment.
• Method 2 expresses the target as a fraction or percentage of the total number of students likely toparticipate in the assessment. This number excludes students who are projected to be absent, deferred,or exempt.
The steps for both Method 1 and Method 2 are given below. (Note that boards are asked to state their targetsin two ways: as the number of students and the percentage of students achieving the provincial standard.)
Method 1 Method 2
1. Report actual results from the previousyear. To do this, boards will need:
• the number of students who achieved level 3 orhigher in reading in the previous year
• the total enrolment for Grade 3 at the time ofthe assessment, including those who were exemptand those who took part in the assessment but didnot produce enough work to score
Enter the actual achievement as a fraction of the totalenrolment in the Actual # column and as a percentageof the total in the Actual % column.
1. Report actual results from the previousyear. To do this, boards will need:
• the number of students who achieved level 3 orhigher in reading in the previous year
• the total number of students participating– that is, the number of students who actually participated in the assessment, excluding thosewho were exempt and those who took part in the assessment but did not produce enough work to score
Enter the actual achievement as a fraction of the par-ticipants in the Actual # column and as a percentageof the participants in the Actual % column.

216 . R e p o r t i n g Ta r g e t s a n d R e s u l t s
Method 1 (cont.) Method 2 (cont.)
2. Calculate the difference between the targetedpercentage and the actual percentage of studentswho achieved level 3 in the previous year. (Thiscalculation cannot be made for 2001, becauseschools will not have targets for the previous year.Start calculating the difference in 2002.)
Enter the difference in the Difference % column.
2. Calculate the difference in the same way as Method 1.
3. Forecast the total enrolment for Grade 3for each of the coming three years. To do this,schools will need actual enrolment numbers fromearlier grades. For example, to forecast the numberof students who will be eligible to participate in the Grade 3 assessment in 2003, use Grade 1enrolment for 2001.
3. Forecast the total number of studentswho are likely to participate in the EQAOassessment for each of the coming three years. Todo this, use the enrolment forecasts obtained inMethod 1 and multiply each year’s forecast by theaverage participation rate for students in allprevious years of the EQAO assessment. (Theparticipation rate is the number of students whoparticipated in the test as a percentage of the total enrolment.)
To calculate the average participation rate,add up the rates (percentages) from all the previousyears of the EQAO Grade 3 assessment and divideby the number of years.
For example, for 2001–2002:
Participation rate for 1997 –1998
Participation rate for 1998 –1999
Participation rate for 1999 –2000
+ Participation rate for 2000 –2001
Sum of participation rates for all years
Sum of participation rates ÷ number of years =average participation rate
To calculate the forecast for the total number ofstudents likely to participate in future years,multiply the total enrolment from Method 1 by the average participation rate. Do this foreach of the coming three years.
22 E a r l y R e a d i n g : A G u i d e t o S e t t i n g Ta r g e t s f o r S t u d e n t A c h i e v e m e n t
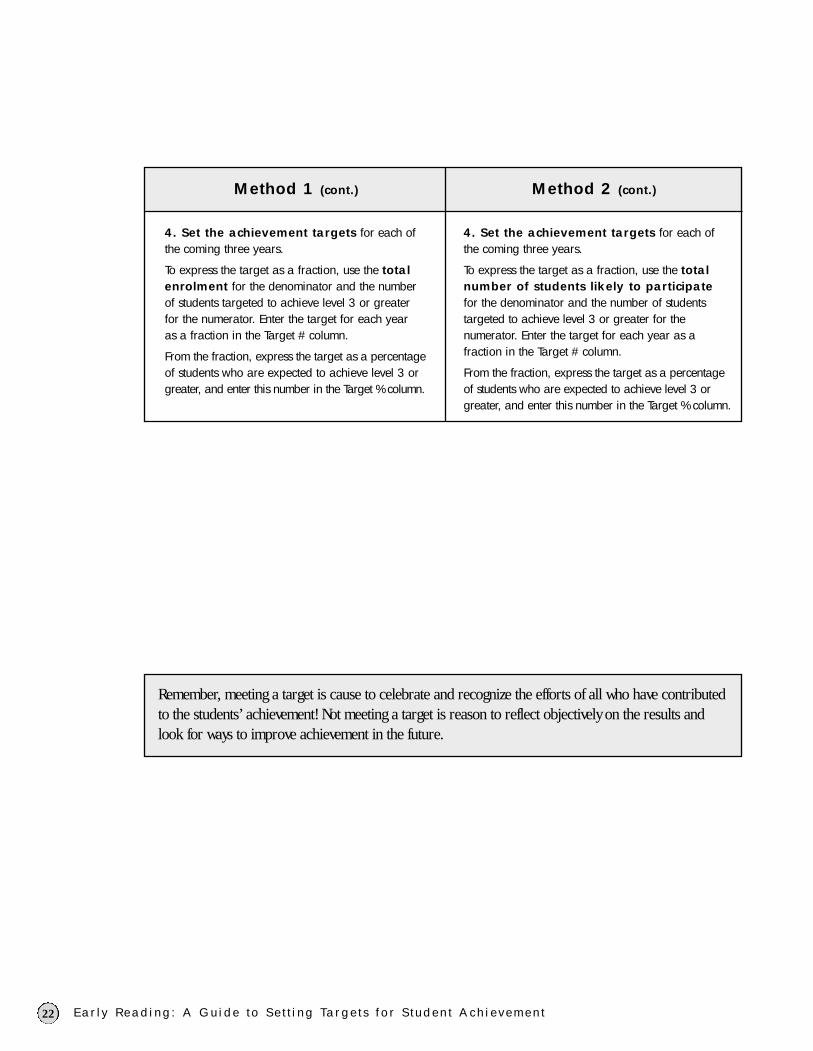
Method 1 (cont.) Method 2 (cont.)
4. Set the achievement targets for each of the coming three years.
To express the target as a fraction, use the totalenrolment for the denominator and the numberof students targeted to achieve level 3 or greater for the numerator. Enter the target for each year as a fraction in the Target # column.
From the fraction, express the target as a percentageof students who are expected to achieve level 3 orgreater, and enter this number in the Target % column.
4. Set the achievement targets for each of the coming three years.
To express the target as a fraction, use the totalnumber of students likely to participatefor the denominator and the number of studentstargeted to achieve level 3 or greater for the numerator. Enter the target for each year as a fraction in the Target # column.
From the fraction, express the target as a percentage of students who are expected to achieve level 3 orgreater, and enter this number in the Target % column.
Remember, meeting a target is cause to celebrate and recognize the efforts of all who have contributedto the students’ achievement! Not meeting a target is reason to reflect objectively on the results andlook for ways to improve achievement in the future.

23
Alberta Learning. Guide for School Board Planning and Results Reporting. Edmonton: Alberta Learning, 2000.
Auger, R., et Séguin, S. P. Mesure et évaluation des apprentissages. Série de 6 modules. Montréal :LABFORM, Département des sciences de l’éducation, Université du Québec à Montréal, 1999.
Earl, Lorna; Fullan, Michael; Leithwood, Kenneth; and Watson, Nancy; with Jantzi, Doris; Levin, Ben; andTorrance, Nancy. Watching & Learning: OISE/UT Evaluation of the Implementation of the NationalLiteracy and Numeracy Strategies: First Annual Report. Toronto: Ontario Institute for Studies inEducation/University of Toronto, 2000.
Elmore, Richard F. Building a New Structure for School Leadership. Washington, D.C.: Albert ShankerInstitute, 2000.
Gaudreau, Louise. Évaluer pour évoluer : les indicateurs et les critères. Outremont, Que. : ÉditionsLogiques, 2001.
Great Britain. Scottish Office. Inspectors of Schools. Audit Unit. A Route to Equality and Fairness: Self-Evaluation Using Performance Indicators. Edinburgh: Scottish Office, 1999.
Khanna, Ritu; Trousdale, Donna; Penuel, William R.; and Kell, Judy. “Supporting Data Use AmongAdministrators: Results From a Data Planning Model.” Paper presented at the Annual Meeting of the American Educational Research Association, Montreal, 19–23 April 1999.
Levesque, Karen; Bradby, Denise; Rossi, Kristi; and Teitelbaum, Peter. At Your Fingertips: Using EverydayData to Improve Schools. Berkeley, Calif.: MPR Associates; National Center for Research in VocationalEducation, 1998.
Northern Ireland. Department of Education. School Improvement, The Northern Ireland Programme. Target Setting: Guidance for Primary Schools. Belfast: H.M. Stationery Office, 1998.
Ontario. Education Improvement Commission. School Improvement Planning: A Handbook forPrincipals, Teachers, and School Councils. Toronto: the Commission, 2000.
Ontario. Education Quality and Accountability Office. Ontario Report and Guide on School ImprovementPlanning, 1999–2000. Toronto: the Office, 2000.
Québec. Conseil supérieur de l’éducation. L’évaluation institutionnelle en éducation : une dynamiquepropice au développement. Québec: le Conseil, 1999.
Schmoker, Michael J. Results: The Key to Continuous School Improvement. 2nd ed. Alexandria, Va.:Association for Supervision and Curriculum Development, 1999.
Suggested ResourcesSuggested Resources

Printed on recycled paper
ISBN 0-7794-1869-7
01-165
© Queen’s Printer for Ontario, 2001