ministry of works, transport and ... - … · tanroads tanzania national roads agency . 1 chapter...
TRANSCRIPT

THE UNITED REPUBLIC OF TANZANIA
MINISTRY OF WORKS, TRANSPORT AND COMMUNICATION
(TRANSPORT SECTOR)
TRANSPORT AND METEOROLOGY SECTOR STATISTICS
DECEMBER 2016

ii

iii
TABLE OF CONTENTS
FOREWORD .................................................................................................................................... iv
LIST OF ABBREVIATIONS ........................................................................................................... v
CHAPTER ONE ................................................................................................................................ 1
1.0 INTRODUCTION .................................................................................................................. 1
CHAPTER TWO ............................................................................................................................... 2
2.0 BASIC BACKGROUND DATA ........................................................................................... 2
CHAPTER THREE .......................................................................................................................... 8
3.0 ROAD TRANSPORT ............................................................................................................. 8
CHAPTER FOUR ........................................................................................................................... 16
4.0 RAILWAY INFRASTRUCTURE AND SERVICES ....................................................... 16
CHAPTER FIVE ............................................................................................................................. 20
5.0 PORTS INFRASTRUCTURE AND SERVICES .............................................................. 20
CHAPTER SIX ................................................................................................................................ 33
6.0 INLAND WATER TRANSPORT SERVICES .................................................................. 33
CHAPTER SEVEN ......................................................................................................................... 36
7.0 AIR TRANSPORT INFRASTRUCTURE AND SERVICES .......................................... 36
7.1 Summary of TCAA Statistics .............................................................................................. 36
7.2 Summary of TAA Statistics ................................................................................................. 41
CHAPTER EIGHT ......................................................................................................................... 43
8.0 METEOROLOGICAL INFORMATION .......................................................................... 43
CHAPTER NINE ............................................................................................................................ 46
9.0 TRAINNING INSTITUTIONS ........................................................................................... 46

iv
FOREWORD
Transport is an essential prerequisite for economic growth. It facilitates domestic and international trade;
increases access to markets and links local, regional, national and international markets; alleviates
regional inequality and fosters national integration; and provides access to employment, health,
education and other essential services. The availability and reliability of transport services contribute to
the successful implementation of socio-economic activities, lowering domestic production costs,
enhancing economies of scale in the production process, creating economic opportunities and realisation
of a country’s comparative advantages.
The theme for the Second Five Year Development Plan (2016/17- 2020/21) is “Nurturing
Industrialization for Economic Transformation and Human Development” with the main objective of
enhancing progress towards the Development Vision 2025 goals. Transport sector is a principal agent
for realization of industrialization.
In order for the Transport Sector to play its rightful role in facilitating development of other social and
economic sectors, need for disseminating appropriate transport data and information need not to be
overemphasized. Such information is prerequisite for policy formulation, strategic planning, and in
undertaking monitoring and evaluation process.
In view of the above, the Ministry of Works, Transport and Communication (Transport Sector) has
prepared annual Transport and Meteorology Sector Statistics for the year 2016 in collaboration with key
ministries, departments, authorities and agencies including the National Bureau of Statistics mandated
for provision of official statistics to the Government, business community and the public at large.
Views, comments and feedback with the intention of adding value to this document and assist in
improving the publications are invited and shall be considered in the subsequent publications.
Dr. Leonard M. Chamuriho
PERMANENT SECRETARY - TRANSPORT

v
LIST OF ABBREVIATIONS
DMI Dar es Salaam Maritime Institute
GDP Gross National Product
HQ Head Quarter
JNIA Julius Nyerere International Airport
KIA Kilimanjaro International Airport
MSCL Marine Services Company Limited
MoT Ministry of Transport
MoW Ministry of Works
MSCL Marine Services Company Ltd
NBS National Bureau of Statistics
NIT National Institute of Transport
PMO RALG Prime Ministers’ Office–Regional Administration & Local Government
SUMATRA Surface and Marine Transport Regulation Authority
TPA Tanzania Ports Authority
TRL Tanzania Railway Limited
TCAA Tanzania Civil Aviations Authority
TAA Tanzania Airports Authority
RAHCO Rail Assets Handling Company
TAZARA Tanzania Zambia Railway
TMA Tanzania Meteorological Agency
TRA Tanzania Revenue Authority
TANROADS Tanzania National Roads Agency

1
CHAPTER ONE
1.0 INTRODUCTION
Transport sector has a vital contribution to the development of economy, therefore correct and well
organized statistics is important in the process of facilitating planning, monitoring and evaluating of
performance for the sector. This Transport and Meteorology statistics publication serves as a brief and
comprehensive reference for transport and meteorology services. It covers basic data and information
from transport subsectors, of road, rail, maritime, air transport and Meteorological sector.
Analysis of data in this document has been presented in a simple way that enhances users a quick visual
interpretation and reference, the analysis includes charts and histogram that shows trends and behavior
of transport sector over time.
Inputs have been obtained from various stakeholders, Institutions/Agencies intersecting the Transport
Sector activities in Tanzania. These Agencies/Institutions includes President’s Office – Regional
Administration and Local Government (PO-RALG), Ministry of Works (MoW) Surface and Maritime
Transport Regulatory Authority (SUMATRA), Tanzania Ports Authority (TPA), Tanzania Railway
Limited (TRL), Tanzania Civil Aviation’s Authority (TCAA), Tanzania Airports’ Authority (TAA),
Tanzania Zambia Railway (TAZARA), Marine Services Company Limited (MSCL), Tanzania
Metrological Agency (TMA), Dar es Salaam Maritime Institute (DMI), National Institute of Transport
(NIT), Tanzania Revenue Authority (TRA), TANROADS and Traffic Police (HQ).
The document has nine chapters; first being Introductory part, second is the background of transport
sector, third to nine chapters presenting road, rail, port, inland water transport, air transport,
meteorology services and training institutions consecutively.

2
CHAPTER TWO
2.0 BASIC BACKGROUND DATA
Table 2.1: Data Describing Tanzania, 2016
S/N PARTICULAR DATA/INFORMATION
1. Location East Coast of Africa between latitudes 10S and 120s and between
longitudes 290E and 410E
2. Share border
Kenya and Uganda to the North, Rwanda, Burundi and Democratic
Republic of Congo to the West and Zambia, Malawi to the South
West and Mozambique to the South.
3.
Total area of
Tanzania(000 Sq.
Km)
947.3km2 of which 61.5 km2 is water representing a part of Lakes
Victoria, Tanganyika Nyasa, Rukwa, Eyasi and several other smaller
lakes, rivers and sea whereas landmass is 885.8 km2
4. Capital City Dodoma
5. Commercial City Dar es Salaam with projected population of 4.9 million.
6. Number of
Regions
26 regions in Tanzania Mainland and 5 regions in Zanzibar (i.e 30
regions)
7. Rainfall 203.2 – 2224.1 mm per year
8.
Tanzania
Population
(Projected)
50.9 million people (2016)
9.
Other major
regions with their
projected
population (000)
Mwanza (3,259,243), Mbeya (1,942,898), Arusha (1,896359),
Tanga(2,233,307)
10.
Estimated
Average
Population
Density of the
Country
58 Inhabitants per square kilometer (inh/km2)
11.
Extremes of
average
population density
of the country
Dar es Salaam about 3,507 inhabitants/km2 to 14 inhabitants/km2 in
Lindi Region.
12. GDP at current
Market Prices Tshs 52,762,581 millions (2016)
13. GDP Growth rate 7.0% (2016)
14. Transport 11.8 % (2016)
15.
Mining and
Quarrying growth
rate
11.5% (2016)
16.
Hotels and
Restaurants
growth rate
3.7% (2016)
17. Classified Road
Network 87,663.62Km as per Road Act 2007
18. Railway Network Total Railway Network 3,682Km. TRL 2,707Km (with 1m gauge),

3
S/N PARTICULAR DATA/INFORMATION
TAZARA 975 Km (Tz section) with1.067m gauge.
18. International
Airports JNIA, KIA, Aman Abeid Karume(AAKIA)
20. Aerodromes
Network
There are more than 368 airports in Tanzania including airstrips
serving domestic and international traffic. The government manages
59 of them.
21. Ports Network
There are 3 major seaports namely DSM, Mtwara and Tanga, and
other small seaports at Kilwa, Lindi, Mafia, Pangani and Bagamoyo.
There are also major Inland Water Ways ports at Kigoma, Mwanza,
Bukoba, Musoma and Mbeya (Itungi)
22. Major Mountains Mt Kilimanjaro, Mt Rungwe and Mt Meru
23. Major Lakes Lake Victoria, Lake Tanganyika and Lake Nyasa
24. Major Rivers
KAGERA, RUVUMA, RUFIJI
Source: MWTC.
Table 2.2: SHARES OF GROSS DOMESTIC PRODUCT BY KIND OF ECONOMIC
ACTIVITY (at current prices)
ECONOMIC ACTIVITY 2010 2011 2012 2013 2014 2015 2016
A
Agriculture, forestry and
fishing 29.9 29.4 31.1 31.2 28.9
29.0
29.1
Crops 16.6 16.5 18.0 17.5 16.2 15.6 15.5
Livestock 9.1 8.7 8.5 8.2 7.4 7.9 7.7
Forestry 2.2 2.2 2.5 3.1 3.1 3.5 3.9
Fishing 2.1 2.1 2.2 2.4 2.2 2.1 2.0
B Mining and quarrying 4.1 5.1 4.9 4.2 3.7 4.0 4.8
C Manufacturing 6.9 7.6 7.5 6.4 5.6 5.2 5.1
D Electricity supply 0.9 0.6 0.9 0.8 0.8 1.0 0.9
E
Water supply; sewerage,
waste management 0.6 0.5 0.4 0.5 0.5
0.4
0.4
F Construction 7.8 9.0 8.1 10.8 12.5 13.6 14.0
G
Wholesale and retail trade;
repairs 10.1 10.6 10.4 10.2 10.5
10.7
10.7
H Transport and storage 5.8 5.2 4.4 4.2 4.3 4.3 4.3
I
Accommodation and Food
Services 1.6 1.4 1.4 1.3 1.1
1.1
1.0
J
Information and
communication 2.6 2.4 2.4 2.3 2.1
2.0
2.0
K
Financial and insurance
activities 3.2 3.4 3.4 3.3 3.4
3.6
3.6
L Real estate 4.6 4.3 4.3 3.8 3.7 3.2 3.0
M
Professional, scientific and
technical activities 1.7 1.5 1.3 1.3 1.3
1.2
1.2
N
Administrative and support
service activities 2.2 2.1 2.3 2.4 2.5
2.4
2.2
O
Public administration and
defense 6.1 6.3 6.5 7.0 6.6
6.4
6.3

4
ECONOMIC ACTIVITY 2010 2011 2012 2013 2014 2015 2016
P Education 3.1 2.8 2.6 2.7 2.7 2.5 2.3
Q
Human health and social
work activities 1.7 1.6 1.5 1.4 1.5
1.4
1.4
R
Arts, entertainment and
recreation 0.3 0.3 0.3 0.3 0.3
0.3
0.3
S Other service activities 0.8 0.8 0.8 0.8 0.8 0.8 0.7
T
Activities of households as
employers; 0.3 0.2 0.2 0.2 0.2
0.2
0.2
X FISIM -0.9 -1.1 -1.0 -1.2 -1.0 -1.1 -1.0
All economic activities 93.6 93.8 93.7 93.7 91.9 92.2 92.2
Taxes on products 6.4 6.2 6.3 6.3 8.1 7.8 7.8
GDP at market prices 100 100 100 100 100 100 100
Source: NBS
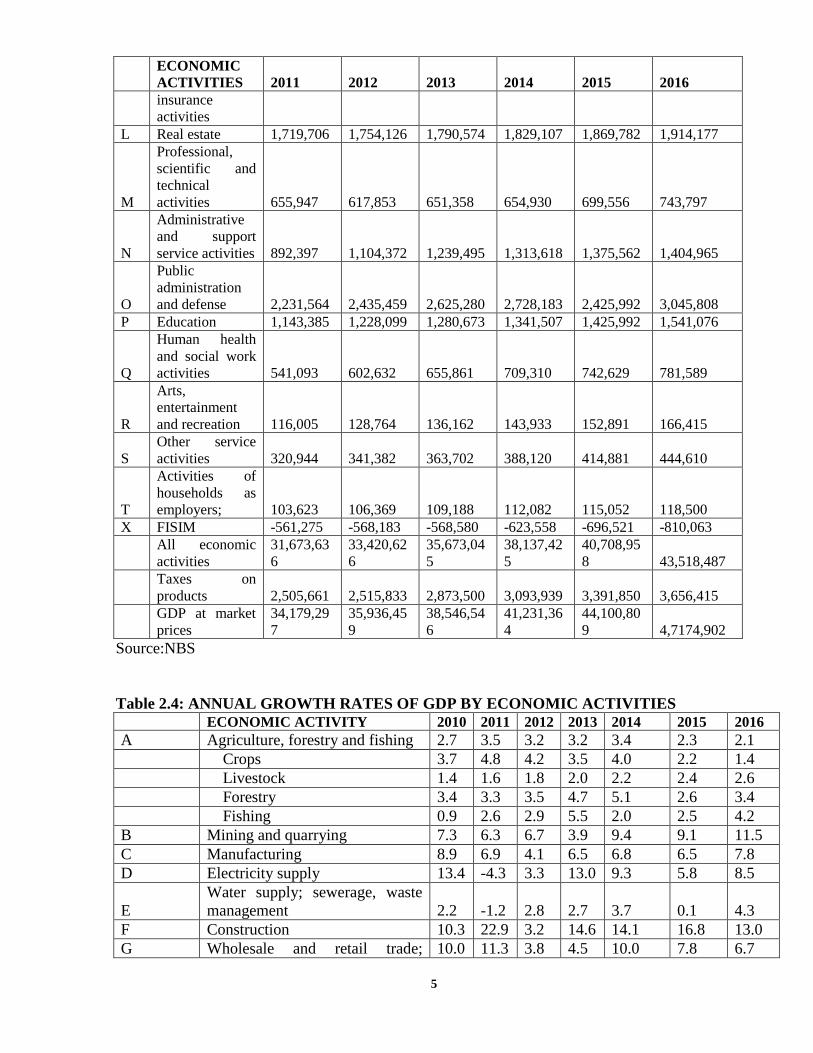
TABLE 2.3: GROWTH DOMESTIC PRODUCTS AT 2007 PRICES BY ECONOMIC
ACTIVITIES
ECONOMIC
ACTIVITIES 2011 2012 2013 2014 2015 2016
A
Agriculture,
forestry and
fishing 8,621,829 8,901,917 9,186,731 9,497,468 9,719,965 9,924,182
Crops 4,454,219 4,640,787 4,801,783 4,993,855 5,106,027 5,175,489
Livestock 2,948,017 3,001,944 3,062,481 3,129,647 3,204,928 3,287,499
Forestry 745,684 771,590 808,231 849,445 871,448 901,161
Fishing 473,910 487,597 514,235 524,521 537,562 560,033
Industry and
Construction 7,271,804 7,566,057 8,287,309 9,144,464
10,174,15
6 11,265,872
B
Mining and
quarrying 1,141,798 1,217,823 1,264,845 1,383,349 1,508,923 1,682,719
C Manufacturing 2,554,119 2,659,200 2,831,400 3,024,323 3,222,077 3,472,647
D
Electricity
supply 284,394 293,804 332,080 363,110 384,271 416,904
E
Water supply;
sewerage, waste
management 260,050 267,407 274,507 284,755 285,003 297,151
F Construction 3,031,443 3,127,824 3,584,477 4,088,927 4,773,882 5,396,450
Services
16,341,27
8
17,520,83
5
18,767,58
5
20,119,05
1
21,511,35
8 2,313,496
G
Wholesale and
retail trade;
repairs 3,541,265 3,675,197 3,839,852 4,223,837 4,552,422 4,855,513
H
Transport and
storage 1,980,177 2,062,518 2,314,221 2,603,499 2,810,378 3,140,748
I
Accommodation
and Food
Services 543,173 579,598 595,724 609,111 622,966 646,197
J
Information and
communication 1,177,462 1,439,326 1,631,263 1,762,116 1,974,819 2,231,111
K Financial and 1,374,537 1,445,140 1,534,231 1,699,700 1,900,297 2,103,991
5
ECONOMIC
ACTIVITIES 2011 2012 2013 2014 2015 2016
insurance
activities
L Real estate 1,719,706 1,754,126 1,790,574 1,829,107 1,869,782 1,914,177
M
Professional,
scientific and
technical
activities 655,947 617,853 651,358 654,930 699,556 743,797
N
Administrative
and support
service activities 892,397 1,104,372 1,239,495 1,313,618 1,375,562 1,404,965
O
Public
administration
and defense 2,231,564 2,435,459 2,625,280 2,728,183 2,425,992 3,045,808
P Education 1,143,385 1,228,099 1,280,673 1,341,507 1,425,992 1,541,076
Q
Human health
and social work
activities 541,093 602,632 655,861 709,310 742,629 781,589
R
Arts,
entertainment
and recreation 116,005 128,764 136,162 143,933 152,891 166,415
S
Other service
activities 320,944 341,382 363,702 388,120 414,881 444,610
T
Activities of
households as
employers; 103,623 106,369 109,188 112,082 115,052 118,500
X FISIM -561,275 -568,183 -568,580 -623,558 -696,521 -810,063
All economic
activities
31,673,63
6
33,420,62
6
35,673,04
5
38,137,42
5
40,708,95
8 43,518,487
Taxes on
products 2,505,661 2,515,833 2,873,500 3,093,939 3,391,850 3,656,415
GDP at market
prices
34,179,29
7
35,936,45
9
38,546,54
6
41,231,36
4
44,100,80
9 4,7174,902
Source:NBS
Table 2.4: ANNUAL GROWTH RATES OF GDP BY ECONOMIC ACTIVITIES ECONOMIC ACTIVITY 2010 2011 2012 2013 2014 2015 2016
A Agriculture, forestry and fishing 2.7 3.5 3.2 3.2 3.4 2.3 2.1
Crops 3.7 4.8 4.2 3.5 4.0 2.2 1.4
Livestock 1.4 1.6 1.8 2.0 2.2 2.4 2.6
Forestry 3.4 3.3 3.5 4.7 5.1 2.6 3.4
Fishing 0.9 2.6 2.9 5.5 2.0 2.5 4.2
B Mining and quarrying 7.3 6.3 6.7 3.9 9.4 9.1 11.5
C Manufacturing 8.9 6.9 4.1 6.5 6.8 6.5 7.8
D Electricity supply 13.4 -4.3 3.3 13.0 9.3 5.8 8.5
E
Water supply; sewerage, waste
management 2.2 -1.2 2.8 2.7 3.7 0.1 4.3
F Construction 10.3 22.9 3.2 14.6 14.1 16.8 13.0
G Wholesale and retail trade; 10.0 11.3 3.8 4.5 10.0 7.8 6.7

6
ECONOMIC ACTIVITY 2010 2011 2012 2013 2014 2015 2016
repairs
H Transport and storage 10.7 4.4 4.2 12.2 12.5 7.9 11.8
I
Accommodation and Food
Services 3.7 4.1 6.7 2.8 2.2 2.3 3.7
J Information and communication 24.4 8.6 22.2 13.3 8.0 12.1 13.0
K Financial and insurance activities 12.6 14.8 5.1 6.2 10.8 11.8 10.7
L Real estate 1.8 1.9 2.0 2.1 2.2 2.2 2.4
M
Professional, scientific and
technical activities 29.9 4.8 -5.8 5.4 0.5 6.8 6.3
N
Administrative and support
service activities 8.6 5.1 23.8 12.2 6.0 4.7 2.1
O
Public administration and
defense -5.0 15.9 9.1 7.8 3.9 4.6 6.7
P Education 6.4 5.6 7.4 4.3 4.8 6.3 8.1
Q
Human health and social work
activities 3.3 5.3 11.4 8.8 8.1 4.7 5.2
R
Arts, entertainment and
recreation 7.3 7.7 11.0 5.7 5.7 6.2 8.8
S Other service activities 6.0 6.2 6.4 6.5 6.7 6.9 7.2
T
Activities of households as
employers; 2.7 2.7 2.7 2.7 2.7 2.7 3.0
X FISIM 7.9 22.6 1.2 0.1 9.7 11.7 16.3
All economic activities 6.6 7.6 5.5 6.7 6.9 6.7 6.9
Taxes on products 3.8 12.1 0.4 14.2 7.7 9.6 7.8
GDP at market prices 6.4 7.9 5.1 7.3 7.0 7.0 7.0
Source: NBS
Table 2.5 GROWTH DOMESTIC PRODUCT (MONETARY AND NON-MONETARY) –
ANNUAL GROWTH RATES ECONOMIC ACTIVITY 2010 2011 2012 2013 2014 2015 2016
A: Monetary
Gross Domestic Product at market price
A Agriculture, forestry and fishing 3.4 1.9 3.2 4.0 3.4 3.2 1.9
Crops 5.8 2.8 4.2 5.0 3.2 3.3 0.6
Livestock 1.2 0.1 1.8 2.2 3.6 3.9 2.8
Forestry 3.4 3.3 3.5 4.7 5.1 1.0 3.6
Fishing 0.9 2.7 2.9 5.5 2.0 2.6 4.2
B Mining and quarrying 7.3 6.3 6.7 3.9 9.4 9.1 11.5
C Manufacturing 8.9 6.9 4.1 6.5 6.8 6.5 7.8
D Electricity supply 13.4 -4.3 3.3 13.0 9.3 5.8 8.5
E
Water supply; sewerage, waste
management 3.6 -1.2 2.8 2.7 3.7 -1.3 4.8
F Construction 10.3 21.9 3.3 13.9 15.9 16.8 14.1
G
Wholesale and retail trade;
repairs 10.0 11.3 3.8 4.5 10.0 7.8 6.7
H Transport and storage 10.7 4.4 4.2 12.2 12.5 7.9 11.8

7
ECONOMIC ACTIVITY 2010 2011 2012 2013 2014 2015 2016
I
accommodation and Food
Services 3.7 4.1 6.7 2.8 2.2 2.3 3.7
J Information and communication 24.4 8.6 22.2 13.3 8.0 12.1 13.0
K Financial and insurance activities 12.6 14.8 5.1 6.2 10.8 11.8 10.7
L Real estate 1.9 2.0 2.1 2.2 2.2 2.3 2.4
M
Professional, scientific and
technical activities 29.9 4.8 -5.8 5.4 0.5 6.8 6.3
N
Administrative and support
service activities 8.6 5.1 23.8 12.2 6.0 4.7 2.1
O
Public administration and
defense -5.0 15.9 9.1 7.8 3.9 4.6 6.7
P Education 6.4 5.6 7.4 4.3 4.8 6.3 8.1
Q
Human health and social work
activities 3.3 5.3 11.4 8.8 8.1 4.7 5.2
R
Arts, entertainment and
recreation 7.3 7.7 11.0 5.7 5.7 6.2 8.8
S Other service activities 6.0 6.2 6.4 6.5 6.7 6.9 7.2
T
Activities of households as
employers; 2.7 2.7 2.7 2.7 2.7 2.7 3.0
X FISIM 7.9 22.6 1.2 0.1 9.7 11.7 16.3
All economic activities 7.2 7.5 5.8 7.1 7.3 7.2 7.3
Taxes on products 3.8 12.1 0.4 14.2 7.7 9.6 7.8
B: Non- Monetary
Gross Domestic Product at
market price 2.2 8.4 3.2 3.8 3.5 3.1 3.2
A Agriculture, forestry and fishing 1.4 6.4 3.4 1.7 3.4 0.7 2.4
Crops 0.7 7.8 4.2 1.3 5.2 0.8 2.4
Livestock 2.0 4.7 1.8 1.7 -0.5 -0.7 2.2
Forestry 3.4 3.3 3.5 4.7 5.1 5.6 3.0
Fishing 0.9 -0.6 2.9 4.9 2.0 -0.7 2.7
E
Water supply; sewerage, waste
management -1.1 -1.2 2.8 2.7 3.7 3.4 3.0
F Construction 10.4 28.3 2.8 18.4 4.9 16.4 7.1
L Real estate 0.1 0.2 0.3 0.4 0.5 1.5 1.7
GDP at market prices 6.4 7.9 5.1 7.3 7.0 7.0 7.0

8
CHAPTER THREE
3.0 ROAD TRANSPORT
Table 3.1: Road Network Length of Tanzania (km) as of December, 2016
S/No
Category Road Type Km Length
(%)
1
.
National
Roads
Trunk Roads Paved 7,753
Unpaved 5,033
Regional
Roads
Paved 1,398
Unpaved 20,816
TOTAL NATIONAL ROADS(A) 35,000
2
.
Local Roads District
Paved 131.21
Unpaved 27,697.86
Urban
Paved 818.32
Unpaved 5,245.21
Feeder Paved 38.10
Unpaved 18,732.92
TOTAL LOCAL ROADS(B) 52,663.62
Tanzania Total Roads Network(A+B) 87,663.62 100
Source: PORALG /TANROADS
Chart 3.1 Road Network Length of Tanzania (%)

9
Table 3.2: Trunk and Regional Road Network as of December, 2016
Category Paved (Km) Unpaved (Km) Total (Km) percentage paved(km)
out of Total National
Road
Trunk Roads 7,753 5,033 12,786 22
Regional Roads 1,398 20,816 22,214
4
Total 9,151
25,849
35,000 26
Source: TANROADS
Table 3.3: Condition of Trunk and Regional Roads as of December, 2016
TYPE
Condition Total KM
Good Fair Poor Total
km % km % km % km %
Trunk Paved 496 52 207 22 254 27 957 100
Regional Paved 4893 76 899 14 637 10 6429 100
Trunk Unpaved 5172 27 10956 57 3100 16 19228 100
Regional Unpaved 1264 40 1,476 47 415 13 3155 100
Total 11825 40 13538 45 4408 15 29769 100
Source: TANROADS
Table 3.4: Condition of Trunk and Regional Roads (2011 – 2016)
Source: TANROADS
Year Good Fair Poor Total
(km) (%) (km) (%) (km) (%) (km) (%)
2011 13,556.4 40 15,589.8 46 4,744.7 14 33,891 100
2012
11,536
37
14,780
48
4,778
15
31,193
100
2013
11,612 37 16,346 52 3,536 11 31 ,494 100
2014 11,219 35 17,199 54 3,513 11 31,930 100
2015 11,330 36 15,627 50 4,408 14 31,366 100
2016 12,388 41 13,642 45 4,235 14 30,265 100

10
Table 3.5: Condition of Local Government Roads as of December, 2016
Good Fair Poor Total
Road
Type (km) (%)
(km) (%) (km) (%)
(km) (%)
DISTRICT ROADS
Paved 201.96 1.41 29.30 0.19 16.00 0.108771 247.26 0.6
Unpaved 14160.81 98.59 15,521 99.81 14,693.76 99.89123 44,375.64 99.4
Sub
Total 14,362.77 100 15,550.37 99.99 14,709.76 100 44,622.90 100
URBAN ROADS
Paved 747.82 17.31 224.82 3.40 107.46 1,080.10 1,080.10 6.2
Unpaved 3,571.18 82.69 6,387.03 96.59 6,310.56 16,268.77 16,268.77 93.8
Sub
Total 4,319.00 100 6,611.85 100 6,418.02 17,348.87 17,348.87 100
FEEDER ROADS
Paved 76.49 0.78 29.25 0.15 16.45 0.0616
122.
19 0.2
Unpaved 9,792.59 99.22 19,025.79 99.84 26,687.95 99.9384 55,506.33 99.8
Sub
Total 9,869.08 100 19,055.04 100 26,704.40 100 55,628.52 100.0
Total
28,550.85
24.28
41217.26
35.05
47832.18
40.67352
117600.29
100
S
Table 3.6: Selected Bus Route Operations from Dar es Salaam
S/N
DESTINATION
SERVICE DAY TRAVEL TIME AVERAGE FARES
Dec
2014
Dec
2015
Dec
2016
Dec,
2014
Dec,
2015
Dec
2016
Dec,
2014
Dec,
2015
Dec
2016
1. Arusha 61 65 10 10 12
23,000 23,000
23,000
2. Bukoba (Via
Nairobi)
0 0 30 30 30
60,000 60,000 60,000
3. Bukoba (Via
Singida)
9 12 28 28 30
55,000 55,000
55,000
5. Dodoma 37 45 6 6 9
18,000 18,000 18,000
6. Iringa 17 21 7 7
9 18,000 18,000 18,000

11
S/N
DESTINATION
SERVICE DAY TRAVEL TIME AVERAGE FARES
Dec
2014
Dec
2015
Dec
2016
Dec,
2014
Dec,
2015
Dec
2016
Dec,
2014
Dec,
2015
Dec
2016
8. Kondoa 2 4 13 13 15
25,000 25,000 25,000
11. Lindi 8 10 12 7 7 9
17,000 17,000 17,000
13. Lushoto 13 20 22 11 11 12
15,000 15,000 15,000
14. Mbeya 18 20 22 12 12 13
30,000 30,000 30,000
17. Moshi 44 61 64 8 8 10
20,000 20,000 20,000
18. Mpwapwa
7
4 10
7
7 9
15,000 15,000 15,000
19.
Mtwara
15 6 16 9 9 11
22,000 22,000 22,000
20. Musoma 2 4 6 28 28 32
51,000 51,000 51,000
24. Njombe 9 7 11 11 11 12
26,300 26,300 26,300
25. Rombo - 8 8 10 10 11
20,000 20,000 20,000
26. Shinyanga 25 18 25 13 13 15
35,000 35,000 35,000
27. Singida 7 6 8 10 10 12
27,000 27,000 27,000
28. Songea 8 6 8 14 14 17
35,000 35,000 35,000
29. Sumbawanga - 2 3 34 34 36
55,000 55,000 55,000
30. Tanga - 46 48 6 6 8
13,000 13,000 13,000
31. Tabora 4 7 8 13 13 14
40,000 40,000 40,000
33. Masasi/Naching
wea
- 4 4 11 11 13
25,200 25,200 25,200
36. Handeni 8 13 14 8 8 10
10,800 10,800 10,800
37. Ifakara - 12 14 11 11 13
16,000 16,000 16,000
39. Geita 1 3 4 18 18 20
45,000 45,000 45,000

12
S/N
DESTINATION
SERVICE DAY TRAVEL TIME AVERAGE FARES
Dec
2014
Dec
2015
Dec
2016
Dec,
2014
Dec,
2015
Dec
2016
Dec,
2014
Dec,
2015
Dec
2016
40. Kigali
(Rwanda)
Twice
per
week
0 Twic
e per
week
28 28
85,000 85,000 85,000
41. Kigoma
4
6
28
28
28 60,000 60,000 60,000
Source: SUMATRA
Table 3.7 Average bus fares for selected routes from Dodoma (2015-2016)
S/
N DESTINATION
DISTANCE
(KM)
TRAVE
L TIME
(HRS)
2015
AVERAGE
FARES
(Tshs)
2015
SERVIC
E/DAY
2015
TRAVEL
TIME
(HRS)
2016
AVERAGE
FARES
(Tshs)
2016
1. Dar es Salaam 451 70 35 20,000 9 20,000
2. Singida 245 9 15 10,000 3 10,000
3. Arusha 425 2 7 22,000 8 22,000
4. Iringa Via Mtera 264 3 16 12,000 4 12,000
5. Iringa Via
Morogoro
559 0 Na Na N/A Na
6. Mbeya 594 7 4 25,000 11 25,000
7. Tabora Via Itigi 378 2 1 23,000 3 23,000
Source: SUMATRA
Table 3.8 Average bus fares for selected bus routes from Dar es Salaam to neighboring
Countries.
S/N Destination Country
Service/Day
2016
Travel Time
(Hrs) 2016
Average Fares
(Tshs) 2016
1. Bulawayo Zimbambwe Daily 34 155,000/=
2. Harare Zimbambwe Daily 32 130,000/=
3. Lusaka Zambia Daily 30 100,000/=
4. Kigali Rwanda Daily 22 75,000/=
5. Bujumbura Burundi Daily 23 75,000/=
6. Kampala
(via Bukoba)
Uganda Daily 24 95,000/=
7. Kampala
(via Nairobi)
Uganda Daily 22 N/a
8 Lilongwe Malawi Daily 30 75,000/=

13
S/N Destination Country Service/Day
2016
Travel Time
(Hrs) 2016
Average Fares
(Tshs) 2016 9. Lubumbashi Congo Daily 30 120,000/=
10. Nairobi Kenya Daily 12 60,000/=
11. Mombasa Kenya Daily 10 30,000/=
Table 3.9: Number of Road Transport Licenses Issued
S/N YEAR
PASSENGER
SERVICES
VEHICLE
LICENSES
GOODS
SERVICES
VEHICLE
LICENSES
TOTAL
1 2010 31,575 43,340 74,915
2 2011 33,020 49,057 82,077
3 2,012 33,187 62,056 95,243
4 2013 37,884 63,345 101,229
5 2014 44,018 70,823 114,841
6 2015 47,451 81,567 129,018
7 2016 46,619
87,274
133,893
Source: SUMATRA
Chart 3.2: Number of Road Transport Licenses Issued

14
Table 3.10: Number of Vehicles by Category for 2011- 2015
Vehicle Category 2011 2012 2013 2014 2015
1
Motorcycles less than 3
wheels)
446,775 552,834 684,948 832,149 1,026,709
2 Motor tricycles 11,621 18,906 32,366 53,874 63,478
3
Light passengers
vehicles (less than 12
persons)
298,168 333,069 385,654 451,664 507,607
4
Heavy passengers
vehicles (12 or more
passers)
38,593 40,579 44,028 50,301 54,748
5
Light load vehicles
(GVM 3500 or less
61,731 66,508 73,565 84,067 92,068
6
Heavy load vehicles
(GVM>3500 kg)
65,679 71,710 78,716 88,841 95,402
7 Trailer 17,345 20,701 24,549 30,555 35,765
8 Agricultural tractor 11,943 13,775 15,130 16,998 18,762
9 Agricultural trailer 230 368 857 883 922
10 Construction Equipment 4,607 5,407 6,162 7,067 7,891
11 Others 1,095 1,533 1,899 3,056 5,010
TOTAL
957,787 1,125,390
1,347,874
1,619,455 1,908,362
Note: This categorization excludes all GoT vehicles, Military, Police, Diplomats and Donor Funded
Projects vehicles which are registered by Ministry of Works.
Table 3.11: Road Traffic Accidents Tanzania Mainland
Source: Traffic Police(HQ), Dar es Salaam
S/N PARTICULAR 2011 2012 2013 2014 2015
2016
1. Total Number of
Traffic Accidents
23,986 23,578 23,842 14,360 8,337 9,856
2. Killed Persons 3,981 3,969 4,002 3,760 3,468
3,256
3. Injured Persons 20,802 20,111 20,689 14,530 9,383
8,958

15
Chart 3.3 : Road Traffic Accidents Tanzania Mainland
Table 3.12: Cause of Road Traffic Accidents Tanzania for Mainland
S/N PARTICULAR 2011 2012 2013 2014 2015 2016
1. Reckless Driving 5,744 5,197 5,081 5,053 2,868
2,583
2. Defective Motor Vehicles 2,055 2,223 1,623 990 502 755
3. Careless Pedestrians 825 980 979 987 470 609
4. Excessive Speed 2,158 4,951 5,118 950 691 730
5. Careless Motor Cyclists 3,765 2,144 2,039 3,163 2,009 1,808
6. Careless Pedal Cyclists 1,313 930 1313 689 410 447
7. Intoxication 171 112 91 95 66 97
8. Other i.e. Bad Road,
Slippery, etc
4,923 3,978 4,203 2,433 1321 2,829
TOTAL 23,986 23,578 23,842 14,360 8,337 9,856
Source: Trafic Police (HQ), Dar es Salaam

16
CHAPTER FOUR
4.0 RAILWAY INFRASTRUCTURE AND SERVICES
Table 4.1 Railway Passenger Traffic
Chart 4. 1 Railway Passenger Traffic
Year TRL Passengers
Traffic (‘000 Pax)
TAZARA
Passengers Traffic
(‘000 Pax)
Total Railway Passengers
(‘000 Pax)
2006 594 890 1,484
2007 585 1,090 1,675
2008 459 1,047 1,506
2009 543 997 1,540
2010 290 767 1,057
2011 519 787 1,306
2012 505 786 1,291
2013 492 703 1,195
2014 295 536 831
2015 388 455 843
2016 517 414 931

17
Table 4.2: Railway Freight Performance (2006 – 2016)
Year TRL
Freight (000 Tons)
TAZARA Freight
(000 Tons)
Total Railway Freight
(000 Tons)
2006 775 601 1,376
2007 545 539 1,084
2008 505 528 1,033
2009 453 383 836
2010 256 523 779
2011 267 534 801
2012 198 339 537
2013 154 218 372
2014 190 208 398
2015 585 88 673
2016 209 128 337
Source: TRL& TAZARA
Chart 4.2. Railway Freight Traffic

18
Table 4.3: Railways Freight (‘000 Ton Km)
Year TRL(000Ton Km) TAZARA(000 Ton Km) Total(000 Ton
Km)
2006 665,813 869,022 1,534,835
2007 477,273 469,212 946,485
2008 506,011 798,009 1,304,020
2009 505,967 487,620 993,587
2010 251,843 711,260 963,103
2011 264,899 812,990 1,077,889
2012 143,600 484,085 627,685
2013 145,738 258,000 403,738
2014 200,242 239,000 439,242
2015 231,865 102,135 334,000
2016 230,204 130,269 360,473 Source: TAZARA & TRL
Table 4.4: Railways Passenger (‘000 Passenger Km)
YEAR TRL(000 PAX
KM)
TAZARA(000 PAX KM) TOTAL(000 PAX KM)
2006 324,922 298,092 623,014
2007 315,507 349,712 665,219
2008 321,352 344,135 665,487
2009 374,121 285,782 659,903
2010 150,645 303,203 453,848
2011 328,508 300,219 628,727
2012 290,000 288,140 578,140
2013 333,458 84,000 417,458
2014 205,180 202,000 407,180
2015 296,816 129,473 426,289
2016 353,245 151,687 504,932
Source: TRL & TAZARA
Table 4.5: Railway Average Locomotive Availability (%) (Shunting & Mainline Locomotives)
Year TRL Average
Locomotive Availability
(%)
TAZARA Average
Locomotive
Availability (%)
Railway Average
Locomotive Availability
(%)
2010 62 54.4 58.2
2011 50 55 52.5
2012 38 47.4 42.7
2013 33 58.1 45.6
2014 44 60.3 52.15
2015 56 52 54
2016 47 58 105
Source: TRL & TAZARA

19
Table 4.6: Railways Domestic Freight
YEAR TAZARA FREIGHT
(000 TONS)
TRL FREIGHT
(000 TONS)
TOTAL FREIGHT
(000 TONS)
2006 150 535 816
2007 131 585 716
2008 84 245 329
2009 28 190 218
2010 89 161 250
2011 56 202 258
2012 55 151 206
2013 26 127 153
2014 29 185 214
2015 37 202 239
2016 38 208 246
Source: TRL& TAZARA
Table 4.7 Railways Accidents
S/N TYPE 2012 2013 2014 2015 2016
TRL TZR TRL TZR TRL TZR TRL TZR TRL TZR
1. Deaths
Incidences
7 22 11 23 20 10 11 3 13
2. Incidences
leading to
Injuries
6 9 18 28 56 3 12 21 27
3. Collisions 2 22 2 33 4 24 4 10 2
4. Derailment &
Capsizements
45 78 49 57 43 57 106 30 115
5 Washaways 14 0 21 0 28 26 8 2 29

20
CHAPTER FIVE
5.0 PORTS INFRASTRUCTURE AND SERVICES
Table 5.1: Ports operating along Coast and Lakes
S/N Port Type Ports name Location
1. Main ports along coast Dar es salaam Indian ocean
Tanga Indian ocean
Mtwara Indian ocean
2. Main ports along lakes Mwanza north and south Lake Victoria
Kigoma Lake Tanganyika
Nyasa Lake Nyasa
3
Small Ports along coast Mafia Indian ocean
Lindi Indian ocean
Kilwa Indian ocean
Pangani Indian ocean
Bagamoyo Indian ocean
4 Small Ports along lakes Kasanga Lake Tanganyika
Kibirizi Lake Tanganyika
Bukoba Lake Victoria
Kemondo bay Lake Victoria
Nansio Lake Victoria
Musoma Lake Victoria
Itungi Lake Nyasa
Manda Lake Nyasa
Mbamba bay Lake Nyasa
Liuli Lake Nyasa
Kyela Itungi Lake Nyasa
Source: TPA
Table 5.2: Dar es Salaam Port design Capacity Operations (2014-2016)
S/N DETAIL VALUE 2014 VALUE 2015 VALUE
2016
1. Total Number of Berths 11 11 11
2. Break Berths 7 7 7
3. Container Berths 4 4 4
4. Total Quay Length (metres) 2,018 2,018 2,018
5. Break Bulk Capacity (in millions)
3.1 tons
3.1 tons
3.1 tons
6. Bulk Liquid Capacity (million DWT) 6.0 Million tons 6.0 Million tons 6.0 Million
tons
7. Container Terminal (TEUS) 400,000 TEUS 400,000 TEUS 400,000
TEUS
8. Crude Oil Pumping Capacity
(ton/hour)
5,000 Tons per hour 5,000 Tons per
hour
5,000 Tons
per hour

21
S/N DETAIL VALUE 2014 VALUE 2015 VALUE
2016
9. Refined Products Pumping Capacity
(tons/hour)
750 Tons per hour 750 Tons per
hour
750 Tons per
hour
10. Grain Terminal Storage Capacity
(tons)
30,000 tonnes 30,000 tonnes 30,000
tonnes
Table 5.3: Principal Export/Imports Commodities Handled at Main Ports (DSM, Tanga
and Mtwara - Tons)
S/N TYPE 2011 2012 2013 2014 2015 2016
1. EXPORTS 2,132,893 2,220,725 2,145,392 2,465,046 2,582,108 2,488,376
2. IMPORTS 9,127,419 10,434,060 11,509,989 12,912,847 12,606,653 12,119,017
TOTAL 9,361,690 11,260,312 12,654,785 15,377,893 15,188,761 14,607,393
Source: TPA
Chart 5.1 Principal Export/Import commodities at DSM, Tanga and Mtwara
Table 5.4: Total Freight through Dar es Salaam Port (000’Tons)
S/N DESRIPTION 2011 2012 2013 2014 2015 2016
Imports 4,846 6,053 6,642 7,100 6,657 6,087
Exports 1,705 1,924 1,892 2,232 2,137 1,915
SUB TOTAL 6,551 7,977 8,534 9,332 8,794 8,002
2. BULK OIL
Imports 3,624 3,687 4,471 4,357 4,882 4,772
Exports 77 25 37 66 362 116
SUB TOTAL 3,701 3,712 4,508 4,423 5,244 4,888

22
Source: TPA
Chart 5.2 Total Freight through DSM Port
Table 5.5: Transit Traffic through Dar es Salaam Port (‘000 Tons)
TYPE 2011 2012 2013 2014 2015 2016
Import 2,788 3,224 3,800 3,806 4,436 3,903
Export 836 613 629 1,213 818 677
TOTAL 3,624 3,837 4,429 5,019 5,254 4,580
Source: TPA
3. OTHER BULK LIQUID
Imports - 234 267 306 362 401
Exports - 28 14 0 0 0
SUB TOTAL - 262 281 306 362 401
Transshipment 139 87 187 415 201 289
4. TOTAL
Imports 8,470 9,974 11,380 11,763 11,901 11,260
Exports 1782 1977 1,943 2,298 2,499 2,031
Transshipment 139 87 187 415 201 289
GRAND TOTAL 10,391 12,038 13,510 14,476 14,601 13, 581

23
Chart 5.3 Total Transshipment through DSM Port
Table 5.6: Traffic of Different Countries through Dar es Salaam Port (000’ Tons)
COUNTRY 2011 % 2012 % 2013 % 2014 % 1015 % 2016 %
TANZANA
Imports 5,494 65 6,529 67 7,399 66 7,805 68 7,328 64 7,356 65
Exports 991 52 886 59 846 57 978 38 1,385 55 1,271 62
ZAMBIA
Imports 1,251 17 1,488 15 1,550 14 1,549 13 1,705 15 1,584 14
Exports 296 26 287 19 287 19 1,073 41 199 8 155 8
D.R.CONGO
Imports 639 8 760 8 824 7 1,073 9 1,194 10 789 7
Exports 200 21 262 17 293 20 504 3 521 21 364 17
BURUNDI
Imports 338 4 290 3 336 3 298 3 349 3 301 3
Exports 18 1 18 1 14 1 16 1 14 5 19 1
RWANDA
Imports 343 4 528 5 652 6 609 5 820 7 840 8
Exports 13 1 32 2 28 2 21 1 20 8 22 1
MALAWI
Imports 113 1 95 1 130 1 77 1 116 1 129 1
Exports 0 0 12 1 7 1 -
-
385 15 0 1
UGANDA
Imports 66 1 61 1 245 2 86 1 157 135 165 2
Exports 0 0 1 0.1 1 0 2 0 1 0 1 0

24
TOTAL
Imports 8,244 100 9,754 100 11,136 100 11,497 100 11,669 100 11,164 100
Exports 1,518 100 1,500 100 1,476 100 2,594 100 2,525 100 2,038 100
GRAND T 9,762 100 11,960 100 11,960 100 14,091 100 14,194 100 13,202 100
Table 5.7: Capacity Details of Main Sea Ports (2016)
S/N DETAIL DAR ES SALAAM TANGA MTWARA
1. Deep Water Berths No. 11 N/A 2
2. Total Length (m) 2,018 N/A 395
3. Depth Dredged (m) 10 3-4.5 10
4. Bulk Oil Jetty (Tanker Berth) No. 1 N/A N/A
5. Single Buoy Mooring (SBM) No. 1 N/A N/A
6. Grain Silo (30,000 Tons) 1 N/A N/A
7. Lighterage& Dhow Wharves No. 4 2 N/A
8. Lighterage& Dhow Wharves
Length
588 381 N/A
9 Container Terminal (m2) 104,500 N/A N/A
10. Transit Depots
Ubungo (m2) 29,745 N/A N/A
Kurasini (m2) 40,385 N/A N/A
Source: TPA
Table 5.8: Cargo Handling Equipment and Marine Crafts
S/N FACILITIES DAR ES SALAAM TANGA MTWARA
G/Cargo TICTS
1. CARGO HANDLING EQUIPMENTS CRANES
Portal Cranes 8 0 4 0
Mobile Cranes 4 0 1 12
Tower Cranes 0 0 3 0
Ship to shore Gantry
Cranes
- 5 - 0
Rubber Tire gantry
Crane
- 19 - 0
Rail Mounted gantry
Cranes
- 1 - 0
Floating Cranes 1 0 - 0
2. OPERATIONAL
EQUIPMENTS
Tractors 22 49 23 4
Trailers 87 51 23 10
Forklifts 55 13 5 11
Front Loaders 3 3 1
Cranes Crawlers - - - N/A
Reach Stacker 13 7 - 2
Conveyors (loading,
chain & Bert)
14 N/A N/A

25
S/N FACILITIES DAR ES SALAAM TANGA MTWARA
G/Cargo TICTS
Empty Handler 7 8 1 3
Grabs 15 N/A N/A
Spreader - N/A N/A
Weighbridge 3 N/A 1
Bucker Elevators 3 N/A N/A
Grain Hoppers 7 N/A N/A
Begging scales 3 N/A N/A
Dust Cull Unit 3 N/A N/A
Bag Unit Mobile 7 N/A N/A
3. MARINE CRAFTS
Berthing tugs 4 N/A 1
Lighters towing Tugs 1 1 N/A
Lighters - 7 N/A
Pontoons - 8 N/A
Labor launches 0 1 N/A
Pilot Boats 2 1 2
Patrol Boats 3 - 2
Mooring Boats 1 1 N/A
Water barge 1 N/A N/A
SBM Tender 1 N/A N/A
Source: TPA
Table 5.9: Navigational Aids and Light (by December 2016)
STATION NAVIGATION
AID TYPE
TOTAL
IN NOs
RANGE
(NM)
SOURCE OF
LIGHTS
ABOVE
HIGH
WATER
(MTRS)
DSM
PORT
STEEL BUOYS
Red (p s)
Gree (s.s)
Beacons
Leading mark/ LM
Light House
(Makatumbe)
11
6
3
12
1
5.5-7
5.5-7
5.5-7
10-18
15-96
Solar
,,
Solar
,,
,,
-
-
-
-
29
MAFIA
CHANNEL
STEEL BUOYS
Light House
4
2
3
15.96
Gas
Gas
-
31
TANGA
PORT
STEEL BUOYS
Red (ps)
Green (s.s)
Beacons
Leading mark/LM
Light house
2
2
6
7
1
3
5.5-7
5.5-6.1
7 – 12.6
14.5
Gas
Solar
Gas & solar
,,
Gas
-
-
-
-
-
26
MTWARA
PORT
STEEL BUOYS
Red (ps)
Green (s.s)
GRP Red
1
3
1
5.5-7
5.5-6.1
4
Solar
Solar
Gas
-
-
-
-

26
STATION NAVIGATION
AID TYPE
TOTAL
IN NOs
RANGE
(NM)
SOURCE OF
LIGHTS
ABOVE
HIGH
WATER
(MTRS)
Leading mark/LM
Light House
4
1
7-12.6
18-14
Solar
Gas
16
-
LINDI
PORT
STEEL BUOYS
Red (ps)
Green (s.s)
Beacons
Leading mark/LM
Light House
-
1
2
-
2
1
3
3
-
-
-
-
Gas
Gas
-
Gas
Gas
-
-
-
-
-
10
KILWA STEEL BUOYS
Leading mark/LM
3
4
4
7-12.6
Gas
Gas
-
-
Source: TPA
Table 5.10: Principal Exports Commodities Handled at DSM Port (Tons)
S/
N
COMMODIT
Y
2010 2011 2012 2013 2014 2015 2016
1. BULK LIQUID
Bulk Oil (Incl
bunkers)
66,543
76,992
63,590 51,933 66,138 72,921 115,671
Molasses 0 0 0 0 0 0 0
Sub-Total
66,543 76,992 63,590 51,933 66,138 72,921 115,671
2. MINERALS
Copper
(Zambia)
0 0 0 0 6,240 23,514
Sub-Total 0 0 0 0 6,240 23514
3. GENERAL CARGO
Maize Meal
and flour
0 126,318 1,244 11,440 4,408
Wheat bran 4,626 0 0 3,441
Sorghum 0 0 0
Motor vehicle 1,591 180 144 33 607 877 2,196
Sugar 0 0 0 28,505 18,075
Other General
Cargo
3,942 3,659 14,852 30,976 21,498 240,789
Container
Terminal/
TICTS
1,309,375 1,054,037 1,094,493 1,788,531 2,070,536 2,007,70
3
1,817,15
6
Sub-Total 1,319,534 1,184,194 1,110,733 1,167,352 2,122,156 2,012,98
8
1,915,55
5
TOTAL
EXPORTS
1,386,077 1,261,186 1,174,323 1,909,659 2,211,808 2,085,90
9
2,175,81
2
Source: TPA

27
Table 5.11: Principal Export Commodities Handled at Tanga Port (Tons)
S/
N
COMMODIT
Y
2010 2011 2012 2013 2014 2015 2016
1. Beans 5,289 2,242 1,375 8,913 4,932 1,728 1,332
2. Coffee 11,087 5,844 5,246 5,730 7,596 3,204 4,502
3. Tea 0 0 0 0 0 0
6. Sisal Ropes
and twines
18,534 14,192 12,166 25,354 37,637 35,943 40,119
7. Cement in
Bags
34,462 34,331 32,603 8,877 4,552 0 0
8. Timber,
flooring bloc
38,053 23,643 12,582 16,827 18,905 30,357 20,683
Other General
Cargo
47,889 37,169 44,639 49,783 44,260 31,359 28,106
TOTAL
EXPORTS
155,314 117,421 108,611 115,484 117,882 102,591 94,742
Source: TPA
Table 5.12: Principal Export Commodities Handled at Mtwara Port (Tons)
S/N COMMODITY 2010 20101 2012 2013 2014 2015 2016
1. Beans and Soya N/A N/A N/A N/A N/A N/A N/A
2. Cashew nuts
Raw
93,170 90,432 95,844 107,110 104,907 114,055 182,504
3. Simsim N/A N/A N/A N/A N/A N/A N/A
4. Cashew nuts
Kernels
N/A N/A N/A N/A 340 N/A N/A
5. Rice N/A N/A N/A N/A N/A N/A N/A
6. Ophir project
cargo
14,988 N/A N/A N/A 18,783 N/A N/A
7. Other General
Cargo
632 13,521 10,996 13,139 11,326 24,985 35,321
TOTAL
EXPORTS
108,790 103,953 106,840 120,249 135,356 139,040 217,825
Source: TPA
Table 5.13: Principal Import Commodities Handled at DSM Port (Tons)
S/
N
COMMODI
TY
2010 2011 2012 2013 2014 2015 2016
1. DRY BULK CARGO
Wheat 652,351 666,489 982159 984,879 892,368 969,562 1,006,985
Clinkers - 172,518 289893 379,809 497,964 136,912 245,119
Maize - - 0 0
Copper Slags - 15,414 36736 116,669 188,804 43,063
Fertilizer 349,655 327,687 236900 428,518 347,964 246,293 272,842
Gypsum 49508 45,319 0 18,809
Sub-Total 1,002,006 1,182,108 1595196 1,955,194 1,927,100
1,414,630 1,524,946

28
S/
N
COMMODI
TY
2010 2011 2012 2013 2014 2015 2016
2. BAGGED CARGO
Cement 3,806 - 23176 - 125,062 5,997 3,022
Wheat and
Wheat flour
- - 5982 - 0
Fertilizer 15,049 6,927 22028 28,528 87,645 69,614 27,343
Sugar 8,200 - 0 0 0 0
Rice 68,872 37,118 7172 2,312 0 0
Maize and
Sorghum
7,911 43,380 2656 24,903 0 0
Beans 1521 1,129 0 5,997 0
Sub-Total 122,693 87,425 62535 56,872 212,707 75,611 30,415
3. BULK
LIQUIDS
Petroleum Oil 2,907,43
0
3,623,81
4
3919928 4,470,553 4,663,913 5,248,802 5,173,190
Crude soya
Oil
- - 0 0 114,963
Other Liquid - - 0 0 0
Sub-Total 2,907,430 3,623,814 3919928 4,470,553 4,778,876 5,248,802 5,173,190
4. GENERAL
CARGO
Motor
Vehicles
Tractors &
Trailers
135,319 217,881 248,953 253,243 557,048 237,198 632
Iron ,Steel,
Material
- 318,843 231,531 397,972 618,619 301,680 419,123
Motor
Vehicles
spares parts
- - 19,588 28,364 3,935 4,810 203,278
Machinery
and spares
19,332 57,231 8,112 6,277 20,255 6,505 146
Galvanised
Cast iron
182,214 0 0 0 0
Paper and
paper bags
- - 0 - 0
Pipes and
fitting
272 5,676 6,553 23,709 38,313 - 2,722
Silver
Platium Other
materials &
Alloys
1,310 - 0 9,735 - 0
Other
General
Cargo
234,612 116,588 21,801 191,190 98,019 525,145 410,028
Container
Terminal
2,552,721 2,207,198 2,379,912 3,646,925 4,238,158 3,928,383 3,646,654
Sub- Total 3,125,780 2,923,417 2,916,450 4,547,680 5,584,082, 5,003,721 4,506,335
TOTAL
IMPORTS
7,157,909 7,816,764 8,494,109 11,030,299 12,502,765 11,742,764 11,405,134

29
Table 5.14: Principal Import Commodities Handled at Tanga Port (Tons)
S/N COMMODITY 2010 2011 2012 2013 2014 2015 2016
1. BULK CARGO - - - - - -
Bulk oil 4,845 17,821 6149 11,108 6,149 78,092 215,502
Sub- Total 4,845 17,820 6149 11,108 6,149 78,092 215,502
2. GENERAL
CARGO
Clinker 14,050 165,702 35276 163,785 26,286 256,917 7,000
Wheat 36,419 - 19619 19,113 0 27,047 86,382
Cotton process - 0 0 - -
Raw Material 96,677 56639 28,395 - -
Sodium
Sulphate
- - 0 - - -
Raw
glythelenepolyf
o
38,486 76,548 0 31,279 38,0
47
57,594
Machinery and
Parts
5,243 1,603 0 1,243 1,440 1,512 4,740
Fertilizer in
Bags
- 216 0 - - - 36
Motor
veh,Tractors&
Trailers
3,612 697 0 1,434 1,147 708 504
Miscellaneous
Cargo
80,576 87,835 270,224 89,013 113,696 176,401 339,832
Sub- Total 216,805 352,514 381,758 332,828 186,765 520,179 438,494
TOTAL
IMPORTS
221,650 370,335 389,321 343,936 192,914 598,271 653,896
Source: TPA
Table 5.15: Principal Import Commodities Handled at Mtwara Port (Tons)
S/N COMMODITY 2010 2011 2012 2013 2014 2015 2016
1. BULK
CARGO
Bulk Oil 8,020 11,255 0 16,471 0 1,015 10,150
Sub-Total 8,020 11,255 0 16,471 0 1,015 10,150
2. GENERAL
CARGO
-
Maize and
Maize Meal
16 68 0 0 0 0 0
Rice - - 0 0 0 0 0
Sulphur - 3,9
55
0 0 0 0
Cement 7,526 5,509 21,250 31,400 27,811
Ophir project
cargo
1,699 - 0 0 79,920 0
Machinery parts - 7,6 0 2,335 55,247 35 10,587

30
S/N COMMODITY 2010 2011 2012 2013 2014 2015 2016
69
Wheat and
wheat flour
- - 0 26,921 0
Empty container 10,037 1,082 12690 13,035 14,183 15,485
Full containers 7601 8,630 0 27,399
Cement 16,254 7,526 5509 21,250 31,400 27,811
Other General
Cargo
5,396 27,743 20630 47,112 36,418 36,405 109,422
Sub-Total 53,402 48,043 46430 119,283 217,168 79,701 137,258
TOTAL
IMPORTS
61,422 59,298 46430 135,754 217,168 80,716 147,408
Source: TPA
Table 5.16: Shipping Traffic at Major Ports –Deep Sea Ships.
Source: TPA
S/N DESCRI
PTION
DARES SALAAM TANGA MTWARA
201
3
201
4
2015 201
6
2013 2014 2015 2016 2013 2014 2015 2016
1. DRY
CARGO
Number
of calls
820
878
856
837
79
68
70
55
59
49
30
45
Average
Stay in
Port
(Day/Shi
p)
4.6 4.1 4.2 4.3 2.3 2.3 3.1 3.0 2.2 2.2 2.2 2.4
2. TANKE
RS
Number
of calls
127 144 156 159 0 0 6 15 1 1 6 0
Average
Stay in
Port
(Day/Shi
p)
4.4 5.2 4.4 5.1 0 0 1.2 2.2 1.2 1.2 2.3 0

31
Table 5.17: Shipping Traffic at Major Ports - Coastal Ships
S/N DESCRIPTION DAR ES SALAAM TANGA MTWARA
2014 2015 2016 2014 2015 2016 2014 2015 2016
1. DRY CARGO
Number of calls
529 552 630 76 68 6 129 544 47
Average Stay in
Port (Day/Ship)
3.0 3.1 3.1 2.9 1.2 2.1 2.3 2.1 1.3
2. TANKERS
Number of calls 49 53 58 0 0 0 0 0 0
Average Stay in
Port (Day/Ship)
1.5 1.5 1,5 0 0 0 0 0 0
3. MISC. VESSELS 0 0 0 0 0 0
Passenger Boats
& Ferries
2,157 1,805 2,086 0
0 0
0 0 0
Dhow and
Schooner 527 376 686 0 0 0
0 0 0
Source: TPA
Table 5.18: Cargo Traffic at Major Ports (Tons)
S/N PORT/TRAFFIC 2011 2012 2013 2014 2015 2016
1 DAR ES SALAAM
IMPORTS 8,469,648 9,975,001 11,379,039 11,611,101 11,905,592 11,260,548
EXPORTS 1,781,889 1,987,430 1,949,260 2,148,245 2,210,026 2,031,226
TRANSHIPMENT 138,598
87,244
187,534 415,045 200,851 289,173
TOTAL 10,390,135 12,049,675 13,515,833 14,174,391 14,316,469 13,580,947
2 TANGA
IMPORTS 426,457 389,337 384,623 612,030 595,441 562,896
EXPORTS 190,745 115,073 166,723 138,043 139,522 82,402
TOTAL 617,202 504,410 551,346 750,073 734,963 645,298
3 MTWARA
IMPORTS 92,715 69722 147,851 207,948 105,620 150,986
EXPORTS 160,573 154249 128,772 149,680 136,940 220,162
TOTAL 253,288 223,971 276,623 357,628 242,560 371,148
SUBTOTAL
IMPORT 8,988,820 10,434,060 11,911,513 12,431,079 12,606,653 11,974,430
EXPORT 2,133,207 2,256,752 2,244,755 2,435,968 2,486,488 2,333,790
TRANSHIPMENT
138,598 87,244 187,534 415,045 200,851 289,173
GRAND TOTAL 11,399,223 12,865,300 14,531,336 15,697,137 15,494,843 14,886,566
Source: TPA

32
Table 5.19: Imports Clearance by Mode of Transport at DSM Port (DWT)
S/N ITEM 2011 2012 2013 2014 2015 2016
1. ROAD 3,245,898 3831551 3,178,291 4,938,091 5,932,883 6,326,921
2. TRL 21,570 7025 5,096 542 7,153 5,426
3. TAZARA 90,348 43868 55,042 10,836 10,667 11,656
4. TOTAL 3,357,816 3,882,444 3,238,429 4,948,927 5,950,703 6,344,003
Source: TPA
Table 5.1: Container Traffic Handled at DSM Port
Destination
Countries
2013 2014 2015 2016
BOXES TONAGE BOXES TONAGE BOXES TONAGE BOXES TONAGE
Tanzania 140,881 183,263 150,171 2,759,890 130,715 2,523,789 139,200 2,481,015
Zambia 19,755 31,460 22,843 405,958 33,339 357,845 17,581 313,166
D R Congo 20,711 31,020 28,775 534,574 34,152 425,318 14,336 253,701
Burundi 14,172 9,305 7,476 129,708 9,634 121,268 6,452 110,390
Rwanda 13,374 24,672 19,095 329,862 34,382 431,425 23,365 428,371
Malawi 2,678 3,797 1,830 32,359 2,094 21,991 1,834 32,231
Uganda 1,833 2,545 1,075 18,579 1,928 24,642 1,548 27,127
Others 269 357 886 17,986 1,199 17,914 609 10,053
P/P 0
T/shipment 10,494 12,849 3,754 9,292 10,990 177,259 17,845 289,246
Empties 740 994 3,754 9,292 1,106 4,191 2,164 6,400
Sub-total 224,907 300,262 235,905 4,238,158 206,334 3,928,383 207,087 3,640,554
EXPORTS
Tanzania 45,965 62,959 51,570 895,417 47,209 835,348 50,987 67,458
Zambia 17,231 17,255 14,252 258,374 10,920 199,468 8,304 155,005
D R Congo 17,313 16,839 25,820 479,620 28,529 521,030 18,164 363,701
Burundi 7,805 968 1,360 16,058 868 12,998 1,176 19374
Rwanda 1,383 1,956 1,329 20,203 1,176 19,850 1,318 22,352
Malawi 447 637 7 121 10 260 14 238
Uganda 49 79 73 1,482 67 703 49 796
Others 40 55 42 782 34 356 8 129
Empties 123,973 176,037 127,591 398,379 133,258 417,690 123,110 385,525
Sub-total 214,206 276,785 222,044 2,070,536 222,048 2,000,703 203,130 1,817,156
GRAND
TOTAL
439,113 577,047 457,949 6,308,694 439,368 6,113,345 410,217 5,746,956

33
CHAPTER SIX
6.0 INLAND WATER TRANSPORT SERVICES
Table 6.1: Vessels Operated by Marine Service Company Limited
S/N VESSELS PASSENGER
CAPACITY
CARGO
CAPACITY (TONS) YEAR BUILT
1. ON LAKE VICTORIA
MV Victoria 1,200 200 1960
MV Butiama 200 100 1980
MV Serengeti 593 350 1988
MV Clarias 293 30 1961
MV Nyangumi (Tanker) N/A 350 1958
MT Ukerewe (TUG) N/A 480 1980
ML Maindi N/A 120 1938
ML Wimbi N/A 120 1938
MVUmoja (rail wagons
carrier)
N/A 1200 1964
2. ON LAKE TANGANYIKA
MV Liemba 600 200 1913
MV Mwongozo 800 80 1980
MT Sangara (tanker) N/A 350 1981
Sea Worrior (for tourism) N/A 15 1990
3. ON LAKE NYASA
MV Iringa 139 5 1974
MV Songea 212 43.5 1974
Table 6.2: Number of Passengers Handled by MSCL at Main Lake Ports
PORT 2011 2012 2013 2014 2015 2016
Mwanza 115,649 82,561 123,033 148,200 31,000 27,342
Bukoba 69,462 57,606 64,129 62,021 30,442 21,154
Musoma - - - - -
Kigoma 12,708 40,402 38,543 25,963 7,132 7,032
Itungi Port 6,741 7,607 14,345 13,600 10,684 8,594
Kemondo Bay 6,625 7,332 7,137 8,900 -
Mbamba Bay 475 2,154 2,200 4,786 8,000 6,517
Nansio 34,119 21,198 30,600 78,157 120,437 94,514
TOTAL 245,779 218,860 279,987 341,627 207,695 165,153
Source: MSCL

34
Table 6.3: Freight Carried by MSCL through Bukoba Pier (Tons)
Freight 2011 2012 2013 2014 2015 2016
Beans 2,348 1,782 1,630 1,450 0 0
General
Goods
6,991 10,427 10,600 8,000 10,015 5,307
Empty
Bottles
889 168 211 500 0 0
Vehicles 110 108 102 0 0 0
Coffee 106 1,536 1,080 950 0 0
TOTAL 10,444 14,021 13,623 10,900 10,015 5,307
Source: MSCL
Table 6.4: Freight Carried by MSCL through Mwanza Pier (Tons)
Freight 2011 2012 2013 2014 2015 2016
Cement 68 110 120 100 0 0
Wheat Flour 2,091 111 849 200 0 0
Cooking Oil 1,114 1,230 1,300 1,500 0 0
Rice 2,948 207 502 700 0 0
Sugar 927 108 670 0 0 0
Salt - 105 108 0 0 0
General Goods 5,234 14,115 16,153 14,200 8,000 7,400
Soft Drinks 1,424 271 201 100 0 0
Beer - - 108 0 0 0
TOTAL 13,806 16,257 20,011 16,800 8,000 7,400
Source: MSCL
Table 6.5: Freight Carried by MSCL through Mwanza South Port (Tons)
Freight 2011 2012 2013 2014 2015 2016
Cement - - 2,050 0 0 0
Soft Drinks 480 3,250 2,010 0 0 0
General Goods 5130 56,797 41,947 42,608 14,255 11,345
Beer - - 2,080 0 0 0
TOTAL 5,610 60,047 48,087 42,608 14,255 11,345
Source: MSCL
Table 6.6: Freight Carried by MSCL through Kemondo Bay and Kigoma Ports (Tons)
Freight 2011 2012 2013 2014 2015 2016
Kemondo Bay
(Coffee)
- - 2,097 500 0 0
Kigoma (General
Goods)
3889 4,787 4,609 2,744 1,400 1,215
TOTAL 3889 4,787 6,706 3,244 1,400 1,215
Source: MSCL

35
Table 6.7: Average Stay in Port by MSCL Vessels (2011 to 2016)
S/N VESSEL AVERAGE
STAY (DYS)
2012
AVERAGE
STAY
(DYS) 2013
AVERAGE
STAY (DYS)
2014
AVERAGE
STAY (DYS)
2015
AVERAGE
STAY
(DYS) 2016
1. MWANZA PORT
MV Victoria 154 209 156 0 0
MV Serengeti 252 365 365 44 70
MV Butiama 365 - 0 0 0
2. BUKOBA PORT
MV Victoria 150 156 156 0 0
MV Serengeti 3 - 0 44 70
3. KIGOMA PORT
MV Mwongozo 356 0 0 0
MV Liemba 225 269 334 335 55
4. NANSIO PORT
MV Butiama - - 0 0 0
MV Iringa - 210 365 0 0
5. ITUNGI PORT
MV Songea 279 269 334 335 220
MV Iringa 334 - 0 0 0
Source: MSCL
Table 6.8: Number of Calls by Each MSCL Vessel at Main Ports
Source: MSCL
S/N Vessel 2010 2011 2012 2013 2014 2015 2016
1. MWANZA PORT
MV Victoria 152 156 151 156 156 0 0
MV Serengeti 10 - 33 21 0 19 8
MV Butiama 28 - 0 - 0 0 0
MV Clarias 340 267 204 342 337 315 270
2. MWANZA SOUTH PORT
MV Umoja 30 11 38 19 9 7 5
MV Serengeti 9 34 22 7 0 8
MT Nyangumi - - 0 - 0 0 0
MT Maindi - - 0 - 0 0 0
MT Ukerewe 2 - 6 - 0 0 0
3. BUKOBA PIER
MV Victoria 152 156 151 156 156 0 0
MV Serengeti 7 7 0 - 0 19 8
MV Umoja - - 0 - 0 0 0
MT Nyangumi - - 0 - 0 0 0
MT Maindi - - 0 - 0 0 0
MT Ukerewe 1 - 0 - 0 0 0
KIGOMA PORT
MV Liemba 30 23 26 26 26 7 7
MV wongozo - - 3 - 0 0 0
MT Sangara 10 7 5 3 2 3 1
5. ITUNGI PORT
MV Songea 19 29 13 37 26 34 30
MV Iringa 43 19 11 - 0 0 0

36
CHAPTER SEVEN
7.0 AIR TRANSPORT INFRASTRUCTURE AND SERVICES
7.1 Summary of TCAA Statistics
Table 7.1.1: Passenger Throughput at Airports
S/
N
AIRPORT INTERNATIONAL (000) DOMESTIC (000)
201
2
2013 2014 2015 2016 2012 2013 2014 2015 2016
1 Dar es
salaam
110
0
1,136 1192 1251 1301 868 1,077 1155 1141 1061
2 Kilimanjar
o
Internation
al Airport
330 368 362 333 364 236 317 306 318 267
3 Abeid
Aman
Karume
309 336 409 409 540 390 440 437 388 420
4 Arusha 0.1
3
0.079 0 0.008 0.042 149 177 166 130.7
82
155.3
52
5 Bukoba 0.0
26
0.021 0 0.07 0.064 30 26 28 31.78
9
33.04
0
6 Dodoma 0.0
38
0.2 0.1 0.056 0.177 7 11 14 13.01
1
11
7 Kigoma 0.4
4
0.03 0 1.632 1.083 22 26 24 24.4 26.13
7
8 Moshi - - 0 0.013 0.024 0.9 1 1 1.375 1
9 Mtwara 0.0
11
0.073 0 1.231 0.293 56 53 47 29.57
2
22
10 Mwanza 2 13 11 6.413 18 364 420 402 427.4
44
387
11 Shinyanga - - 0 0 0 4 0.02 0 0.445 0
12 Tabora 0.0
01
0.035 0 0.071 0.036 4 5 7 5.586 7
13 Other 18 7 1 2 2.411 165 211 311 135 317
Total
1,760 1,860 1,975 2,004
2,296
2,76
4 2,898 2708
Source: TCAA

37
Table 7.1.2: Incoming International Air Passengers at KIA
Month 2011 2012 2013 2014 2015 2016 TOTAL
Jan 14,656 16,141 18,352 18,461 16,350 17542 101502
Feb 18,462 17,801 22,070 21,169 17,737 18848 116087
Mar 10,397 11,873 14,612 12,486 12,358 12945 74671
Apr 9,243 8,733 9,240 10,088 8,372 9926 55602
May 9,968 10,431 11,346 12,393 11,491 11999 67628
Jun 15,361 15,147 18,043 18,635 16,818 17520 101524
Jul 21,926 22,583 24,576 26,106 23,025 27414 145630
Aug 19,748 21,358 22,980 24,427 21,151 24467 134131
Sep 17,763 19,755 20,456 19,068 18,509 20245 115696
Oct 18,736 19,273 20,517 19,280 16,873 22652 117331
Nov 12,341 12,750 15,568 12,990 13,726 14349 81724
Dec 14,914 17,221 17,247 16,179 16,703 16595 98859
TOTAL 183,515 193,066 215,007 211,282 193,113 214,502 1,210,485
Source: TCAA
Table 7.1.3: Pilots, Aircraft maintenance Engineers & Flight Operations Officer
Description 2011 2012 2013 2014 2015 2016
Private Pilot’s License (Initial) 40 47 46 56 64 76
Conversion of PPL 30 35 33 37 39 42
Conversion of CPL 280 350 338 399 448 504
Conversion of ATPL 40 58 70 115 148 164
Aircraft Maintenance Engineers 260 264 264 264 264 266
Cabin Crew 380 425 443 480 542 614
Source: TCAA
Table 7.1.4: Incoming International Air Passengers at Amani Abeid Karume International Airport
S/N 2011 2012 2013 2014 2015 2016 TOTAL
Jan 15,361 21,778 16,911 18,967 17,594 21764 112375
Feb 15,086 16,912 16,078 16,430 18,180 23137 105823
Mar 11,484 11,594 15,529 13,871 15,141 22271 89890
Apr 4,285 7,149 5,541 7,042 9,190 12800 46007
May 3,195 4,987 5,337 6,455 7,655 10170 37799
Jun 5,042 7,348 7,770 9,890 10,353 10288 50691
Jul 12,794 11,553 12,653 15,401 15,202 19907 87510
Aug 15,977 20,099 16,392 16,867 18,993 22183 110511
Sep 12,914 12,778 12,373 14,638 17,791 20640 91134
Oct 13,823 12,779 15,096 16,730 16,633 24936 99997
Nov 12,862 12,792 13,663 13,142 18,302 24018 94779
Dec 7,659 15,484 19,553 21,146 25,811 30733 120386
TOTAL 130,482 155,253 156,896 170,579 190,845 242,847 1,046,902
Source: TCAA

38
Table 7.1.5: Tanzania Licensed Commercial Air Services Operators
Description 2011 2012 2013 2014 2015 2016
Local Operators 67 70 74 80 53 30
Foreign Operators 1 1 NIL 1 2 7
TOTAL 68 71 74 81 55 37
Source: TCAA
Table 7.1.6: Scheduled Foreign Air Carriers Operating to Tanzania 2016
S/N CARRIER AIRCRAFT TYPE
WEEKLY
FREQUENCY
1 Emirates B773 7
2 Air Mozambique E190 / B737 3
3 Kenya Airways (KQ ) E190 36
4 South African Airlines (SA) A319 / A 320 14
5 Etihad Airways (EY ) A320 7
6 Swiss International Airline (LX ) A333 5
7 Royal Dutch Air (KL ) B 772 7
8 Ethiopian Airlines (ET ) B738 / DH8 16
9 Qatar Airways (QR ) A320 7
10 Ab Aviation (Y6) B 732 / E 120 6
11 Egypt Air (MS) B738 2
12 Rwanda AIR (WB ) DH8 / CRJ 13
13 Oman Air (WY ) B738 14
14 Turkish Air (TK ) B739 7
15 Air Mauritius (MK) A 319 1
16 Air Zimbabwe (UM) A 320 2
17 Malawian Airlines (3W ) DH8 3
18 Martine Air (Cargo) B74F 1
19 Fly Dubai (FZ ) B738 7
20 Air Sychelles A320 2
TOTAL 160
Source: TCAA

39
Table 7.1.7: Schedule of Airports in Tanzania 2015 - 2016
International Airports (Type 1) Strategic
Airports
(Type 2)
Major Domestic
Airports (Type 3)
Small Airports
(Type 4)
Julius Nyerere International Airport
(JNIA)
Arusha Mwanza Biharamulo
Kilimanjaro International Airport
(KIA)
Lake
Manyara
Mtwara Iringa
Aman Abeid Karume International
Airport
Mafia Dodoma Kasulu
Songwe Airport Iringa Kibondo
Kilwa
Masoko
Tabora Kilosa
Loliondo Mbeya Kirondotal
Pemba Songea Kongwa
Musoma Lindi Liuli
Tanga Shinyanga Mafinga
Kigoma Musoma Malya
Mpanda Bukoba Manda
Sumbawanga Manyoni
Lake Manyara Masasi
Maswa
Mbamba Bay
Mkwaja
Mombo
Morogoro
Moshi
Mafinga
Malya
Mpwapwa
Mufindi
Mvumi
Nachingwea
Nansio
Newala
Ngare Nairobi
Ngudu
Njombe
Inyonga
Oldeani
Same
Singida
Tunduru
Urambo
Uvinza
Utete
Source: TCAA

40
Table 7.1.8: Air Transport Accidents and Incidents
S/N PARTICULAR 2011 2012 2013 2014 2015
1. Number of Deaths 1 0 5 7 4
2. Number of Injuries 1 0 1 5 4
3. Number of Fatal Accidents 1 1 1 2 1
4. Number of Minor Accidents 12 1 1 8 2
5. Number of Incidents 12 12 1 11 10
Source: TCAA
Table 7.1.9: Aircraft Movements at Major Airports
S/N AIRPORT
2011
2012 2013 2014
2015 2016
1. JNIA 70,460 75,564 77,185 77,990 75,240 75749
2. ARUSHA 21306 22,716 23,868 23,904 20,810 21564
3. MWANZA 16,334 1,6656 14,273 13,467 13,404 13355
4. DODOMA 2461 3,669 4200 2,966 2,931 2682
5. KIGOMA 1705 1,617 1,759 1,765 1,725 1539
6. TABORA 2148 2,022 1,719 1,597 1,592 1733
7. SONGWE 1255 2,200 2,008 2,029 1,913 1951
8. IRINGA 904 1,946 2,185 1,521 1,484 1778
9. MTWARA 2555 4,359 3,963 3,009 1,494 1028
10. TANGA 2286 3,338 3,444 4,156 4,449 5486
11. ZIA 42,629 44,725 48,044 50,672 51,731 55904
12. KIA 20,967 20,407 21,790 19,942 19,758 20750
Total 185,010 199,219 204,438 203,018 196,531 203,519
Source: TCAA

41
7.2 Summary of TAA Statistics
Table 7.2.1: Capacities of Selected Airports
S/N Detail DSM International
Airport Mwanza Airport
1. Runway Size(Width Including Shoulders) 3000X60 m 3300X45 m
2. Passenger handled Year 2015 2,496,394 444,215
Passenger handled Year 2016 2,469,356 400,457
3. Cargo (tons) handled Year 2015 22,013
1,961
Cargo (tons) handled Year 2016 17,398
2,170
Source: TAA
Table 7.2.2: Domestic Air Traffic
SN AIRPORT
AC
MOVEMENTS PASSENGERS
FREIGHT
(TONS) MAIL (TONS)
1 JNIA 2015 2016 2015 2016 2015 2016 2015 2016
Scheduled 15,020 15,672 862,487 763,326 597 461 206 150
Non-Scheduled 40,521 39,976 278,918 296,010 67 70 0 0
Others 647 517 4,235 1,957 NIL NIL NIL NIL
Table 7.2.3: Incoming International Air Passengers at JNIA
S/N 2010 2011 2012 2013 2014 2015 2016
January 33,097 39,287 41,210 45,237 45,630 50,007 49,722
February 27,976 31,590 39,156 39,779 39,331 42,667 44,510
March 30,802 34,056 39,133 44,961 42,001 46,192 48,405
April 29,541 35,277 37,221 38,417 41,799 46,862 45,503
May 32,270 38,695 39,790 40,575 45,328 44,322 47,679
June 38,602 43,146 46,341 48,330 51,294 55,791 50,531
July 43,118 53,901 54,795 54,138 53,134 61,125 65,538
August 38,140 42,735 49,577 50,549 53,779 63,520 59,009
September 32,942 38,416 42,336 46,838 44,759 49,933 54,245
October 35,965 41,473 46,514 49,802 50,986 51,116 60,192
November 36,559 40,072 44,514 44,429 50,074 50,232 45,178
December 42,132 45,958 49,854 46,702 54,494 55,685 55,442
TOTAL 421,144 484,606 530,441 549,757 572,609 617,452 625,954
%Change -4.6 10.1 15.1 9.5 4.2 7.8
Source: TAA

42
Table 7.2.4: Main Airports Operation Statistics
AIRPORT OPERATI
ON 2010 2011 2012 2013 2014 2015 2016
JNIA Aircraft
Movements 62,620 70,460 75,564 77,185 77,990 75,240 75,749
Passengers
1,556,4
10
1,829,2
19
2,088,2
82
2,348,81
9
2,478,00
5
2,496,39
4
2,469,
356
Freight(To
ns) 18,746 22,971 24,370 20,951 20,352 21,356 16,788
Mail(Tons) 929 975 1,042 940 903 657 610
MWANZA Aircraft
Movements 14,118 16334 16,962 44,643 13,467 13,404 13,355
Passengers
227,47
9
319,74
9
392,29
8 439,128 415,674 444,215
400,45
7
Freight(To
ns) 2,323 1,950 1,769 1,905 1,900 1,826 2,050
Mail(Tons) 96 104 136 53 88 135 120
ARUSHA Aircraft
Movements 19,460 21,306 22,690 23,868 23,904 20,692 21,564
Passengers
154,17
4
112,43
3
162,26
8 187,911 179,511 142,224
164,41
9
Freight(To
ns) 803 41 192 213 148 141 63
Mail(Tons) 10 0 0 - 0 0 0
MTWARA Aircraft
Movements 1954 2,555 4,437 4,024 2,719 1,538 1,028
Passengers 27,582 41,127 56,620 53,062 45,988 33,330 22,681
Freight(To
ns) 80 102 196 186 90 16 8
Mail(Tons) 44 44 55 63 76 18 10
Source: TAA

43
CHAPTER EIGHT
8.0 METEOROLOGICAL INFORMATION
Table 8.1: Annual Rainfall in Tanzania
Note: M - Indicates missing value * Indicates incomplete data
Source: TMA Database, 2016
Table 8.2: Mean Annual Maximum Temperature (°C) in Tanzania
S/N Station 2011 2012 2013 2014 2015 2016
1 Bukoba 2224.1 2280.0 1863.3 2227.2 1755.1 1452.9
2 Mwanza 1131.8 1306.9 766.2 582.6 1536.6 1039.3
3 Musoma 1271.4 681.7 798.5 720.9 1037.8 627.2
4 Kigoma 1078.2 735.3 830.1 832.7 967.8 913.5
5 Mpanda 425.4* 332.9 719.4 1085.7 M 685.1
6 Sumbawanga 938.4 854.0 573.6 371.5 819.2 769.1
7 Tabora 901.3 810.0 999.9 826.5 959.6 911.6
8 Singida 588.6 546.5 859.1 778.2 628.3 689.4
9 Dodoma 643.1 639.9 394.5 489.7 473.7 545.2
10 Iringa 770.8 545.3 487.4 885.5 517.1 757.6
11 Loliondo M M 498.9 M 767.0 M
12 EngareRongai 1097.0 473.9 395.4 320.0 643.3 601.6
13 Same 438.9 411.8 532.2 498.2 519.3 626.7
14 Arusha 759.1 485.9 689.4 1188.5 669.7 603.5
15 KIA 492.0 429.7 492.6 501.7 485.3 492.5
16 Lushoto 617.7* 1039.0 203.2 1820.20 767.0 759.9
17 Tanga 1391.2 643.9 1072.7 1079.0 1619.6 1003.6
18 Ilonga 1567.2 554.4 939.8 963.8 929.2 1143.7
19 JNIA 1312.9 702.1 732.2 1278.9 1038.4 782.9
20 Mtwara 1223.0 646.3 1157.1 1023.9 1068.9 1454.8
21 Songea 1158.7 896.0 1004.4 1010.8 830.5 952.6
22 Tunduru 527.3* M 756.6 861.5 M 1180
23 Mahenge 1619.3 1256.2 2154.7 2467.8 1691.3 1999.0
24 Mbeya 1074.2 660.4 553.2 1220.3 692.7 M
S/No. Station 2011 2012 2013 2014 2015 2016
1 Bukoba 26.2 26.4 26.5 26.4 26.6 26.7
2 Mwanza 28.2 28.4 28.7 28.3 28.9 28.9
3 Musoma 28.2 28.7 28.9 28.2 28.7 M
4 Kigoma 29.1 29.5 29.2 28.1 29.1 29.9
5 Sumbawanga 25.2 25.3 25.2 25.2 25.3 25.6
6 Tabora 29.0 30.3 30.2 29.5 30.0 30.4
7 Singida 27.9 27.5 27.1 26.8 27.3 26.8
8 Dodoma 27.9 27.5 27.1 29.1 29.4 29.4

44
Source: TMA
Table 8.3: Mean Annual Minimum Temperature (°C) in Tanzania
S/N Station 2011 2012 2013 2014 2015 2016
1 Bukoba 18.1 17.8 18.1 18.4 18.2 18.9
2 Mwanza 17.9 18.0 17.7 18.6 18.2 18.5
3 Musoma 18.4 18.1 18.7 17.9 18.3 M
4 Kigoma 19.1 19.3 19.4 19.9 19.5 20.0
5 Sumbawanga 23.6 12.2 11.5 16.5 18.6 14.0
6 Tabora 17.6 17.8 17.6 16.9 17.3 15.8
7 Singida 16.4 16.0 16.0 16.1 16.1 16.1
8 Dodoma 17.5 17.7 17.8 17.9 17.7 17.6
9 Iringa 15.4 15.4 14.7 15.5 15.2 15.1
10 Same 18.8 19.0 18.6 18.7 18.8 18.6
11 Arusha 15.3 15.0 14.4 15.3 15.2 15.3
12 Kilimanjaro 18.4 18.0 17.6 17.1 17.7 18.6
13 Tanga 23.4 23.4 23.2 22.0 23.1 23.6
JNIA 22.3 22.4 22.3 22.5 22.5 23.2
14 Ilonga 20.4 20.6 22.3 21.2 20.4 19.5
16 Mtwara 21.3 20.7 20.9 21.2 21.3 20.6
17 Songea 16.2 15.4 14.2 15.7 14.4 15.4
18 Mahenge 17.5 16.8 17.3 17.0 17.1 17.7
19 Mbeya 11.4 11.7 10.9 14.1 14.0 M
Source: TMA
Table 8.4 Number of flights served with meteorology services
Years 2011 2012 2013 2014 2015 2016
Number of
flights served
15,710 18,133 21,658 24,683 38,761 40,082
9 Iringa 29.3 29.2 29.6 26.4 27.3 27.2
10 Same 27.5 27.7 27.4 29.6 30.7 29.8
11 Arusha 29.9 30.7 30.0 25.8 26.2 26.6
12 Tanga 31.5 31.1 30.3 29.7 30.1 31.4
13 Ilonga 30.4 31.1 30.9 30.5 31.1 30.2
14 JNIA 31.8 32.2 32.1 32.0 32.0 31.3
15 Mtwara 30.6 30.5 30.9 30.7 30.8 30.8
16 Songea 27.4 27.5 27.3 26.7 27.2 28.0
17 Mahenge 25.5 25.4 25.2 25.3 25.4 25.8
18 Mbeya 24.6 25.1 24.6 23.7 24.8 M

45
Table 8.5 Number of tailored customers served with meteorology services
Years 2011 2012 2013 2014 2015 2016
Number of tailored
customers served
390 435 342 524 133 268
Table 8.6 Number of boats and ships served at Dar es Salaam port office.
Number of forecasts issued to baoats and ships
Years
African
shipping
Co. LTD
Fast
Ferries
LTD
Mega
Speed
Liners
LTD.
Sea star
services
LTD
Azam
Marine
co.LTD
Sea
Transport
Shipping
Co. LTD
Total
forecast
2011 331 323 22 306 1,415 173 2,570
2012 243 259 30 169 1,412 138 2,251
2013 354 295 75 156 1,351 22 2,253
2014 2,880
2015 2,651
2016 2,586
Table 8.7: Describes the gap between meteorological network requirements and current Situation
in Tanzania
Description Number of stations
Current Operational Needed Shortage
Conventional Surface synoptic
stations
29 29 32 3
AWS Surface synoptic stations 48 46 113 65
Agro-meteorological stations 15 15 20 5
Ordinary climate stations 150 60 250 100
Rainfall stations 2056 500 500 -
Automatic Rainfall stations 0 0 2500 2500
Marine weather station 0 0 12 12
Upper air stations 1 1 4 3
Pilot Balloon 1 0 5 5
Weather Radar 2 2 7 5
Lightning 0 0 10 10
Orbiting satellite receiver 0 0 1 1
Buoy 0 0 10 10
Source: TMA

46
CHAPTER NINE
9.0 TRAINNING INSTITUTIONS
9.1 NATIONAL INSTITUTE OF TRANSPORT (NIT)
Table 9.1.1: Training Programs at the Institute for the Year 2016/ 2017
S/N Programme Name Exit point
1 Air Transport Management PGD
2 Transport and Tourism Management PGD
3 Shipping and Port Management PGD
4 Transport Economics PGD
5 Rail Transport Management PGD
6 Road Safety Management PGD
7 Transport Engineering PGD
8 Logistics and Transport Management 4,5,6,7,8,PGD,9
9 Automobile Engineering 4,5,6,7,8
10 Procurement and Logistics Management 4,5,6,7,8,PGD,9
11 Accounting and Transport Finance 4,5,6,7,8
12 Aircraft Maintenance Engineering 4,5,6,7,8
13 Business Administration 4,5,6,7,8,9
14 Mechanical Engineering 4,5,6,7,8
15 Freight, Clearing and Forwarding 4,5,6
16 Information Technology 4,5,6,7,8
17 Computer Science 7,8
18 Marketing and Public Relations 4,5,6,7,8
19 Human Resource Management 4,5,6,7,8
20 Education with Mathematics and Information
Technology
7,8
21 *Master of Business Administration in Logistics and
Transport Management
9
22 **International Course in Logistics and Transport Certificate, Diploma &
Advanced Diploma
23 Professional Driving Short Courses Short course
* Programme conducted in collaboration with Open University of Tanzania (OUT)
** Programme conducted in collaboration with Chartered Institute of Logistics and Transport
(CILT) - UK

47
Table 9.1.2. Students of the Master of Business Administration in Logistics and Transport
Management
YEAR SEX TOTAL
Male Female
2011/2012 24 2 26
2012/2013 12 1 13
2013/2014 10 0 10
2014/2015 20 1 21
2015/2016 17 4 21
2016/2017 3 4 7
Source: NIT-Registrar's Office, 2016
Table 9.1.3. Students of the Master of Science in Logistics and Transport Management
YEAR SEX TOTAL
Male Female
2016/2017 10 0 10
SUB TOTAL 10 0 10
GRAND TOTAL 10
Table 9.1.4: Postgraduate Diploma in Logistics and Procurement Management
YEAR SEX TOTAL
Male Female
2012/2013 11 5 16
2013/2014 14 4 18
2014/2015 6 5 11
2015/2016 8 1 9
2016/2017 1 1 2
Source: NIT-Registrar's Office, 2016

48
Table 9.1.5: Postgraduate Diploma in Logistics Transport Management
YEAR SEX TOTAL
Male Female
2012/2013 6 3 9
2013/2014 13 1 14
2014/2015 12 1 13
2015/2016 9 3 12
2016/2017 4 0 4
Source: NIT-Registrar's Office, 2016
Table 9.1.6: Postgraduate Diploma in Air Transport Management
YEAR SEX TOTAL
Male Female
2012/2013 27 8 35
2013/2014 11 7 18
2014/2015 8 3 11
2015/2016 8 5 13
2016/2017 4 2 6
Source: NIT-Registrar's Office, 2016
Table 9.1.7: Postgraduate Diploma in Shipping and Port Management
YEAR SEX TOTAL
Male Female
2012/2013 19 9 28
2013/2014 32 11 42
2014/2015 20 5 25
2015/2016 29 5 34
2016/2017 6 5 11
Source: NIT-Registrar's Office, 2016

49
Table 9.1.8: Postgraduate Diploma in Transport and Tourism Management
YEAR SEX TOTAL
Male Female
2012/2013 2 0 2
2013/2014 1 0 1
2014/2015 0 0 0
2015/2016 0 0 0
2016/2017 0 0 0
Source: NIT-Registrar's Office, 2016
Table 9.1.9: Postgraduate Diploma in Road Safety Management
YEAR SEX SUB TOTAL
Male Female
2013/2014 4 0 4
2014/2015 0 0 0
2015/2016 5 0 5
2016/2017 0 0 0
Source: NIT-Registrar's Office, 2016
Table 9.1.10: Postgraduate Diploma in Transportation Engineering
YEAR SEX TOTAL
Male Female
2013/2014 4 1 5
2014/2015 5 1 6
2015/2016 3 0 3
2016/2017 0 0 0
Source: NIT-Registrar’s Office, 2016
Table 9.1.11: Students of the Bachelor Degree in Logistics and Transport Management (BLTM)
YEAR FIRST YEAR SECOND YEAR THIRD YEAR SUB TOTAL GRAND
TOTAL
Male Female Male Female Male Female Male Female
2008/2009 18 5 0 0 0 0 18 5 23
2009/2010 19 1 16 5 0 0 35 6 41
2010/2011 7 2 15 1 13 5 35 8 43
2011/2012 37 6 7 2 13 2 57 10 67
2012/2013 36 6 27 5 7 1 70 12 82
2013/2014 120 29 33 6 28 5 181 40 221

50
2014/2015 214 65 120 29 37 9 371 103 474
2015/2016 270 110 212 64 110 29 592 203 795
2016/2017 412 151 187 79 170 62 769 292 1,061
Source: NIT-Registrar's Office, 201
Table 9.1.12: Students of the Bachelor Degree in Freight clearing and Forwarding (BFCF)
YEAR FIRST YEAR SECOND YEAR THIRD YEAR SUB TOTAL GRAND
TOTAL
Male Female Male Female Male Female Male Female
2008/2009 12 2 0 0 0 0 12 2 14
2009/2010 8 1 12 1 0 0 20 2 22
2010/2011 1 2 5 1 10 1 16 4 20
2011/2012 0 0 1 2 7 1 8 3 11
2012/2013 0 0 0 0 1 1 1 1 2
2013/2014 - - - - 1 - 1 0 1
2014/2015 - - - - - - - - -
2015/2016 - - - - - - - - -
2016/2017 - - - - - - - - -
Source: NIT-Registrar's Office, 2016
Table 9.1.13: Students of the Bachelor Degree in Automobile Engineering (BAE)
YEAR FIRST YEAR SECOND
YEAR
THIRD
YEAR
FOURTH
YEAR
SUB TOTAL GRAND
TOTAL
Male Female Male Female Male Female Male Female Male Female
2008/2009 15 0 0 0 0 0 15 0 15
2009/2010 7 0 14 0 0 0 21 0 21
2010/2011 6 1 6 0 12 0 24 1 25
2011/2012 11 0 5 1 5 0 21 1 22
2012/2013 24 2 11 0 5 1 40 3 43
2013/2014 61 5 8 - 3 - 72 5 77
2014/2015 36 2 29 0 27 2 8 0 100 4 104
2015/2016 83 1 92 3 45 4 27 2 247 9 257
2016/2017 78 15 58 1 44 1 40 5 220 22 242
Source: NIT-Registrar's Office, 2016
Table 9.1.14: Students of the Bachelor Degree in Mechanical Engineering (BME)
YEAR FIRST
YEAR
SECOND
YEAR
THIRD
YEAR
FOURTH
YEAR
SUB TOTAL GRAND
TOTAL
Male Female Male Female Male Female Male Female Male Female
2014/2015 122 0 32 1 0 0 0 0 154 1 155
2015/2016 129 10 175 11 39 0 14 0 357 21 78
2016/2017 179 14 78 8 199 13 33 0 489 35 524
Source: NIT-Registrar's Office, 2016
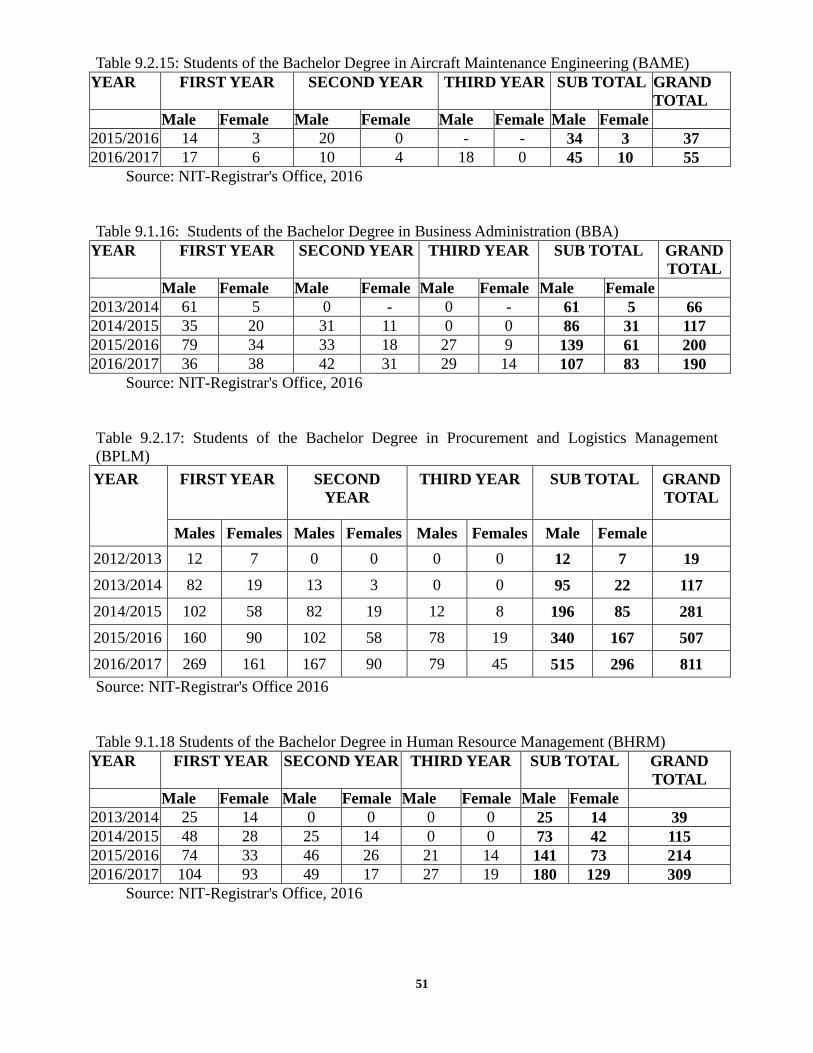
51
Table 9.2.15: Students of the Bachelor Degree in Aircraft Maintenance Engineering (BAME)
YEAR FIRST YEAR SECOND YEAR THIRD YEAR SUB TOTAL GRAND
TOTAL
Male Female Male Female Male Female Male Female
2015/2016 14 3 20 0 - - 34 3 37
2016/2017 17 6 10 4 18 0 45 10 55
Source: NIT-Registrar's Office, 2016
Table 9.1.16: Students of the Bachelor Degree in Business Administration (BBA)
YEAR FIRST YEAR SECOND YEAR THIRD YEAR SUB TOTAL GRAND
TOTAL
Male Female Male Female Male Female Male Female
2013/2014 61 5 0 - 0 - 61 5 66
2014/2015 35 20 31 11 0 0 86 31 117
2015/2016 79 34 33 18 27 9 139 61 200
2016/2017 36 38 42 31 29 14 107 83 190
Source: NIT-Registrar's Office, 2016
Table 9.2.17: Students of the Bachelor Degree in Procurement and Logistics Management
(BPLM)
YEAR FIRST YEAR SECOND
YEAR
THIRD YEAR SUB TOTAL GRAND
TOTAL
Males Females Males Females Males Females Male Female
2012/2013 12 7 0 0 0 0 12 7 19
2013/2014 82 19 13 3 0 0 95 22 117
2014/2015 102 58 82 19 12 8 196 85 281
2015/2016 160 90 102 58 78 19 340 167 507
2016/2017 269 161 167 90 79 45 515 296 811
Source: NIT-Registrar's Office 2016
Table 9.1.18 Students of the Bachelor Degree in Human Resource Management (BHRM)
YEAR FIRST YEAR SECOND YEAR THIRD YEAR SUB TOTAL GRAND
TOTAL
Male Female Male Female Male Female Male Female
2013/2014 25 14 0 0 0 0 25 14 39
2014/2015 48 28 25 14 0 0 73 42 115
2015/2016 74 33 46 26 21 14 141 73 214
2016/2017 104 93 49 17 27 19 180 129 309
Source: NIT-Registrar's Office, 2016

52
Table 9.2.19 Students of the Bachelor Degree in Marketing and Public Relations (BMPR)
YEAR FIRST YEAR SECOND
YEAR
THIRD YEAR SUB TOTAL GRAND TOTAL
Male Female Male Female Male Female Male Female
2015/2016 25 15 0 0 0 0 25 15 40
2016/2017 62 62 15 8 0 0 77 70 147
Source: NIT-Registrar's Office, 2016
Table 9.1.20 Students of the Bachelor Degree in Accounting and Transport Finance (BATF)
YEAR FIRST YEAR SECOND
YEAR
THIRD YEAR SUB TOTAL GRAND TOTAL
Male Female Male Female Male Female Male Female
2015/2016 106 36 0 0 0 0 106 36 142
2016/2017 89 58 61 24 8 2 158 84 242
Source: NIT-Registrar's Office, 2016
Table 9.1.21: Students of the Bachelor Degree of Education with Mathematics and
Information Technology (BEMIT)
YEAR FIRST YEAR SECOND YEAR THIRD YEAR SUB TOTAL GRAND
TOTAL
Male Female Male Female Male Female Male Female
2015/2016 100 15 0 0 0 0 100 15 115
2016/2017 68 24 71 6 0 0 139 30 169
Source: NIT-Registrar's Office, 2016
Table 9.1.22: Students of the Bachelor Degree in Information Technology (BIT)
YEAR FIRST YEAR SECOND YEAR THIRD YEAR SUB TOTAL GRAND
TOTAL
Male Female Male Female Male Female Male Female
2013/2014 34 2 - - - - 34 2 36
2014/2015 42 7 34 2 0 0 76 4 80
2015/2016 127 20 42 7 24 2 193 29 222
2016/2017 198 42 73 10 27 4 298 56 354
Source: NIT-Registrar's Office, 2016
Table 9.1.23: Students of the Bachelor Degree in Computer Science (BCS)
YEAR FIRST YEAR SECOND YEAR THIRD YEAR SUB TOTAL GRAND
TOTAL
Male Female Male Female Male Female Male Female
2015/2016 42 7 0 0 0 0 42 7 49
2016/2017 33 12 31 4 0 0 64 16 80
Source: NIT-Registrar's Office, 2016

53
Table 9.1.24: Students of Diploma in Automobile Engineering (DAE)
YEAR
FIRST YEAR
(NTA LEVEL
4)
SECOND YEAR
(NTA LEVEL 5)
THIRD YEAR
(NTA LEVEL 6)
SUB TOTAL GRAND
TOTAL
Males Females Males Females Males Females Males Females
2003/2004 36 - 34 - 13 2 83 2 85
2004/2005 29 1 33 - 34 - 96 1 97
2005/2006 24 0 24 1 33 0 81 1 82
2006/2007 20 0 17 1 24 0 61 1 62
2007/2008 8 0 20 0 17 1 45 1 46
2008/2009 22 0 8 0 20 0 50 0 50
2009/2010 15 0 20 0 7 0 42 0 42
2010/2011 31 2 16 0 17 0 64 2 66
2011/2012 51 2 30 2 13 0 94 4 98
2012/2013 23 0 63 3 30 0 86 33 119
2013/2014 29 2 30 1 60 3 119 6 125
2014/2015 25 0 29 2 27 0 81 2 83
2015/2016 24 0 25 0 27 2 76 2 78
2016/2017 5 1 53 3 20 0 78 4 82
Source: NIT-Registrar's Office, 2016
Table 9.1.25: Students of the Diploma in Mechanical Engineering (DME)
YEAR
FIRST YEAR
(NTA LEVEL 4)
SECOND
YEAR
(NTA LEVEL
5)
THIRD YEAR
(NTA LEVEL 6)
SUB TOTAL GRAND
TOTAL
Males Females Males Females Males Females Male Femal
e
2012/2013 75 2 0 0 0 0 75 2 79
2013/2014 70 0 81 3 - - 151 3 154
2014/2015 23 1 70 4 73 3 166 8 174
2015/2016 35 0 27 1 62 1 124 2 126
2016/2017 15 2 107 7 25 0 147 9 156
Source: NIT-Registrar's Office 2016
Table 9.1.26: Students of the Diploma in Logistics and Transport Management (DLTM)
YEAR
FIRST YEAR
(NTA LEVEL 4)
SECOND YEAR
(NTA LEVEL 5)
THIRD YEAR
(NTA LEVEL 6)
SUB TOTAL GRAND
TOTAL
Males Females Males Females Males Females Males Females 2006/2007 32 8 Not
Started
Not
Started
Not
Started
Not
Started
32 8 40
2007/2008 31 8 30 8 Not
Started
Not
Started
61 16 77

54
2008/2009 20 0 59 17 30 8 109 25 134 2009/2010 38 14 26 7 50 15 114 36 150 2010/2011 78 37 39 14 33 10 150 61 211 2011/2012 112 43 85 40 39 14 236 95 331 2012/2013 153 48 131 49 70 38 354 135 489 2013/2014 235 86 165 58 132 51 532 195 727 2014/2015 225 25 205 80 152 61 582 166 748 2015/2016 192 60 258 86 200 78 650 224 874
2016/2017 83 43 213 91 159 75 460 209 669
Source: NIT-Registrar's Office, 2016
Table 9.1.27: Students of the Diploma in Information Technology (DIT)
YEAR
FIRST YEAR
(NTA LEVEL 4)
SECOND YEAR
(NTA LEVEL 5)
THIRD YEAR
(NTA LEVEL 6)
SUB TOTAL GRAND
TOTAL
Males Females Males Females Males Females Male Female
2007/2008 16 7 - - 0 0 16 7 23 2008/2009 60 11 15 6 15 6 75 17 92 2009/2010 37 4 52 12 55 9 92 13 105 2010/2011 22 2 21 3 21 3 47 7 54 2011/2012 29 2 21 2 22 2 51 3 54 2012/2013 24 1 21 3 22 3 87 7 94 2013/2014 41 1 41 7 20 3 101 11 112 2014/2015 21 1 45 3 32 6 98 10 108 2015/2016 10 2 30 1 65 5 105 8 113 2016/2017 50 14 32 9 24 8 106 31 137
Source: NIT-Registrar's Office, 2016
Table 9.1.28: Students of the Diploma in Freight Clearing and Freight Forwarding (DFCF)
YEAR
FIRST YEAR
(NTA LEVEL 4)
SECOND
YEAR (NTA
LEVEL5)
THIRD YEAR
(NTA LEVEL 6)
SUB TOTAL GRAND
TOTAL
Males Females Males Female Male Female Males Females 2000/2001 7 0 NS 0 NS NS 7 0 7 2001/2002 5 0 NS 0 3 0 8 0 8 2002/2003 7 0 5 0 7 0 19 0 19 2003/2004 10 2 7 0 5 0 22 2 24 2004/2005 32 8 10 2 10 42 10 32 2005/2006 26 13 28 6 10 2 64 21 85 2006/2007 23 6 19 11 32 8 74 25 99 2007/2008 26 8 21 6 14 7 61 21 82 2008/2009 25 8 39 9 20 6 84 23 107 2009/2010 43 22 35 12 29 11 107 45 152 2010/2011 35 19 37 13 30 11 102 43 145 2011/2012 52 22 34 19 35 12 121 53 174 2012/2013 71 24 40 20 33 19 144 63 207

55
2013/2014 64 28 65 16 41 19 170 63 233 2014/2015 49 31 64 28 31 13 144 72 216 2015/2016 41 26 56 35 45 28 142 89 231 2016/2017 18 11 24 10 16 21 58 42 100
Source: NIT-Registrar's Office, 2016
Table 9.1.29 Students of the Diploma in Procurement and Logistics Management (DPLM)
YEAR
FIRST YEAR
(NTA LEVEL
4)
SECOND
YEAR (NTA
LEVEL 5)
THIRD YEAR
(NTA LEVEL 6)
SUB TOTAL GRAND
TOTAL
Male
s
Females
Males Females Males Females Males Females
2011/2012 31 39 0 0 0 0 31 39 70
2012/2013 103 82 31 39 0 0 134 121 255
2013/2014 143 104 134 82 36 36 313 222 535
2014/2015 103 83 143 104 102 74 348 261 609
2015/2016 43 46 119 117 127 89 289 252 541
2016/2017 15 15 51 39 71 73 137 127 264
Source: NIT-Registrar's Office, 2016
Table 9.1.30: Students of the Diploma in Business Administration (DBA)
YEAR
FIRST YEAR
(NTA LEVEL 4)
SECOND
YEAR
(NTA
LEVEL 5)
THIRD YEAR
(NTA LEVEL 6)
SUB
TOTAL
GRAND
TOTAL
Males Females Males Females Males Females Males Females
2012/2013 11 24 - - - - 11 24 35
2013/2014 21 21 11 24 2 8 34 53 87
2014/2015 15 11 21 21 20 12 56 44 100
2015/2016 12 8 17 15 33 10 62 43 105
2016/2017 7 3 12 10 10 8 29 21 50
Source: NIT-Registrar's Office 2015.

56
Table 9.1.31: Students of the Diploma in Human Resource Management (DHRM)
YEAR
FIRST YEAR
(NTA LEVEL 4)
SECOND
YEAR
(NTA LEVEL 5)
THIRD
YEAR
(NTA LEVEL 6)
SUB
TOTAL
GRAND
TOTAL
Males Females Males Females Males Females Males Female
s
2012/2013 17 10 0 0 0 0 17 10 27
2013/2014 12 16 9 5 0 0 21 21 42
2014/2015 4 1 21 21 6 5 31 27 58
2015/2016 7 8 5 2 8 13 20 23 43
2016/2017 6 6 10 6 0 0 16 12 28
Source: NIT-Registrar's Office, 2016
Table 9.1.32: Students of the Diploma in Accounting and Transport Finance (DATF)
YEAR
FIRST YEAR
(NTA LEVEL 4)
SECOND YEAR
(NTA LEVEL 5)
THIRD YEAR
(NTA LEVEL 6)
SUB TOTAL GRAND
TOTAL
Males Females Males Females Males Females Male Female
2014/2015 15 13 26 9 7 6 48 28 76
2015/2016 16 17 27 18 7 6 50 41 91
2016/2017 16 6 26 14 13 11 55 31 86
Source: NIT-Registrar's Office, 2016
Table 9.1.33: Students of the Diploma in Marketing and Public Relations (DMPR)
YEAR
FIRST YEAR
(NTA LEVEL 4)
SECOND YEAR
(NTA LEVEL 5)
THIRD YEAR
(NTA LEVEL 6)
SUB
TOTAL
GRAND
TOTAL
Males
Females
Males Females Males Females Males Females
2014/2015 1 3 5 1 0 0 6 4 10
2015/2016 4 2 5 5 1 5 10 12 22
2016/2017 7 5 2 1 3 2 12 8 20
Source: NIT-Registrar's Office, 2016

57
Table 9.1.34: International Introductory Certificate in Logistics and Transport
YEAR SEX SUB TOTAL
Male Female
2011/2012 11 4 15
2012/2013 17 10 27
2013/2014 9 1 10
2014/2015 1 1 2
2015/2016 19 14 33
2016/2017 3 2 5
Source: NIT-Registrar's Office, 2016
Table 9.1.35: International Certificate in Logistics and Transport
YEAR SEX SUB TOTAL
Male Female
2011/2012 11 4 15
2012/2013 17 10 27
2013/2014 12 3 15
2014/2015 1 1 2
2015/2016 23 8 31
2016/2017 12 2 14
Source: NIT-Registrar's Office, 2016
Table 9.1.36: International Diploma in Logistics and Transport
YEAR SEX SUB TOTAL
Male Female
2010/2011 14 1 15
2011/2012 12 3 15
2012/2013 14 18 32
2013/2014 11 4 15
2014/2015 38 11 49
2015/2016 81 9 90
2016/2017 35 9 44
Source: NIT-Registrar's Office, 2016

58
Table 9.1.37: International Advanced Diploma in Logistics and Transport
YEAR SEX SUB TOTAL
Male Female
2011/2012 15 4 19
2012/2013 35 12 47
2013/2014 13 2 15
2014/2015 11 3 14
2015/2016 31 11 42
2016/2017 62 6 68
Source: NIT-Registrar's Office, 2016
Table 9.1.38: Students of Short Course and Advanced Driving Courses
S/
N
Courses
2004
2005
2006
2007
2008
2009
2010
2011
2012
2013
2014
2015
2016
1 Advanced
Driving
Grade I
112 151 90 104 118 152 113 124 168 118 145 1,2
27
192
2 Advanced
Driving
Grade II
Industrial
562 685 442 455 592 532 654 454 197 156 229 59 42
3 Advanced
Driving
Grade II
VIP
155 224 120 267 432 581 1,0
64
790 794 549 1,0
55
1,2
27
1,21
6
4 PSV
Drivers
Course
132 80 70 170 118 335 2,4
22
4,6
06
3,0
13
1,9
91
2,4
04
2,3
87
3,27
1
5 HGV
Drivers
course
75 72 32 0 0 0 0 0 0 33 26 27 34
6 Special
Defensive
Driving
course
207 0 0 439 0 221 253 209 136 124 87 96 235
7 Senior
Driving
Course
0 0 5 10 14 20 5 6 20 12 34 18 26
8 Motor cycle - 0 0 0 0 0 0 0 703 225 359 0
9 Driver
Instructors
13 3 2 0 12 2 0 0 12 8 3 0 14
10 Folk Lift 0 0 8 0 0 0 0 0 0 50 5 20 185

59
S/
N
Courses
2004
2005
2006
2007
2008
2009
2010
2011
2012
2013
2014
2015
2016
Operators
11 Vehicle
Inspection
and
Appraisal
0 0 5 0 19 14 31 0 0 - 0 0
12 Vehicle
Inspection
Drivers &
Examiner
0 12 92 12 0 0 31 12 26 13 64 38 49
13 Diesel&
Engine
Service
Maintenanc
e
7 3 0 32 0 36 0 0 26 0 - 0 0
14 Transport
Information
System
Course for
PMOLARG
Officers
336 0 0 0 0 21 18 14 0 0 - 0 0
15 Auto
electrical
and
electronics
0 0 0 5 0 0 0 0 13 0 - 0 0
16 PSV Agents
and
Ticketing
Clack
Customer
care
0 0 0 0 0 0 0 0 202 0 - 0 0
17 Vehicle
Fleet
Managemen
t
0 0 0 0 0 0 0 0 12 5 - 0 0
18 Transport
Officers
0 0 0 0 0 0 0 0 0 8 15 0 0
GRAND TOTAL 1,32
9
1,59
9
866 1,4
94
1,2
86
1,9
19
4,5
74
6,2
46
5,3
12
3,2
92
4,4
26
5,0
99
5,26
4
Source: NIT-Registrar's Office, 2016

60
Table 9.1.39: Academic Staff by Qualifications and Gender
2014/2015 2015/2016 2016/2017
S/NO. Qualification Male Female Male Female Male Female
1. PhD 5 2 2 1 11 2
2. Masters 29 7 18 3 51 30
3 Postgraduate
Diploma
3 0 0 0 0 0
4. First Degree 10 1 13 8 38 11
5. Advanced
Diploma 4
0 0 0 0 0
6. Diploma 5 0 0 0 4 0
Sub Total 56 10 33 12 104 43
Grand Total 66 45 147
Source: NIT-Registrar's Office, 2016
9.2 : DAR ES SALAAM MARITIME INSTITUTE (DMI)
Table 9.2.1: Course Programs at DMI (2016)
S/N COURSE TITLE
1. Bachelor Degree in maritime transportation
2 Bachelor Degree in Marine Engineering and Technology
3 Ordinary Diploma in Maritime Transportation(NTA level 6)
4 Ordinary Diploma in Marine Engineering(NTA level 6)
5 Certificate in Marine Operations
6 Master and Chief Mate
7 Chief Engineer and Second Engineer Officer
8 Officer in Charge of Navigational watch
9. Master Near - Coastal
10 Officer in Charge of Navigational Navigational watch near coastal
(00w<500GT)
11 Officer in charge of an Engineering Watch
12 Engineering Class 4
13 Short Courses
*Course improved to degree

61
Table 9.2.2 Degree in Maritime Transportation
YEAR
FIRST YEAR SECOND
YEAR
THIRD YEAR FOURTH
YEAR
TOTAL
Male Female Male Female Male Female Male Female
2012/2013 - - -
2013/2014 15 2 - - - - 17
2014/2015 31 1 16 2 50
2015/2016 33 5 27 `1 16 2 84
Source: DMI
Table 9.2.3. Degree in Marine Engineering Technology
YEAR
FIRST YEAR SECOND YEAR THIRD YEAR FOURTH
YEAR
TOTA
L
Male Female
2012/2013 - - -
2013/2014 16 1 - - - - 17
2014/2015 30 2 15 1 48
2015/2016 39 2 20 1 12 1 75
Source: DMI
Table 9.2.4. Ordinary Diploma in Maritime Transportation
YEAR FIRST YEAR TOTAL
Male Female
2012/2013 21 1 22
2013/2014 11 2 13
2014/2015 19 1 20
2015/2016 11 1 12
Source: DMI
Table 9.2.5 Ordinary Diploma in Marine Engineering
YEAR FIRST YEAR TOTAL
Male Female
2012/2013 16 - 16
2013/2014 19 0 19
2014/2015 20 2 22
2015/2016 30 30
Source: DMI

62
Table 9.2.6. Technical Certificate in Maritime Transportation
YEAR FIRST YEAR TOTAL
Male Female
2012/2013 19 1 20
2013/2014 20 2 22
2014/2015 15 2 17
2015/2016 13 1 14
Source: DMI
Table 9.2.7. Technical Certificate in Marine Engineering
YEAR FIRST YEAR TOTAL
Male Female
2012/2013 22 - 22
2013/2014 21 2 23
2014/2015 40 14 41
2015/2016 42 2 44
Source: DMI
Table 9.2.8 Basic Certificate in Marine Operation
YEAR FIRST YEAR TOTAL
Male Female
2012/2013 49 4 53
2013/2014 67 3 70
2014/2015 72 4 76
2015/2016 64 3 67
Source: DMI
Table 9.2.9: Chief and Second Engineering unlimited class ( 2/1)
YEAR FIRST YEAR TOTAL
Male Female
2013/2014 14 - 14
2014/2015 11 - 11
2015/2016 7 - 7
Table 9.2.10: Office in charge Engineering Watch (Class 3)
YEAR FIRST YEAR TOTAL
Male Female
2013/2014 20 - 20
2014/2015 14 1 15
2015/2016 8 - 8

63
Table 9.2.11: Office in charge Engineering Watch less than 750 (Class 4)
YEAR FIRST YEAR TOTAL
Male Female
2013/2014 11 - 11
2014/2015 14 1 14
2015/2016 16 - 16
Table 9.2.12 Master and Chief Mate of more than 3000 GT (class 2/1)
YEAR FIRST YEAR TOTAL
Male Female
2013/2014 9 - 9
2014/2015 7 - 7
2015/2016 6 - 6
Table 9.2.13.Officer In charge of Navigational Watch Desk Officer (class 3)
YEAR FIRST YEAR TOTAL
Male Female
2013/2014 29 1 30
2014/2015 14 - 14
2015/2016 17 - 17
Table 9.2.14.Officer In charge of Navigational Watch near coastal Desk Officer (class 4)
YEAR FIRST YEAR TOTAL
Male Female
2012/2013 - - -
2013/2014 - - -
2014/2015 17 - 17
2015/2016 37 - 37
Table 9.2.15 Introductory to International Certificate in Logistics and Transport
YEAR FIRST YEAR TOTAL
Male Female
2012/2013 - - -
2013/2014 6 5 11
2014/2015 10 7 17
2015/2016 2 2 4

64
Table 9.2.16 International Certificate in Logistics and Transport
YEAR FIRST YEAR TOTAL
Male Female
2012/2013 17 6 23
2013/2014 16 4 20
2014/2015 21 8 29
2015/2016 13 7 20
Tale 9.2.17 International Diploma in Logistics and Transport
YEAR FIRST YEAR TOTAL
Male Female
2012/2013 30 10 41
2013/2014 14 5 19
2014/2015 10 4 14
2015/2016 10 4 14
Source: DMI
Table 9.2.18.International Advanced Diploma in Logistics and Transport
YEAR FIRST YEAR SECOND YEAR TOTAL
Male Female Male Female
2012/2013 21 4 25 13 63
2013/2014 9 8 15 3 35
2014/2015 8 2 9 8 27
2015/2016 1 3 7 5 16
Source: DMI
Table 9.2.19 Diploma level 4- shipping and Logistics
YEAR FIRST YEAR TOTAL
Male Female
2012/2013 - - -
2013/2014 21 8 29
2014/2015 15 6 21
2015/2016 26 4 30
Source: DMI

65
Table 9.2.20 Diploma level 5- shipping and Logistics
YEAR FIRST YEAR TOTAL
Male Female
2012/2013 - - -
2013/2014 21 4 12
2014/2015 - 4 12
2015/2016 8 1 7
Source: DMI
Table 9.2.21 Diploma level 6- shipping and Logistics
YEAR FIRST YEAR TOTAL
Male Female
2012/2013 - - -
2013/2014 - - -
2014/2015 7 3 10
2015/2016 4 3 7
Source: DMI