minnesota measures - ohe.state.mn.us measures a 2017 report on higher education performance. ......
TRANSCRIPT

MINNESOTAMEASURESA 2017 Report onHigher Education Performance
ABOUT THE MINNESOTA OFFICE OF HIGHER EDUCATION The Minnesota Office of Higher Education is a cabinet-level state agency providing students with financial aid programs and information to help them gain access to postsecondary education. The agency also serves as the state’s clearinghouse for data, research and analysis on postsecondary enrollment, financial aid finance and trends.
about
Authors
Alexandra DjurovichSenior Data AnalystOFFICE OF HIGHER [email protected]
Meredith FergusManager of Financial Aid Research/SLEDS CoordinatorOFFICE OF HIGHER [email protected]
2
Abou
t

TABLE OF CONTENTSABOUT .....................................................................................................................................................2 INTRO......................................................................................................................................................4 Minnesota Needs to Increase Access to Degrees That Open Doors ............................................... 4
PREPARING FOR AND ENTERING COLLEGE ..........................................................................8 1: High School Academic Preparation and College Readiness .......................................................... 9 2: College Enrollment .......................................................................................................................... 15 3: Published vs. Net Tuition and Fees for First-Time, Full-Time Freshman ................................... 19 4: Enrollment and Student Characteristics ....................................................................................... 25 5: Developmental Education ............................................................................................................... 32 6: Financial Aid to Minnesota Undergraduates ................................................................................36
OUTCOMES OF COLLEGE ............................................................................................................. 38 7: Educational Attainment of Minnesota’s Adults ............................................................................39 8: Graduation Rates .............................................................................................................................46 9: Awards Conferred ...........................................................................................................................50 10: Employment of Recent Graduates .............................................................................................. 55 11: Debt of College Graduates and Repayment of Loans ................................................................58
APPENDIX .......................................................................................................................................... 64 A: Definitions and Terms Used in the Report ...................................................................................64 B: Data Sources Used in the Report .................................................................................................66
Table of Contents
3

Acute Attainment Disparities Persist Across Race/Ethnic GroupsMinnesota population age 25 and older with an associate degree or higher
SOURCE: U.S. Census Bureau, American Community Survey 1 Year Estimate
MINNESOTA NEEDS TO INCREASE ACCESS TO DEGREES THAT OPEN DOORS Obtaining a postsecondary credential increases economic opportunity, promotes income equality, and prepares the state to meet future workforce demands. Not all Minnesotans are equally prepared there remains an educational attainment gap across racial and ethnic groups.
4
Intro
duct
ion
Equity in Attainment
Key indicators confirm the disparities gap is not isolated to the higher education system; students of color do not succeed at the same rates as their White peers throughout all levels of the Minnesota education system.
intro
Perc
ent A
ssoc
iate D
egre
e or H
ighe
r
60%
50%
40%
30%
20%
10%
0%
American Indian Asian Black Hispanic
2010 2011 2012 2013 2014 2015
Two or More Races White
• Students of color graduate from high school within four years at a rate lower than White students.
• Students of color enroll in college at a rate lower than White graduates.
• Undergraduates of color enroll primarily at two-year institutions.

• Undergraduates of color and non-English speakers enroll in developmental education at higher rates.
• Undergraduates of color have lower college graduation rates.
Given that Minnesotans of color are comprising a larger share of state’s population each year, the state’s changing demographic profile requires the state to begin reducing educational attainment racial gaps or the state’s economic future will be threatened. In response, the 2015 Minnesota Legislature enacted legislation setting a target that 70 percent of Minnesota adults age 25 to 44 will have attained a postsecondary certificate or degree by 2025, both for the general population and by racial/ethnic subgroups in the state. The Office of Higher Education worked with the Minnesota Demographic Office to obtain estimates of the population holding a certificate or higher, since U.S. Census only collects data on populations with associate degrees or higher. Even when certificates are included in addition to degrees gaps remain.
Given the importance that postsecondary institutions and organizations have in producing more people with credentials, the Legislature created an “Equity in Education and Job Connection Grant Program” to assist selected colleges, universities, and organizations in providing evidence-based best practice services that have been proven through research to be effective in increasing retention, completion, and employment outcomes for historically underrepresented students. The Office of Higher Education awarded grants this year to Minnesota State institutions that will aid the institutions in providing best practice services
that improve attendance, retention, completion, and gainful employment outcomes for the targeted student group.
Addressing Minnesota’s educational disparities will require a comprehensive approach to achieve desired results.
College Readiness
High standardized test scores have long been considered synonymous with preparedness for college. However, new ideas are emerging about the skills and competencies students need to gain entry to and succeed in college. Across the state, differences in Minnesota students’ college readiness often correlate to race/ethnicity, socio economic status, and geographic location. Inequities within the K-12 system can be observed in instructional offerings; quality of teachers; income-based segregation of minority students by neighborhood; too few guidance counselors; and low student expectations and aspirations. Academic Preparation
Rates of participation in developmental education coursework and ACT college entrance examination scores are two measures of academic preparation for college-level coursework. In 2016, Minnesota’s average composite ACT score was 21.1, the highest in the nation among the 18 states in which all college-bound students took the test. When disaggregated by race, it becomes apparent that this average masks disparities between subpopulations. In general, these disparities in average composite score are similar to national trends.
5
Introduction

AVERAGE 2016 ACT SCORES IN MINNESOTA VARIED BY RACE/ETHNICITY
Race/Ethnicity American Indian Asian Black Hispanic Multi-
Racial White
Composite ACT Score 16.6 20.2 16.5 17.9 20.4 22.2
SOURCE: ACT
6
Intro
duct
ion
College Knowledge
“College knowledge” has become more prominent in the national conversation on college readiness. The term encompasses two emerging components of college readiness: contextual awareness and non-cognitive skills. Contextual awareness refers to information regarding admissions requirements, cost, purpose, and types of colleges. Non-cognitive skills, on the other hand, include the ability to build relationships with professors, peers, and establish a sense of belonging within the community. Underrepresented student populations (those from low-income families, ethnic/racial minority groups, and students who are the first in their family to access a college education) often experience a gap in college knowledge. Students lacking college knowledge are less likely than their peers to enroll in “best-fit” colleges that match their aspirations and abilities. Students who belong to communities that do not historically have a college-going culture, or do not have family members or role models who attended college, often do not gain meaningful access to college planning and preparation materials.
Individual and State Return on Higher Education
A college certificate or degree is linked to numerous benefits in life. The boost in income and the wage premium for jobs requiring a college degree are tied to increased social mobility and better health. In an era of increasing wage inequality, earning a postsecondary credential continues to offer students a pathway for obtaining a sustainable wage and joining the middle class. The trend is for students and their families to shoulder a greater proportion of postsecondary costs. However, for those able to access and obtain higher education, the return on investment is greater now than it has been in decades.
In addition to the direct economic benefits associated with postsecondary education, there are numerous indirect benefits including: improved employee-employer job match, lower crime rates, greater civic participation, improved health outcomes, increased life expectancy, and intergenerational degree attainment effects.

7
Introduction
Income Inequality and the Cycle of Poverty
Income disparities are associated with reduced skills development for children with less well-educated parents, meaning that students from low-income families are less likely to excel academically as income inequality increases. If the attainment gap does not improve, higher education attainment rates will tend to remain stagnant or begin to decrease, and income inequality will likely increase. On the other hand, parents with better educations, no matter their income levels, are more likely to see their children succeed in school and the workforce. All Minnesotans would benefit from greater income equality—research indicates it fosters economic growth. Economic Consequences of Non-Completion
The postsecondary dropout rate in the United States is the highest in the industrialized world. While ensuring equitable and affordable access to postsecondary education for all citizens remains a priority, the wage premium of obtaining a higher education credential in the U.S. is well-documented. Access to a postsecondary education without completion is neither affordable nor efficient for students or taxpayers of Minnesota. For students, non-completion is associated with a greater likelihood of unemployment or underemployment. Non-completers are more likely to default on their student loans than graduates. In short, the wage premium associated with higher education hinges on degree completion.
For states, students not completing a postsecondary credential results in depressed tax capacity. According to estimates by the American Institutes of Research (AIR), the state of Minnesota spent $110.6 million on first-year dropouts.1 AIR also found that Minnesota lost over $188 million in potential tax revenue from the 2002 cohort of first-time freshmen pursuing a bachelor’s degree. The estimates, however, fail to account for non completers who were seeking an associate degree, certificate, or diploma, and are limited to one cohort of first-time freshmen, and so likely underestimate the cost of non-completion to the state.2
Minnesota Workforce Projections
The Minnesota Department of Employment and Economic Development (DEED) estimates that nearly one in three new jobs projected to be created between 2010 and 2020 will require education beyond high school, as will more than one-fourth of replacement job openings.3 To meet such projected workforce demands given changing demographic trends, Minnesota’s K-12 and higher education systems together must identify and implement effective strategies to increase postsecondary completion rates for underserved populations.
Minnesota’s key challenge moving forward is to successfully prepare and support underserved populations to certificate or degree completion while meeting future workforce demands in a period of changing demographics.
1Schneider, M. (2010). Finishing the First Lap: The Cost of First Year Student Attrition in America’s Four Year Colleges and Universities. American Institutes for Research.
2Schneider, M., & Yin, L. (2011). The High Cost of Low Graduation Rates: How Much Does Dropping Out of College Really Cost? American Institutes for Research.
3Vilsack, R. (2013, October). Training for the future: Education, employment projections and wages. Department of Employment and Economic Development. Retrieved from http://mn.gov/deed/newscenter/publications/review/october-2013/training-future.jsp
PREPARING FOR AND ENTERING COLLEGE

HIGH SCHOOL ACADEMIC PREPARATION AND COLLEGE READINESS K E Y P O I N T S I N T H I S S E C T I O N
• High school graduation rates for all racial and ethnic groups increased from 2014 to 2015. • The high school graduation rate for English language learners and students eligible for free/reduced priced lunch were 19 and 15 percentage points lower than the state graduates respectively, highlighting significant achievement gaps that exist within education. • The Minnesota Comprehensive Assessment (MCA) results in both Grade 10 reading and Grade 11 math highlight large achievement differences for students of color and students from low income families as indicated by free reduced priced lunch eligibility. • After 10 years in first place, ACT test-takers in Minnesota no longer posted the highest composite scores in the country.
Higher education institutions are the major post-high school education and training pathway in the state. As such, higher education is impacted in part by the preparation level of high school graduates entering the state’s colleges and universities. Students completing more rigorous courses in core academic subjects in high school consistently have higher high school graduation rates, score higher on standardized tests and college entrance assessments, and are more likely to be successful in college.
Graduating high school is key to future educational achievement. Minnesota public high school graduation rates were 82 percent in 2015, and have increased each year since 2010. According to the Minnesota Department of Education, graduation rate gaps between White
students and students of color throughout the state have been closing.
Since 2011 Graduation Rates Have:
• Increased 8 percentage points for American Indian students.
• Increased 16 percentage points for Black students.
• Increased 18 percentage points for Hispanic students.
• Trended upward with nearly every student group, including special education and students in poverty.
9
1Preparing For and Entering College

10
Prep
arin
g For
and
Ente
ring C
olleg
e
Minnesota Public High School 4-Year Graduation Rates Vary by Race/Ethnicity, 2015
D A T A S U G G E S T S Graduating high school is key to future educational achievement.
Measures of Academic Preparation
In Minnesota there is no one measure of college or career readiness. This report provides several measures to assess academic results of Minnesota high school students: the Minnesota Comprehensive Assessments (MCA), Advanced Placement test scores and ACT test results.
Within public schools, the Minnesota Comprehensive Assessments (MCA) measure student progress toward Minnesota’s academic standards for K-12 education. All public school students in grades three through eight take reading and mathematics assessments. Students in grade 10 take reading assessments, and students in grade 11 take mathematics assessments.
The statewide MCA results of public high school students in 2016 indicated 59 percent met the reading proficiency standard set by the Minnesota Department of Education and 47 percent met the math standards. The results in both reading and math showed large achievement differences for students of color and students from low income families as indicated by free/reduced priced lunch eligibility.
SOURCE: Minnesota Department of Education
100%
80%
60%
40%
20%
0%All Students
(54,255)American
Indian (798)Asian
(3,728)Black
(4,119)Hispanic(2,969)
White(42,641)
EnglishLanguageLearners(2,722)
Free orReduced Price
Lunch(16,279)
82%
52%
83%
62% 66%
87%
63% 67%

11
Preparing For and Entering College
Grade 10 Reading Proficiency Varies by Race/Ethnicity and Special PopulationsPercent of Minnesota public high school students proficient on
reading Minnesota Comprehensive Assessment, 2016
Grade 11 Math Proficiency Varies by Race/Ethnicity and Special PopulationsPercent of Minnesota public high school students proficient on
math Minnesota Comprehensive Assessment, 2016
D A T A S U G G E S T S Too few students from special populations are attaining proficiency.
SOURCE: Minnesota Department of Education
SOURCE: Minnesota Department of Education
100%
80%
60%
40%
20%
0%All Students
(60,245)American
Indian (1,209)Asian
(4,227)Black
(5,884)Hispanic(4,337)
White(44,555)
Free/ReducedPriced Meals
(19,983)
English LanguageLearners(2,657)
59%
38%
55%
30%37%
66%
38%
6%Special
EducationServices (7,094)
20%
Race/EthnicityAll Students Special Population
100%
80%
60%
40%
20%
0%All Students
(55,975)American
Indian (1,049)Asian
(3,794)Black
(5,137)Hispanic(3,910)
White(42,058)
Free/ReducedPriced Meals
(17,358)
English LanguageLearners(2,045)
47%
22%
48%
19% 22%
53%
25%
4%Special
EducationServices (6,222)
10%
Race/EthnicityAll Students Special Population
12
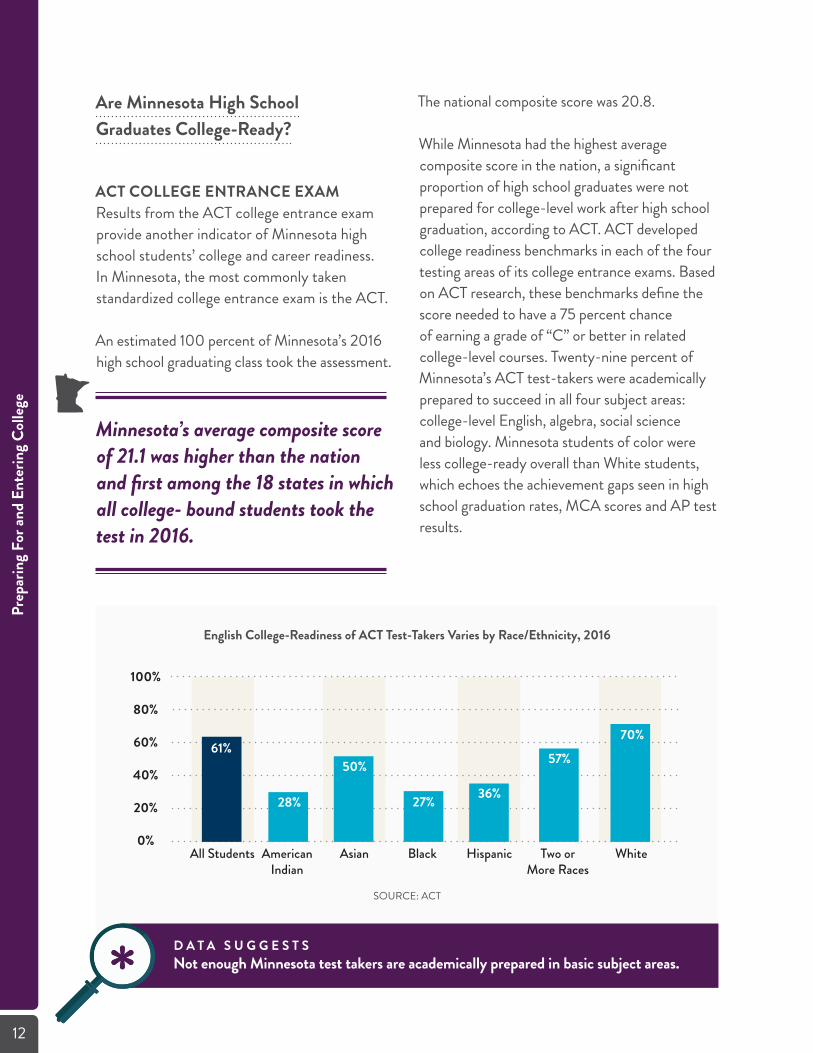
English College-Readiness of ACT Test-Takers Varies by Race/Ethnicity, 2016
Are Minnesota High SchoolGraduates College-Ready?
ACT COLLEGE ENTRANCE EXAM Results from the ACT college entrance exam provide another indicator of Minnesota high school students’ college and career readiness. In Minnesota, the most commonly taken standardized college entrance exam is the ACT.
An estimated 100 percent of Minnesota’s 2016 high school graduating class took the assessment.
Minnesota’s average composite score of 21.1 was higher than the nation and first among the 18 states in which all college- bound students took the test in 2016.
The national composite score was 20.8.
While Minnesota had the highest average composite score in the nation, a significant proportion of high school graduates were not prepared for college-level work after high school graduation, according to ACT. ACT developed college readiness benchmarks in each of the four testing areas of its college entrance exams. Based on ACT research, these benchmarks define the score needed to have a 75 percent chanceof earning a grade of “C” or better in related college-level courses. Twenty-nine percent of Minnesota’s ACT test-takers were academically prepared to succeed in all four subject areas: college-level English, algebra, social science and biology. Minnesota students of color were less college-ready overall than White students, which echoes the achievement gaps seen in high school graduation rates, MCA scores and AP test results.
SOURCE: ACT
D A T A S U G G E S T S Not enough Minnesota test takers are academically prepared in basic subject areas.
100%
80%
60%
40%
20%
0%All Students American
IndianAsian Black Hispanic Two or
More RacesWhite
61%
28%
50%
27% 36%
57%
70%
Prep
arin
g For
and
Ente
ring C
olleg
e
13
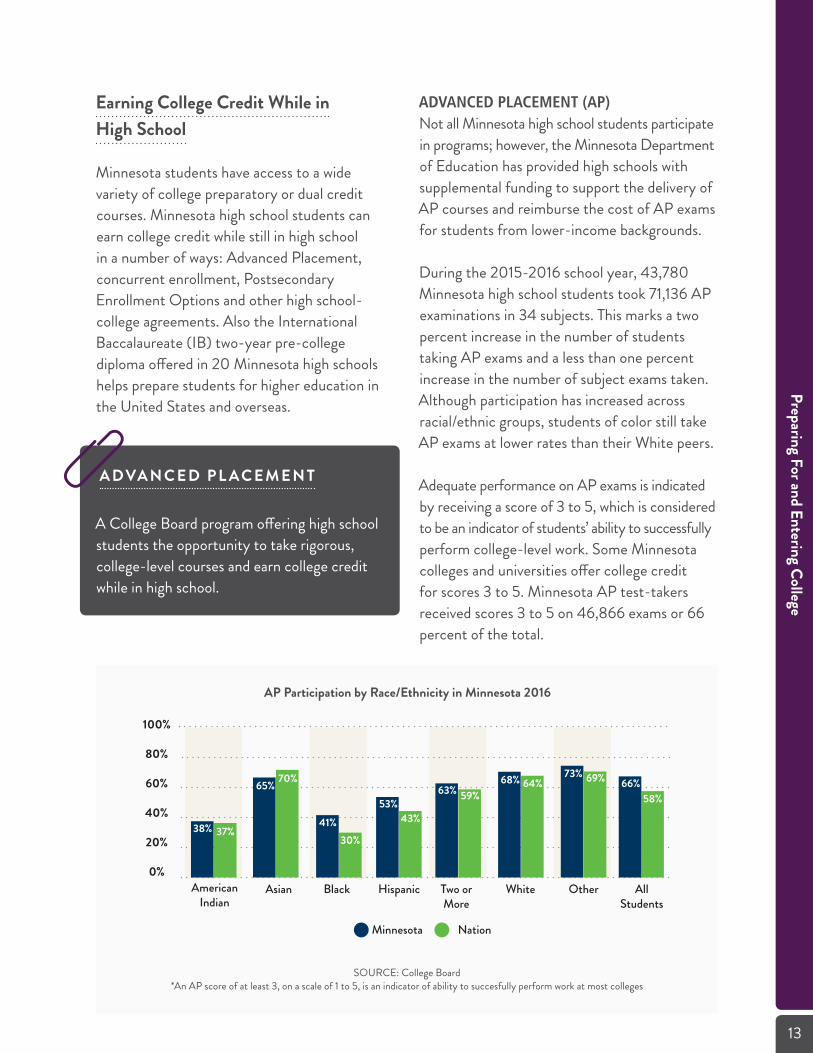
Earning College Credit While in High School
Minnesota students have access to a wide variety of college preparatory or dual credit courses. Minnesota high school students can earn college credit while still in high school in a number of ways: Advanced Placement, concurrent enrollment, Postsecondary Enrollment Options and other high school- college agreements. Also the International Baccalaureate (IB) two-year pre-collegediploma offered in 20 Minnesota high schools helps prepare students for higher education in the United States and overseas.
A D VA N C E D P L A C E M E N T
A College Board program offering high school students the opportunity to take rigorous, college-level courses and earn college credit while in high school.
AP Participation by Race/Ethnicity in Minnesota 2016
ADVANCED PLACEMENT (AP)Not all Minnesota high school students participate in programs; however, the Minnesota Department of Education has provided high schools with supplemental funding to support the delivery of AP courses and reimburse the cost of AP exams for students from lower-income backgrounds.
During the 2015-2016 school year, 43,780 Minnesota high school students took 71,136 AP examinations in 34 subjects. This marks a two percent increase in the number of students taking AP exams and a less than one percent increase in the number of subject exams taken. Although participation has increased across racial/ethnic groups, students of color still take AP exams at lower rates than their White peers.
Adequate performance on AP exams is indicated by receiving a score of 3 to 5, which is considered to be an indicator of students’ ability to successfully perform college-level work. Some Minnesota colleges and universities offer college credit for scores 3 to 5. Minnesota AP test-takers received scores 3 to 5 on 46,866 exams or 66 percent of the total.
SOURCE: College Board*An AP score of at least 3, on a scale of 1 to 5, is an indicator of ability to succesfully perform work at most colleges
100%
80%
60%
40%
20%
0%American
IndianAsian Black Hispanic Two or
MoreWhite Other All
Students
38%
Minnesota Nation
37%
65% 70%
41%30%
53%43%
63% 59%68% 64%
73% 69%
58%66%
Preparing For and Entering College

14
Minnesota High School Students in PSEO or ConcurrentEnrollment Courses Continues To Increase, 2008-2015
DUAL CREDIT VIA POSTSECONDARY ENROLLMENT OPTIONS & CONCURRENT ENROLLMENTPostsecondary Enrollment Options (PSEO) allow high school juniors and seniors in Minnesota to enroll in college-level courses while still in high school. Legislation (Minn. Stat. § 124D.09) was passed in 2012 allowing eligible grade 10 students to enroll in Career and Technical Education (CTE) courses as identified by the Minnesota State Colleges and Universities System.
High school students can participate in PSEO by taking courses taught by a college instructor either physically at a postsecondary institution or through online courses offered by a college
or university. PSEO provides students with a wide variety of college-level course offerings and the opportunity to experience challenging coursework in a college environment.By contrast, concurrent enrollment courses are a college or university course offered througha secondary school and taught by a high school teacher. The number of high school students enrolled in college-level courses through PSEO or concurrent enrollment has increased from 25,127 to 37,474 in the past eight years.
In addition to PSEO and concurrent enrollment, a high school may enter into an agreement with a college to provide additional dual credits courses. Little is known about the number of courses offered in this manner.
D A T A S U G G E S T S Dual credit enrollment has nearly doubled in eight years.
SOURCE: Minnesota Department of Education
40,000
35,000
30,000
25,000
20,000
15,000
10,000
5,000
0
PSEO Concurrent Enrollment Total
25,127
37,474
Num
ber o
f Stu
dent
s
2008 2009 2010 2011 2012 2013 2014 2015
Prep
arin
g For
and
Ente
ring C
olleg
e

15
COLLEGE ENROLLMENT K E Y P O I N T S I N T H I S S E C T I O N
• In 2014, 69 percent of Minnesota public high school graduates enrolled in postsecondary education in the fall term after high school • 72 percent chose a postsecondary institution in Minnesota. • Postsecondary institutions in states bordering Minnesota were popular choices for Minnesota high school graduates enrolling out of state.
2
College Participation Rate
The college participation rate measures the percent of high school graduates enrolling in college in the fall immediately upon graduation.
The college participation rate for the 2014 Minnesota public high school graduating class was 69 percent. The rate includes students enrolling in Minnesota and out of state and at all types of colleges from vocational two-year to four-year. College participation rates leave out students not graduating from high school.
Minnesota’s performance on this measure may indicate the effectiveness of college awareness initiatives, the success of college recruiting and outreach targeted to Minnesota high school students, and the academic preparation of high school students.
72%**
**
Preparing For and Entering College

College Participation of Minnesota Public High School Graduates Steady,Class of 2007-2014
Notable differences exist in college participation by race and ethnicity.
White and Asian public high school graduates enrolled in Minnesota postsecondary institutions at rates higher than other populations. Since there are large gaps in Minnesota public high school graduation rates by race/ethnic background even less students who are American Indian, Black and Hispanic attend college than their White and Asian younger aged peers.
Nationally, immediate enrollment in college also varies by race and ethnicity. Of the three million high school graduates in 2013, 66 percent, enrolled in college the following fall. White student college enrollment (67 percent) was higher than the rate for those who were Black (57 percent). The national rate for those
who were Hispanic (66 percent) was similar to White students. The immediate college enrollment rate for Asians (81 percent) was higher than the rates for Whites, Blacks, and Hispanics in 2013 and in each year since 2003.
There are large differences in college participation by family income. Income of Minnesota public high school graduates is measured by whether the student enrolled in free or reduced price lunch at any time during high school. College participation rates for high school graduates not receiving free or reduced price lunch was 26 percent higher than students who received free or reduced price lunch.
College participation gaps by family income are also reported nationally. The college participation rate for high school graduates from high-income families (80 percent) was 31percentage points higher than the rate for those from low-income families (49 percent).
SOURCE: Statewide Longitudinal Education Data System
16
100%
80%
60%
40%
20%
0%2007 2008 2009 2010 2011 2012 2013 2014
Total in Minnesota plus out of state Enrolled out of stateEnrolled in Minnesota
16% 19%
70% 69%
50%54%
Prep
arin
g For
and
Ente
ring C
olleg
e

17
Where Students Enroll
Staying close to home is the choice for most high school graduates en-rolling in college.
Of Minnesota’s public high school class of 2014, 72 percent chose to attend in Minnesota and 28 percent enrolled out of state. Students tend to choose locations they know and may stay close to home to be near their families and friends. It is often cheaper to attend college in-state due to in-state tuition and state-funded financial aid programs. In Minnesota’s case the Minnesota State Grant Program is available only to under- graduates attending a Minnesota institution.Staying closer to home also lowers additional travel expenses.
Class of 2014 Minnesota Public High School Graduates Enrolledin College in Fall 2014 Higher for White Students
Minnesota Colleges Top Choice for 2014 Minnesota Pulic High School
Graduates Enrolled in Fall 2014
D A T A S U G G E S T S Fewer students from low-income families participate in college.
SOURCE: Statewide Longitudinal Education Data System
SOURCE: Statewide Longitudinal Education Data System
100%
90%
80%
70%
60%
50%
40%
30%
20%
10%
0%American
IndianAsian Black Hispanic Free or Reduced
Price Lunch (atany point in high school)
Not Free orReduced PriceLunch (at any
point in high school)
White
44%
70%60%
51%
72%
53%
79%
72%
28%
Minnesota Out of State
Preparing For and Entering College

58% of 2014 Minnesota High School Graduates Staying in Minnesota Attended
a 4-Year Institution in Fall 2014
Border States were Top Destinationsfor 2014 Minnesota High School
Graduates Attending College out ofState in Fall 2014
Four-year colleges in Minnesota were the most popular type of institution attended by 58 percent of high school graduates staying in Minnesota.
The University of Minnesota-Twin Cities campus enrolled the largest number of 2014 Minnesota high school graduates.
The most popular destinations for Minnesota high school graduates enrolling out of state were institutions located in states bordering Minnesota. Institutions in Iowa, North Dakota, South Dakota and Wisconsin enrolled 65 percent of Minnesota’s graduates enrolling out
Note: 13,277 Minnesota public and private high school graduates attended 884 out-of-state institutions.
Note: 28,826 Minnesota public high school graduates attended 121 Minnesota institutions
of state. North Dakota State University-Fargo enrolled the most Minnesota high school graduates attending out of state from 2011 through 2014. Many Minnesota residents take advantage of statewide tuition reciprocity agreements Minnesota has with North Dakota, South Dakota and Wisconsin.
Of the Minnesota high school graduates enrolling in out-of-state institutions not adjacent to Minnesota’s border, attendance was scattered across the country. Institutions located in the Rocky Mountain region (Colorado, Montana, Utah and Wyoming) have been popular destinations for recent Minnesota high school graduates, followed by other institutions in the Midwest (Illinois, Indiana, Michigan and Ohio) and the Southwest region (Arizona) of the U.S.
SOURCE: Statewide Longitudinal Education Data SystemSource: U.S. Department of Education, IPEDS Enrollment Survey
18
42%
20%
State College (2 Year) State University (4-Year)
University of Minnesota(4 Year)
State University (4-Year)
19%
19%
34% 25%
Wisconsin North Dakota
Iowa South Dakota
12%
20%
All Other States
9%
Prep
arin
g For
and
Ente
ring C
olleg
e

19
In considering college affordability, prospective college students should consider the net price they will pay.
Net price reflects the out-of-pocket costs students pay for college after subtracting grants and scholarships awarded. Although college tuition continues to rise, few students or families are expected to pay the full cost of attendance. The net price students pay varies by family income and the institution attended. Colleges are required to have net price calculators on their websites to help students and their families gauge what they might expect to pay to attend a particular college.
PUBLISHED VS. NET TUITION AND FEES FOR FIRST-TIME, FULL-TIME FRESHMEN K E Y P O I N T S I N T H I S S E C T I O N
• Published tuition and fees at Minnesota public institutions comparable to peer states, but higher than national averages. • Net price for students from low income families remained stable over the most recent five years. • Net price varied by family income and institutional type.
3
Published Tuition and Fees
P U B L I S H E D (O R “S T I C K E R ”) P R I C E
Total tuition and fees charged by a postsecondary institution before accounting for any student financial aid received.
Students and their families often only use the published price to inform their college decision process, but it is important for them to determine other costs such as room andboard. They also should not overlook available financial aid by completing the Free Application for Federal Student Aid (FAFSA) application.Knowing what college financial aid is available will help students compare the full cost of attendance along with any financial aid they may receive.
Preparing For and Entering College

20
Published tuition and fee rates have increased at Minnesota institutions.
Published Tuition and Fees have Increased Across Minnesota InstitutionsFirst-time, full-time, undergraduates, academic years ending 2000-2016
D A T A S U G G E S T S Grants and scholarships reduced the price students paid by approximately $4,600 at Minnesota public four-year institutions and $3,600 at Minnesota public two-year colleges in 2013-2014.
The fastest rates of growth in average tuition and fees were at public institutions, although the actual dollar amount increases have been larger at private institutions.
Even though tuition and fees at Minnesota postsecondary institutions have increased, prices at public institutions are similar to those in peer states. College prices tend to reflect regional economic differences. Institutions on the East Coast have higher tuition and fees than institutions in Southern and Western states.
SOURCE: U.S Department of Education, iPEDS Institutional Characteristics Survey
$35,000
$30,000
$25,000
$20,000
$15,000
$10,000
$5,000
$02000 2001 2002 2003 2004 2005 2006 2007 2008 2009 2010 2011 2012 2013 2014 2015 2016
Private For-Profit 2-YearPrivate Not-for-Profit 4-Year Private For-Profit 4-Year
Public 4-Year State Colleges
Prep
arin
g For
and
Ente
ring C
olleg
e

21
Minnesota Public Institution’s Published Tuition and Fees even with Peers but Outpace the NationFirst-time, full-time, undergraduates, 2015-2016
Net Price
Grants and scholarships help make college affordable.
In Minnesota, 70 percent of first-time, full-time freshmen received grants or scholarships that reduced the cost of attendance. In 2013-2014, the average net price for first-time, full-time undergraduates receiving federal financial aid attending Minnesota institutions was:
• $14,000 at state colleges (two-year)
• $22,900 at private for-profit two-year institutions
• $17,200 at public four-year institutions
• $24,300 at private not-for-profit four-year institutions
• $21,400 at private for-profit four-year institutions.
Peer states are Iowa, Illinois, Indiana, Michigan, Ohio, Pennsylvania and WisconsinSOURCE: U.S. Department of Education, IPEDS Institutional Characteristics Survey
$35,000
$30,000
$25,000
$20,000
$15,000
$10,000
$5,000
$0Public2-Year
Private for-profit2-Year
Public4-Year
Private not-for-profit 4-Year
Private for-profit4-Year
Minnesota Peer States Nation
$5,329$6,229
$3,942
$15,661$14,513 $14,628
$10,137 $9,920 $8,148
$31,143$28,753
$26,435
$15,205$16,258$15,982
Preparing For and Entering College

22
Grants and Scholarships Reduce Prices Paid at Minnesota InstitutionFirst-time, full-time, undergraduates receiving Title IV financial aid, 2013, 2014
*Net Price: Tuition and Fees plus a standard living allowance of ($12,100) minus federal, state and institutional grants. Title IV student aid for purposes of this survey includes students receiving a federal grant or federal loan. Data for public
institutions represents the weighted average of in-district and in-state charges.
Affordability policies at the state and federal level focus on lower income undergraduates. Policies related to grant or scholarship eligibility vary greatly by institution type and state. Minnesota undergraduates from families with incomes of less than $75,000 are eligible to receive federal Pell Grants, Minnesota State Grants and institutional need-based grants.Analysis of net price for this income group allows for better understanding of the impactof state, federal and institution-specific policies on college costs for lower income students.
Average net prices paid by students and their families increased as family income increased.
Average net price ranged from $13,700 to $25,000 depending on family income.
D A T A S U G G E S T S Among Minnesota undergraduates from families with incomes of less than $75,000,the average net price paid was lower in 2013-2014 than in 2008-2009.
SOURCE: U.S. Department of Education, IPEDS Student Financial Aid (Net Price) Survey
State Colleges Private For-profit 2-Year
Public 4-Year Private Not-for-Private 4-Year
Private For-profit4-Year
Average Net Price Average Published Tuition and Fees plus Living Allowance
$45,000
$40,000
$35,000
$30,000
$25,000
$20,000
$15,000
$10,000
$5,000
$0
$14,000
$17,400
$22,900
$29,000
$17,200
$21,900$24,300
$42,400
$21,400
$26,800
Aver
age N
et P
rice*
Prep
arin
g For
and
Ente
ring C
olleg
e

23
For family incomes of $30,000 or lower, the University of Minnesota offered the lowest net price for undergraduates attending Minnesota public institutions ($8,600), as compared to state colleges (two-year) ($11,000) or state universities (four-year) ($10,800).
Average Net Price Increases by Income*, but Price Varies by Minnesota Institution TypeFirst-time, full-time undergraduates receving Title IV financial aid, 2013-2014
*Net Price: Tuition and Fees plus a standard living allowance of ($12,100) minus federal, state and institutional grants. Title IV student aid for purposes of this survey includes students receiving a federal grant or federal loan. Data for public
institutions represents the weighted average of in-district and in-state charges.
The University of Minnesota’s lower net price resulted from institutional grant aid programs which targeted Pell Grant recipients and middle income students. At all family income levels, the net price paid at Minnesota public institutions was lower than private institutions in 2013-2014.
SOURCE: U.S. Department of Education, IPEDS Student Financial Aid (Net Price) Survey
$35,000
$30,000
$25,000
$20,000
$15,000
$10,000
$5,000
$0
Private For-Profit 4-YearPrivate Not-for-Profit 4-Year Private For-Profit 2-Year
University of Minnesota State Universities State Colleges
Aver
age N
et P
rice*
$0-$30,000 $30,001-$48,000 $48,001-$75,000 $75,001-$110,000 $110,001 or more
Preparing For and Entering College

Average Net Prices Stable for Lower Income Undergraduates at Minnesota InstitutionsFirst-time, full-time, undergraduates receiving Title IV financial aid, 2009 and 2014
*Net Price: Tuition and Fees plus a standard living allowance of ($12,100) minus federal, state and institutional grants. Title IV student aid for purposes of this survey includes students receiving a federal grant or federal loan. Data for public
institutions represents the weighted average of in-district and in-state charges.
A B O U T N E T P R I C E
This indicator measures the tuition and fees plus living expenses paid by first-time, full-time undergraduate students to attend a postsecondary institution for one year. The “net price” is calculated by subtracting the average amount of federal, state/local government, or institutional grant or scholarship aid from the cost of attendance. The cost of attendance equals the sum of published tuition and required fees for Minnesota residents, plus a standard living allowance of $12,100 for books, supplies, transportation, room, board and miscellaneous expenses.
Source: U.S. Department of Education, IPEDS Student Financial Aid (Net Price) Survey
24
$30,000
$25,000
$20,000
$15,000
$10,000
$5,000
$0
2008-2009 2013-2014
$14,500$13,700
$14,600 $14,200
$17,500 $17,100
$20,500 $20,900$23,400
$25,000
Aver
age N
et P
rice*
INCOME
$0-$30,000 $30,001-$48,000 $48,001-$75,000 $75,001-$110,000 $110,001 or more
Prep
arin
g For
and
Ente
ring C
olleg
e
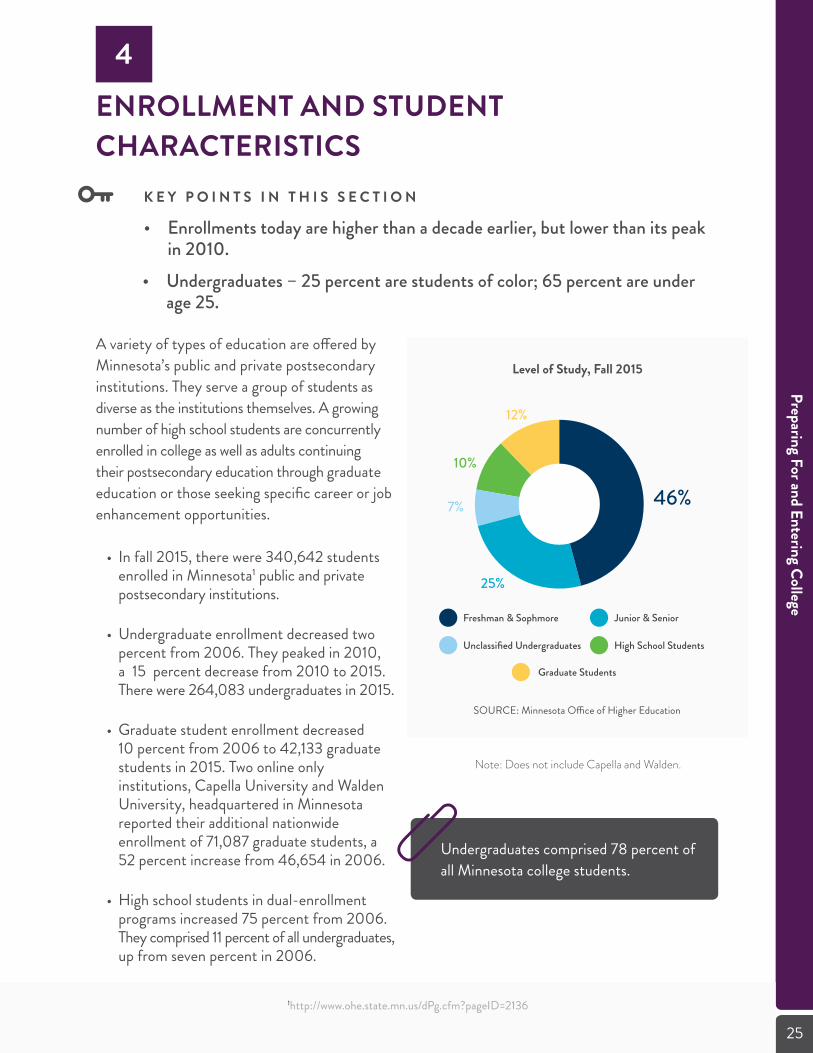
Undergraduates comprised 78 percent of all Minnesota college students.
25
Level of Study, Fall 2015
Note: Does not include Capella and Walden.
ENROLLMENT AND STUDENT CHARACTERISTICS K E Y P O I N T S I N T H I S S E C T I O N
• Enrollments today are higher than a decade earlier, but lower than its peak in 2010. • Undergraduates – 25 percent are students of color; 65 percent are under age 25.
4
A variety of types of education are offered by Minnesota’s public and private postsecondary institutions. They serve a group of students as diverse as the institutions themselves. A growing number of high school students are concurrently enrolled in college as well as adults continuing their postsecondary education through graduate education or those seeking specific career or job enhancement opportunities.
• In fall 2015, there were 340,642 students enrolled in Minnesota1 public and private postsecondary institutions.
• Undergraduate enrollment decreased two percent from 2006. They peaked in 2010, a 15 percent decrease from 2010 to 2015. There were 264,083 undergraduates in 2015.
• Graduate student enrollment decreased 10 percent from 2006 to 42,133 graduate students in 2015. Two online only institutions, Capella University and Walden University, headquartered in Minnesota reported their additional nationwide enrollment of 71,087 graduate students, a 52 percent increase from 46,654 in 2006.
• High school students in dual-enrollment programs increased 75 percent from 2006. They comprised 11 percent of all undergraduates, up from seven percent in 2006.
1http://www.ohe.state.mn.us/dPg.cfm?pageID=2136
SOURCE: Minnesota Office of Higher Education
46%
10%
7%
25%
12%
Freshman & Sophmore Junior & Senior
Unclassified Undergraduates High School Students
Graduate Students
Preparing For and Entering College

Undergraduate Enrollment Trends
State colleges (two-year) enroll the most undergraduates.
Adults age 25 years and older tend to enroll in state colleges and private career schools over four-year colleges. State colleges along with private career schools had enrollment surges from 2008 to 2010 as many adults returned to college or entered for the first time due to recessionary job losses.
26
SOURCE: Minnesota Office of Higher Education
140,000
120,000
100,000
80,000
60,000
40,000
20,000
02006 2007 2008 2009 2010 2011 2012 2013 2014 2015
Num
ber
University of Minnesota
Private 4-Year Colleges & Universities
State Universities
Private Career Schools
State Colleges
Private Career Online*
Fall
Note: Does not include high school students*Includes Capella and Walden University: online only institutions with national enrollment
Prep
arin
g For
and
Ente
ring C
olleg
e

Graduate Residence, Fall 2015Undergraduate Residence, Fall 2015
D A T A S U G G E S T S Minnesota residents comprise the majority of students at Minnesota institutions.
Note: Does not include Capella and Walden.
27
SOURCE: Minnesota Office of Higher EducationSOURCE: Minnesota Office of Higher Education
Four-year colleges have higher percentages of younger undergraduates enrolled full-time than two-year colleges.
66%9%
14%
11%
Minnesota
IA, ND, SD & WI
Other U.S.
Foreign
78%
9%
6%7%
Minnesota
IA, ND, SD & WI
Other U.S.
Foreign
Preparing For and Entering College

28
D A T A S U G G E S T S 65 percent of undergraduates are age 24 or younger. The majority enroll in four year colleges and attend full time.
Note: Does not include Capella and Walden.
Undergraduates 24 or Younger, Fall 2015
SOURCE: Minnesota Office of Higher Education
65%
35%
4-Year Institutions
2-Year Institutions
Undergraduate Age, Fall 2015
SOURCE: Minnesota Office of Higher Education
65%
29%
6%
Age 24 and Younger
Age 25 to 44
Age 45 and Older
Graduate Age, Fall 2015
SOURCE: Minnesota Office of Higher Education
12%
18%
Age 24 and Younger
Age 25 to 44
Age 45 and Older
70%
Prep
arin
g For
and
Ente
ring C
olleg
e
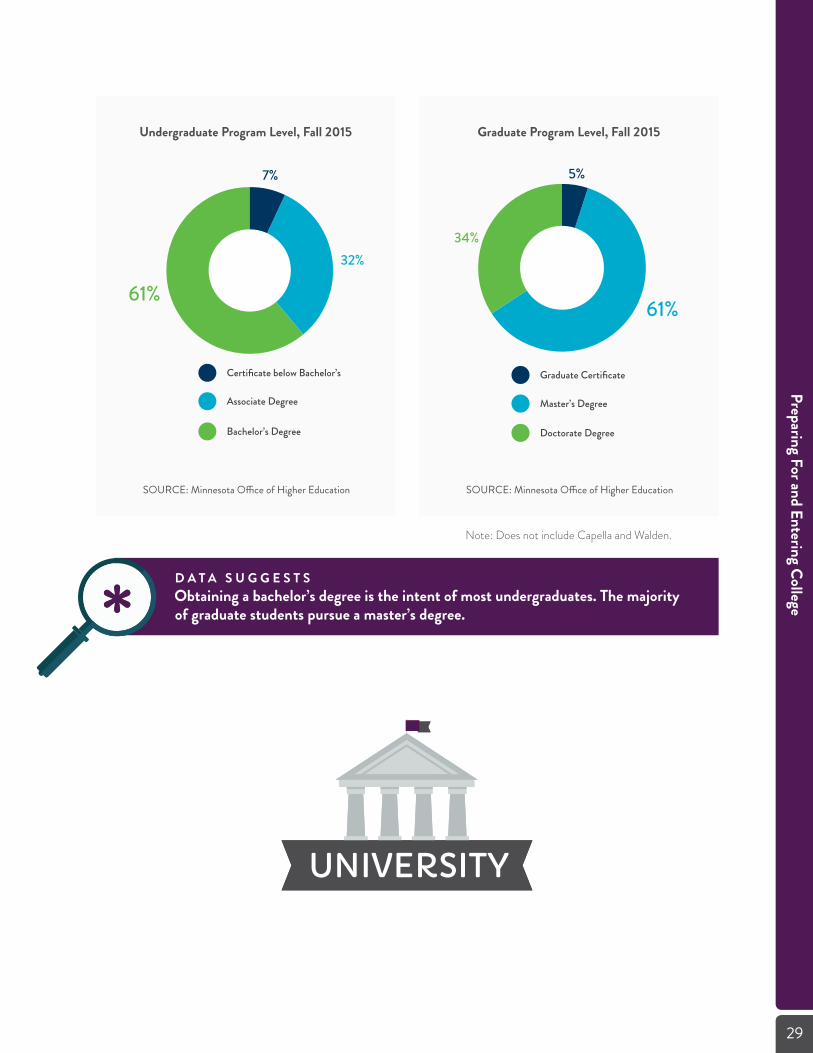
Undergraduate Program Level, Fall 2015 Graduate Program Level, Fall 2015
Note: Does not include Capella and Walden.
D A T A S U G G E S T S Obtaining a bachelor’s degree is the intent of most undergraduates. The majority of graduate students pursue a master’s degree.
29
SOURCE: Minnesota Office of Higher Education SOURCE: Minnesota Office of Higher Education
UNIVERSITYUNIVERSITY
Certificate below Bachelor’s
Associate Degree
Bachelor’s Degree
61%
7%
32%
61%
34%
5%
Graduate Certificate
Master’s Degree
Doctorate Degree
Preparing For and Entering College

Undergraduates Enrolled in Minnesota Postsecondary Institutions by Race/ethnicity
30
SOURCE: Minnesota Office of Higher Education
D A T A S U G G E S T S Students of color make up a growing proportion of undergraduate enrollments. This is consistent with trends in the general population.
Undergraduates of color increased from 37,838 in fall 2006 to 62,745 in fall 2015.
100%
80%
60%
40%
20%
0%2007 2008 2009 2010 2011 2012 2013 2014 2015
Students of Color Percent White Student Percent
84%74%
16%26%
Prep
arin
g For
and
Ente
ring C
olleg
e

Undergraduate Students of Color, Fall 2015
SOURCE: Minnesota Office of Higher Education
A B O U T U N D E R G R A D UAT E S
Undergraduate data in this section does not include high school students who concurrently enroll in a high school and a postsecondary institution. Enrollment data are only collected for the fall semester and do not reflect an annual headcount.For enrollment purposes institutions are organized by the type of educational offering.
two-year institutions include two sectors: state colleges and private career institutions. The private career schools may be for-profit or not- for-profit and some offer a limited number of career-oriented bachelor’s degrees.
four-year institutions include three sectors: state universities, the University of Minnesota campuses and private colleges. The private colleges in this group tend to be mostly not-for- profit institutions and offer a mix of bachelor’s degrees which include liberal arts programs.
Data on Capella University and Walden University students are excluded as appropriate. These two online only institutions are headquartered in Minnesota and report their nationwide enrollment. In fall 2015 they had a combined enrollment of 87,161 which is larger than the total enrollment of any Minnesota four-year sector. The majority of their students are enrolled in graduate programs and are non-Minnesota residents. They also tend to enroll larger percentages of women than other types of colleges and over half of their enrollment are Black students. These student characteristics skew some of the data presented about institutions with a physical presence in Minnesota.
31
40%
3%
23%
20%
14%
Black
Asian
Hispanic
Multi-Racial
American Indian
Preparing For and Entering College
32
Developmental Education
The transition from high school to college and completion can be more difficult for some students than others. Enrollment in remedial or developmental coursework can delay completing requirements for degree completion.
Overall, Minnesota does well in moving students from public high school to college, but not all graduates enrolling in college are at the same level of academic preparedness.
• 26 percent of 2013 public high school graduates enrolled in one or more developmental courses within two years of graduating from high school.
• Disparities in developmental education enrollment exist for key groups of students: students of color, non-English speakers and lower income students.
• Minnesota State Colleges and Universities (MnSCU) serves almost all graduates enrolling in developmental education.
• Overall developmental education rates for the state are stable, though the percent of enrollees at state colleges needing developmental education increased. This is, in part, due to a decrease in the percent of four-year college students enrolling in developmental education.
UNDERGRADUATES: A CLOSER LOOK K E Y P O I N T S I N T H I S S E C T I O N
• Developmental education, retention and transfer activity are three specific data points highlighting the undergraduate experience. • Are undergraduates ready to enroll in a beginning college level math or writing class? Do undergraduates continue their studies and enroll their second year? Do undergraduates transfer?
5
A B O U T D E V E L O P M E N TA L E D U C AT I O N
Data was provided by the Minnesota Statewide Longitudinal Education Data System1 (SLEDS), managed jointly by the Minnesota Office of Higher Education, Minnesota Departmentsof Education, and Employment and Economic Development. SLEDS links student datafrom pre-kindergarten through completion of postsecondary and into the workforce toenable educators and policymakers to gauge the effectiveness of programs and design targeted improvement strategies.
“Developmental education” is a term used to refer to programs offered by postsecondary institutions to prepare students for success in college-level work. Developmental education course taking encompasses the subject areas of mathematics, reading, writing, English asa Second Language or general study skills. Participation in developmental education is one measure of the academic readiness of high school graduates for college level coursework.More information on developmental education is in the Getting Prepared 20162 report.
1 http://sleds.mn.gov/ 2http://www.ohe.state.mn.us/pdf/GettingPrepared2016.pdf
Prep
arin
g For
and
Ente
ring C
olleg
e

Undergraduates Enrolled in Developmental Education Varies by Student Characteristics2013 Minneapolis public high school graduates enrolled in college within two years
State Colleges Enroll the Majority of Students Needing Developmental Education2013 Minnesota public high school graduates enrolled in college within two years
SOURCE: Minnesota Office of Higher Education
SOURCE: Minnesota Office of Higher Education
33
100%
80%
60%
40%
20%
0%American
IndianAsian Black Hispanic White Free or
ReducedPrice Lunch
LimitedEnglish
Proficient
Total
35% 37%
53%42%
21%
40%
71%
26%
100%
80%
60%
40%
20%
0%State
CollegeState
UniversityUniversity
of MinnesotaPrivate
Non-ProfitPrivate
For-Profit
85%
12% 1% 1% 2%
Preparing For and Entering College

Transfer activity is increasingamong undergraduates.
In fall 2015, 11 percent of undergraduates were admitted to Minnesota institutions with transfer credits from another institution. The number of undergraduates with transfer credits increased by 16 percent from 25,510 in 2006 to29,565 in 2015.
It is normally assumed that undergraduates who transfer do so from a two-year college to a four- year college or university, but this is not the case. Half of the transfer activity involves students transferring into a state college (two- year) from either a four-year institution or
34
State Colleges Enroll the Majority of Undergraduate TransfersInstitutions enrolling transfer students in fall 2015
SOURCE: Minnesota Office of Higher Education
D A T A S U G G E S T S Most transfers occur within the first two-years of college.
Undergraduate Transfer
another two-year institution. Some students transfer into and out of several institutions to find the right academic or program fit. Taking online classes at multiple institutions also increases transfer credit activity.
ABOUT UNDERGRADUATE TRANSFERS
While transferring may not adversely affect a student’s educational goals, transfer activity does have an adverse effect on institutional reporting of first-year to second-year undergraduate retention and graduation rates. These measures rely on tracking new-entering first-year student cohorts throughout their studies at the same institution. Students transferring to another institution after their first-year of study or before graduating are not counted in institutional retention and graduation rates. Transfer students may also include those students who did not initially find the right fit or who did not find the programs and services they expected or needed at their first institution.
14,000
12,000
10,000
8,000
6,000
4,000
2,000
0State
CollegeState
UniversityUniversity of
MinnesotaPrivateCollege
PrivateCareer School
Freshman and Sophmores Juniors and Seniors
28%
12,504
1,755
3,892
1,390
1,8741,1831,673 1,516
281
Prep
arin
g For
and
Ente
ring C
olleg
e

A B O U T R E T E N T I O N R AT E S
College retention is defined as the number of first-time undergraduates returning for a second year at the same institution as a proportion of those who attended full-time or part-time in the prior year. Also, retention rates do not include students transferring to another institution to continue their education.
Retention Rates are Higher for Full-Time UndergraduatesNew entering students in fall 2013 returning in fall 2014
35
SOURCE: U.S. Department of Education, IPEDS Enrollment Survey
Undergraduate first-year retention rates do not vary from year to year.
Rates do vary for students attending full time compared to those attending part time, or by type of institution attended. Retention rates are a preliminary indicator of college completion as students who leave an institution are most likely to do so in between their first and second years of postsecondary education.
D A T A S U G G E S T S Minnesotan’s undergraduate first-to-second year retention rate was 74 percent for full-time and 43 percent for part-time students in 2014.
Retention Rates
100%
80%
60%
40%
20%
0%University
of MinnesotaState
UniversitiesPrivate4-Year
Nonprofit
Private 4-Year
For Profit
StateColleges
Private2-Year
Private LessThan 2 Year
Total AllStudents
87%
Full Time Part Time
58%
73%
52%
84%
52% 48%
28%
57%44%
64%
33%
79%63%
74%
43%
Preparing For and Entering College

FINANCIAL AID TO MINNESOTA UNDERGRADUATES K E Y P O I N T S I N T H I S S E C T I O N
• Minnesota undergraduates received $3.06 billion in financial aid in 2015; $1.5 billion in grants and $1.4 billion in student loans. • The federal government was the largest source of aid; 75 percent were in loans.
6
Minnesota undergraduates received a variety of financial aid including grants, scholarships, and student loans to help pay for their postsecondary education. Undergraduates must complete the federal Free Application for Federal Student Aid (FAFSA) to receive federal, state and often institutional financial aid.
Financial aid is intended to fill the gap between the actual price of college and what students and their families can contribute, from savings and income, to pay for their education. Financial aid is available as grants and scholarships, which students do not repay, or through student loans that must be repaid. In short, financial aid allows students to attend colleges that they otherwise may not be able to afford.
$3.06 billion in grant and federal loan financial aid were received by Minnesota undergraduates in 2015.
Over $1.5 billion in total grant aid was awarded to undergraduates. Total grant aid comprised 49 percent of the total aid dollars. Federal Pell Grants were awarded to 122,841 undergraduates attending Minnesota institutions in 2015.
Even with grants Minnesota undergraduates still needed to borrow federal loans to help pay for their education.
Over $1.4 billion in federal loans were borrowed by students attending Minnesota institutions to help pay for their education. Loans to students comprised 45 percent of the total aid dollars.The largest source of all aid, 58 percent, was from the federal government, of which 45 percent were loan dollars. Postsecondary institutions provided 26 percent, the second largest source, of all aid dollars to students.Data were collected by the Minnesota Office of Higher Education.1
361 http://www.ohe.state.mn.us/sPages/FaaReport.cfm?report=all
Prep
arin
g For
and
Ente
ring C
olleg
e

58% of Aid Dollars are from Federal GovernmentFinancial Aid to Minnesota Undergraduates, 2015
37
SOURCE: Minnesota Office of Higher Education
$3,500
$3,000
$2,500
$2,000
$1,500
$1,000
$500
$0Federal
GovernmentState of
MinnesotaPostsecondary
InstitutionsPrivate and
Other SourcesTotal
28%
$1,764
Sour
ce of
Aid
in M
illio
ns
$275
$786
$240
$3,065
45% of Aid Dollars are Federal Student LoansFinancial Aid to Minnesota Undergraduates, 2015
SOURCE: Minnesota Office of Higher Education
$3,500
$3,000
$2,500
$2,000
$1,500
$1,000
$500
$0Grants Loans to
StudentsLoans toParents
WorkStudy
Total
$1,508
Type
of A
id in
Mill
ions
$1,384
$135 $38
$3,065
Preparing For and Entering College

OUTCOMES OF COLLEGE

Educational Attainment MinnesotaPopulation Age 25 to 64
How Educated are Minnesotans?
In 2015, 72 percent of Minnesotans age 25 to 64 had at least some college or higher.
States benefit both economically and socially from having an educated population.
Those benefits include: improved employee-employer job match, lowered crime rates, greater and more informed civic participation, improved health outcomes, increased life expectancy, and intergenerational degree attainment effects. A state’s educational attainment population levels are a product of the effectiveness and success of the state’s postsecondary institutions, the vitality and diversity of the state’s economy, and quality of life in the geographic area. Some states or geographies can also benefit more than others if they can attract more educated populations through migration1.
EDUCATIONAL ATTAINMENT OF MINNESOTA’S ADULTS K E Y P O I N T S I N T H I S S E C T I O N
• At 50 percent, Minnesota’s population (age 25 to 64) is second highest in nation with an associate degree or higher.
7
39
Outcom
es of College
Source: U.S. Census Bureau, 2015 American CommunitySurvey 1-Year Estimates
1Wolfe, B.L., & Haveman, R.H. (2002, June). SOcial and nonmarket benefits from education in an advanced economy. In Conference Series-Federal Reserve Bank of Boston (Vol. 47, pp. 97-131). Federal Reserve Bank of Boston, 1998.
25%
Less than 9th grade9th to 12th grade, no diplomaHigh school graduate or GEDSome college, no degreeAssociate DegreeBachelor’s DegreeGraduate or Professional Degree
12%
22%
13%
2% 4%
22%

The populations with the highest attainment level are 25 to 44 year olds; 54 percent had earned an associate degree or higher compared to 45 percent for those age 45 to 64.
Percent of Minnesota Population with an Associate Degree or Higher
40
D A T A S U G G E S T S Younger Minnesotans are attaining more education than their parents and grandparents.
Out
com
es of
Col
lege
Source: U.S Census Bureau, American Community Survey 1 year Estimate
2002 2003 2004 2005 2006 2007 2008 2009 2010 2011 2012 2013 2014 2015
35 to 44 Year Olds25 to 34 Year Olds 45 to 64 Year Olds Total
Perc
ent A
ssoc
iate D
egre
e or H
ighe
r
60%
50%
40%
30%
20%
10%
0%
Minnesota Population Age 25 and OlderAssociate Degree or Higher
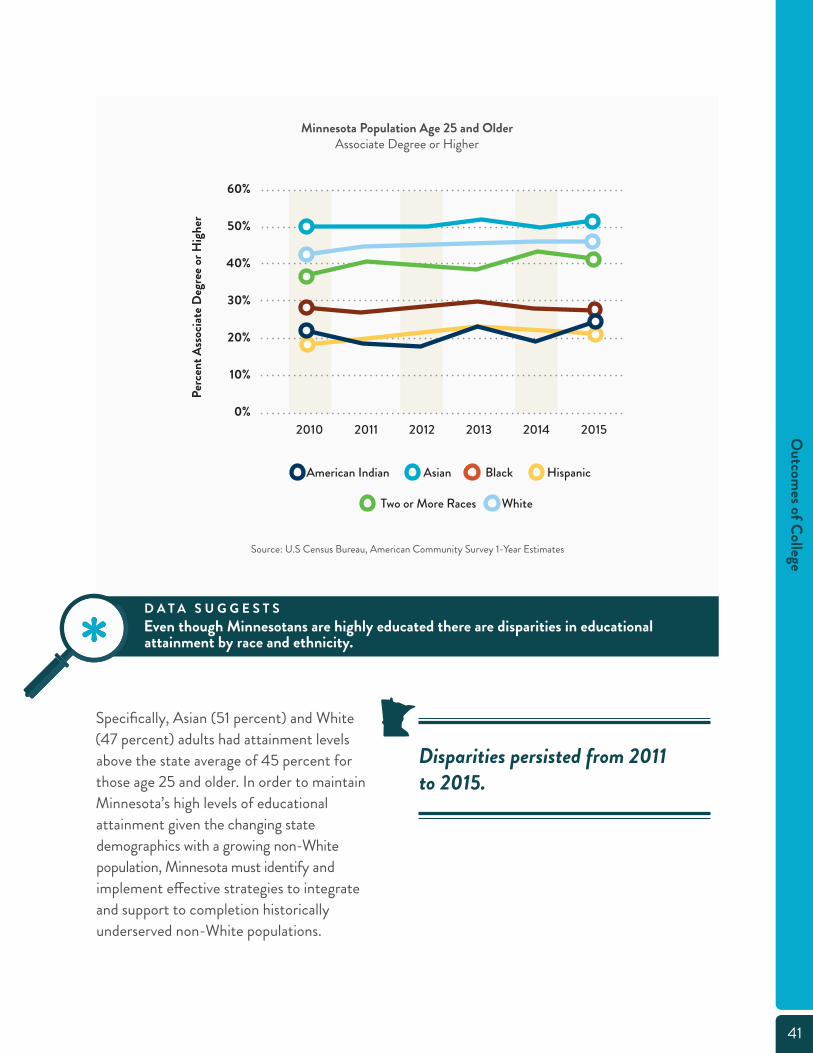
Specifically, Asian (51 percent) and White (47 percent) adults had attainment levels above the state average of 45 percent for those age 25 and older. In order to maintain Minnesota’s high levels of educational attainment given the changing state demographics with a growing non-White population, Minnesota must identify and implement effective strategies to integrate and support to completion historically underserved non-White populations.
Disparities persisted from 2011 to 2015.
41
D A T A S U G G E S T S Even though Minnesotans are highly educated there are disparities in educational attainment by race and ethnicity.
Source: U.S Census Bureau, American Community Survey 1-Year Estimates
Outcom
es of College
Perc
ent A
ssoc
iate D
egre
e or H
ighe
r60%
50%
40%
30%
20%
10%
0%
American Indian Asian Black Hispanic
2010 2011 2012 2013 2014 2015
Two or More Races White

42
Median Annual Wages Increase with Higher Levels of Educational Attainment, 2015Minnesotans Age 25 and Older
Employment and Wages
In 2015, the median annual wage level for Minnesotans was $40,851; however, those with less than a high school diploma had a median annual wage of only $22,801. Wage growth in Minnesotais occurring mainly in jobs requiring the highest levels of education. “The lowest-paid jobs are those that are least likely to have wage gains that keep pace with inflation creating a widening gap between the affluent and the struggling, those
http://mn.gov/deed/newscenter/publications/review/august-2015real-wage-growth.jsp
Note: “Some College” also includes those who completed one- or two-year certificate programs
D A T A S U G G E S T S Minnesotans experienced higher median annual wages as their level of educational attainment increased.
SOURCE: U.S. Census Bureau, 2015 American Community Survey 1-Year Estimates
with years of postsecondary education and those without” according to an August 2015 analysis by the Minnesota Department of Employment and Economic Development (DEED)2.
Out
com
es of
Col
lege
$80,000
$70,000
$60,000
$50,000
$40,000
$30,000
$20,000
$10,000
$0Less than High
School GraduateHigh School
Graduate(Includes
Equivalency)
Some Collegeor Associate
Degree
Bachelor’sDegree
Graduate orProfessional
Degree
Total
28%
$22,801
$31,311$36,845
$51,601
$67,260
$40,851

43
Minnesotans Age 25 to 64 had Higher Rates of Employment with Higher Levels of Educational Attainment, 2015
Note: “Some College” also includes those who completed one- or two-year certificate programs
D A T A S U G G E S T S In addition to higher wages, Minnesotans were more likely to be employed based on higher levels of educational attainment.
SOURCE: U.S. Census Bureau, 2015 American Community Survey 1-Year Estimates
Outcom
es of College
100%
80%
60%
40%
20%
0%Less than HighSchool Diploma
High SchoolDiploma orEquivalent
Some College orAssociateDegree
Bachelor’s Degreeor Higher
Employed Unemployed Not in Labor Force
28%
22%
78%
4%34%
66%
6%
15%
85%
3%10%
90%
2%

The Twin Cities also has a well-educated population compared to other large metropolitan areas.
A 2016 Lumina Foundation report3 ranked metropolitan areas with the highest percentage of their population , aged 25 to 64, with an associate degree or higher. Minneapolis/St. Paul ranked ninth (52 percent) behind San Jose (56), Washington D.C. (56 percent), Madison WI (55 percent), Boston (55 percent), Bridgeport-Stamford (54 percent), San Francisco (54 percent), Raleigh NC (54 percent) and Durham-Chapel Hill (53 percent).
Only 66 percent of Minnesotans with less than a high school diploma were employed, compared to 78 percent with a high school diploma or equivalent, according to U.S. Census data. Participating in postsecondary education increased Minnesotans likelihood of employment; 85 percent of Minnesotans with some college experience or an associate degree were employed. The “some college” category includes individuals that earned a postsecondary diploma or one- or two-year certificate. Minnesotans with bachelor’s degrees or higher had the highest employment level, at 90 percent.
Minnesota’s population ranks high in degree attainment.
The percentage of Minnesota’s population having attained a bachelor’s degree has exceeded the national average since 1970. It remains higher than the Midwest Region average, and equivalent to that of the Northeast Region, which contains several states with high percentages of college-educated populations. In comparing state populations with an associate degree or higher, Minnesota ranked second in the nation with 50 percent of its adult population (aged 25 to 64) with an associate degree or higher in 2015. The percentage of the adult population with an associate degree or higher by state ranged from 52 percent in Massachusetts to a low of 29 percent in West Virginia.
3https://www.luminafoundation.org/stronger_nation44
Out
com
es of
Col
lege

45
Minnesota Ranks High in Percent of Population with an Associate Degree or Higher, 2015
4http://www.census.gov/programs-surveys/acs.html
A B O U T E D U C AT I O N A L AT TA I N M E N T
The U.S. Census Bureau annually collects information on the highest level of education attained by individuals age 18 and older via the American Community Survey4. The data are available by age, gender, race and geography.Most publications focus on adults aged 25 years and older after their education has been completed.
Educational attainment refers to the highest level of education an individual has completed at the time the survey is conducted. Data on educational attainment are derived from a single question that asks, “What is the highest grade of school completed, or the highest degree received?” This question was first implemented in the 1990 Decennial Census and changed in the Current Population Survey in 1992.The Census defines postsecondary as either “some college,” “associate degree,” “bachelor’s degree”, or a “graduate or professional degree.”
Degrees Versus Certificates
Most of the data compares the population with a degree (associate or higher) with non-degree holders. Quantifying non-degree, industry- recognized credentials, as well as individuals’ basic skills progress is of growing importance. A postsecondary certificate (awarded in many vocational programs) is the highest education level needed to enter several high-demand high-wage careers. Current national and state tracking systems are inadequate to quantify non-degree credentials earned as a percent of the population. The U.S. Census Bureau does not collect this data in a separate category. The Census category “some college, no degree” isa catch-all category that includes individuals who are currently enrolled in college and have not finished, individuals who attended college and dropped out before completing a program, and individuals who obtained a postsecondary credential below an associate degree (e.g., diploma or certificate). The U.S. Department of Education is working with the Census Bureau to improve the collection of postsecondary education attainment in non-degree programs and other industry-recognized credentials.
Outcom
es of College
Source: U.S. Census Bureau, 2015 American Community Survey 1-Year Estimates
AGE 25-64 TOTAL
Top States Percent
Massachusetts 52%
Minnesota 50%
Colorado 49%
Connecticut 49%
New Hampshire 48%
Maryland 47%
New Jersey 47%
Virginia 47%
North Dakota 47%
Vermont 47%
NATION 41%
25-34 YEAR OLDS
Top States Percent
Massachusetts 57%
Minnesota 54%
New York 52%
New Jersey 51%
Connecticut 50%
North Dakota 50%
New Hampshire 50%
Illinois 48%
Colorado 48%
Iowa 48%
NATION 43%
35-44 YEAR OLDS
Top States Percent
Massachusetts 54%
Minnesota 54%
Colorado 52%
Maryland 51%
North Dakota 50%
Virginia 50%
New Hampshire 50%
New Jersey 50%
Connecticut 49%
New York 49%
NATION 43%
45-64 YEAR OLDS
Top States Percent
Massachusetts 49%
Colorado 48%
Connecticut 47%
Vermont 46%
Maryland 46%
New Hampshire 46%
Minnesota 45%
Virginia 45%
New Jersey 44%
Washington 44%
NATION 39%
GRADUATION RATES K E Y P O I N T S I N T H I S S E C T I O N
• Graduation rates at Minnesota four-year institutions have remained steady. In 2014, 46 percent of first-time, full time undergraduates graduated within four years and 63 percent graduated within six years. • At Minnesota two-year institutions, the combined rate of students transferring to another institution or graduating within three years was 50 percent.
8
Graduation rates measure whether students are completing their studies and institutional effectiveness in facilitating student completion.High graduation rates may indicate appropriately targeted student recruitment, effective campus communication and scheduling, strong instruction and advising, and accessible student support services. Other variables, such as the academic preparation of students, colleges’ admissions selectivity, student demographics and financial support, also influence graduation rates.
Graduation rates at Minnesota four-year institutions vary by institution and type.
In 2014, 46 percent of Minnesota undergraduates seeking a bachelor’s degree graduated within four years and 63 percent graduated within six years. When comparing individual institutions across the state however, there is a great deal of variation. The six-year graduation rates, in 2014, range from:
• 48 percent to 78 percent at University of Minnesota campuses
• 34 percent to 57 percent at state universities
• 46 percent to 93 percent at private not-for profit institutions.
46
Out
com
es of
Col
lege

47
6-Year Graduation Rates Increasing at the University of Minnesota, 2009 and 2014
The University of Minnesota combined campuses made the greatest stride in improving their graduation rates, with the greatest increase occurring at the Twin Cities campus.
The six-year graduation rate for the combined campuses increased from 44 percent in 2009 to 72 percent in 2014; while the Twin Citiescampus six-year rate increased from 47 percent to 78 percent. Generally the highest graduation rates are within the private not-for-profit institution sector. Now only six Minnesota private colleges have higher six-year graduation rates than the University of Minnesota Twin Cities campus.
SOURCE: Department of Education, IPED Graduation Rate Survey
Outcom
es of College
100%
80%
60%
40%
20%
0%
21%
4-Year GradRate
6-Year GradRate
4-Year GradRate
6-Year GradRate
4-Year GradRate
6-Year GradRate
State Universities University of Minnesota Private 4-Year Colleges(not for profit)
2009 2014 2009 2014 2009 2014 2009 2014 2009 2014 2009 2014
23%
48% 48%
39%
51%
63%
72%
61% 63%
72% 72%

48
Minnesota 3-Year Graduation Rates Gradually Declined at 2-Year Institutions,even when Transfer Rates are Included, 2009 and 2014
Note: Private 2-Year for-profit colleges include only six institutions with 776 students in cohort; compared to 14,153 students in the state college 2-Year cohort. Private 2-Year for-profit colleges do not report transfer-out data.
D A T A S U G G E S T S Graduation rates from two-year institutions should include transfer-out rates to more accurately reflect student outcomes.
T O P 10 M I N N E S O TA I N S T I T U T I O N 6-Y E A R G R A D UAT I O N R AT E , 2014
Carleton College ............................................ 93%Macalester College .......................................90%Saint Olaf College .......................................... 89%Gustavus Adolphus College ........................... 81%College of Saint Benedict .............................. 81%Saint John’s University ..................................80%University of Minnesota-Twin Cities ............78%Bethel University.............................................74%Concordia College at Moorhead ...................72%University of Saint Thomas ............................72%
SOURCE e: Department of Education, IPED Graduation Rate Survey
Combined graduation and transfer rates at two-year colleges were 50 percent.
Minnesota’s two-year institutions offer a variety of programs. Students can enroll in technical/occupational programs culminating in a certificate or associate degree while others enroll in a liberal arts/transfer curriculum preparing them to complete a bachelor’s degree at a four-year institution. The Minnesota Transfer Curriculum, offered at Minnesota’s state colleges, is specially designed for students wishing to transfer to a four-year institution; students may transfer before receiving an associate degree.
Out
com
es of
Col
lege
100%
80%
60%
40%
20%
0%
27%
3-YearGrad Rate
3-Year GradPlus Transfer
RateState Colleges 2-Year Private 2-Year For-Profit
CollegesTotal Minnesota
27%
53% 49%62% 66% 62% 66%
30% 29%
53% 50%
3-YearGrad Rate
3-Year GradPlus Transfer
Rate
3-YearGrad Rate
3-Year GradPlus Transfer
Rate
2009 2014

Students who transfer negatively impact an institution’s graduation rate. Overall, about 10 percent of all undergraduates statewide transferred to another institution in fall 2014. Institutions are classified as four-year or two-year institution by the highest level of undergraduate program offered. This classification determines which student cohort is used to track a graduation rate.
491http://www.ohe.state.mn.us/mPg.cfm?pageID=754
Minnesota Graduation Rates Varied by Race, but were Higher at 4-Year Institutions, 2014
Note: First-time, full-time undergraduates entering college in 2008 at Minnesota 4-Year institutions and 2011 at Minnesota2-Year institutions and graduating from the same institution, or transferring to another institution (2-Year colleges only) by 2014.
A B O U T G R A D UAT I O N R AT E S
The 2014 data1 reflects the graduation rates of first-time, full-time degree-seeking undergraduates who began at a four-year institution in fall 2008 or at a two-year institution in fall 2011. Only students completing their degree or other award at the same institution were included in the graduation rate.
D A T A S U G G E S T S Students of color are not graduating at the same rates as White students, even though their graduation rates are higher from four-year than two-year colleges.
SOURCE: Department of Education, IPED Graduation Rate Survey
Outcom
es of College
100%
80%
60%
40%
20%
0%
19%
AmericanIndian
Asian
47%40%
62%
42% 45% 41%54% 53%
66%
49%
64%
36%
49%
Black Hispanic White Two orMore
AllStudents
3-Year Plus Transfer Rates from 2-Year State Colleges
6-Year Rates from 4-Year Colleges
Rate
at 15
0% of
Nor
mal
Tim
e

AWARDS CONFERRED K E Y P O I N T S I N T H I S S E C T I O N
• The number of academic credentials awarded annually at all levels by Minnesota postsecondary institutions has increased over the past decade, with bachelor’s degrees remaining the most common award conferred. • Health science programs were 28 percent, or the highest number of awards, across all academic levels.
9
Over 102,000 academic awards were conferred last year.
The successful completion of a program of study culminates in the conferring of an academic award. Minnesota’s postsecondary institutions offer a variety of awards at all levels of training. In 2014-2015, Minnesota postsecondary institutions awarded 102,605 academic credentials; a ten-year increase of 30 percent. In 2014-2015 There Were:
• 14,810 certificates and diplomas requiring less than two years of study,
• 20,146 associate degrees,
• 36,751 bachelor’s degrees,
• 2,959 graduate certificates,
• 22,847 master’s degrees, and,
• 5,092 doctoral degrees, both research and professional (such as in law, medicine, or theology).
From certificate to doctorate, more awards were earned in health sciences than any other career cluster during 2014-2015 from Minnesota postsecondary institutions.
At the undergraduate level 25 percent of all awards were in health science followed by business management, marketing and finance (15 percent); and liberal arts, languages and history (15 percent).
Over 800 majors or programs of study are offered by Minnesota postsecondary institutions at the various award levels. To track trends for such a large array of programs, the U.S. Department of Education developed the career cluster taxonomy1 to help align terminology used in postsecondary programs with those used in analyzing careers and occupations.
1http://www.careertech.org50
Out
com
es of
Col
lege

51
Number of Awards Conferred by Minnesota Institutions Increasingover the Past Ten Years, 2006-2015
Note: master’s degrees include those conferred by Capella and Walden Universities, two large national online institutions headquartered in Minnesota with large student growth.
D A T A S U G G E S T S Health science programs were 28 percent of all academic awards.
SOURCE: U.S. Department of Education, IPEDS Completion Survey
Awards Conferred by Minnesota Postsecondary Institutions, 2014-2015 Includes double majors
SOURCE: U.S. Department of Education, IPEDS Completion Survey
Outcom
es of College
Num
ber o
f Awa
rds
Certificate Below Bachelors Associate Degree Bachelor’s Degree Master’s Degree Doctorate
2006 2007 2008 2009 2010 2011 2012 2013 2014 2015
40,000
35,000
30,000
25,000
20,000
15,000
10,000
5,000
0
PROGRAM CLUSTER CERTIFICATES BELOW BACHELOR’S
ASSOCIATE DEGREE
BACHELOR’S DEGREE
GRADUATE CERTIFICATE
MASTER’S DEGREE DOCTORATE TOTAL
Agriculture, Food & Natural Resources 345 343 1,784 9 162 27 2,670
Architecture & Construction 1,195 615 256 4 105 • 2,175
Arts, Audio/Video Tech. & Communications 223 716 3,395 42 204 58 4,638
Business Mgt., Marketing & Finance 1,654 2,120 7,505 294 3,979 400 15,952
Education & Training 380 289 2,441 1,572 5,676 980 11,338
Government & Public Administration 24 21 946 31 523 101 1,646
Health Science 5,872 5,339 7,283 694 8,144 1,970 29,302
Hospitality & Tourism 322 266 52 • • • 640
Human Services 1,544 425 2,359 53 1,788 256 6,425
Information Technology 414 855 1,456 95 557 75 3,452
Law & Corrections 627 1,040 1,372 33 450 771 4,293
Liberal Arts, Languages & History 146 7,130 3,778 68 338 39 11,499
Manufacturing & Transportation 2,013 984 198 • 26 • 3,221
Science, Technology, Engineering & Mathematics 51 210 7,085 65 1,018 415 8,844
Total 14,810 20,353 39,910 2,960 22,970 5,092 106,095

Top 10 Certificates Below Bachelor’s Conferred, 2014-2015
F I E L D S O F S T U DY VA R Y B Y L E V E L O F AWA R D
• certificates below bachelor’s degrees comprised 21 percent of all undergraduate awards. A postsecondary certificate is the highest education needed to enter several high-demand, high-wage careers, including jobs in the healthcare, manufacturing and construction sectors. At the certificate level, programs in health care dominated (40 percent) followed by manufacturing and transportation (14 percent), business (11 percent), human services (10 percent), construction trades (8 percent).
• at the bachelor’s degree level, degrees in business (19 percent), STEM (18percent) and health sciences (18 percent) comprised more than half of the degrees earned. Business continues to be the most popular bachelor’s degree major. Science (STEM) majors, especially biological science, and health science majors have increased at a faster pace than other majors over the last five years.
• at the graduate level most awards are in health science, education, business and law.
SOURCE: U.S. Department of Education, IPEDS Completion Survey
52
Out
com
es of
Col
lege
PROGRAM CAREERCLUSTER NUMBER PERCENT
Nursing Assistant Health Science 1,811 12%
Licensed Practical/Vocational Nurse Training Health Science 1,134 8%
Cosmetology Human Services 921 6%
Welding Technology Manufacturing and Transportation 493 3%
Criminal Justice Law and Corrections 414 3%
Medical/Clinical Assistant Health Science 409 3%
Medical Insurance Coding Specialist Health Science 355 2%
Carpentry Architecture and Construction 313 2%
Massage Therapy Health Science 287 2%
Accounting Technology Business Management 263 2%
All Others 8,410 57%
Total 14,810 100%

53
Top 10 Associate Degrees Conferred, 2014-2015
Top 10 Bachelor’s Degrees Conferred, 2014-2015
SOURCE: U.S. Department of Education, IPEDS Completion Survey
SOURCE: U.S. Department of Education, IPEDS Completion Survey
Outcom
es of College
PROGRAM CAREERCLUSTER NUMBER PERCENT
Liberal Arts and Sciences Liberal Arts 6,862 34%
Registered Nursing Health Science 2,083 10%
Business Administration and Management Business Management 778 4%
Criminal Justice Law and Corrections 505 2%
Accounting Business Management 451 2%
Licensed Practical Nurse Training Health Science 389 2%
Veterinary Animal Health Technology Health Science 319 2%
Health Information/Medical Records Technology Health Science 302 1%
Medical Clinical Assistant Health Science 300 1%
Medical Administrative Health Science 248 1%
All Others 8,116 40%
Total 20,353 100%
PROGRAM CAREERCLUSTER NUMBER PERCENT
Registered Nursing Health Science 2,885 7%
Business Administration and Management Business and Marketing 2,783 7%
Psychology Human Services 2,497 6%
Biology STEM 1,615 4%
Accounting Business and Marketing 1,366 3%
Marketing Business and Marketing 988 2%
Elementary Education and Teaching Education 949 2%
Finance Business and Marketing 815 2%
Multi-/Interdisciplinary Studies Liberal Arts 797 2%
English Language and Literature Liberal Arts 770 2%
All Others 24,445 61%
Total 39,910 100%

54
White and Asian Students Earned Bachelor’s Degrees at HigherPercentages than other Groups, 2014-2015
Overall students of color earned 20 percent of undergraduate awards
Majority of Undergraduate Awards are Earned by Students Younger than 39
Years Old, 2014-2015
Younger students are more likely to attend school full-time, which is an important factor in degree or program completion. Eighty-eight percent of all undergraduate awards (certificates, associate and bachelor’s degrees) were earned by students younger than 40 years old; 57 percent were younger than age 25.
Overall students of color earned 20 percent of all undergraduate awards. However, Asian and White students earned higher percentages of bachelor’s degrees (51 percent) than American Indian (31 percent), Black or Hispanic students (43 percent each).
D A T A S U G G E S T S Students of color earned 20 percent of all undergraduate awards in 2014-2015.
D A T A S U G G E S T S Students younger than age 40 years old earned 88 percent of undergraduate awards.
SOURCE: U.S. Department of Education, IPEDS Completion Survey
SOURCE: U.S. Department of Education, IPEDS Completion Survey
Out
com
es of
Col
lege
58%
Age 24 and Younger Age 25 to 39
Age 40 and Older
11%
31%
100%
80%
60%
40%
20%
0%American
Indian (567)Asian
(3,413)Black
(4,697)Hispanic(2,694)
Two or MoreRaces (1,964)
White(54,332)
Certificate Associate Bachelor’s
28%
31%
32%
37%
51%
24%
27%
43%
27%
30%
43%
26%
31%
47%
24%
29%
51%
20%
29%

55
76% Class of 2014 Graduates wereEmployed in Minnesota Second Year
After Graduation
EMPLOYMENT OF RECENT GRADUATES K E Y P O I N T S I N T H I S S E C T I O N
• Of Minnesota’s postsecondary graduating class of 2014, 76 percent were employed in Minnesota two years after graduation. • The level of award earned showed the greatest effect on wages earned by graduates.
10
Individuals with education beyond high school earn more, on average, with each increased level of education.
Increasing tuition costs and debt levels of graduates have led to questioning the value of college. Yet, an increasing number of occupations require training beyond high school even though not all jobs requiring a postsecondary credential pay equally.
Graduates are also more likely to be employed.
Employers tend to favor job applicants who have attended college even though the jobs may not require college level skills; known as underemployment. “Between 2000 and 2012, the job market was so challenging for recentgraduates that growing numbers were forced to
1New York Times, June 8, 2014. “Degree? Check. Enthusiasm? Check. Job? Not So Fast: Brooklyn College Graduates Step In to Depressing Job Market.” www.nytimes.com/2014/06/09/nyregion/brooklyn-college-graduates-step-in-to-depressing-job-market.
html?_r=0
SOURCE: Minnesota Office of Higher Education and Minnesota Department of Employment and Economic Development
Outcom
es of College
take jobs that didn’t require bachelor’s degrees, including low-wage and part-time jobs, the Federal Reserve Bank of New York reported in 2014. By 2012, about 44 percent wereunderemployed.”1
76%
21%
3%
Employed in MinnesotaContinuing EducationNo Employment Data Found

Graduates working full time after graduation earned more at each additional level of education.
Annual Median Wage of Minnesota College Graduates Increases with each Level of Education Class of 2012 graduates employed full-time,
year-round in Minnesota during 2nd and 4th year after graduation
Note: Percent of 78,852 graduates working full-time, year-round after graduation shown at the bottom of each bar.
T R A C K I N G O F R E C E N T G R A D UAT E S W O R K I N G I N M I N N E S O TA S H O W S :
• Annual median wage was $44,922 for all employed graduates working full-time, year round statewide during the second year after graduation. Wages increased to $51,309 in the fourth year.
• Annual median wages were higher for graduates working in the Twin Cities than those working in Greater Minnesota.
SOURCE: Minnesota Office of Higher Education and Minnesota Department of Employment and Economic Development
56
Out
com
es of
Col
lege
$80,000
$70,000
$60,000
$50,000
$40,000
$30,000
$20,000
$10,000
$0Certificates Associate Degree Bachelor’s Degree Higher then Bachelor’s
Degrees
35% 45% 36% 47%
Annu
al m
edian
full-
time w
age
2nd Year 4th Year
42% 53% 48% 52%
$37,361$42,328
$39,461$44,761 $43,304
$51,494
$66,267
$75,336

57
88% of Graduates are Employed in Top 7 IndustriesClass of 2013 graduates employed 3rd year after graduation
2http://mn.gov/deed/data/data-tools/graduate-employment-outcomes
A B O U T T H E G R A D UAT E E M P L OYM E N T O U T C O M E T O O L
The Graduate Employment Outcome Tool2 provides data to view and compare employment outcomes of Minnesota postsecondary graduates working in Minnesota receiving differing levels of education and programs of study. The tool provides data on the employment and wages of past graduating classes from Minnesota postsecondary institutions who now work in the state.
Employment data are not available by occupation of the employee but only by one of the 22 industry sectors of the employer. As a result, it is difficult to accurately attributewhether a graduate’s employment is directly related to their field of study.
The largest number, or 28 percent, of certificates and degrees are awarded in health science fields and not surprisingly, the largest number of graduates work in health care. The health care industry is unique in a couple of ways compared to others within the state. Even though many health care occupations require postsecondary education and training for employment the skill level and wages are quite polarized. There are many minimum-wage jobs, such as home health aides, but also some of the highest-wage and skilled jobs for nurses and physicians. As a whole, it is an industry with good occupational job growth projections as a result.
D A T A S U G G E S T S The health care industry sector employed 39 percent of class of 2013 graduates after 3rd year.
Source: Minnesota Office of Higher Education and Minnesota Department of Employment and Economic Development
Outcom
es of College
Health Care
Professional and Technical Services
Finance and Insurance
Elementary and Secondary Schools
Retail Trade
Manufacturing
Public Administration
0% 10% 20% 30% 40%
39%
14%
10%
9%
6%
5%
5%

DEBT OF COLLEGE GRADUATES AND REPAYMENT OF LOANS K E Y P O I N T S I N T H I S S E C T I O N
• The median debt of bachelor’s degree recipients who graduated in 2015 was $26,822 and 71 percent of these students borrowed student loans. • Students attending every type of public and private institution in Minnesota had lower loan default rates, on average, than national rates. • Students attending public two-year institutions had the highest default rates in Minnesota compared to other types of institutions. This is consistent with national trends.
11
The Minnesota Office of Higher Education monitors loan and debt trends to evaluate state financial aid policies. Loans are one of two major sources of undergraduate financial aid used by students and their families to pay for higher education. The other source is grants and scholarships. In Fiscal Year 2015, Minnesota undergraduates received $1.4 billion from student loan programs out of $3.06 billion in total financial aid. Even though the percentage of financial aid derived from student loans, compared to grant aid, was the same in 2003, the total amount of both types of aid doubled from 2003 to 2015. In addition to loans students borrow, parents borrowed $135 million in federal loans in 2015, or four percent of total aid, to help their children.
58
Out
com
es of
Col
lege

591http://www.ohe.state.mn.us/pdf/CumulativeStudentLoanDebtReport.pdf
D A T A S U G G E S T S Students continue to rely on loans to finance their postsecondary education.
The median debt of bachelor’s degree recipients in 2015 was $26,822 and 71percent of bachelor’s degree graduates borrowed loans. The median debt amount was similar for the previous two graduating classes.
Cumulative debt by award type earned is collected by the Minnesota Office of Higher Education. The Cumulative Debt report1 provides the cumulative student loan debt on graduates over the past four years at each institution and at each award level. Minnesota students graduating with bachelor’s degrees had higher debt than the national average debt, but they had lower loan default rates than students nationally.
Grant Financial Aid Awarded and Loans Borrowed to MinnesotaUndergraduates Doubled from 2003 to 2015
SOURCE: Minnesota Office of Higher Education
Outcom
es of College
$3,500
$3,000
$2,500
$2,000
$1,500
$1,000
$500
$0Student Work
StudyLoans toParents
Grants Loans toStudents
Tota
l Aid
in $
Mill
ions
2003 2015
$24Total
$38 $67 $135
$687
$1,508
$777
$1,384$1,555
$3,065

D A T A S U G G E S T S Professional degree graduates accrue the highest debt.
The Federal Pell Grant and the Minnesota State Grant are two government financial aid grant sources available only to undergraduates.
Students completing graduate level education had more debt than undergraduates as graduate school is more costly and grant aid such as fellowships or other institutional aid is limited for many graduate students. Debt increased as the level of degree and specialization increased. This was especially acute in the medical and health sciences fields at the graduate and professional level. Students graduating with first professional degrees in law, medicine, dentistry, veterinary medicine and theology had median debt of $139,100.
Median Cumulative Debt of Minnesota Graduates Increased with Each Level of Education Completed, 2012-2015
SOURCE: Minnesota Office of Higher Education
60
Out
com
es of
Col
lege
$160,000
$140,000
$120,000
$100,000
$80,000
$60,000
$40,000
$20,000
$0Sub-
BaccalaureateCertificate
AssociateDegree
Bachelor’sDegree
Master’sDegree
DoctoralDegree
FirstProfessional
Amou
nt B
orro
wed
2012
$11,2
00
$11,3
00
$11,2
00$1
1,300
$18,
600
$19,
300
$19,
100
$18,
200
$27,
500
$27,
300
$27,
400
$26,
800
$33,
200
$33,
800
$33,
900
$34,
500 $5
6,80
0
$64,
000
$59,
100
$63,
200
$129
,600
$138
,400
$137
,600
$139
,100
2013 2014 2015

61
Undergraduates Attending Minnesota Colleges were less likely toDefault on Federal Student Loans than their Peers Nationally, 2013
2 http://www2.ed.gov/offices/OSFAP/defaultmanagement/index.html
D A T A S U G G E S T S Minnesota undergraduates have low federal loan default rates. However, students attending public 2-year colleges had the highest default rates.
The U.S. Department of Education publishes default rates of undergraduates who borrowed federal loans annually.2 Undergraduates attending Minnesota colleges were less likely to default on federal student loans than their peers nationally, though they were more likely to borrow than students in other states.
At 8.8 percent, Minnesota’s Fiscal Year 2013 three-year default rate ranked 41st of the 50 states. New Mexico (19 percent) had the highest rate and Massachusetts (6 percent) had the lowest rate. Nationally, the default rate was 11.3 percent, a decrease from 11.8 percent from the previous cohort.
Minnesota undergraduates have lower default rates than the national average.
The three-year default rate of Minnesota borrowers decreased from 9.8 percent in Fiscal Year 2012 to 8.8 percent in Fiscal Year 2013. The number of students defaulting also decreased from 15,744 to 14,062.
SOURCE: U.S. Department of Education
Outcom
es of College
25%
20%
15%
10%
5%
0%Public 2-Year Public 4-Year Private 4-Year
Not-For-ProfitPrivate
For-Profit
Perc
ent o
f Def
ault
Rate
Minnesota Nation
15%
Total
19%
4%7%
3%
7%8%
15%
9%11%

Repaying loans can be problematic.
Taking on debt to pay for higher education is an important option for many students and families. Federal student loan programs accounted for 75 percent, or $1.3 billion, of all federal student aid obtained by students or their families attending Minnesota institutions in 2015. Because obtaining a higher education credential is seen as a personal benefit, paying for the education, as well as repaying debt, is viewed partly as the responsibility of the individual.
Minnesota Students Default Rates are Lower than National Average Fiscal Year 2013 3-Year Offical Cohort Default Rates
Two factors impacting the ability to repay student loans include borrower incomes and choice of repayment terms. Any amount of debt can become problematic if the borrower’s income is insufficient to repay the debt. Federal government loans offer repayment plans that may help borrowers who are struggling to repay their loans. Available federal loan options for reduced monthly payments include income-based repayment, extended repayment, unemployment deferments, economic hardship deferments and up to five years of forbearance. Unfortunately, students who take out private or bank loans do not always have the same loan repayment options offered through the federal student loan program which could impact their ability to repay all their loans.
SOURCE: U.S. Department of Education, Office of Student Financial Aid Programs
62
Out
com
es of
Col
lege
STATE NUMBER OF SCHOOLS
NUMBER OF BORROWERS IN
DEFAULT
NUMBER OF BORROWERS ENTERED
REPAYMENT
BORROWER DEFAULT RATE
Illinois 249 21,671 230,233 9.4%
Indiana 117 24,474 171,454 14.2%
Iowa 87 11,827 99,246 11.9%
Michigan 136 22,316 187,809 11.8%
Minnesota 108 14,062 159,343 8.8%
North Dakota 24 899 13,773 6.5%
South Dakota 23 2,623 21,170 12.3%
Wisconsin 91 9,192 95,128 9.6%
Total 6,155 593,182 5,211,531 11.3%

63
A B O U T D E FAU LT R AT E S
The U.S. Department of Education releases annual official cohort default rates3 once per year.
The Higher Education Opportunity Act of 2009, enacted by the U.S. Department of Education, published regulations governing the calculation of cohort default rates. An institution’s cohort default rate is calculated as the percentage of borrowers in the cohort who default before the end of the second fiscal year following the fiscal year in which the borrowers entered repayment. This extends the length of time in which a student can default from two to three years.
A three-year cohort default rate is the percentage of a school’s borrowers who enter repayment on certain Federal Family Education Loan (FFEL) Program or William D. Ford Federal Direct Loan (Direct Loan) Program loans during a particular federal fiscal year, October 1 to September 30, and default or meet other specified conditions prior to the end of the second following fiscal year.
3http://www2.ed.gov/offices/OSFAP/defaultmanagement/index.html
Outcom
es of College

APPENDIX A: DEFINITIONS AND TERMS USED IN THE REPORT
Certificates
Certificates are earned in programs below the sub-baccalaureate degree. There are three types of certificate programs based on duration of study. One can be completed in less than one year. The other can be completed in one but less than two years in length. There are a few programs offered at Minnesota postsecondary institutions that are two, but less than four years in length. All three types are grouped together for data purposes in this report. Certificates are predominantly offered in occupationally-specific programs.
Concurrent Enrollment
A high school student enrolled in one or more college-level courses while still attending high school.
First-Time, Full-Time Freshmen
A cohort of undergraduate students admitted as freshmen attending a postsecondary institution the first-time since graduating high school. They are also attending full-time and are degree-seeking students at their time of admittance. Does not include transfer students, but may include students admitted with advanced standing due to credits earned while still attending high school.
Institution Definitions
four-year institutions
For data from the Office of Higher Education’s Student Enrollment Record Database, four-year institutions are all postsecondary institutions in Minnesota offering bachelor’s degrees as their primary undergraduate degree. For data from IPEDS, four-year institutions are all postsecondary institutions offering a program of at least four years duration or one that offers programs at or above the baccalaureate level. Includes schools offering only post-baccalaureate certificates or graduate programs and free-standing medical, law or other first-professional schools.
two-year institutions
For data from the Office of Higher Education’s Student Enrollment Record Database, two-year institutions are all postsecondary institutions in Minnesota offering associate degrees as their primary undergraduate degree. For data from IPEDS, two-year institutions are postsecondary institutions offering programs of at least two but less than four years duration. This includes occupational and vocational schools with programs of at least 1,800 hours and academic institutions with programs of less than four years but not bachelor’s degree-granting institutions where the baccalaureate program can be completed in three years.
A
64
Appe
ndix
A

65
Appendix A
Institutional Grants
All grants, scholarships, tuition discounts, fellowships and gift aid awarded by the institution.
Institutional Loans
Institution loans are educational loans from the institution to the student and his or her parents from institution controlled funds.
IPEDS
The Integrated Postsecondary Education Data System (IPEDS) are a series of surveys administered by the U.S. Department of Education’s National Center for Education Statistics. All U.S. postsecondary institutions eligible to participate in federal student aid programs are required to complete the surveys. Data are collected and reported at the institutional level.
Minnesota State Colleges and Universities
This state-supported system comprises seven state universities and 30 state colleges across Minnesota. The institutions are governed by the Minnesota State Colleges and Universities (MnSCU) system.
where appropriate in this report: • State universities were included with public 4-year institutions
• State colleges were included with public 2-year institutions
Minnesota State Grant Program
Postsecondary grants provided by the state to eligible Minnesota resident undergraduates attending a Minnesota institution. The award is based on the financial circumstances of the student and his or her family and estimated educational costs.
Minnesota SELF Loan Program
The SELF Loan is a long-term, low-interest educational loan primarily for Minnesota students who need assistance paying for education beyond high school. Borrowers pay interest while they are in school.
If you have more questions about colleges in Minnesota visit our website: www.ohe.state.mn.us

APPENDIX B: DATA SOURCES USED IN THE REPORT
B
Exam Data
The Office of Higher Education obtained data from the following organizations, for data on various assessments and admissions exams completed by students:
act: (act.org) Data on ACT test takers.
college board: (collegeboard.org) Data on advanced placement test takers.
minnesota department of education: (education.state.mn.us) Data on the Minnesota Comprehensive Assessment exam taken by public high school students.
Minnesota Department of Education
(education.state.mn.us) Data on Minnesota high school graduates, high school assessments and concurrent enrollment programs.
Minnesota Department of Employment and Economic Development
(mn.gov/deed) Data on employment and wages of Minnesota’s workforce.
Minnesota Office of Higher Education
(ohe.state.mn.us) Data on students enrolled during the fall term in Minnesota’s public and private postsecondary education institutions. Data on financial aid awarded from Minnesota funded programs. Data from the State Longitudinal Educational Data System (SLEDS) on employment outcomes of Minnesota graduates working in Minnesota.
State Longitudinal Educational Data System (SLEDS)
(sleds.mn.gov) Data on developmental education and employment outcomes of college graduates.
U.S. Census Bureau
(census.gov) Data on educational attainment of the population and student employment from the American Community Survey.
U.S. Department of Education
(ed.gov) Data on enrollment, degrees conferred, student financial aid, and institutional characteristics from the National Center of Education Statistics (NCES) Integrated Postsecondary Education Data System (IPEDS) from the nation’s postsecondary institutions (nces.ed.gov/ipeds). Data on federal student aid cohort default rates (federalstudentaid.ed.gov/datacenter/cohort.html).
Appe
ndix
B
66


MINNESOTA OFFICE OF HIGHER EDUCATION1450 Energy Park Drive, Suite 350Saint Paul, MN 55108-5227
TEL 651.642.0567 or 800.657.3866TTY RELAY 800.627.3529FAX 651.642.0675
E-MAIL [email protected]
www.getready.state.mn.uswww.ohe.state.mn.uswww.selfloan.state.mn.us
©2017 Minnesota Office of Higher Education
This document can be made available in alternative formats to persons with disabilities upon request.