minnesota residents all 2018 · 2018-12-03 · the sample included both landline phones (20% of the...
TRANSCRIPT

SURVEY OF MINNESOTA RESIDENTS FALL 2018 Research report prepared by St. Cloud State University Survey Center November 5th, 2018

2 SCSU Survey Research Center Fall 2018 Statewide Survey: Political Report
St. Cloud State University Survey Annual Fall Statewide Survey 2018 Political Report This is the first news release from the St. Cloud State University Survey Annual Fall Statewide Survey for 2018. The 2018 St. Cloud State University Fall Survey findings are based on telephone interviews with a representative sample of 502 adults in Minnesota, with a margin of error of ±6.35%.1 The sample included both landline phones (20% of the sample) and cell phones (80% of the sample). Interviews were conducted from October 15 to October 30, 2018 at the St. Cloud State University Survey Lab by students in POL 111 (Introduction to U.S. Politics), POL 470 (Public Opinion), PSYC 119 (Psychology as a Discipline and Profession), ECON 406 (Intermediate Microeconomics), SOC 201 (Social Inequality), SOC 303 (Research Methods in Sociology), and SOC 304 (Social Statistics). For a brief summary of the sampling methodology and weighting procedure, please see Appendix B. The questions for this year’s survey (see Appendix C for full questionnaire and exact question wording) were developed by the faculty and student directors of the Survey Center to measure attitudes on topics of public interest, particularly this year’s midterm elections, as well as topics related to the research interests of the principal investigators. We continue to add to our longitudinal data on the political preferences of Minnesotans with a number of questions relating to political preferences and approval ratings of current elected officials, as well as a number of questions on specific issues, such as immigration, climate change, media preferences, and the ways in which respondents feel connected to their communities. Findings: 2018 Election Preferences Interest in this year’s midterms is particularly high, and it seems likely that Minnesota will once again be at, or near, the top of the nation’s voter turnout statistics. Nearly 60% of respondents reported having a “great deal” of interest in this year’s election, with only 5% reported “no interest at all,” and a whopping 83% of Minnesotans said they were “almost certain” to vote. The election preferences reported here are for this large pool of likely voters. Regarding voters’ election preferences, we first asked respondents who they would support for various state and national offices “if the election were held today.” First, we asked respondents to identify which party they would support if the congressional elections and we found that 55% of Minnesotans who are “almost certain” to vote indicated they would support the Democratic ticket, while only 39% would support Republican candidates. This result is well outside the margin of error, and only 4% of respondents reported being uncertain (i.e., “Don’t Know”) about their vote. Next, we asked likely voters which party they thought would gain more seats in the congressional elections, “setting aside your own preferences.” This question provides some insight into the respondents’ political perceptions of the current state of electoral politics apart from their own ideological and partisan preferences. We find that 60% of Minnesotans believe that the Democrats will gain seats in next year’s election, while only 25% believe Republicans will build on their
1 NOTE: The margin-of-error for our sample of 502 is ±4.37% but minor weighting of the data required an alternate calculation of the error to reflect the weighting process. This formula produces a higher margin-of-error of ±6.35%. The data were weighted on gender and age in order to more accurately reflect the true population. Subsample analyses will have a higher margin of error, so caution should be exercised in interpretation. More details may be found in Appendix B, and in a separate methodology report that will be available on our website in late December.

3 SCSU Survey Research Center Fall 2018 Statewide Survey: Political Report
current majority. These results suggest that Minnesotans generally agree with the conventional wisdom that the president’s party generally loses seats in midterm elections.
[Table 1 Here] For Minnesota statewide races, we asked likely voters which candidate they would support “if the election were held today.” As Table 1 shows, the DFL candidate is favored in all of the statewide races that we asked about, including Governor, both Senate races, and the Attorney General race. For Governor, Tim Walz was the choice for 50% of likely voters, with 34% indicating they would vote for Jeff Johnson. While this is well outside the margin-of-error, it is worth noting that 15% indicated that they did not yet know who they would vote for (and another 1% planned to vote for another candidate). For the US Senate races, Amy Klobuchar enjoys widespread support, with 54% of likely voters indicating they would vote for her, as opposed to 28% who planned to vote for Jim Newberger. As with the Governor’s race, there were a significant number of voters – 14% – who indicated they were still undecided. For the special Senate election to replace Al Franken, Tina Smith was the choice for 44% of likely voters, with Karin Housely chosen by 29%. This race had the highest percentage of “undecided” voters, with 23% reporting they remained undecided. In the Attorney General race, Keith Ellison appears to hold a slight advantage over Doug Wardlow, 52% to 34%, but the difference here is the same as the margin of error, and 22% of likely voters report that they are still undecided. Partisan Differences on Key Issue Areas In an effort to better understand the partisan differences driving voters’ choices, we asked a number of questions relating to respondents’ perceptions and preferences on important issues of the day. In Table 2, we report the partisan breakdowns on some of these questions. The data reveal some significant differences on some key issues, and surprisingly high levels of agreement on a few others. On the issue of climate change, there is widespread agreement that climate change is actually happening, though there is significant disagreement about whether it is primarily caused by human activity (94% of Democrats, 35% of Republicans) or primarily due to natural forces (6% of Democrats, 59% of Republicans).
[Table 2 Here] Two issue questions sought to tap partisan views regarding women in politics, and how public officials should respond to allegations of sexual misconduct. Regarding women in politics, 89% of Democrats indicated that “the country would be governed better if more women were in political office,” compared with only 31% of Republicans. Most Republicans, 62%, indicated that the country would be “neither better nor worse” if more women were in political office, and only 2% of the overall sample indicated that the country would be “worse” with more women in government. With respect to allegations of sexual misconduct, 66% of Democrats said that “if a public official has been accused of misconduct by multiple people, then that official should resign,” as opposed to only 30% of Republicans. The majority preference for Republicans was “should not resign” but another 33% indicated that they would need “more information” to make a judgment.

4 SCSU Survey Research Center Fall 2018 Statewide Survey: Political Report
Another issue that divided partisans in the state was NFL players’ kneeling during the national anthem as a form of protest, with 72% of Democrats indicating approval of the protest and 96% of Republicans indicating that they disapproved. One area of widespread, bipartisan agreement related to the possible discussion of politics over the Thanksgiving holiday dinner – 62% of Democrats and 64% of Republicans indicated that they were “dreading” the discussion of politics with friends and family at Thanksgiving, while only about 37% of partisans were “looking forward to” it. Finally, we asked a few questions relating to the important campaign issue of immigration, and found indications of both disagreement and some areas of agreement. Democrats overwhelmingly indicated a perception that the impact of immigration in this country was “positive” with 90% reporting either “very positive” or “somewhat positive.” Republicans were less enthusiastic, with only 42% indicating “positive” and “43% reporting either “negative” or “very negative.” On the other hand, a majority of both parties reported that the statement “immigrants provide racial diversity” was closer to their views on immigration than the statement “immigrants decrease the white majority,” with 97% of Democrats choosing the diversity statement, and 76% of Republicans doing the same. Gender and Age Differences on Electoral and Issue Preferences Given widespread speculation that women will be an important voting bloc this election in the wake of the Kavanaugh hearings and the “#metoo” movement, we broke down the election and issue results by gender and found there were some significant difference in the preferences of men and women this election. In general, women preferred Democratic candidates to Republican ones by margins that exceeded the margin of error for the survey. On the generic congressional ballot, women preferred Democrats to Republicans 61% to 34% while men were evenly split at 45% each. In the Governor’s race, women preferred Walz to Johnson 55% to 28%, with men essentially split again 38% to 36% (well within the margin of error). Women preferred the two Democratic candidates for the Senate, with 63% for Klobuchar and 54% for Smith, both of which far exceeded their support among men (40% and 30%, respectively). Finally, Keith Ellison enjoyed a healthy lead among women voters, with 51% reporting they would vote for him compared with only 30% for Doug Wardlow, a result that should be of significant interest given the allegations of domestic abuse leveled against Ellison by a former girlfriend earlier this year.
[Table 3 Here] On selected issue questions, majorities of both men and women agreed (though to varying degrees) that our country would be “governed better” if more women were in political office, with 54% of men and 70% of women choosing that option. Regarding allegations of sexual misconduct, more women (56%) than men (42%) indicated that a public official should resign if accused of sexual misconduct by multiple people. Men and women also shared a disapproval of NFL players kneeling during the anthem, with 60% of men and 57% of women expressing disapproval. Women were slightly more likely than men to report “dreading” political discussion over Thanksgiving dinner (69% to 60%), and they were more likely than men to view the impact of immigrants as positive (74% to 60%).

5 SCSU Survey Research Center Fall 2018 Statewide Survey: Political Report
Finally, we also broke down the election and issue results by age group, expecting that “life cycle” effects that generally lead older people to be more conservative might impact the political preferences of Minnesotans. However, we found very little difference between the different groups, as Table 4 shows. The principal areas of disagreement between age groups was in the perception of who is most likely to win the election (with 82% of 18-24 year olds indicating they believe the Democrats will win, as opposed to only 54-55% for the other groups), and in attitudes towards immigration, with young people having significantly more positive attitudes about immigrants than their older cohorts (82% of 18-24 year olds, as opposed to 60%, 65%, and 72% of the other groups, respectively. Young people were also more likely to report that they were “dreading” political discussion over Thanksgiving dinner (87% compared to 65%, 58%, and 60% for the other groups).
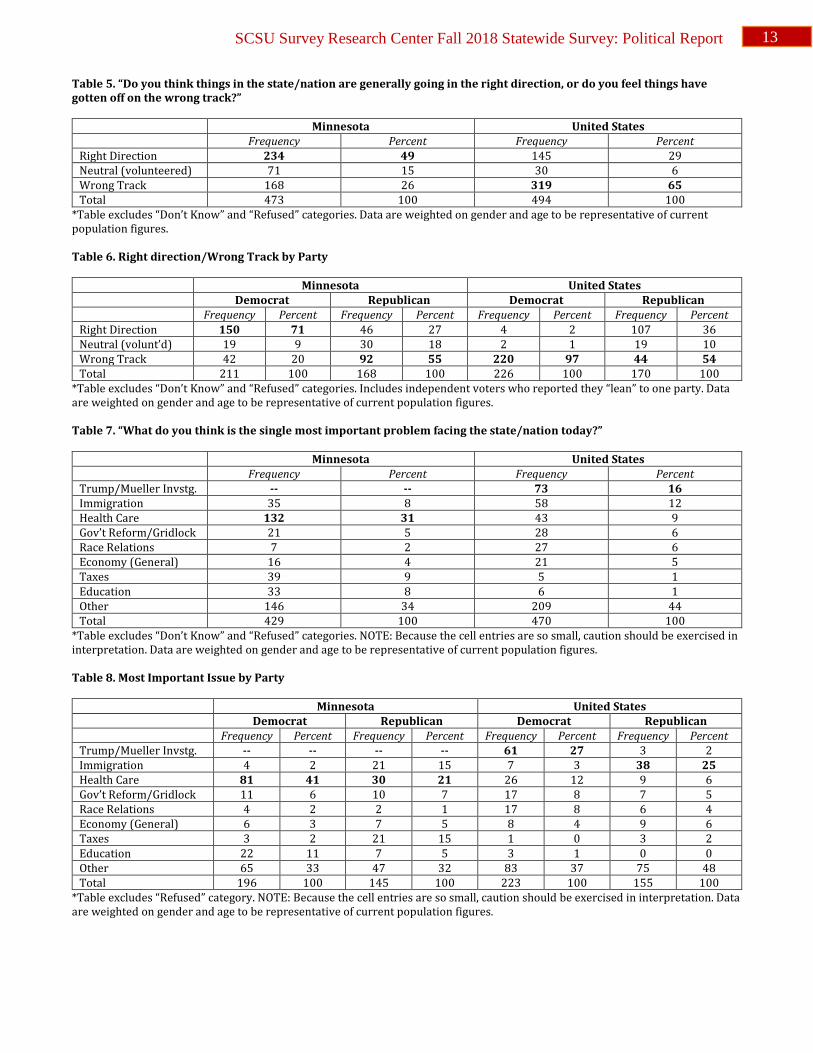
[Table 4 Here] Findings: Direction of the State Significantly fewer respondents are optimistic about the direction of the state compared with last year, when nearly six out of every ten Minnesota adults surveyed (59.5%) though the state was heading in the right direction. This year, only 49% responded positively, and 26% of respondents indicated they felt the state was moving in the wrong direction (to be fair, though, last year’s result was the highest level we had recorded since 2000, when 70% reported “Right Direction”). We also asked respondents the same question regarding the direction of the nation, and, like last year, Minnesotans expressed far less confidence that the nation is heading in the right direction. Only 29% of our respondents felt the nation is heading in the right direction (up slightly from 23% last year) compared with 65% (down from 69% last year) who believe our country is on the wrong track. These figures suggest that Minnesotans are less optimistic about the state of the nation than the national polling average. The Real Clear Politics average of all polls for September/October (9/27 to 11/3) show that 39% of Americans believe our country is moving in the right direction and 54% feel we are on the wrong track nationwide (http://www.realclearpolitics.com/epolls/other/direction_of_country-902.html).
[Table 5 Here] We also examined differences between Democrats and Republicans and found predictable differences in the perceptions of these groups. On the state level, with a Democratic governor in office, Democrats were much more optimistic about the direction of the state than Republicans, with 71% of Democrats reporting “right direction” as opposed to only 27% of Republicans. Only 20% of Democrats felt the state was moving in the wrong direction, compared with 55% of Republicans. On the national level, and with an additional year of President Trump in office, the two parties have continued to diverge in their evaluations of the direction of the country. Of the Democratic respondents (including independents who said they “lean” Democratic), only 2% expressed a belief that the country is headed in the right direction, while 36% of Republicans (including “leaners”) believed we are moving in the right direction. The gap between partisan evaluations has grown a bit larger since last year’s results, in which 11% of Democrats believed that the country was on the right track, as opposed to 39% of Trump voters who shared that view. This year, 97%

6 SCSU Survey Research Center Fall 2018 Statewide Survey: Political Report
of Democrats expressed a belief that our country is on the wrong track, while 54% of Republicans shared that view – both are increases from last year’s results (83% of Democrats vs. 47% of Republicans).
[Table 6 Here] We also asked respondents what issue they believed was the single most important issue facing both the state and the nation and found a wide range of concerns. Health care was the principal concern at the state level, with 31% of respondents reporting that as the top issue facing the state, followed by Taxes at 9% and Education and Immigration both at 8%. These results are fairly consistent with last year’s survey, albeit with more respondents reporting Health care as the top concern this year (it was only 14% last year), and a high percentage of respondents (14%) indicating they “Don’t Know.” The size of the difference between Health care and Immigration as perceived problems may help explain why the Democrats are ahead in the polls, since the Democrats as a national party are emphasizing health care while the Republicans are emphasizing immigration; clearly, health care seems to be regarded by Minnesotans as the more pressing issue. When asked to name the single most important issue facing the nation, we were again surprised by the high percentage of respondents this year who indicated elected officials (most often, the president or Congress) as the top problem facing the nation. In response to respondent answers last year, we added a category for “Trump/Mueller Investigation/Impeachment” and it came in as the top overall category with 16% respondents citing it as the single most important problem facing the nation. An additional 6% reported “Government Reform/Gridlock” as the top problem, which generally captures dissatisfaction with Congress and the bureaucracy. Immigration was the next most popular response, with 12% of respondents indicating it was the biggest national problem, followed by 9% citing health care, and 6% each for Race Relations and Government Refort/Gridlock. [NOTE: While these data are suggestive of what issues respondents find to be important, the small numbers for each issue category make it impossible to speak very confidently about the results from a statistical standpoint].
[Table 7 Here] We also broke down these issue results by party and, like last year, found more similarities than expected. Both Democrats and Republicans believed that Health Care was the top issue facing the state, with 41% of Democrats and 21% of Republicans offering that response to our open-ended question (both were steep increases from last year’s figures of 12% and 15%). Beyond Health Care, however, there were substantial differences, with 15% of Republicans mentioning Immigration as the top problem facing the state, as opposed to only 2% of Democrats who cited the issue. The next most significant state issue for Democrats was Education at 11% (same as last year), whereas only 5% of Republicans cited that issue as the top issue facing the state.
[Table 8 Here] On the national level, we found sharp differences between Democrats and Republicans in their evaluations of Trump and the Mueller investigation as a national problem, with 27% of Democrats citing that issue as opposed to only 2% of Republicans. The top national issue for Republicans was Immigration, at 25% (compared to only 3% of Democrats), and both Democrats (12%) and Republicans (6%) seemed to regard Health Care as an important national issue.

7 SCSU Survey Research Center Fall 2018 Statewide Survey: Political Report
Findings: Partisanship, Ideology, and Approval Ratings of State and National Leaders The partisanship and ideology of Minnesotans remain quite stable. Like last year, we find that 46% of Minnesotans identify as Democrat, with Republican identification slightly up this year from 31% to 35%. Similarly, ideology has been remarkably consistent over the past several years, with 32% of respondents identifying as Liberal and 37% of respondents identifying as conservative, which is nearly identical to last year when the split was 35% liberal and 36% conservative. Nearly the same percentage of respondents – 31% – identifies as “moderate.”
[Tables 9 and 10 Here] This year, with both senators up for election and taking survey length into consideration, we only asked respondents to evaluate the job performance of outgoing Governor Mark Dayton, and President Donald Trump. Governor Dayton’s job approval rating stands at 42% compared with 25% who rated him “poor” or “very poor.” President Trump’s approval ratings remain remarkably low, even when compared to his historically-low national averages. As is our usual practice, we combine “Excellent” and “Pretty Good” responses into a single “Approve” category, and “Poor” and “Very Poor” into a single “Disapprove” category. For President Trump, we find that only 31% of respondents reported approving of his job performance, and 41% of Minnesotans expressed disapproval of President Trump’s job performance. Both of these marks represent an improvement for last year when the president was at 29% approve and 71% disapprove.
[Table 11 Here] Finally, we also broke down job approval ratings for these officials by party and found very sharp divisions between these groups on their ratings of these figures. For example, 89% of Democrats held a negative view of President Trump’s job performance. , while 85% of Trump voters held an unfavorable view of the President. For Governor Dayton, 72% of Democrats held a favorable view, while 48% of Republicans regarded him unfavorably. Finally, in an effort to better understand the reasons for the sharp political divisions in the population, we once again asked some questions relating to news media usage to see if there might be a connection between where people get their news and who they support in the election. These data reveal some interesting differences between the news media usage of Democrats and Republicans. For example, television news was the principal news source for 50% of Republicans, as opposed to 33% of Democrats, which was a wider gap than last year (when 43% of Republicans and 37% of Democrats relied on TV news). Nearly equal percentages of Republicans and Democrats (13% to 10%, respectively) reported newspapers as their primary source of news, and roughly equal percentages relied on radio (18% to 14%). However, like last year, there were some interesting differences with respect to the types of radio and TV programs relied on by Democrats versus Republicans. For example, of those who reported radio as their principal news source, 88% of Democrats favored “traditional news programs like NPR’s Morning Edition or All Things Considered” while only 30% of Republicans reported a preference for such programs. Instead, Republican radio listeners were far more likely than Democrats to rely on “political talk radio programs like Rush Limbaugh or Thom Hartmann” (44% to 7%) or “news breaks from music stations” (26% to 5%). Surprisingly, there was almost no difference between the TV news preferences of Democrats and Republicans with 50-55% preferring network news and 44-45%

8 SCSU Survey Research Center Fall 2018 Statewide Survey: Political Report
preferring cable news. A small number of Democratic respondents (6%) reported reliance on “comedy news programs like the Daily Show or Last Week Tonight” but no Republican respondents chose that category. Finally, more Democratic respondents reported a reliance on internet news sources or apps (29%) than Republicans did (19%). Neither party reported much reliance on social media sites like Facebook and Twitter (6% each) for news content.

9 SCSU Survey Research Center Fall 2018 Statewide Survey: Political Report
Table 1. Midterm Election Preferences of Minnesotans, 2018
Midterm 2018 Vote Frequency Percent
If the midterm Congressional elections were held today, which party would you be most likely to support? Vote Democrat 226 55 Vote Republican 161 39 Vote Other 6 2 DK/Won’t Vote 16 4
Which party do you think is most likely to gain seats in Congress in this year’s election? Democratic Gain 248 60 Republican Gain 103 25 DK/Other 64 15
If the election for Minnesota Governor were held today, which candidate would you support? Tim Walz (D) 200 50 Jeff Johnson (R) 138 34 DK/Other 66 16
If the election for US Senator were held today, which candidate would you support? Amy Klobuchar (D) 220 54 Jim Newberger (R) 116 28 DK/Other 84 18
If the special election to replace former Sen. Al Franken were held today, which candidate would you support? Tina Smith (D) 182 44 Karin Housely (D) 120 29 DK/Other 108 27
If the election for Minnesota Attorney General were held today, which candidate would you support? Keith Ellison (D) 170 42 Doug Wardlow (R) 139 34 DK/Other 101 24
*Overall N=502, but totals vary by question because “Refused” categories are excluded from the analysis. Partisanship includes “leaners” for their party. Data are weighted on gender and age to be representative of current population figures. Question wording is abbreviated here; for actual wording, see Appendix C.

10 SCSU Survey Research Center Fall 2018 Statewide Survey: Political Report
Table 2. Individual Issue Questions by Party Democrat Republican Overall Frequency Percent Frequency Percent Frequency Percent
Is climate change “happening, caused mainly by humans”; “happening, caused mainly by natural forces”; or “NOT happening”? Human Caused 209 94 58 35 318 68 Natural Forces 13 6 98 59 138 29 Not Happening 0 0 10 6 13 3
Do you think this country would be governed better or governed worse if there were more women in political office? Better 194 89 48 31 281 62 Worse 0 0 11 7 11 2 Neither [Voluntrd] 25 11 96 62 160 36
If a public official has been accused of sexual misconduct by multiple people, do you think that official should resign, or not? Should Resign 143 66 50 30 234 49 Should Not 29 13 62 37 115 24 Unsure, More Info 46 21 54 33 127 27
Do you approve or disapprove of NFL players kneeling during the national anthem as a form of protest? Approve 146 72 9 5 190 42 Disapprove 57 28 159 95 264 58
Are you looking forward to talking politics over Thanksgiving dinner this year, or are you dreading it? Looking forward to 72 38 51 36 141 36 Dreading 119 62 89 64 250 64
How would you describe the overall impact of immigrants on this country? Very Positive 100 45 7 4 124 26 Somewhat Positive 100 45 64 38 196 41 Neutral [Voluntrd] 9 4 24 14 45 9 Somewhat Negatve 14 6 35 21 63 13 Very Negative 1 0 38 23 50 11
Which statement is closer to your views: “Immigrants decrease the white majority” or “Immigrants provide racial diversity”? Decrease white maj 6 3 23 16 33 8 Neutral [Voluntrd] 2 1 12 8 21 5 Provide diversity 207 97 112 76 382 88
*Overall N=502, but totals vary by question because “Don’t Know” and “Refused” categories are excluded from the analysis. Partisanship includes “leaners” for their party. Data are weighted on gender and age to be representative of current population figures. Question wording is abbreviated here; for actual wording, see Appendix C.

11 SCSU Survey Research Center Fall 2018 Statewide Survey: Political Report
Table 3. Election Preferences and Issues by Gender
Men Women Overall Frequency Percent Frequency Percent Frequency Percent
If the midterm Congressional elections were held today, which party would you be most likely to support? Vote Democrat 103 45 140 61 243 53 Vote Republican 104 45 77 34 181 39 Vote Other 7 3 1 0 8 2 DK/Won’t Vote 17 7 11 5 28 6
Which party do you think is most likely to gain seats in Congress in this year’s election? Dem Gain 129 55 142 61 271 58 GOP Gain 77 33 45 19 122 26 DK/Other 29 12 45 19 74 16
If the election for Minnesota Governor were held today, which candidate would you support? Jeff Johnson (R) 81 36 64 28 145 32 Tim Walz (D) 85 38 126 55 211 56 DK/Other 59 26 40 117 99 22
If the election for US Senator were held today, which candidate would you support? Amy Klobuchar (D) 92 40 145 63 237 51 Jim Newberger (R) 70 30 50 22 120 26 DK/Other 69 30 35 15 104 23
If the special election to replace former Sen. Al Franken were held today, which candidate would you support? Karin Housely (R) 70 30 56 25 126 27 Tina Smith (D) 70 30 123 54 193 42 DK/Other 91 40 50 21 141 31
If the election for Minnesota Attorney General were held today, which candidate would you support? Keith Ellison (D) 63 27 118 51 181 39 Doug Wardlow (R) 81 35 69 30 150 33 DK/Other 87 38 39 17 130 28
Do you think this country would be governed better or governed worse if there were more women in political office? Better 119 54 465 70 284 62 Worse 5 2 6 3 11 2 Neither [Voluntrd] 98 44 64 27 162 35
If a public official has been accused of sexual misconduct by multiple people, do you think that official should resign, or not? Should Resign 99 42 136 56 235 49 Should Not 65 27 51 21 116 24 Unsure, More Info 73 31 67 23 130 27
Do you approve or disapprove of NFL players kneeling during the national anthem as a form of protest? Approve 93 40 96 43 189 41 Disapprove 140 60 129 57 269 59
Are you looking forward to talking politics over Thanksgiving dinner this year, or are you dreading it? Looking forward to 76 40 67 31 140 34 Dreading 108 60 146 69 254 66
How would you describe the overall impact of immigrants on this country? Very Positive 61 25 64 27 125 26 Somewhat Positive 83 35 114 47 197 41 Neutral [Voluntrd] 27 11 17 7 44 9 Somewhat Negatve 37 15 29 12 66 14 Somewhat Positive 32 13 17 7 49 10
Which statement is closer to your views: “Immigrants decrease the white majority” or “Immigrants provide racial diversity”? Decrease white maj 18 9 16 7 34 8 Neutral [Voluntrd] 19 9 1 0 20 5 Provide diversity 171 82 216 93 387 88
* Overall N=502, but totals vary by question because “Don’t Know” and “Refused” categories are excluded from some of the analyses. Partisanship includes “leaners” for their party. Data are weighted on gender and age to be representative of current population figures. Question wording is abbreviated here; for actual wording, see Appendix C.

12 SCSU Survey Research Center Fall 2018 Statewide Survey: Political Report
Table 4. Election Preferences and Issues by Age 18-24 25-44 45-64 65+ Frequency Percent Frequency Percent Frequency Percent Frequency Percent
If the midterm Congressional elections were held today, which party would you be most likely to support? Vote Democrat 34 57 75 52 80 49 53 56 Vote Republican 26 43 56 39 64 40 36 38 Vote Other 0 0 4 2 6 4 0 0 DK/Won’t Vote 0 0 10 7 12 7 6 6
Which party do you think is most likely to gain seats in Congress in this year’s election? Dem Gain 49 82 82 55 88 54 51 54 GOP Gain 11 18 37 25 46 28 28 30 DK/Other 0 0 29 20 29 18 16 16
If the election for Minnesota Governor were held today, which candidate would you support? Tim Walz (D) 23 42 64 44 74 46 50 54 Jeff Johnson (R) 26 47 41 28 48 30 30 33 DK/Other 6 11 41 28 40 24 12 13
If the election for US Senator were held today, which candidate would you support? Amy Klobuchar (D) 23 38 70 48 88 55 55 59 Jim Newberger (R) 20 33 40 28 36 22 24 26 DK/Other 17 29 35 24 37 23 14 15
If the special election to replace former Sen. Al Franken were held today, which candidate would you support? Tina Smith (D) 23 38 54 37 71 44 45 48 Karin Housely (D) 20 33 34 23 42 26 31 33 DK/Other 17 28 57 40 49 30 18 19
If the election for Minnesota Attorney General were held today, which candidate would you support? Keith Ellison (D) 23 38 51 35 66 41 41 44 Doug Wardlow (R) 20 33 48 33 52 32 30 32 DK/Other 17 29 46 32 44 27 22 24
Is climate change “happening, caused mainly by humans”; “happening, caused mainly by natural forces”; or “NOT happening”? Human Caused 37 69 113 70 112 68 60 65 Natural Forces 17 32 45 28 46 28 29 32 Not Happening 0 0 4 2 6 4 3 3
Do you think this country would be governed better or governed worse if there were more women in political office? Better 34 63 94 60 101 64 34 63 Worse 0 0 4 2 4 2 3 4 Neither [Voluntrd] 20 37 59 38 54 34 29 33
If a public official has been accused of sexual misconduct by multiple people, do you think that official should resign, or not? Should Resign 34 63 74 46 81 48 46 47 Should Not 14 26 41 26 39 23 22 22 Unsure, More Info 6 11 45 28 48 29 31 31
Do you approve or disapprove of NFL players kneeling during the national anthem as a form of protest? Approve 20 33 69 48 69 43 31 33 Disapprove 40 67 76 52 90 57 62 67
Are you looking forward to talking politics over Thanksgiving dinner this year, or are you dreading it? Looking forward to 6 13 49 35 57 42 29 40 Dreading 40 87 93 65 78 58 44 60
How would you describe the overall impact of immigrants on this country? Very Positive 14 24 41 27 47 28 22 23 Somewhat Positive 34 58 52 33 63 37 47 49 Neutral [Voluntrd] 0 0 22 14 17 10 6 6 Somewhat Negatve 0 0 28 18 26 15 12 13 Somewhat Positive 11 18 12 8 17 10 9 9
Which statement is closer to your views: “Immigrants decrease the white majority” or “Immigrants provide racial diversity”? Decrease white maj 0 0 8 5 15 9 11 13 Neutral [Voluntrd] 6 12 2 1 9 6 4 5 Provide diversity 43 88 140 93 137 85 67 82
* Overall N=502, but totals vary by question because “Don’t Know” and “Refused” categories are excluded from some of the analyses. Partisanship includes “leaners” for their party. Data are weighted on gender and age to be representative of current population figures. Question wording is abbreviated here; for actual wording, see Appendix C.
13 SCSU Survey Research Center Fall 2018 Statewide Survey: Political Report
Table 5. “Do you think things in the state/nation are generally going in the right direction, or do you feel things have gotten off on the wrong track?”
Minnesota United States Frequency Percent Frequency Percent Right Direction 234 49 145 29 Neutral (volunteered) 71 15 30 6 Wrong Track 168 26 319 65 Total 473 100 494 100
*Table excludes “Don’t Know” and “Refused” categories. Data are weighted on gender and age to be representative of current population figures. Table 6. Right direction/Wrong Track by Party
Minnesota United States Democrat Republican Democrat Republican Frequency Percent Frequency Percent Frequency Percent Frequency Percent Right Direction 150 71 46 27 4 2 107 36 Neutral (volunt’d) 19 9 30 18 2 1 19 10 Wrong Track 42 20 92 55 220 97 44 54 Total 211 100 168 100 226 100 170 100
*Table excludes “Don’t Know” and “Refused” categories. Includes independent voters who reported they “lean” to one party. Data are weighted on gender and age to be representative of current population figures. Table 7. “What do you think is the single most important problem facing the state/nation today?”
Minnesota United States Frequency Percent Frequency Percent Trump/Mueller Invstg. -- -- 73 16 Immigration 35 8 58 12 Health Care 132 31 43 9 Gov’t Reform/Gridlock 21 5 28 6 Race Relations 7 2 27 6 Economy (General) 16 4 21 5 Taxes 39 9 5 1 Education 33 8 6 1 Other 146 34 209 44 Total 429 100 470 100
*Table excludes “Don’t Know” and “Refused” categories. NOTE: Because the cell entries are so small, caution should be exercised in interpretation. Data are weighted on gender and age to be representative of current population figures. Table 8. Most Important Issue by Party
Minnesota United States Democrat Republican Democrat Republican Frequency Percent Frequency Percent Frequency Percent Frequency Percent Trump/Mueller Invstg. -- -- -- -- 61 27 3 2 Immigration 4 2 21 15 7 3 38 25 Health Care 81 41 30 21 26 12 9 6 Gov’t Reform/Gridlock 11 6 10 7 17 8 7 5 Race Relations 4 2 2 1 17 8 6 4 Economy (General) 6 3 7 5 8 4 9 6 Taxes 3 2 21 15 1 0 3 2 Education 22 11 7 5 3 1 0 0 Other 65 33 47 32 83 37 75 48 Total 196 100 145 100 223 100 155 100
*Table excludes “Refused” category. NOTE: Because the cell entries are so small, caution should be exercised in interpretation. Data are weighted on gender and age to be representative of current population figures.

14 SCSU Survey Research Center Fall 2018 Statewide Survey: Political Report
Table 9. Partisanship in Minnesota, 2018
Partisanship Frequency Percent Democrat 227 46 Republican 174 35 Other 97 19 Total 455 100
*Table excludes “Don’t Know” and “Refused” categories. Partisanship includes “leaners” for their party. Data are weighted on gender and age to be representative of current population figures. Table 10. Ideology in Minnesota, 2018
Ideology Frequency Percent Liberal 154 32 Moderate 149 31 Conservative 183 37 Total 450 100
*Table excludes “Don’t Know” and “Refused” categories. Data are weighted on gender and age to be representative of current population figures. Table 11. Job Approval Ratings
Approve of Job Performance Disapprove of Job Performance Frequency Percent Frequency Percent President Trump 154 31 240 48 Governor Dayton 199 42 118 25
*Table excludes “Refused,” “Don’t Know,” and “Only Fair” categories. “Approve” combines “Excellent” and “Pretty Good” ratings, while “Disapprove” combines “Poor” and “Very Poor” ratings. Data are weighted on gender and age to be representative of current population figures. Table 12. Job Approval Ratings by Party
Democrat Republican Approve Disapprove Approve Disapprove Frequency Percent Frequency Percent Frequency Percent Frequency Percent Trump 5 2 200 89 121 70 10 6 Dayton 162 72 9 4 23 14 79 48
*Table excludes “Refused,” “Don’t Know,” and “Only Fair” categories. “Approve” combines “Excellent” and “Pretty Good” ratings, while “Disapprove” combines “Poor” and “Very Poor” ratings. Data are weighted on gender and age to be representative of current population figures. Table 13. Job Approval Ratings by Gender
Men Women Approve Disapprove Approve Disapprove Frequency Percent Frequency Percent Frequency Percent Frequency Percent Trump 93 38 99 40 62 25 142 57 Dayton 90 37 75 31 119 50 42 18
*Table excludes “Refused,” “Don’t Know,” and “Only Fair” categories. “Approve” combines “Excellent” and “Pretty Good” ratings, while “Disapprove” combines “Poor” and “Very Poor” ratings. Data are weighted on gender and age to be representative of current population figures.

15 SCSU Survey Research Center Fall 2018 Statewide Survey: Political Report
Table 14. Media Usage by Party
All Democrat Republican Frequency Percent Frequency Percent Frequency Percent Print Newspaper 69 14 30 13 17 10 Radio News 71 14 40 18 24 14 Traditional News 45 65 35 88 7 30 Political Talk Radio 14 21 3 7 10 44 Music Station News 10 14 2 5 6 26 TV News 180 36 74 33 86 50 Network News 96 55 36 50 46 55 Cable News 74 43 32 44 37 45 Comedy News 4 2 4 6 0 0 Social Media 39 8 13 6 10 6 Website or App 118 23 66 29 33 19 No News 14 3 3 1 3 1 Total 492 100 226 100 173 100
*Table excludes “Refused” category. Data are weighted on gender and age to be representative of current population figures. Cells for type of radio and TV news may not add to 100% due to rounding error.

16 SCSU Survey Research Center Fall 2018 Statewide Survey: Political Report
Appendix A: Survey Personnel Again, as is our practice, data collection for the survey was conducted by students in several classes. This year, our interview data was collected by students in POL 111 (Introduction to U.S. Politics), POL 470 (Public Opinion), PSYC 119 (Psychology as a Discipline and Profession), ECON 406 (Intermediate Microeconomics), SOC 201 (Social Inequality), SOC 303 (Research Methods in Sociology), and SOC 304 (Social Statistics). Approximately 150 students participated as callers for the survey, with each student required to complete a one hour training session and to work a minimum of two or three 2.5 hour shifts (depending on the course). Student callers were trained and supervised by our Student Directors in consultation with our Faculty Directors. Our computer systems and software were overseen and maintained by our Student Technical Consultant. At every stage of the operation, students are integral to the research process and their participation in our research provides them with experiential learning opportunities and helps them develop leadership skills. Faculty Directors Dr. James B. Cottrill, Assistant Professor, Political Science, [email protected] Dr. Ann Finan, Associate Professor, Sociology, [email protected] Dr. Monica Garcia-Perez, Associate Professor, Economics, [email protected] Dr. Amanda Hemmesch-Breaker, Associate Professor, Psychology, [email protected] Dr. Sandrine Zerbib, Associate Professor, Sociology, [email protected] Lead Student Director Mr. Jack Spaeth, 4th year Student, Community Planning and Spanish, Montevideo, Minnesota. Assistant Lead Student Director Ms. Samantha Shobe, 4th year Student, Political Science, Monticello, Minnesota. Student Directors Ms. Holly Goodwin, 4th year student, Psychology, Oshkosh, Wisconsin. Mr. Curran Hansen, 4th year student, Statistics and Political Science, Rochester, Minnesota. Ms. Regina Lighthall, 4th year student, Psychology, Morris, Minnesota Mr. Sagar Shahi, 2nd year student, Computer Science, Dhulikhel, Nepal. Mr. Jonathan Wong, Graduate student, Public Administration, St. Cloud, Minnesota.

17 SCSU Survey Research Center Fall 2018 Statewide Survey: Political Report
Appendix B: Brief Summary of Methodology The Fall 2018 St. Cloud State University Survey findings are based on telephone interviews with a representative sample of 502 (weighted) adults in Minnesota. The sample included both landline phones and cell phones. Interviews were conducted from October 15 to October 30, 2018 at the St. Cloud State University Survey Lab. The sample was obtained from Survey Sampling International (SSI) of Fairfield, Connecticut Sample Design The sample was designed to represent all adults (age 18 and older) with a landline or cell phone in Minnesota. The final sample consists of one land line sample and one cell sample, all of which were generated following a random-digit dialing (RDD) approach in which random phone numbers are generated by computer in order to ensure that everyone in the population has a roughly equal chance of selection. Samples were compared for duplicates, and none was found. More methodological details relating to our sampling approach may be found in a separate methodology section that will be available on our website. The completed sample consists of 502 interviews. Of the 502 interviews, 100 (20%) are landlines and 402 (80%) are cell phone numbers. In samples of 502 interviews, the error due to sampling and other random effects is plus/minus 4.4 percent at the 95 percent confidence level. This means that if one were to have drawn 20 samples of the adult Minnesota population and administered the same instrument, it would be expected that the percentages in the sample findings would differ from the true population percentages by more than 4.4 percent only one time in twenty. Several steps were taken to ensure that the telephone sample of adults in the state was representative of the larger adult state population. We varied the days and times for calling to maximize the chances of enlisting respondent participation. We also took steps to mitigate known response bias among cell phone respondents by prioritizing female respondents during the last 3 days of calling; however, in the end weighting was still needed because 55% of the respondents were men and women are slightly more than 50% of the population. For cell phone numbers, the interview was completed with the person of initial contact, provided the contact person was at least 18 years of age and a Minnesota resident. The margin of sampling error for the complete set of weighted data is ±6.35 percent (at the 95 percent confidence level). In all sample surveys there are other possible sources of error for which precise estimates cannot be calculated. These include interviewer and coder error, respondent misinterpretation, and analysis errors. When analysis is made of sub-samples such as respondent gender, the sample error may be larger. As is often the case with survey research, the initial findings were weighted to compensate for patterns of nonresponse that might bias results. The use of these weights in statistical analysis approximates the demographic characteristics of the sample with the demographic characteristics of the Minnesota population. Weighting was based on the 2018 population estimates from the office of the Minnesota Demographer at https://mn.gov/admin/demography/data-by-topic/population-data/our-estimates/ and the US Census Bureau at https://factfinder.census.gov/ These data allow us to apply a weighting procedure to ensure that our analyses are representative of the actual population, and avoid any systematic bias from the over- or under-representation of certain population groups among our respondents. For instance, we are able to accurately

18 SCSU Survey Research Center Fall 2018 Statewide Survey: Political Report
estimate the voting age population in Minnesota because we have Census estimates of the voting age population distribution at every age level. In this year’s survey only minor weighting was done on two variables (age and gender) to ensure that our results more closely represent the actual population. A more detailed report on our sampling, data collection, and weighting methodology will be available at http://www.stcloudstate.edu/scsusurvey/ in late December 2018.

19 SCSU Survey Research Center Fall 2018 Statewide Survey: Political Report
Appendix C: Survey Questionnaire (Final, WinCATI code redacted) Q: HELLO ----------------------------------------------------------- Hello, my name is ______________ (YOUR NAME) and I am a student at St. Cloud State University. I am calling from our survey research center in St. Cloud. We are conducting a study of Minnesota residents about their views relating to state and national issues. We are not asking for contributions or trying to sell you anything. Your telephone number was drawn by a computer in a random sample of the state. [HIT ANY KEY TO CONTINUE] [IF INTERVIEW IS A RESTART, MAKE SURE YOU HAVE PROPER RESPONDENT, REINTRODUCE YOURSELF AND SAY SOMETHING LIKE-- We previously started this interview and couldn't finish it at the time. May we finish it now? IF RESPONDENT WANTS TO KNOW WHO THE INTERVIEW IS FOR YOU CAN TELL THEM IT IS FOR ST. CLOUD STATE UNIVERSITY. YOU CAN HIT CONTROL/END AT ANY TIME TO TERMINATE AN INTERVIEW, PUT MESSAGE FOR CALLBACKS, INCOMPLETES, REFUSALS, ETC.] Q: HELLO1 -------------------------------------------- C: If phone number is from RDD sample Is this your residential phone, and is it a landline phone? [IF NO] Is this your personal cell phone, not a business phone? [IF NOT PERSONAL CELL PHONE, TERMINATE BY SAYING] I'm sorry I have the wrong place. [END CALL WITH CTRL-END] 1. YES, IT IS A RESIDENTIAL LANDLINE PHONE 2. NO, IT IS A PERSONAL CELL PHONE IF (ANSWER=1) TYPEPHON = 1 IF (ANSWER=2) TYPEPHON = 2 IF (TYPEPHON = 2) SKIPTO HELLO2B Q: GENDER --------------------------------------- c: ONLY ASK THIS FOR LANDLINE SURVEYS For the purposes of this survey, I need to ask if you are male or female? [IF RESPONDENT INDICATES “OTHER” OR “TRANS” OR “THIRD GENDER” OR “NEITHER”, RESPOND “Thank you, I’ve recorded your response.” AND CHOOSE 'OTHER, RESIDENTIAL LANDLINE PHONE'] 1. MALE, RESIDENTIAL LANDLINE PHONE 2. FEMALE, RESIDENTIAL LANDLINE PHONE 3. OTHER, RESIDENTIAL LANDLINE PHONE

20 SCSU Survey Research Center Fall 2018 Statewide Survey: Political Report
SKIPTO ETHICS Q: HELLO2B --------------------- Is this a personal cell phone, that is not a business phone? [IF NOT A PERSONAL CELL PHONE] Is this a residential landline phone? [IF BUSINESS PHONE, TERMINATE WITH, E.G.;] I'm sorry I have a wrong number. [END CALL WITH CTRL-END] For the purposes of this survey, I need to ask if you are male or female? [IF RESPONDENT INDICATES “OTHER” OR “TRANS” OR “THIRD GENDER” OR “NEITHER”, RESPOND “Thank you, I’ve recorded your response.” AND CHOOSE 'OTHER, PERSONAL CELL PHONE' OR 'OTHER, RESIDENTIAL LANDLINE PHONE' BASED ON PHONE TYPE] 1. MALE, PERSONAL CELL PHONE 2. FEMALE, PERSONAL CELL PHONE 3. OTHER, PERSONAL CELL PHONE 4. MALE, RESIDENTIAL LANDLINE PHONE 5. FEMALE, RESIDENTIAL LANDLINE PHONE 6. OTHER, RESIDENTIAL LANDLINE PHONE IF (ANSWER<4) TYPEPHON=2 IF (ANSWER>3) TYPEPHON=1 IF (TYPEPHON=1) SKIPTO ETHICS Q: HELLO2C -------------------- Are you age 18 or older and a resident of Minnesota? [IF YES TO BOTH, PRESS ANY KEY TO CONTINUE] [IF TOO YOUNG OR NOT A RESIDENT, END CALL BY SAYING] I'm sorry I have a wrong number. [THEN END CALL WITH CTRL-END] Q: DRIVING --------------------------------------- C: Only ask this for cell phone surveys It is important that we interview you when you are not driving or in a situation where you would be distracted by events around you. Are you in a safe situation to answer our questions? [IF YES-START INTERVIEW] Before we begin the 10-15 minute survey, please note that I am happy to answer any questions about the study either now or later. This interview is completely voluntary, so if we come to any question that you don't want to answer, just let me know and we'll go on to the next question. [PRESS ANY KEY TO CONTINUE] [IF THIS IS NOT A GOOD TIME FOR INTERVIEW] When may I call back to interview you? [HIT CTRL/END, THEN RECORD TIME AND DAY FOR CALL-BACK] SKIPTO Q1DIRMN

21 SCSU Survey Research Center Fall 2018 Statewide Survey: Political Report
Q: ETHICS ---------------------------- C: Only for landline survey [IF THIS IS THE SELECTED PERSON, START INTERVIEW] [OR WHEN SELECTED PERSON ANSWERS, REPEAT INTRO] Before we begin the 10-15 minute survey, please note that I am happy to answer any questions about the study either now or later. This interview is completely voluntary, so if we come to any question that you don't want to answer, just let me know and we'll go on to the next question. [PRESS ANY KEY TO CONTINUE] [IF SELECTED PERSON NOT AVAILABLE] When may I call back to reach him/her? So that I will know who to ask for, what is his/her first name? [REPEAT BACK TO BE SURE YOU HAVE IT AND SHOW PRONUNCIATION IF IT IS NEEDED. IF RESPONDENT OBJECTS TO PROVIDING NAME] We only need the person's first name; the last name isn't necessary. [HIT CTRL/END, THEN RECORD NAME, TIME AND DAY FOR CALL-BACK] Q: Q1DIRMN --------------------------------------- Let's begin by asking a general question about Minnesota. Do you think things in the state are generally going in the right direction, or do you feel things have gotten off on the wrong track? 1. RIGHT DIRECTION 2. NEUTRAL - [VOLUNTEERED] 3. WRONG TRACK 88. DON'T KNOW 99. REFUSED Q: Q2PROBMN ------------------ What do you think is the single most important problem facing the State of Minnesota today? [DO NOT READ LIST. PROBE FOR ONE SPECIFIC RESPONSE] 01. ABORTION 19. MENTAL HEALTH CARE 02. AGRICULTURE-GENERAL 20. NATURAL DISASTERS/DISASTER RELIEF 03. BUDGET/DEFICIT/NATL DEBT 21. POVERTY 04. CRIME/GANGS/VIOLENCE 22. RACE RELATIONS/DISCRIMINATION 05. DRUGS/ADDICTION 23. RELIGIOUS/MORAL ISSUES 06. ECONOMY-GENERAL 24. ROADS/BRIDGES/INFRASTRUCTURE 07. EDUCATION (FUNDING/QUALITY) 25. SENIOR ISSUES/ELDERLY/SOCIAL SECURITY 08. ENVIRONMENT/CLIMATE CHANGE 26. TAXES

22 SCSU Survey Research Center Fall 2018 Statewide Survey: Political Report
09. FINANCIAL REGULATION/BANKS 27. TERRORISM/SECURITY 10. GAS PRICES/ENERGY 28. TRADE/INTERNATIONAL BUSINESS 11. GOVT REFORM/POL GRIDLOCK 29. VETERAN'S ISSUES/VETERAN'S HEALTH 12. GUN RIGHTS/GUN CONTROL 30. VOTING RIGHTS/VOTER FRAUD/ELECTION SECURITY 13. HEALTH CARE/INSUR/PRES DRUGS 31. WELFARE ISSUES/GOVT BENEFITS ABUSE 14. HOUSING (AFFORD/FORECLOSURE) 32. WOMEN'S ISSUES 15. IMMIGRATION 33. OTHER 16. JOBS/UNEMPLOYMENT 34. NO PROBLEM FACING STATE 17. LAW ENFORCEMENT/POLICE ISSUES 88. DON'T KNOW 18. LBGT ISSUES/SEXUAL ORIENTATION 99. REFUSED Q: Q3DIRUS --------------------------------------- Regarding the United States as a whole: Do you think things in the nation are generally going in the right direction, or do you feel things have gotten off on the wrong track? 1. RIGHT DIRECTION 2. NEUTRAL - [VOLUNTEERED] 3. WRONG TRACK 88. DON'T KNOW 99. REFUSED Q: Q4PROBUS ------------------ And what do you think is the single most important problem facing the United States as a nation right now? [DO NOT READ LIST. PROBE FOR ONE SPECIFIC RESPONSE] 01. ABORTION 20. NATURAL DISASTERS/DISASTER RELIEF 02. AGRICULTURE-GENERAL 21. POVERTY 03. BUDGET/DEFICIT/NATL DEBT 22. RACE RELATIONS/DISCRIMINATION 04. CRIME/GANGS/VIOLENCE 23. RELIGIOUS/MORAL ISSUES 05. DRUGS/ADDICTION 24. ROADS/BRIDGES/INFRASTRUCTURE 06. ECONOMY-GENERAL 25. SENIOR ISSUES/ELDERLY/SOCIAL SECURITY 07. EDUCATION (FUNDING/QUALITY) 26. TAXES 08. ENVIRONMENT/CLIMATE CHANGE 27. TERRORISM/SECURITY 09. FINANCIAL REGULATION/BANKS 28. TRADE/INTERNATIONAL BUSINESS 10. GAS PRICES/ENERGY 29. TRUMP/MUELLER INVESTIGATION/IMPEACHMENT 11. GOVT REFORM/POL GRIDLOCK 30. VETERAN'S ISSUES/VETERAN'S HEALTH 12. GUN RIGHTS/GUN CONTROL 31. VOTING RIGHTS/VOTER FRAUD/ELECTION SECURITY 13. HEALTH CARE/INSUR/PRES DRUGS 32. WELFARE ISSUES/GOVT BENEFITS ABUSE 14. HOUSING (AFFORD/FORECLOSURE) 33. WOMEN'S ISSUES 15. IMMIGRATION 34. OTHER 16. JOBS/UNEMPLOYMENT 35. NO PROBLEM FACING STATE 17. LAW ENFORCEMENT/POLICE ISSUES 88. DON'T KNOW 18. LBGT ISSUES/SEXUAL ORIENTATION 99. REFUSED 19. MENTAL HEALTH CARE

23 SCSU Survey Research Center Fall 2018 Statewide Survey: Political Report
Q: Q5PARTY1 ---------------------- Do you usually consider yourself to be a Democrat, Republican, Libertarian Party member, Green Party member, Minnesota Independence Party member, another party, or are you an independent who is not a member of any party? 1. DEMOCRAT (DFL) 2. REPUBLICAN (GOP) 3. LIBERTARIAN 4. GREEN 5. MN INDEPENDENCE PARTY 6. TEA PARTY [VOLUNTEERED] 7. OTHER PARTY [VOLUNTEERED] 8. INDEPENDENT, NOT A MEMBER OF ANY PARTY 9. NOT POLITICAL 88. DON'T KNOW 99. REFUSED Q: Q5APARTY_LEAN ------------------------ Although you are an independent, do you usually consider yourself to be closer to the Republicans, Democrats, the Libertarian Party, the Green Party, the Tea Party, or the Minnesota Independence Party? 1. DEMOCRAT (DFL) 2. REPUBLICAN (GOP) 3. LIBERTARIAN 4. GREEN 5. MN INDEPENDENCE PARTY 6. TEA PARTY 7. NOT CLOSE TO ANY PARTY [VOLUNTEERED] 88. DON'T KNOW 99. REFUSED Q: Q6IDEOL ------------------------------------- Thinking about your own general approach to politics, do you consider yourself to be very liberal, somewhat liberal, moderate, somewhat conservative, or very conservative? 1. VERY LIBERAL 2. SOMEWHAT LIBERAL 3. MODERATE 4. SOMEWHAT CONSERVATIVE 5. VERY CONSERVATIVE 88. DON'T KNOW 99. REFUSED

24 SCSU Survey Research Center Fall 2018 Statewide Survey: Political Report
Q: Q7ELECT_INT Generally speaking, how much interest do you have in the November general election - a great deal, a fair amount, only a little, or no interest at all? 1. GREAT DEAL 2. FAIR AMOUNT 3. ONLY A LITTLE 4. NO INTEREST AT ALL 8. DON'T KNOW 9. REFUSED Q: Q9VOTE What are the chances of your voting in the upcoming November election? Are you almost certain to vote, will you probably vote, are the chances 50-50, or do you think you will not vote? 1. ALMOST CERTAIN 2. PROBABLY VOTE 3. 50-50 4. WON'T VOTE 8. DON'T KNOW 9. REFUSED IF (ANS=4) SKIPTO Q16JOB_TRUMP Q: Q10MIDTERM1 ------------------------
Now I have two questions relating to this year’s elections for Congress. If the congressional elections were held today, which party would you be most likely to support? 1. DEMOCRAT (DFL) 2. REPUBLICAN (GOP) 3. LIBERTARIAN 4. GREEN 5. MN INDEPENDENCE PARTY 6. TEA PARTY [VOLUNTEERED] 7. OTHER PARTY [VOLUNTEERED] 8. I DO NOT PLAN TO VOTE 88. DON'T KNOW 99. REFUSED

25 SCSU Survey Research Center Fall 2018 Statewide Survey: Political Report
Q: Q11MIDTERM2 ------------------------ Setting aside your own personal preference, which party do you think is most likely to gain seats in Congress in this year’s election? 1. DEMOCRAT (DFL) 2. REPUBLICAN (GOP) 3. LIBERTARIAN 4. GREEN 5. MN INDEPENDENCE PARTY 6. TEA PARTY [VOLUNTEERED] 7. OTHER PARTY [VOLUNTEERED] 8. INDEPENDENT, NOT A MEMBER OF ANY PARTY 88. DON'T KNOW 99. REFUSED Q: Q12GOVERNOR_2018 ----------------------- If this year’s election for Minnesota Governor were held today, which candidate would you support? [DO NOT READ LIST. IF CANDIDATES NOT KNOWN, CAN PROBE FOR PARTY PREFERENCE] 1. JEFF JOHNSON (R) 2. TIM WALZ (D) 3. OTHER CANDIDATE [VOLUNTEERED] 4. "I DO NOT PLAN TO VOTE" [VOLUNTEERED] 88. DON'T KNOW 99. REFUSED Q: Q13SENATE_2018 ----------------------- If this year’s election for US Senator were held today, which candidate would you support? [DO NOT READ LIST. IF CANDIDATES NOT KNOWN, CAN PROBE FOR PARTY PREFERENCE] 1. AMY KLOBUCHAR (D) 2. JIM NEWBERGER (R) 3. OTHER CANDIDATE [VOLUNTEERED] 4. "I DO NOT PLAN TO VOTE" [VOLUNTEERED] 88. DON'T KNOW 99. REFUSED

26 SCSU Survey Research Center Fall 2018 Statewide Survey: Political Report
Q: Q14SPECIAL_2018 ----------------------- If this year’s special election to replace former US Senator Al Franken were held today, which candidate would you support? [DO NOT READ LIST. IF CANDIDATES NOT KNOWN, CAN PROBE FOR PARTY PREFERENCE] 1. TINA SMITH (D) 2. KARIN HOUSLEY (R) 3. OTHER CANDIDATE [VOLUNTEERED] 4. "I DO NOT PLAN TO VOTE" [VOLUNTEERED] 88. DON'T KNOW 99. REFUSED Q: Q15AG_2018 ----------------------- If this year’s election for Minnesota Attorney General were held today, which candidate would you support? [DO NOT READ LIST. IF CANDIDATES NOT KNOWN, CAN PROBE FOR PARTY PREFERENCE] 1. KEITH ELLISON (D) 2. DOUG WARDLOW (R) 3. OTHER CANDIDATE [VOLUNTEERED] 4. "I DO NOT PLAN TO VOTE" [VOLUNTEERED] 88. DON'T KNOW 99. REFUSED Q: Q16JOB_TRUMP ------------------------- Now we have some questions about the job performance of national and state elected officials. How would you rate the overall performance of Donald Trump as President? Would you rate his performance as excellent, pretty good, only fair, poor, or very poor? 1. EXCELLENT 2. PRETTY GOOD 3. ONLY FAIR 4. POOR 5. VERY POOR 88. DON'T KNOW 99. REFUSED

27 SCSU Survey Research Center Fall 2018 Statewide Survey: Political Report
Q: Q17JOB_DAYTON ----------------------- How about your opinion of Governor Mark Dayton's job performance? [REPEAT OPTIONS 1-4 IF NEEDED] 1. EXCELLENT 2. PRETTY GOOD 3. ONLY FAIR 4. POOR 5. VERY POOR 88. DON'T KNOW 99. REFUSED Q: Q19CLIMCHAN ---------------------
Thank you. Now I have some questions about issues in the news. This first set is about climate and weather. Which of the following three statements do you personally believe? [READ OPTIONS 1-3] 1. Climate change is happening now, caused mainly by human activities. 2. Climate change is happening now, but caused mainly by natural forces. 3. Climate change is NOT happening now. 88. DON'T KNOW 99. REFUSED Q: Q20CLIMCHAN --------------------- How much do you agree with the following statement, “In order to slow climate change, people will need to make substantial lifestyle changes.” [READ 1-5, DON'T READ NEUTRAL] 1. Strongly agree 2. Agree 3. NEUTRAL [VOLUNTEERED] 4. Disagree 5. Strongly disagree 88. DON'T KNOW 99. REFUSED

28 SCSU Survey Research Center Fall 2018 Statewide Survey: Political Report
Q: Q21WOMENGOVT
Do you think this country would be governed better or governed worse if more women were in political office? 1. BETTER 2. WORSE 3. NEITHER BETTER NOR WORSE [VOLUNTEERED] 88. DON'T KNOW 99. REFUSED Q: Q22ALLEGATIONS If a public official has been accused of sexual misconduct by multiple people, do you think that public official should resign, or not? 1. Should resign 2. Should not resign 3. UNSURE/NEED MORE INFO [VOLUNTEERED] 99. REFUSED Q: Q23ANTHEM As you may know, some athletes and teams in the NFL are choosing to kneel during the national anthem as a form of protest. Do you approve or disapprove of this form of protest? 1. APPROVE 2. DISAPPROVE 88. DON'T KNOW 99. REFUSED Q: Q24THANKSGIVING Now I would like you to think about friends and family coming together for the upcoming Thanksgiving holiday (or any similar holiday gathering). Which of the following best describes the way you feel? "I look forward to talking about politics over Thanksgiving dinner." OR "I dread the possibility of talking about politics at Thanksgiving dinner." 1. LOOKING FORWARD TO IT 2. DREADING IT 88. DON'T KNOW/NO OPINION 99. REFUSED

29 SCSU Survey Research Center Fall 2018 Statewide Survey: Political Report
Q: Q25IMMIG1 --------------- Thank you. Now we have some questions about immigration and its impact on the United States. Would you describe the overall impact of immigrants on the United States as: [READ 1-2 AND 4-5; IF RESPONDENT ASKS ABOUT DOCUMENTED VERSUS UNDOCUMENTED, TELL THEM THAT QUESTION REFERS TO BOTH/ALL IMMIGRANTS] 1. Very positive 2. Somewhat positive 3. NEUTRAL [VOLUNTEERED] 4. Somewhat negative 5. Very negative 88. NO OPINION/DON'T KNOW [VOLUNTEERED] 99. REFUSED Q: Q26IMMIG4 ---------------- Which of these statements is closer to your perspective?: “Immigrants decrease the white majority” or “Immigrants provide racial diversity.” 1. FIRST STATEMENT [“Immigrants decrease the white majority” ] 2. NEUTRAL [Volunteered] 3. SECOND STATEMENT [“Immigrants provide racial diversity”] 88. DON'T KNOW 99. REFUSED Q: Q27IMM_TRANS ------------------------ Now think about immigration in Minnesota. Q: Q27AIMM_SOM Do you support Minnesota welcoming Somali immigrants? [DO NOT READ RESPONSES] 1. YES - SUPPORT 2. NO - OPPOSE 3. MAYBE 88. DON'T KNOW 99. REFUSED

30 SCSU Survey Research Center Fall 2018 Statewide Survey: Political Report
Q: Q27BIMM_MEX ----------------------- Do you support Minnesota welcoming Mexican immigrants? [DO NOT READ RESPONSES] 1. YES - SUPPORT 2. NO - OPPOSE 3. MAYBE 88. DON'T KNOW 99. REFUSED Q: Q27CIMM_ORDER ------------------ [WHICH IMMIGRATION QUESTION WAS PRESENTED FIRST?] [DO NOT READ THIS TO RESPONDENTS, JUST PICK WHICH QUESTION WAS FIRST] 1. SOMALI 2. MEXICAN 88. DON'T KNOW Q: Q28IMM_MUS1 ----------------
Now, because the issue has been in the news recently, we have a question specifically about Muslim immigrants. How much do you agree with the following statement? “Muslim immigrants are more difficult to integrate into American society because of their religion.” [READ 1-2 AND 4-5] 1. Strongly agree 2. Somewhat agree 3. NEUTRAL [VOLUNTEERED] 4. Somewhat disagree 5. Strongly disagree 88. Don’t know 99. Refused Q: Q29FOODSECURITY ----------------------------- Now we'll change topic again to some questions about you and your household. Think about the following statement: “When I was growing up, my family worried whether our food would run out before we got money to buy more.” Was this: [READ OPTIONS 1-3] 1. Often true 2. Sometimes true 3. Never true 88. DON'T KNOW

31 SCSU Survey Research Center Fall 2018 Statewide Survey: Political Report
99. REFUSED Q: Q30SOCISOLATION How many friends and relatives do you feel close to such that you could call on them for help? 1. Zero 2. One 3. Two 4. Three to Four 5. Five to Eight 6. Nine or more 88. DON’T KNOW 99. REFUSED Q: Q31RELATIONS How satisfied are you with your relationships with friends and relatives? [READ OPTIONS 1-2 AND 4-5] 1. Very satisfied 2. Somewhat satisfied 3. NEUTRAL [VOLUNTEERED] 4. Somewhat dissatisfied 5. Very dissatisfied 88. DON’T KNOW 99. REFUSED Q: Q32NEWS_PREF -------------------
Thank you. Now I have a question about your preferences for news media. Which of the following would you say you prefer for getting news? [READ OPTIONS 1-5] 1. Reading news in a print newspaper 2. Listening to news on the radio 3. Watching news on television 4. Getting news from a social networking site (such as Facebook or Twitter) 5. Getting news from a website or app 6. DID NOT GET NEWS ON ANY PLATFORM [VOLUNTEERED] 88. DON'T KNOW 99. REFUSED IF (ANS=1) SKIPTO Q33MHDIAG IF (ANS>3) SKIPTO Q33MHDIAG IF (ANS=3) SKIPTO Q32B_TV_PREF

32 SCSU Survey Research Center Fall 2018 Statewide Survey: Political Report
Q: Q32A_RADIO_PREF ------------------- Which of the following types of radio news would you say you prefer? [READ OPTIONS 1-3] 1. Traditional news programs, like NPR's Morning Edition or All Things Considered 2. Political talk radio programs, like Rush Limbaugh or Thom Hartmann 3. News updates from music stations 88. DON'T KNOW 99. REFUSED SKIPTO Q33MHDIAG Q: Q32B_TV_PREF ------------------- Which of the following types of television news outlets would you say you prefer? [READ OPTIONS 1-3] 1. Traditional network news channels, like ABC, CBS, or NBC 2. Cable news channels, like Fox News, CNN, or MSNBC 3. Comedy news shows, like The Daily Show or Last Week Tonight 88. DON'T KNOW 99. REFUSED Q: Q33MHDIAG ----------------------------- Have you ever been diagnosed with a mental health condition, such as depression, anxiety, substance use disorder, or something else? [IF NECESSARY, REMIND RESPONDENT THAT THE SURVEY IS COMPLETELY ANONYMOUS, AND/OR IF THEY WANT YOU CAN SKIP TO THE NEXT QUESTION] 1. YES 2. NO 88. DON’T KNOW 99. REFUSED Q: Q34LOCATION ---------
Do you live in a city, a suburban area, a small town or a rural area? [IF ASKED, THEY SHOULD CHOOSE WHAT THEY THINK IS THE BEST OPTION] 1. CITY 2. SUBURBAN AREA 3. SMALL TOWN 4. RURAL AREA 88. DON’T KNOW 99. REFUSED

33 SCSU Survey Research Center Fall 2018 Statewide Survey: Political Report
Q: Q35COMMUNITY Now I have a question about how you feel connected to your community. Is your most meaningful connection through: 1. Friends and social groups 2. Children’s school and activities 3. Family 4. Work and employment 5. Religious participation 6. Recreation and leisure activities 7. Or civil and service organizations 88. DON'T KNOW 99. REFUSED Q: Q36LEAVING Suppose that for some reason you had to move away from your community. How would you feel about leaving? Would you be: 1. Very pleased to leave 2. Somewhat pleased to leave 3. NEUTRAL [VOLUNTEERED] 4. Somewhat sorry to leave 5. Very sorry to leave 88. DON'T KNOW 99. REFUSED Q: Q37AGE ----------- Thank you. These final questions help us determine if we are getting a representative sample of all Minnesotans. What was your age at your last birthday? [IF 97 OR OLDER, ENTER "97"] 98. DON'T KNOW 99. REFUSED AGE:

34 SCSU Survey Research Center Fall 2018 Statewide Survey: Political Report
Q: Q38EDUCATION ---------------------------------------------------- What was the last grade or year in school you completed? [DO NOT READ CATEGORIES] 1. LESS THAN 12 YEARS 2. 12 YEARS/HIGH SCHOOL GRADUATE 3. POST HIGH SCHOOL TECHNICAL TRAINING [ex. Tech College or Beauty School] 4. SOME COLLEGE, BUT DIDN'T GRADUATE [ex. 13-15 YEARS OF SCHOOL] 5. BACHELOR'S DEGREE/COLLEGE GRADUATE [BA, BS] 6. SOME GRADUATE EDUCATION 7. COMPLETED GRADUATE PROGRAM (M.S., M.A., PH.D., J.D., M.D., ETC.) 88. DON'T KNOW 99. REFUSED Q: Q39RACE ------------------------- Which of the following categories would you say best describes you? [READ CATEGORIES, STOP WHEN RESPONDENT INDICATES A MATCH] 1. White 2. Hispanic, or Latino origin 3. Black or African American 4. Asian or Asian American 5. American Indian or Alaska Native 6. Middle Eastern or North African 7. Native Hawaiian or Other Pacific Islander 8. Mixed [belongs to multiple categories] 9. OTHER 88. DON'T KNOW 99. REFUSED Q: Q41RELIGION ------------------------ What, if any, is your religious preference? [READ RESPONSES 1-5, EXCLUDING BRACKETED INFORMATION WHICH MAY BE OFFERED AS A PROBE IF NEEDED] 1. Roman Catholic 2. Evangelical Protestant [e.g., "BORN AGAIN CHRISTIAN"] 3. Other Protestant [e.g., LUTHERAN, METHODIST, EPISCOPALIAN] 4. Some other religion [e.g., MUSLIM, JEWISH, BUDDHIST, HINDU, ETC.] 5. Unaffiliated or non-religious [e.g., ATHIEST, AGNOSTIC] 88. DON'T KNOW 99. REFUSED

35 SCSU Survey Research Center Fall 2018 Statewide Survey: Political Report
Q: Q42INCOME --------------------------------------------------- Finally, would you please tell me the range which best represents the total yearly income, before taxes, of all immediate family living in your household? [IF NECESSARY, READ LIST UNTIL STOPPED] 1. under $15,000 2. $15,000 up to $24,999 3. $25,000 up to $34,999 4. $35,000 up to $49,999 5. $50,000 up to $74,999 6. $75,000 up to $99,999 7. $100,000 or more 88. DON'T KNOW 99. REFUSED Q: THANKSO ----------- I would like to thank you very much for your time and cooperation. You have been very helpful. If you would like to see the results of this survey you may contact the SCSU Survey Lab at St. Cloud State University. Would you like the number or website? [IF YES IT IS 320-308-3980 or WEBSITE: www.stcloudstate.edu/scsusurvey]. Good-bye! [INTERVIEWER- BRING TO A DIRECTOR'S ATTENTION ANY PROBLEMS WITH THE INTERVIEW, SUCH AS DIFFICULT QUESTIONS, CODING PROBLEMS, ETC.] GREAT JOB! YOU GOT ANOTHER COMPLETE SURVEY! Q: THANKYOU -------------------------------------------------- Thank you for your time.