mirato spa top management paglieri profumi felce azzurra 95.271 1,5 0,3 31,0 12 neutro sara lee...
TRANSCRIPT

11
MIRATO SPA TOP MANAGEMENTMIRATO SPA TOP MANAGEMENT
Roberto PetrosinoCEO-General Manager
22
PRODUCTIONPRODUCTION
Mirato concentrates the historical output of the Company, deo spray(aereosol), hair laque…….
MilMil makes all the liquid products: bath foams, shower foams,liquid soap, gel for hair; starting from september ’06, MilMil willproduce creams, sun products and a cosmetics; then the Group willinternalize even this margin in 2007
Mirato Group produces near Milan in 2 plants realities:

33
MIRATO GROUPMIRATO GROUP
•• Internalization of industrial margin
• Strong Sinergies in purchasing
• Export Mil Mil: increasing due to Mirato’s customers

44
The The EuropeanEuropean DistributionDistribution
0% 2% 4% 6% 8% 10% 12%
Tesco
Metro
IRTS (Auchan, Casinò)
AMS (Ahold,Marcadona,..)
Alidis (ITM,Edeka,Eroski)
Carrefour
Copernic
EMD (ESD,Euromadi,..)
The first 8 groups represent about 65% of the value market

55
The competitive The competitive scenaryscenary
• Speeding up of concentration of extensive consumer goods producers. In manycategory ¾ of producers peach 80% of the market
• The concentration phenomenon involves also distribution acquisition, mergersand JV have been moltiplying during last years. The first 3 integrated centrale represent 20% of the market (Carrefour, Metro and Tesco)
• The indipendent traders have to react to get an appropriate level of competivity. For this reason Colruyt, Conad, Coop Suisse, Leclerc e Rewe Group havedecided to create Coopernic (COOPèrative Euroèenne de Référencement et de Nègoce des Indèpendants Commercants)
FOCUSThe local producers and PME will have the opportunity to move into the international market

66
Export Export
Breakdown of sales 31-12-200823%
77%
Export Italy

77
Export Export salessales
20,3%
21,9%22,3%
23,0%
19,0%19,5%20,0%20,5%21,0%21,5%22,0%22,5%23,0%23,5%24,0%
2005 2006 2007 2008
+ 10%
+ 9%
2%Other27%Asia/Middle East42%European Union7%Eastern Europe22%Africa
Net sales(% export)
Country

88
EBITEBIT
15,6 16,817,8
15,1
101112131415161718
2005 2006 2007 2008
+ 10%
-15%

99
GrossGross ProfitProfit
+ 10%
14,816,4
14,2
11,012,013,014,015,016,017,018,019,0
2005 2006 2007 2008
17,7 -20%

1010
Net ProfitNet Profit
+ 10%
8,49,3
10,7
8,9
7,5
8,5
9,5
10,5
11,5
12,5
2005 2006 2007 2008
-17%

1111
PRIVATE LABEL: EUROPEAN PANORAMA PRIVATE LABEL: EUROPEAN PANORAMA
BELGIUM 42%UNITED KINGDOM 43%GERMANY 40%SPAIN 34%FRANCE 32%NETHERLAND 22%ITALY 16%
1) Source: AC NIELSEN 2007

1212
Net financial position (Net financial position (IasIas))
-21,6
-9,8
-1,1
-12,7
-6,5-4,2
-8,4
-3,7
-17,7
-14,2-12,3
-25
-20
-15
-10
-5
0Ju
n 04
dec
04
Jun
05
dec
05
Jun
06
dec
06
mar
ch 0
7
Jun
07
dec
07
Jun
08
dec
08
NFP includes the debt vs leasing companies
* January ’09= -18 milions related to BREEZE acquisition
*

13
Il mercato dei NEUTRI: dati sell out a volume
Rank Brand Vendite volume
Quota Vol.
Var P.ti Quota Vol. vs Corrisp.
Var% Vol. vs Corrisp.
NEUTRO 6.481.915 100,0 0,0 4,61 NEUTRO UNILEVER DOVE 1.216.361 18,8 0,2 5,92 NEUTRO MAN&ROB BOROTALCO 1.163.218 17,9 -0,7 0,93 NEUTRO P&G INFASIL 984.151 15,2 -1,4 -4,14 NEUTRO BDF NIVEA 945.374 14,6 1,9 19,95 NEUTRO MAN&ROB NEUTROROBERTS 865.753 13,4 -0,4 1,36 NEUTRO ZZALTRIPROD LYCIA 207.251 3,2 -0,1 0,4
7 NEUTRO SELECTIVE BEAUTY BREEZE 176.137 2,7 -0,3 -6,9
8 NEUTRO ZPRIVATE PLT 174.303 2,7 0,4 23,49 NEUTRO HENKEL NEUTROMED 149.686 2,3 -0,2 -4,510 NEUTRO ZPRIVATE PLF 112.865 1,7 1,1 183,2
11NEUTRO PAGLIERI PROFUMI FELCE AZZURRA
95.271 1,5 0,3 31,0
12 NEUTRO SARA LEE SANEX 87.606 1,4 -0,2 -9,8
13 NEUTRO SSL HEALTHCARE SAUBER 60.379 0,9 -0,1 -7,014 NEUTRO COSWELL BIONSEN 37.942 0,6 -0,2 -21,615 NEUTRO MIRATO CLINIANS 18.072 0,3 -0,2 -36,4
Fonte dati: Ac Nielsen Italia- A.T.17/8/08

14
Il mercato dei NEUTRI: dati sell out a valore
Rank BrandVendite Valore Quota Val.
Var P.ti Quota Val. vs
Corrisp.
Var% Val. vs Corrisp.
NEUTRO 223.838.327 100,0 0,0 0,21 NEUTRO UNILEVER DOVE 39.169.445 17,5 0,9 5,52 NEUTRO MAN&ROB BOROTALCO 38.777.923 17,3 -0,3 -1,63 NEUTRO P&G INFASIL 34.765.500 15,5 -0,9 -5,24 NEUTRO BDF NIVEA 31.108.796 13,9 1,6 13,45 NEUTRO MAN&ROB NEUTROROBERTS 30.112.877 13,5 -0,4 -2,46 NEUTRO ZZALTRIPROD LYCIA 15.091.897 6,7 -0,2 -2,9
7 NEUTRO SELECTIVE BEAUTY BREEZE 8.648.863 3,9 -0,5 -12,0
8 NEUTRO SSL HEALTHCARE SAUBER 5.664.367 2,5 -0,2 -7,99 NEUTRO HENKEL NEUTROMED 2.976.533 1,3 0,0 -3,310 NEUTRO ZPRIVATE PLT 2.842.272 1,3 0,2 22,4
11 NEUTRO SARA LEE SANEX 2.067.778 0,9 -0,1 -13,5
12NEUTRO PAGLIERI PROFUMI FELCE AZZURRA
1.977.963 0,9 0,2 39,6
13 NEUTRO ZPRIVATE PLF 1.435.519 0,6 0,3 87,914 NEUTRO COSWELL BIONSEN 1.375.352 0,6 -0,2 -26,115 NEUTRO BYLY 1.048.625 0,5 0,0 -5,9
Fonte dati: Ac Nielsen Italia- A.T.17/8/08
1515
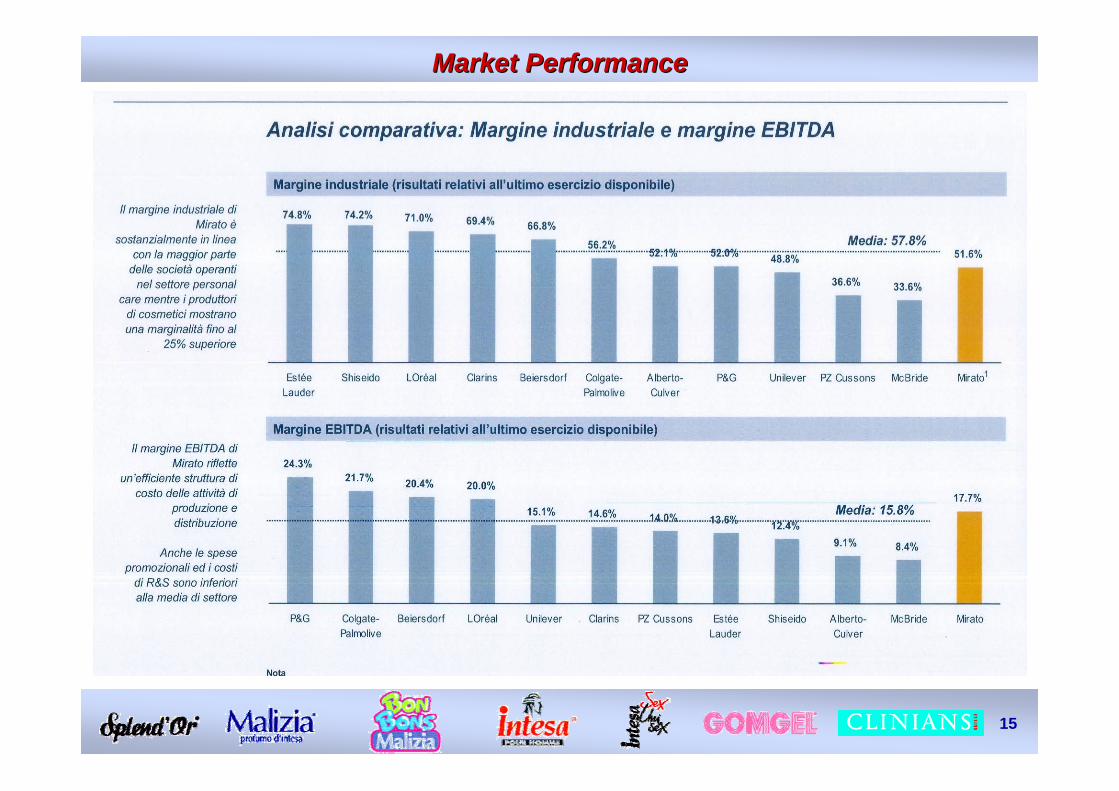
Market PerformanceMarket Performance

1616
Market PerformanceMarket Performance