misinformation or expressive responding? what an...
TRANSCRIPT

1
Misinformation or Expressive Responding? What an inauguration crowd can tell us about the source of political misinformation in
surveys
Brian F. Schaffner (Corresponding Author)
University of Massachusetts Amherst 200 Hicks Way
Amherst, MA 01003 (413) 545-0416
Samantha Luks YouGov
805 Veterans Blvd. Suite 202 Redwood City, CA 94063
(650) 462-8009 [email protected]
FORTHCOMING AT PUBLIC OPINION QUARTERLY
Running header: Misinformation or Expressive Responding
Word count: 2,745

2
Brian F. Schaffner is professor in the Department of Political Science at the University of Massachusetts Amherst, Amherst, MA. Samantha Luks is Managing Director, Scientific Research at YouGov, Redwood City, CA. The authors thank John Bullock, Scott Blinder, Tatishe Nteta, and Meredith Rolfe for feedback on an earlier version of this paper. The authors are aware of no conflicts of interest involved in the publication of this article.* Address correspondence to Brian Schaffner, University of Massachusetts Amherst, Department of Political Science, 200 Hicks Way, Amherst, MA 01003, USA; email: [email protected].

3
The public’s party-driven misinformation and misperceptions about politics has drawn a great
deal of attention from scholars over the past decade. While much of this research assumes that
the misinformation documented by survey researchers is an accurate reflection of what
individuals truly believe, other scholars have suggested that individuals intentionally and
knowingly provide misinformation to survey researchers as a way of showing support for their
political side. To date, it has been difficult to adjudicate between these two contrasting
explanations for misperceptions. However, in this note, we provide such a test. We take
advantage of a controversy regarding the relative sizes of crowds at the presidential
inaugurations of Donald Trump in 2017 and Barack Obama in 2009 to ask a question where the
answer is so clear and obvious to the respondents that nobody providing an honest response
should answer incorrectly. Yet, at the same time, the question taps into a salient political
controversy that provides incentives for Trump supporters to engage in expressive responding.
We find that there is clear evidence of expressive responding and that this behavior is especially
prevalent among partisans with higher levels of political interest. Our findings provide support
for the notion that at least some of the misinformation reported in surveys is the result of partisan
cheerleading rather than genuinely held misperceptions.

4
As high levels of political misinformation have attracted increasing attention from
scholars and the public alike, we still lack a clear understanding of why so many Americans
appear to be misinformed about politically-relevant facts. The most prominent explanation for
misinformation is derived from the theory of directionally motivated reasoning — the
tendency of individuals to engage new information with a motivation to reach a particular
conclusion (Kunda 1990). That is, partisans tend to seek out information that reinforces their
political beliefs, and reject or counter-argue information that challenges those beliefs (Taber and
Lodge 2006). This theory assumes that the misinformation documented by survey researchers is
an accurate reflection of what individuals truly believe. For example, when a large proportion of
Republicans say that they think Obama is a Muslim, they truly believe that to be the case.
A recent challenge to the belief that misperceptions are truly held by individuals comes
from Bullock et al. (2015) and Prior et al. (2015), who argue that at least some of the
misperceptions that respondents provide in response to survey questions are not genuinely held
beliefs. This body of work proposes an alternative explanation, called expressive responding,
whereby individuals intentionally provide misinformation to survey researchers as a way of
showing support for their political viewpoint. By this reasoning, at least some of the Republicans
who say that Obama is a Muslim may not actually believe that to be true, but they are using the
question about his citizenship status to express their disapproval of him or his presidency.
To date, it has been difficult to adjudicate between these two contrasting explanations for
misperceptions. Bullock et al. (2015) and Prior et al. (2015) conducted experiments where some
subjects were offered material rewards for either answering questions correctly or admitting that
they don’t know the answer. The logic behind this approach is to increase the importance of
accuracy motivations for respondents. In both studies, the partisan polarization in misperceptions

5
declined under the incentive conditions, suggesting that some of the misinformation reported in
surveys may indeed arise from expressive responding. However, Flynn et al. (2017) cite two
reasons for why this evidence is not entirely conclusive. First, the incentive conditions do not
consistently generate more accurate responses to factual questions, a pattern we might expect to
see under conditions of expressive responding. In other words, while polarization in knowledge
decreases, the material incentives do not always reduce the overall levels of misinformation. A
second related critique is that the patterns from those experiments may simply arise from the fact
that respondents tend to assemble survey responses off the top of their heads from a biased set of
considerations (Zaller 1992). Therefore, the incentive condition simply changes what types of
considerations respondents sample; it does not prove that respondents are intentionally
answering incorrectly.
Thus, as Flynn et al. (2017) note in a recent review, “Assessing the extent to which
reported misperceptions are sincere (reflecting confidence in an incorrect answer) versus
expressive (intentionally and knowingly reporting an incorrect answer to engage in partisan
cheerleading) remains an important topic for future research” (2017, p .139). The difficulty thus
far has been in determining whether respondents “intentionally and knowingly” provide incorrect
answers to questions in order to engage in partisan cheerleading. What would be useful then is an
extreme case — one that would provide a more definitive test of whether there is at least some
expressive responding to factual questions on surveys.
In this research note, we provide such a test. As we discuss below, we take advantage of a
controversy regarding the relative sizes of crowds at the presidential inaugurations of Donald
Trump in 2017 and Barack Obama in 2009 to ask a question where the answer is so clear and
obvious to most respondents that almost nobody providing an honest response should answer

6
incorrectly. At the same time, the question taps into a salient political controversy that provides
incentives for people — especially supporters of Trump — to engage in expressive responding.
Thus, by design, our test allows us to essentially rule out the possibility that incorrect responses
are the result of truly held beliefs or a biased sampling of information. Taking advantage of this
design, we find that there is clear evidence of expressive responding and that this behavior is
especially prevalent among partisans with higher levels of political engagement — precisely
those respondents who have both the contextual knowledge and motivation to engage in the
behavior.
Design
On the day following Donald Trump’s inauguration a debate erupted over the factually
clear point that fewer people attended Trump’s inauguration than had come to either of Barack
Obama’s inaugurations in 2009 and 2013. Even the White House Press Secretary addressed the
news media to promote the notion that more people attended Trump’s inaugural, stating that it
was “the largest audience ever to witness an inauguration — period — both in person and around
the globe.” What made the controversy particularly noteworthy was the existence of aerial
photographs (taken from the Washington Monument) showing that many more people were on
the mall in 2009 at Obama’s inaugural than in 2017 at Trump’s (see Figure 1). Despite this
photographic evidence, as well as other empirical indicators of crowd size such as subway
ridership, the Trump administration persisted in their insistence that more people attended his
inauguration.
[INSERT FIGURE 1 ABOUT HERE]
7
This remarkable episode provided us with a unique opportunity to gauge the extent to
which people were willing to provide incorrect answers to survey questions and, especially, a
way of determining whether some people engage in expressive responding. On the two days
immediately following the controversy (January 22nd - 23rd), we fielded a brief survey of a
nationally representative sample of 1,388 U.S. adults, administered online by YouGov.
Respondents were randomized into two conditions. In both conditions, we showed
respondents the pair of images comparing the Obama inauguration crowd with that for Trump’s
(see Figure 1). However, we did not identify these images for respondents; we merely labeled
them as image A and image B. To respondents who were randomly assigned to the first
condition, we asked a simple question: “Which photo has more people?” Respondents in our
second condition received the same set of photographs, but were asked to identify which photo
was from Trump’s inauguration and which was from Obama’s.
The first condition essentially levels the playing field for all respondents; to anyone with
reasonable vision, the correct answer to this question is obvious. Thus, there are two possible
reasons that a respondent would choose image A as having more people: (1) they failed to read
the question or accidentally clicked on the wrong box (measurement error), or (2) their incorrect
answer was intentional. If we find differential levels of selecting image A based on one’s
political allegiances, then the latter explanation — expressive responding — is almost certainly
the culprit. After all, there is no reason to expect that Trump supporters are more prone to
misreading or accidental clicking in surveys (see the Appendix for confirmation of this).
Likewise, incorrect responses to this question could not result from a biased sampling of
considerationsby respondents since the evidence is clear and accessible to nearly everyone
(Zaller 1992).

8
In analyzing responses to this question, we focus on two moderators — the respondent’s
support for Trump and how politically engaged the respondent is. To measure support for
Trump, we use two measures – the respondent’s 2016 vote choice and the extent to which the
respondent approves or disapproves of Trump. We add the latter measure because it provides a
more nuanced measure of support for Trump since it allows us to distinguish between those who
strongly approve and those who only somewhat approve of him.
For political engagement, we use the respondent’s level of education. While education
has been used extensively as a proxy for political engagement in a wide array of studies (Zaller
1992), the Appendix re-creates our main results using an alternative measure – the respondent’s
self-reported interest in politics.
The measures of presidential vote choice and educational attainment come from
questions that are part of YouGov’s profile battery, and thus for nearly all of the respondents the
answers to these questions were collected before those respondents encountered our survey.
Presidential approval was measured during the administration of the survey. In our weighted
sample, 38% of respondents voted for Trump, 41% said they had voted for Hillary Clinton, and
21% were non-voters (we excluded third party voters from our analysis). 28% strongly approved
of Trump, 11% somewhat approved, 10% somewhat disapproved, and 35% strongly disapproved
(with 15% not sure). Finally, in terms of education, 17% of respondents in our sample reported
having at least a college degree, with the remaining 83% reporting lower levels of education.
For respondents in our second condition, the question does not have a clear accessible
answer. Accordingly, this question cannot provide us with the same strong test of expressive
responding, but it does provide us with a baseline of misperceptions as an additional reference
point for the results for the first condition.
9
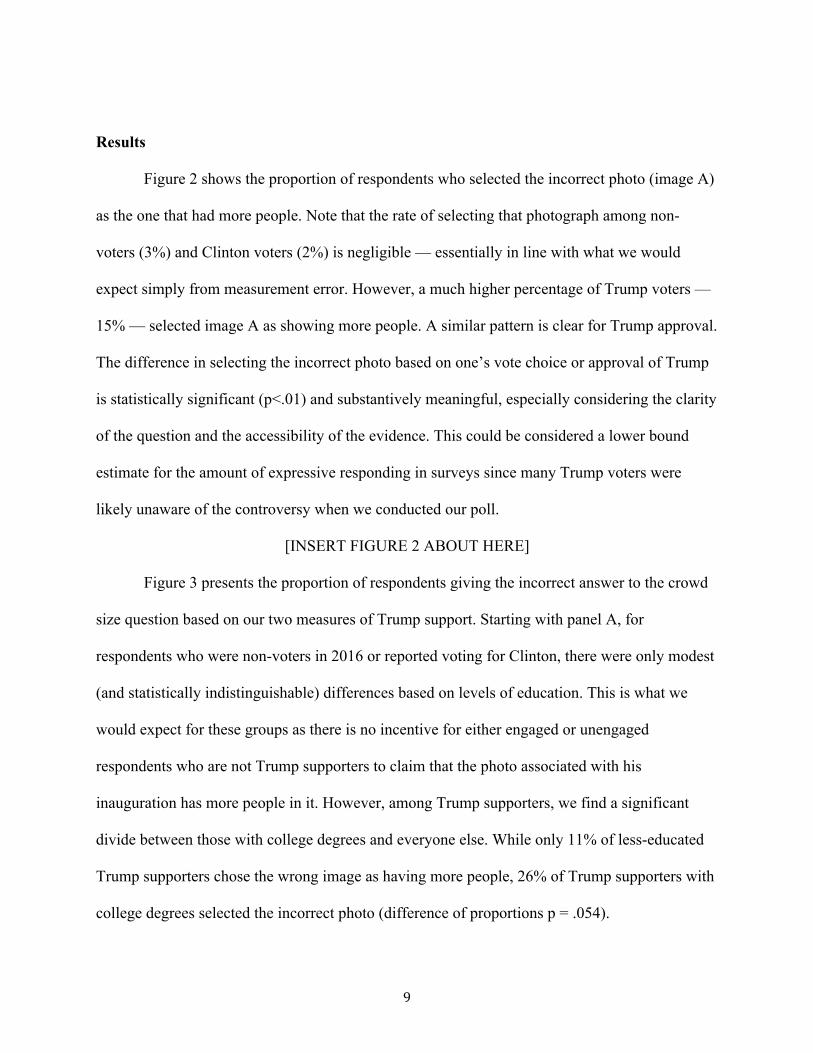
Results
Figure 2 shows the proportion of respondents who selected the incorrect photo (image A)
as the one that had more people. Note that the rate of selecting that photograph among non-
voters (3%) and Clinton voters (2%) is negligible — essentially in line with what we would
expect simply from measurement error. However, a much higher percentage of Trump voters —
15% — selected image A as showing more people. A similar pattern is clear for Trump approval.
The difference in selecting the incorrect photo based on one’s vote choice or approval of Trump
is statistically significant (p<.01) and substantively meaningful, especially considering the clarity
of the question and the accessibility of the evidence. This could be considered a lower bound
estimate for the amount of expressive responding in surveys since many Trump voters were
likely unaware of the controversy when we conducted our poll.
[INSERT FIGURE 2 ABOUT HERE]
Figure 3 presents the proportion of respondents giving the incorrect answer to the crowd
size question based on our two measures of Trump support. Starting with panel A, for
respondents who were non-voters in 2016 or reported voting for Clinton, there were only modest
(and statistically indistinguishable) differences based on levels of education. This is what we
would expect for these groups as there is no incentive for either engaged or unengaged
respondents who are not Trump supporters to claim that the photo associated with his
inauguration has more people in it. However, among Trump supporters, we find a significant
divide between those with college degrees and everyone else. While only 11% of less-educated
Trump supporters chose the wrong image as having more people, 26% of Trump supporters with
college degrees selected the incorrect photo (difference of proportions p = .054).

10
[INSERT FIGURE 3 ABOUT HERE]
That politically engaged Trump supporters were more than twice as likely to select the
wrong photo makes sense from the perspective of expressive responding. After all, Trump
supporters would only be motivated to choose the wrong photograph as a way of engaging in
partisan cheerleading if they understood the context in which the question was being asked.
Since Trump supporters with more engagement in politics were more likely to have understood
the controversy about the inauguration crowds, they were more likely to choose the wrong photo
as a way of supporting Trump in the debate.
Panel B in Figure 3 shows similar patterns, this time by approval of Trump. This plot
provides even stronger evidence that expressive responding is mostly likely to occur among
those who are highly motivated and highly aware. Specifically, only a small percent of those
who somewhat approve of Trump chose the wrong photograph, and the incidence of choosing
the wrong photo is not related to education among this group. Only those who strongly approve
of Trump show noteworthy levels of expressive responding. This pattern also occurs at a higher
rate among the more educated strong approvers than those without college degrees (p = .025).
The other half of respondents received the same set of photographs, but were asked
which photo was from Trump’s inauguration and which was from Obama’s. Figure 4 shows the
proportion of respondents giving the wrong answer to this question based on their educational
attainment and our two measures of Trump support. Not surprisingly, we see more incorrect
responses across the board when it comes to this question; however, we also see similar partisan
differences as we found for the crowd size question. About 40% of Trump voters mis-identify
which picture went with which president’s inauguration, compared to about 20% of non-voters
and less than 10% of Clinton voters. Additionally, we find a striking reversal for the moderating

11
role of educational attainment. In this condition, where respondents were asked to match the
photographs to the correct president’s inauguration, contextual knowledge of the crowd
controversy is no longer needed to know which answer would favor Trump. Accordingly, the
effects conditioned by education are flipped. Specifically, low-education Trump voters were
about twice as likely to select the wrong image as college-educated Trump voters were.
[INSERT FIGURE 4 ABOUT HERE]
Another way of looking at these findings is to note that high education Trump voters
were about equally likely to select the wrong photograph in both conditions (26% in Figure 3,
panel b and 23% in Figure 4, panel b), despite the first question being much easier than the other.
At the same time, nearly half of less educated Trump voters provided the wrong answer to the
question about which photograph went with which president’s inauguration while only one-in-
ten provided the wrong answer to the easy question about which photograph had more people in
it. In other words, college-educated Trump supporters provide incorrect information at roughly
the same rate across the two conditions, but less-educated Trump supporters are highly affected
by whether the answer to the question was clear or not.
Panel B in Figure 4 shows these patterns based on approval of Trump. A similar pattern
emerges – college educated strong approvers are about equally likely to pick the wrong photo in
this condition as they were in the previous one, but those with less education now do so at a
much higher rate. Furthermore, this pattern of picking the wrong photograph extends to less
educated respondents who somewhat approve or are not sure. This suggests that for less
politically engaged Trump supporters, misinformation may stem from the tendency to guess the
option that is more favorable to Trump when they are not sure of the answer.
12
Conclusion
Our study provides strong evidence that the most politically engaged Trump supporters
provided expressive responses to a straightforward question related to a controversy over
inauguration crowd sizes. In fact, the best way to think about this result is that it helps to
establish that much of the misinformation documented among the most engaged Trump
supporters appears to be the result of expressive responding. Why? Because high education
Trump supporters were just as likely to provide the wrong answer in the condition where the
answer was in plain view as they were when the answer was not as obvious. If some other
process accounted for misinformation among politically engaged Trump supporters, then we
should have seen higher levels of misinformation in the second condition when the answer was
less clear. In such a scenario, there is more of an opportunity for motivated reasoning to come
into play; yet, there was no statistically significant increase in misinformation. This is an
important result for contextualizing the scholarship on misinformation. Scholars have
consistently shown that misperceptions are most common among the most politically engaged;
yet, our results suggest that much of those misperceptions are not genuine.
It is worth noting that the nature of our study only allows us to establish the existence of
expressive responding on one side of the political spectrum. Future research may attempt to
design similar experiments to test whether Democrats also engage in this behavior. Nevertheless,
this research provides an important contribution by showing that expressive responding can
account for at least some of the substantial levels of political misinformation commonly reported
in surveys, especially when that misinformation comes from the most politically engaged
partisans. The consequences of this finding are important for considering the implications of

13
partisan misperceptions. As Bullock et al. note, “If Democrats and Republicans perceive
different realities, then the incentives for incumbent politicians to pursue policies that generate
objectively good policies may be reduced” (2015). These concerns may be alleviated, to some
extent, if at least some of the misperceptions reported in surveys are the result of partisan
cheerleading rather than truly held misinformation.
14
Appendix
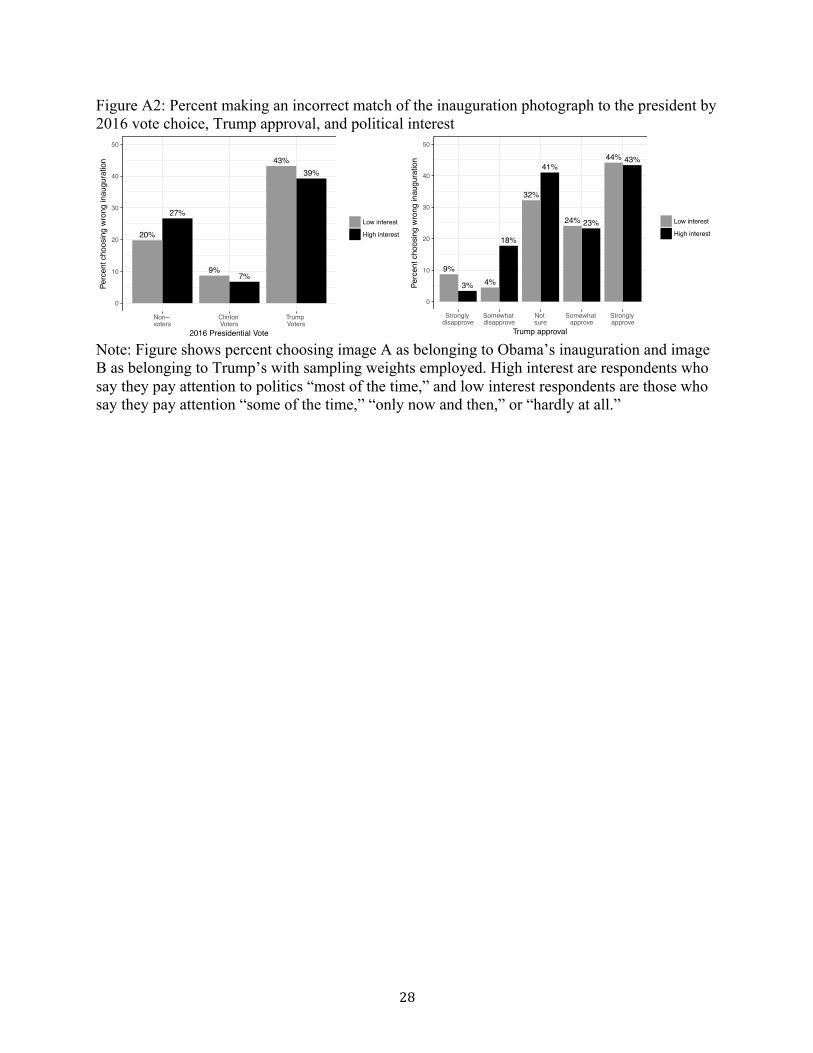
Using Self-Reported Political Interest Rather than Education
In the results presented in the paper, we use educational attainment as a proxy for
political engagement (Zaller 1992). Here, we demonstrate that we find similar patterns of results
when we use self-reported political attention instead. In our sample, 51% of respondents reported
that they pay attention to politics “most of the time,” with the remaining 49% selecting either
“some of the time,” “only now and then,” or “hardly at all.” We compare the former high interest
group to the latter low interest respondents.
Figures A1 and A2 reproduce the results from Figures 3 and 4 in the main paper. The
patterns in these figures largely match what is shown in the paper. To the extent that there are
differences, it is that high and low interest respondents who support Trump are about equally
likely to provide the wrong response to the question about which photograph goes with which
president’s inauguration whereas low education respondents were more likely to provide the
wrong response compared to those with college degrees. This difference likely occurs because
people over-report their political interest in the self-report question and thus that group includes
more people who are less engaged with politics than the group of college educated respondents
does. Nonetheless, the key patterns presented in the paper (particularly those from Figure 3 in the
paper and Figure A1 here) are quite consistent regardless of which measure of political
engagement we use.
Ruling Out Alternative Explanations

15
In this section, we address two potential alternative explanations for the results we find in
Figure 2. The first possibility we address is the notion that the images may be more difficult for
respondents to view on mobile devices. If that is true and if Trump supporters were more likely
to take the survey on a mobile device than Clinton supporters, then that could account for the
higher rate of choosing the wrong photograph for Trump versus Clinton voters. YouGov collects
meta-data on the device used to take each survey. Approximately one-fourth of respondents took
the survey on a mobile device. However, there were only small differences in mobile survey
administration by vote choice and, in fact, Clinton voters were actually more likely to take the
survey on a mobile device than Trump voters (26% and 21%, respectively). Thus, the usage of
mobile devices cannot account for the results we present in Figure 2.
A second possibility that could account for the results in Figure 2 is that Trump
supporters are more likely to make response entry errors than Clinton supporters. If it was true
that Trump supporters exhibit higher rates of measurement error in general, then this pattern
could account for the fact that they were much more likely to choose the wrong image. There is
no theoretical reason to think this is true, but to be sure we examined how respondents to the
survey answered a question that is part of YouGov’s demographic profile battery. Questions in
the profile battery are periodically re-asked of respondents to ensure the validity of those
measures. For this exercise, we used the question about a respondent’s educational attainment
since the question has six categories, making it more likely that an individual might accidentally
select the wrong value. However, we did collapse the categories for “some college” and “2-year
degree” since moving between these categories is valid without making an error. Notably, 21%
of Trump voters changed their response to the education question at some point during their time
on the YouGov panel compared to 24% of Clinton voters did so. Of course, some of this

16
movement is likely to be actual change, as individuals achieve higher levels of education during
their time on the panel (finishing college or post-graduate degrees). But a negative change in
educational attainment cannot be explained by anything other than response entry error. Here, we
find that 16% of both Clinton and Trump voters moved from more to less education at some
point during their time on the panel. Thus, there is no evidence that Trump voters are more likely
to commit response entry errors.
Information on Survey
The survey was conducted by YouGov. The survey was collected online on January 22-
23, 2017. YouGov sampled 2,798 individuals from their panel and 1,417 completed the survey
for a response rate (RR1) of 51.7%.
YouGov panelists were invited to the survey with a generic invitation to prevent potential
respondents from self-selecting into a topic of interest. The respondents who took this survey had
participated in mostly non-political surveys during the preceding months. Specifically, only 22%
of the surveys taken by our sample during the previous two months had any political content.
The population under study was American adults. At the recruitment stage, respondents were
invited based on their fit to interlocking demographic targets of gender x race x age x education,
plus a marginal target for Census region. All sampling targets were loosely applied. That is, if a
respondent started the survey after her target cell had been filled, she was permitted to complete
the survey.
The final sample of respondents to the survey was then weighted to a more complete
population frame, selecting the closest matches to the population. The frame was constructed by
stratified sampling from the full 2013 American Community Survey (ACS) sample with

17
selection within strata by weighted sampling with replacements. The sample was weighted based
on age, education, gender, party identification, ideology, political interest and race.
Wording of Questions Used in Analysis
Figure 1 in the main text shows the images and wording for the question capturing the main
dependent variable for a randomly selected half of the sample. The other half of the sample
received the same preamble text and images, but the questio text instead read:
From what event was each photo taken?
<1> Photo A was from Donald Trump’s 2017 Inauguration. Photo B was from Barack Obama’s
2009 Inauguration.
<2> Photo A was from Barack Obama’s 2009 Inauguration. Photo B was from Donald Trump’s
2017 Inauguration.
Who did you vote for in the election for President? {response options 1 and 2 randomized}
<1> Hillary Clinton
<2> Donald Trump
<3> Gary Johnson
<4> Jill Stein
<5> Evan McMullin
<6> Other {please specify}
<7>Did not vote for President
Political interest:

18
Some people seem to follow what’s going on in government and public affairs most of the time,
whether there’s an election going on or not. Others aren’t that interested. Would you say you
follow what’s going on in government and public affairs ... ?
Most of the time
Some of the time
Only now and then
Hardly at all
Don’t know
Wording of the variables used for weighting:
Education:
What is the highest level of education you have completed?
Did not graduate from high school
High school graduate
Some college, but no degree (yet)
2-year college degree
4-year college degree
Postgraduate degree (MA, MBA, MD, JD, PhD, etc.)
Age:
In what year were you born?
[TEXT ENTRY]

19
Gender:
Are you male or female?
Male
Female
Race:
What racial or ethnic group best describes you?
White
Black or African American
Hispanic or Latino
Asian or Asian American
Native American
Mixed
Other
Middle Eastern
Party Identification:
Generally speaking, do you think of yourself as a ...?
Democrat
Republican
Independent
Other

20
Not sure
Strength of Democratic ID:
Would you call yourself a strong Democrat or a not very strong Democrat?
Strong Democrat
Not very strong Democrat
Strength of Republican ID:
Would you call yourself a strong Republican or a not very strong Republican?
Strong Republican
Not very strong Republican
Independent Leaners:
Do you think of yourself as closer to the Democratic or the Republican Party?
Lean Democrat
Independent
Lean Republican
Not sure
Ideology:
Thinking about politics these days, how would you describe your own political viewpoint?
Very liberal
Liberal

21
Moderate
Conservative
Very Conservative
Not sure

22
References
Bullock, John G., Alan S. Gerber, Seth J. Hill, Gregory A. Huber. 2015. “Partisan bias in factual
beliefs about politics.” Quarterly Journal of Political Science 10: 519–578.
Flynn, D.J., Brendan Nyhan and Jason Reifler. 2017. “The Nature and Origins of
Misperceptions: Understanding False and Unsupported Beliefs About Politics.” Advances
in Political Psychology, 38: 127-150.
Kunda, Ziva. 1990. “The case for motivated reasoning.” Psychological bulletin. 108: 480.
Prior, Markus, Gaurav Sood and Kabir Khanna. 2015. “You cannot be serious: The impact of
accuracy incentives on partisan bias in reports of economic perceptions.” Quarterly
Journal of Political Science. 10: 489-518.
Taber, Charles S. Milton Lodge. 2006. “Motivated skepticism in the evaluation of political
beliefs.” American Journal of Political Science. 50: 755-769.
Zaller, John. 1992. The nature and origins of mass opinion. Cambridge University Press.

23
Figure 1: Screen shot of question shown to respondents in first condition
Note: A randomly assigned one-half of the sample received this question.

24
Figure 2: Percent choosing wrong photograph as having more people by 2016 vote choice and Trump approval
Note: Figure shows percent choosing image A in response to the question shown in Figure 1 with sampling weights employed. N = 158 non-voters, 275 Clinton voters, and 218 Trump voters.
3%2%
15%
0
5
10
15
20
Non− voters
Clinton Voters
Trump Voters
2016 Presidential Vote
Perc
ent c
hoos
ing
wro
ng p
hoto
4%
2%
4%5%
14%
0
5
10
15
20
Strongly disapprove
Somewhat disapprove
Not sure
Somewhat approve
Strongly approve
Trump ApprovalPe
rcen
t cho
osin
g w
rong
pho
to

25
Figure 3: Percent choosing wrong photograph as having more people by 2016 vote choice, approval of Trump, and education
Note: Figure shows percent choosing image A in response to the question shown in Figure 1 with sampling weights employed. High education respondents are those with at least a college degree and low education respondents are those with some college or less.
3%3%1%2%
26%
11%
0
10
20
30
Non− voters
Clinton Voters
Trump Voters
2016 Presidential Vote
Perc
ent c
hoos
ing
wro
ng p
hoto
Low education
High education
1%
6%
0%2%
5%4%
6%5%
28%
10%
0
10
20
30
Strongly disapprove
Somewhat disapprove
Not sure
Somewhat approve
Strongly approve
Trump approval
Perc
ent c
hoos
ing
wro
ng p
hoto
Low education
High education

26
Figure 4: Percent making an incorrect match of the inauguration photograph to the president by 2016 vote choice, Trump approval, and education
Note: Figure shows percent choosing image A as belonging to Obama’s inauguration and image B as belonging to Trump’s with sampling weights employed. High education respondents are those with at least a college degree and low education respondents are those with some college or less.
9%
23%
3%
10%
23%
46%
0
10
20
30
40
50
Non− voters
Clinton Voters
Trump Voters
2016 Presidential Vote
Perc
ent c
hoos
ing
wro
ng in
augu
ratio
n
Low education
High education
2%
8%
3%
10%
14%
38%
6%
32% 33%
46%
0
10
20
30
40
50
Strongly disapprove
Somewhat disapprove
Not sure
Somewhat approve
Strongly approve
Trump approval
Perc
ent c
hoos
ing
wro
ng in
augu
ratio
n
Low education
High education

27
Figure A1: Percent choosing wrong photograph as having more people by 2016 vote choice, Trump approval, and political interest
Note: Figure shows percent choosing image A in response to the question shown in Figure 1 with sampling weights employed. High interest are respondents who say they pay attention to politics “most of the time,” and low interest respondents are those who say they pay attention “some of the time,” “only now and then,” or “hardly at all.”
2%3%1%
3%
18%
8%
0
10
20
30
Non− voters
Clinton Voters
Trump Voters
2016 Presidential Vote
Perc
ent c
hoos
ing
wro
ng p
hoto
Low interest
High interest
4%5%
0%
3% 3%4% 4%
6%
18%
7%
0
10
20
30
Strongly disapprove
Somewhat disapprove
Not sure
Somewhat approve
Strongly approve
Trump approval
Perc
ent c
hoos
ing
wro
ng p
hoto
Low interest
High interest
28
Figure A2: Percent making an incorrect match of the inauguration photograph to the president by 2016 vote choice, Trump approval, and political interest
Note: Figure shows percent choosing image A as belonging to Obama’s inauguration and image B as belonging to Trump’s with sampling weights employed. High interest are respondents who say they pay attention to politics “most of the time,” and low interest respondents are those who say they pay attention “some of the time,” “only now and then,” or “hardly at all.”
27%
20%
7%9%
39%43%
0
10
20
30
40
50
Non− voters
Clinton Voters
Trump Voters
2016 Presidential Vote
Perc
ent c
hoos
ing
wro
ng in
augu
ratio
n
Low interest
High interest
3%
9%
18%
4%
41%
32%
23%24%
43%44%
0
10
20
30
40
50
Strongly disapprove
Somewhat disapprove
Not sure
Somewhat approve
Strongly approve
Trump approval
Perc
ent c
hoos
ing
wro
ng in
augu
ratio
n
Low interest
High interest