mississippi’s business - ihl.state.ms.us · th e economy remains weak, but this report off ers...
TRANSCRIPT

Volume 69 - Number 11December 2011
ECONOMY AT A GLANCETh e Mississippi Index of Leading Indicators has now increased for two consecutive months. Th e growth relative to six-months prior remains negative, but less so than in previous months. Fueled by rising employement and longer manufacturing workweek length, the Mississippi Index of Coincident Indicators also strengthened in September and October. Th e State’s economy is showing signs of life again.
Th e National economy is improving as well. Th e ISM Index of Manufacturing rose signifi cantly in November. Ve-hicle sales are up and consumer confi dence has improved. Th ese measures remain low by historical standards, but at least are up from the malaise of summer. It now appears likely that the fourth quarter will be stronger than any other in 2011. However, growth for the year is still expected to be only 1.7 percent -- slow by historical standards. Incomes remain relatively fl at and consumers still face high debt levels, falling house prices and a poor labor market. Th e economy is improving, but growth remains mild and will likely slow in 2012.
Despite the better domestic economic news, the threat of recession remains a substantial 35 percent. Th is is down from the 40 percent off ered in previous months, but remains substantial. Th e risk continues to be with Europe. While a severe downturn in Europe appears to have been avoided for now, a mild recession is almost certain, and may already be underway. Th is will have a dampening eff ect on the U.S. economy in 2012, but is not expected to cause a U.S. recession. We expect to end 2012 with growth that is not signifi cantly diff erent from 2011.
Mississippi’s BusinessMonitoring Th e State’s Economy
A Publication of the University Research Center, Mississippi Institutions of Higher Learning
State Economist Darrin Webb • 3825 Ridgewood Road, Jackson, MS 29211 • [email protected] • www.mississippi.edu/urc/economics.html
80.085.090.095.0
100.0105.0110.0115.0120.0
10/1
0
11/1
0
12/1
0
1/11
2/11
3/11
4/11
5/11
6/11
7/11
8/11
9/11
10/1
1
Index of Leading Indicators
MS LI US LI
Th e Mississippi Coincident Index is constructed by the Federal Reserve Bank of Philadelphia and re-indexed to 2004. Th e Index is based on changes in nonfarm em-ployment, the unemployment rate, average manufacturing workweek length and wage and salary disbursements. Th e Mississippi Leading Index is constructed by the Mississippi University Research Center. Th e U.S. Indices are both from the Conference Board. All series are indexed to a base year of 2004.
IN THIS ISSUE:
Economy at a Glance ................................................................................................................................................ 1Index of Leading and Coincident Indicators for October 2011 .......................................................................... 2Mississippi Employment By Sector ........................................................................................................................ 8
100.0100.5101.0101.5102.0102.5103.0103.5104.0104.5
10/1
0
11/1
0
12/1
0
1/11
2/11
3/11
4/11
5/11
6/11
7/11
8/11
9/11
10/1
1
Index of Coincident Indicators
MS LI US LI

2 Mississippi’s Business December 2011
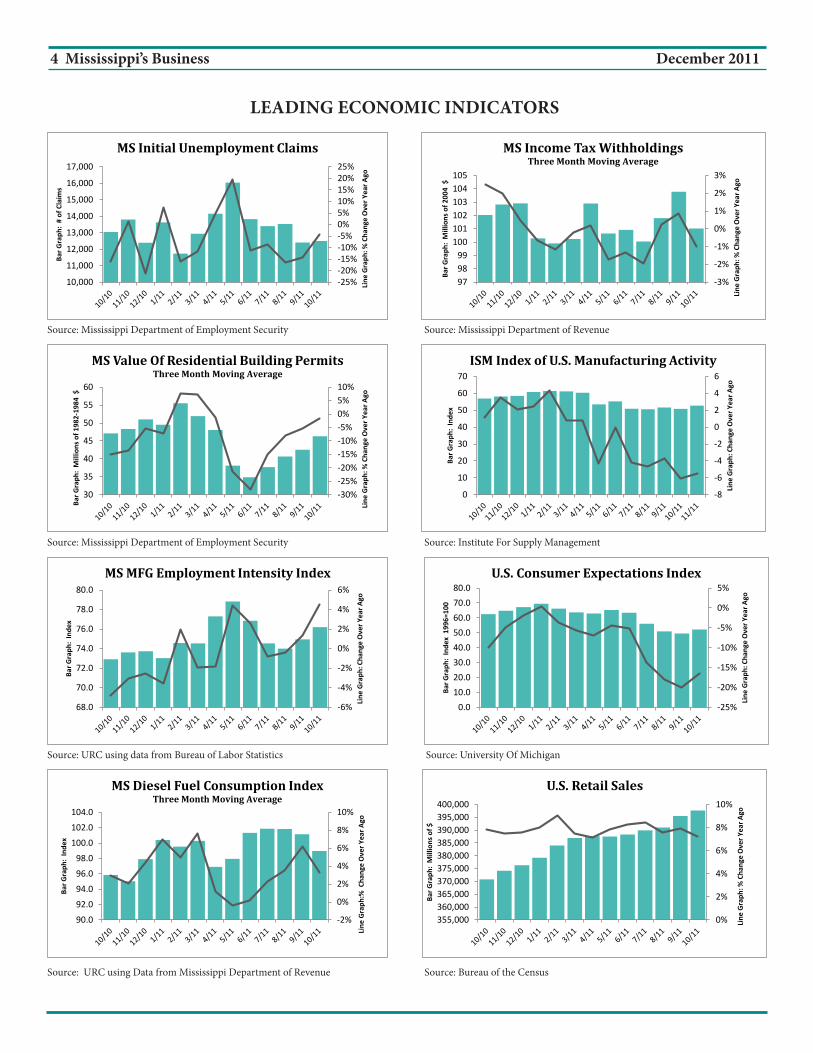
The Mississippi Index of Leading Economic Indi-cators rose for the second consecutive month in
October. Th e index of 94.2 was the highest since May 2011 and was up 0.9 percent above the revised Septem-ber level. Th e index was 3.0 percent below the level six months prior. While October was the fi ft h decline relative to six month prior, it was the smallest, meaning the series is improving. Th e economy is still at risk of falling back into recession, but the state has improved.
Th e October gain came on the strength of four compo-nents. Th e components will be discussed in order of the contribution to the monthly gain in October.
Th e U.S. Index of Consumer Expectations1 rose 5.4 percent to 52.2 in October. Th e gain follows four con-secutive months of decline. Th e series hit a low in August during the debate over raising the debt ceiling and the S&P bond rating downgrade. Th e series remains histori-cally low. Th e improvement comes amid modestly better economic data, lower fuel prices and higher stock prices.
a strong 8.8 percent in October relative to September. Despite the gains, the series remains below the April 2011 level. In fact the series remains at a low level historically.
Th e Institute for Supply Management Index of U.S. Manufacturing Activity rose and unexpected 3.7 percent to a level of 52.7 in November. Th is was the highest ISM Manufacturing Index since July 2011. Th e
LEADING AND COINCIDENT INDICATORS, OCTOBER 2011
-1%
0%
1%
2%
3%
4%
90.0
91.0
92.0
93.0
94.0
95.0
96.0
97.0
Line
Gra
ph: %
Cha
nge
Ove
r Ye
ar A
go
Bar
Gra
ph:
Inde
x
Mississippi Index of Leading Indicators
1. Three Month Moving Average
The economy is still at risk of falling back into recession, but the state has
improved.
Th e Mississippi Manufacturing Employment Intensity Index has risen for two consecutive months. Th e Oc-tober level was 1.7 percent above the September level. Th e series is based on the number of jobs and average hours worked in the State’s manufacturing sector. Both hours and employment have improved in the past two months. Th e workweek length was above 41 hours in fi ve of the past seven months. Employment has generally trended down for the past several years, but has grown incrementally for the past two months.
Th e value of Mississippi residential building permits1 has risen for four consecutive months. Th e series gained
signs. Th e economy remains weak, but this report off ers evidence of modest gains.
U.S. Retail Sales rose 0.5 percent in October. Th is was down from the September gain, but was still the second largest monthly gain since March. Th e strongest gain occurred in electronics and appliances.
Consumers have shown a willingness to spend in recent months. Early reports suggest strong sales for Black -Friday and Cyber-Monday shopping. Light vehicle sales for November exceeded 13 million units for the third month in a row and in fact reached the highest
index suggests the U.S. Manufactur-ing industry is on fi rmer ground than has been feared over the past few months. We had expected the economy to slow in the fourth quar-ter. Th is report suggests that may no longer be the case. Th e details within the report reveal higher new orders, new exports and produc-tion. All of these are encouraging

3 Mississippi’s Business December 2011
level since August 2009. But re-cent spending has been fueled by a declining savings rate and declin-ing gasoline prices, not economic growth. Th e consumer continues to face a weak labor market, high debt level, declining home prices and slow wage growth. Th is is not a recipe for sustainable sales growth. Consumers are facing pent-up de-mand, but these harsh economic realities will likely prohibit a stellar Christmas shopping season.
Mississippi’s initial unemploy-ment claims rose a modest 0.8 percent in October relative to Sep-tember. Th e State’s unemployment rate was unchanged in October.
Th e Mississippi Diesel Fuel Con-sumption Index1 fell 2.2 percent in October relative to September Th is marked the third and steepest de-cline in as many months. Th e series is based on gallons of over-the-road diesel fuel purchased in the state. A declining series suggests a slowing economy.
Inflation adjusted Mississippi income tax withholdings1 fell 2.6 percent in October relative to Sep-tember. Th e monthly fl uctuations are relatively mild. Th e series has shown very little signifi cant upward momentum since recovery began. This series serves as a proxy for income.
0.0%
0.5%
1.0%
1.5%
2.0%
2.5%
101.0
101.5
102.0
102.5
103.0
103.5
104.0
Line
Gra
ph: %
Cha
nge
Ove
r Ye
ar A
go
Bar
Gra
ph:
Inde
x
Mississippi Index of Coincident Indicators
National trends are discusssed on page 5,
Mississippi employment trends on pages 8 and 9.
The Mississippi Index of Coincident Indicators was 103.8 in October. With revised data the series is beginning to show some upward move-
ment. Th e October 0.4 percent gain was the strongest monthly gain since April 2010. Relative to six-months prior the series was up 1.9 per-cent in Octo-ber, the highest rate since Au-gust 2010. Th e series has been helped greatly by the gains in e m p l o y m e n t that have oc-
90.0%
95.3%
87.3%
91.4%
95.2%
98.3%
96.5%
91.8%
96.5%
91.2%
95.8%
100.0%
96.3%
80.0%
85.0%
90.0%
95.0%
100.0%
105.0%
AL AR FL GA KY LA MS NC OK SC TN TX US
Coincident Index: October 2011 as Percentage of Peak
curred in the past two months as well as the lengthening manufacturing workweek length.
A comparison of the October index to the recent peak appears below for the 12 southeastern states and the Nation. States that reach 100 percent of peak have fully recovered from the “Great Recession”. Mississippi was at 96.5 percent, as was Oklahoma. Texas and Louisiana are the only southeastern states further along in recovery. Mississippi’s better position is due to our having not fallen as much as other states during the recession.
Th e Map on page fi ve shows the relative performance of the fi ft y states. Th e October index is compared to the level three months prior. Red states are states in decline. Th ere were only eight states with an index below the level three months prior in October. Th ere were twice that many in September.
4 Mississippi’s Business December 2011
-25%-20%-15%-10%-5%0%5%10%15%20%25%
10,000
11,000
12,000
13,000
14,000
15,000
16,000
17,000
Line
Gra
ph: %
Cha
nge
Ove
r Yea
r Ago
Bar G
raph
: #
of C
laim
s
MS Initial Unemployment Claims
-3%
-2%
-1%
0%
1%
2%
3%
979899
100101102103104105
Line
Gra
ph: %
Cha
nge
Ove
r Yea
r Ago
Bar G
raph
: M
illio
ns o
f 200
4 $
MS Income Tax WithholdingsThree Month Moving Average
-30%-25%-20%-15%-10%-5%0%5%10%
30
35
40
45
50
55
60
Line
Gra
ph: %
Cha
nge
Ove
r Yea
r Ago
Bar G
raph
: M
illio
ns o
f 198
2-19
84 $
MS Value Of Residential Building PermitsThree Month Moving Average
-8
-6
-4
-2
0
2
4
6
0
10
20
30
40
50
60
70
Line
Gra
ph: C
hang
e O
ver Y
ear A
go
Bar G
raph
: In
dex
ISM Index of U.S. Manufacturing Activity
-6%
-4%
-2%
0%
2%
4%
6%
68.0
70.0
72.0
74.0
76.0
78.0
80.0
Line
Gra
ph: C
hang
e O
ver Y
ear A
go
Bar G
raph
: In
dex
MS MFG Employment Intensity Index
-25%
-20%
-15%
-10%
-5%
0%
5%
0.010.020.030.040.050.060.070.080.0
Line
Gra
ph: C
hang
e O
ver Y
ear A
go
Bar G
raph
: In
dex
199
6=10
0
U.S. Consumer Expectations Index
-2%
0%
2%
4%
6%
8%
10%
90.0
92.0
94.0
96.0
98.0
100.0
102.0
104.0
Line
Gra
ph:%
Cha
nge
Ove
r Yea
r Ago
Bar G
raph
: In
dex
MS Diesel Fuel Consumption IndexThree Month Moving Average
0%
2%
4%
6%
8%
10%
355,000360,000365,000370,000375,000380,000385,000390,000395,000400,000
Line
Gra
ph: %
Cha
nge
Ove
r Yea
r Ago
Bar G
raph
: M
illio
ns o
f $
U.S. Retail Sales
LEADING ECONOMIC INDICATORS
Source: Mississippi Department of Employment Security
Source: Mississippi Department of Employment Security
Source: URC using data from Bureau of Labor Statistics
Source: URC using Data from Mississippi Department of Revenue Source: Bureau of the Census
Source: University Of Michigan
Source: Institute For Supply Management
Source: Mississippi Department of Revenue

5 Mississippi’s Business December 2011
Less than -0.5%Between -0.5% to 0.0%No changeBetween 0.1% to 0.5%Greater than 0.5%US 0.6%
District of Columbia
-0.6%WI
-0.4%IN
-0.3%WY
-0.1%AK
-0.1%GA
-0.1%PA
-0.1%NC
0.0%DE
0.1%WV
0.1%NM
0.1%OH
0.2%MN
0.2%HI
0.2%VA0.2%
KS
0.2%IL
0.2%AR
0.3%NH
0.3%IA
0.3%OR
0.3%SD
0.4%NE
0.4%MO
0.4%MD
0.4%KY
0.5%NV
0.5%NY
0.6%MT
0.6%FL
0.6%RI
0.6%TX
0.7%ME
0.7%TN
0.7%MS
0.7%VT
0.8%MA
0.8%LA
0.8%OK 0.9%
SC
0.9%AZ
0.9%CT
0.9%CO
1.0%NJ
1.0%WA
1.0%UT
1.1%ND
1.1%CA
1.2%MI
1.3%ID
1.3%AL
National Trends Th e U.S. Index of Leading Indicators rose 0.9 percent in October relative to September. Th is was the sixth consecutive gain in the series. Th e Coincident Index gained 0.2 percent for the month. Th e Conference Board continues to expect modest growth in the com-ing months.
Th e domestic economy appears to be showing greater signs of growth even as international conditions worsen. As an example, the ISM Manufacturing Index shows a strengthening U.S. Manufacturing industry while similar indices for Europe and China show con-tractions. Th e general economic outlook has turned more positive at least for the near term. Revised data show real GDP grew 2.0 percent in the third quarter and the outlook for the fourth quarter has greatly im-proved. IHS Global Insight expects the fourth quarter to reach 2.6 percent. If this is realized, it will be the strongest quarter of 2011.
Th ree Month Growth in Th e Index of Coincident Economic Indicators, October 2011
Based on better economic data, IHS Global Insight has reduced their risk of recession to 35 percent. Th ey had been at 40 percent for several months. Th e risk stems from the troubles in Europe.
While conditions have not really improved in Europe, a domino collapse does not appear to be eminent. Th e Federal Reserve and the European Central Bank have moved to improve liquidity which off ers at least the appearance of addressing the problems. Th e markets have responded favorably. In truth, the underlying problems remain and this is the source of threat to the U.S. economy. Europe is likely already in at least a mild recession which will slow U.S. growth in 2012.
Regardless of the European recession, growth in the U.S. would likely remain subdued. Th e high debt levels (public and private) and the troubled housing sector will likely stunt growth for the next several years.

6 Mississippi’s Business December 2011
-30%
-25%
-20%
-15%
-10%
-5%
0%
5%
8090
100110120130140150160170
Line
Gra
ph: C
hang
e O
ver Y
ear A
go
Bar G
raph
: Th
ousa
nds
MS Continued Unemployment Claims
-10%-8%-6%-4%-2%0%2%4%6%
9.89.9
10.010.110.210.310.410.510.610.7
Line
Gra
ph: C
hang
e O
ver Y
ear A
go
Bar G
raph
: Ra
te
MS Unemployment Rate
-4%-2%0%2%4%6%8%10%12%
460.0470.0480.0490.0500.0510.0520.0530.0540.0550.0
Line
Gra
ph: C
hang
e O
ver Y
ear A
go
Bar G
raph
: 20
04 D
olla
rs
Real Average MFG Weekly Earnings in MS
-35%-30%-25%-20%-15%-10%-5%0%
0.0
50.0
100.0
150.0
200.0
250.0
Line
Gra
ph: C
hang
e O
ver Y
ear A
go
Bar G
raph
: M
illio
ns o
f Do
llars
MS Gaming Revenue
Coast River Growth of Total
1.2% 1.1%1.5% 1.6%
2.1%
2.7%
3.2%3.6% 3.6% 3.6% 3.8% 3.9%
3.5%
0.0%0.5%1.0%1.5%2.0%2.5%3.0%3.5%4.0%4.5%
Inflation: Price Growth over Prior Year
-10%
-5%
0%
5%
10%
15%
20%
48.0
50.0
52.0
54.0
56.0
58.0
60.0
62.0
Line
Gra
ph: C
hang
e O
ver Y
ear A
go
Bar G
raph
: Ra
te
ISM Nonmanufacturing Activity Index
-4%
-2%
0%
2%
4%
6%
8%
84.0
86.0
88.0
90.0
92.0
94.0
96.0
Line
Gra
ph: C
hang
e O
ver Y
ear A
go
Bar G
raph
: In
dex
Business Optimism Index
12.1 12.212.5
12.6
13.213.0 13.1
11.711.5
12.2 12.1
13.1 13.213.6
0%
5%
10%
15%
20%
25%
30%
10.010.511.011.512.012.513.013.514.0
Line
Gra
ph: C
hang
e O
ver Y
ear A
go
Bar G
raph
: M
illio
ns o
f Uni
ts
U.S. Light Vehicle Sales
MISCELLANEOUS ECONOMIC INDICATORS
Source: Mississippi Department of Employment Security; Seasonally Adjusted
Source: U.S. Bureau of Labor Statistics; Nonseasonally Adjusted
Source: U.S. Bureau of Labor Statistics
Source: National Federation of Independent Businesses Source: Bureau of Economic Anlaysis; Seasonally Adjusted Annual Rate
Source: Institute For Supply Management
Source: MS Department of Revenue; Nonseasonally Adjusted
Source: U.S. Bureau of Labor Statistics; Seasonally Adjusted
7 Mississippi’s Business December 2011
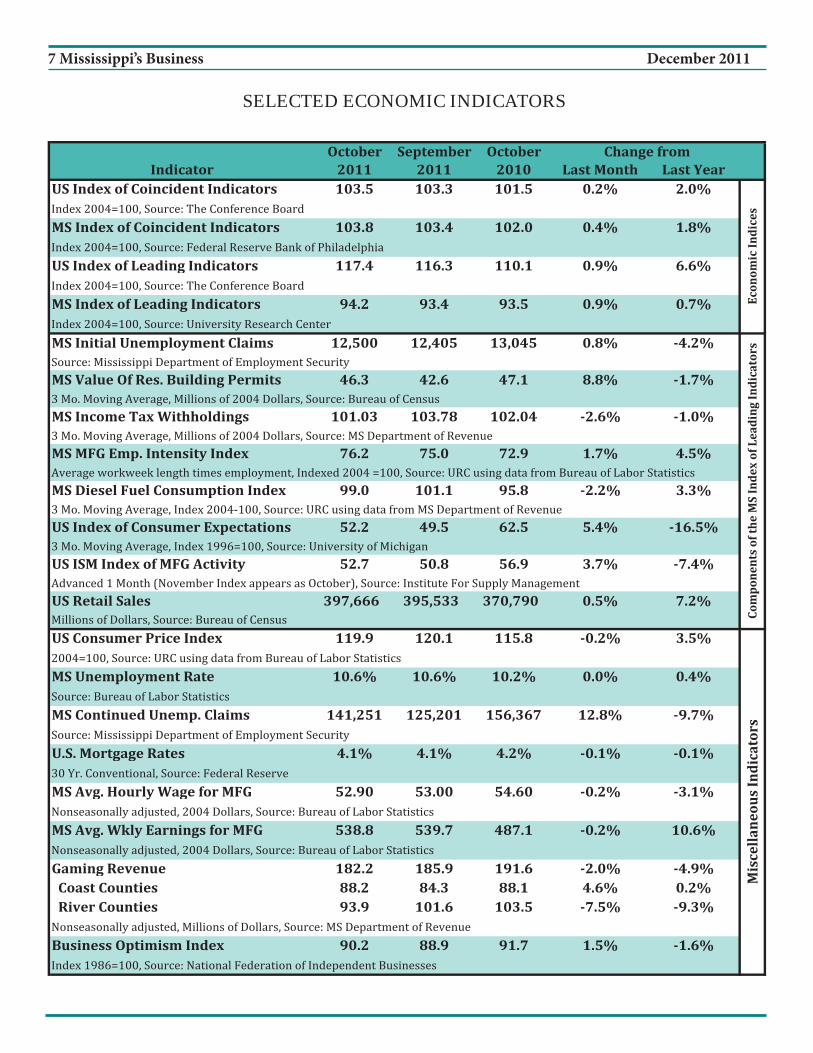
SELECTED ECONOMIC INDICATORS
October September OctoberIndicator 2011 2011 2010 Last Month Last Year
US Index of Coincident Indicators 103.5 103.3 101.5 0.2% 2.0%
MS Index of Coincident Indicators 103.8 103.4 102.0 0.4% 1.8%
US Index of Leading Indicators 117.4 116.3 110.1 0.9% 6.6%
MS Index of Leading Indicators 94.2 93.4 93.5 0.9% 0.7%
MS Initial Unemployment Claims 12,500 12,405 13,045 0.8% 4.2%
MS Value Of Res. Building Permits 46.3 42.6 47.1 8.8% 1.7%
MS Income TaxWithholdings 101.03 103.78 102.04 2.6% 1.0%
MSMFG Emp. Intensity Index 76.2 75.0 72.9 1.7% 4.5%
MS Diesel Fuel Consumption Index 99.0 101.1 95.8 2.2% 3.3%
US Index of Consumer Expectations 52.2 49.5 62.5 5.4% 16.5%
US ISM Index of MFG Activity 52.7 50.8 56.9 3.7% 7.4%
US Retail Sales 397,666 395,533 370,790 0.5% 7.2%
US Consumer Price Index 119.9 120.1 115.8 0.2% 3.5%
MS Unemployment Rate 10.6% 10.6% 10.2% 0.0% 0.4%
MS Continued Unemp. Claims 141,251 125,201 156,367 12.8% 9.7%
U.S. Mortgage Rates 4.1% 4.1% 4.2% 0.1% 0.1%
MS Avg. Hourly Wage for MFG 52.90 53.00 54.60 0.2% 3.1%
MS Avg. Wkly Earnings for MFG 538.8 539.7 487.1 0.2% 10.6%
Gaming Revenue 182.2 185.9 191.6 2.0% 4.9%Coast Counties 88.2 84.3 88.1 4.6% 0.2%River Counties 93.9 101.6 103.5 7.5% 9.3%
Business Optimism Index 90.2 88.9 91.7 1.5% 1.6%
Change from
Componentsofthe
MSIndexofLeadingIndicators
Econom
icIndices
MiscellaneousIndicators

8 Mississippi’s Business December 2011
MISSISSIPPI EMPLOYMENT BY SECTOR
Source: U.S. Bureau of Labor Statitiscs
October September October2011 2011 2010 Level % Level %
Total Nonfarm 1,102,400 1,097,900 1,091,800 4,500 0.4% 10,600 1.0%Mining and Logging 9,100 9,000 8,600 100 1.1% 500 5.8%Construction 47,300 46,800 48,800 500 1.1% (1,500) 3.1%Manufacturing 133,000 131,000 133,700 2,000 1.5% (700) 0.5%Trade, Transportation & Utlities 215,700 214,900 213,800 800 0.4% 1,900 0.9%Retail Trade 133,600 133,800 131,900 (200) 0.1% 1,700 1.3%
Information 12,308 12,286 12,622 21 0.2% (314) 2.5%Financial Activities 45,369 45,420 45,158 (51) 0.1% 211 0.5%Services 391,900 390,800 381,300 1,100 0.3% 10,600 2.8%Professional and Business Services 100,900 100,200 92,800 700 0.7% 8,100 8.7%Education and Health Services 139,100 138,800 133,900 300 0.2% 5,200 3.9%Leisure and Hospitality 117,700 117,700 119,600 0.0% (1,900) 1.6%Other Services 34,200 34,100 35,000 100 0.3% (800) 2.3%
Government 247,700 247,900 247,800 (200) 0.1% (100) 0.0%
Change fromPrior Month
Change fromPrior Year
Sector
Mississippi Employment TrendsMississippi nonfarm employment rose 4,500 jobs or 0.4 percent in October relative to September. Th e gain was on top of a strong increase in September. Th e October employment in Mississippi was the highest since March 2009. In September the monthly gain was largely due to government jobs. In October, the gain was due largely to manufacturing. Th e opening of the Toyota plant in Blue Springs likely drove this increase.
annual declines have occurred in construction (See Chart above).
On average, 2011 employment is up an average of 0.6 percent. Th e fi gure below provides historical annual av-erage growth rates for Mississippi and U.S. employment. Th e annual gains have been modest over the past decade compared to longer term history. Th e 2011 gain is the strongest since 2007, but falls short of the U.S. average.
Other sectors with substantial gains in October included profes-sional and business services, trade transportation and utilities, and construction. The only sectors declining were retail trade and government. Both saw a modest decline in October.
Relative to the year ago, October employment was up 10,500 jobs or 1.0 percent. Th e strongest annual gains have occurred in the profes-sional and business services sector and retail trade. The strongest
-6.0%
-4.0%
-2.0%
0.0%
2.0%
4.0%
6.0%
8.0%
10.0%
1970
1971
1972
1973
1974
1975
1976
1977
1978
1979
1980
1981
1982
1983
1984
1985
1986
1987
1988
1989
1990
1991
1992
1993
1994
1995
1996
1997
1998
1999
2000
2001
2002
2003
2004
2005
2006
2007
2008
2009
2010
2011
*
Annual Average Growth in Nonfarm Employment
MS US
* The 2011 Growth rate is for Jan-Oct period over the prior year.

9 Mississippi’s Business December 2011
-6.0%
-5.0%
-4.0%
-3.0%
-2.0%
-1.0%
0.0%
1.0%
2.0%
1,070
1,075
1,080
1,085
1,090
1,095
1,100
1,105
10
/09
11
/09
12
/09
1/1
02
/10
3/1
04
/10
5/1
06
/10
7/1
08
/10
9/1
01
0/1
01
1/1
01
2/1
01
/11
2/1
13
/11
4/1
15
/11
6/1
17
/11
8/1
19
/11
10
/11
Th
ou
san
ds
Nonfarm Employment
-12.0%
-10.0%
-8.0%
-6.0%
-4.0%
-2.0%
0.0%
130
131
132
133
134
135
136
137
138
10
/09
11
/09
12
/09
1/1
02
/10
3/1
04
/10
5/1
06
/10
7/1
08
/10
9/1
01
0/1
01
1/1
01
2/1
01
/11
2/1
13
/11
4/1
15
/11
6/1
17
/11
8/1
19
/11
10
/11
Th
ou
san
ds
Manufacturing
-5.0%
-4.0%
-3.0%
-2.0%
-1.0%
0.0%
1.0%
2.0%
44
44
44
44
45
45
45
45
45
46
10
/09
11
/09
12
/09
1/1
02
/10
3/1
04
/10
5/1
06
/10
7/1
08
/10
9/1
01
0/1
01
1/1
01
2/1
01
/11
2/1
13
/11
4/1
15
/11
6/1
17
/11
8/1
19
/11
10
/11
Th
ou
san
ds
Financial Activities
-6.0%-5.0%-4.0%-3.0%-2.0%-1.0%0.0%1.0%2.0%3.0%4.0%
115
116
117
118
119
120
121
122
10
/09
11
/09
12
/09
1/1
02
/10
3/1
04
/10
5/1
06
/10
7/1
08
/10
9/1
01
0/1
01
1/1
01
2/1
01
/11
2/1
13
/11
4/1
15
/11
6/1
17
/11
8/1
19
/11
10
/11
Th
ou
san
ds
Leisure and Hospitality Services
-25.0%
-20.0%
-15.0%
-10.0%
-5.0%
0.0%
5.0%
10.0%
15.0%
6.0
6.5
7.0
7.5
8.0
8.5
9.0
9.5
10
/09
11
/09
12
/09
1/1
02
/10
3/1
04
/10
5/1
06
/10
7/1
08
/10
9/1
01
0/1
01
1/1
01
2/1
01
/11
2/1
13
/11
4/1
15
/11
6/1
17
/11
8/1
19
/11
10
/11
Th
ou
san
ds
Natural Resources
-5.0%
-4.0%
-3.0%
-2.0%
-1.0%
0.0%
1.0%
2.0%
209
210
211
212
213
214
215
216
10
/09
11
/09
12
/09
1/1
02
/10
3/1
04
/10
5/1
06
/10
7/1
08
/10
9/1
01
0/1
01
1/1
01
2/1
01
/11
2/1
13
/11
4/1
15
/11
6/1
17
/11
8/1
19
/11
10
/11
Th
ou
san
ds
Trade, Transportation and Utilities
-10.0%
-5.0%
0.0%
5.0%
10.0%
15.0%
75
80
85
90
95
100
105
10
/09
11
/09
12
/09
1/1
02
/10
3/1
04
/10
5/1
06
/10
7/1
08
/10
9/1
01
0/1
01
1/1
01
2/1
01
/11
2/1
13
/11
4/1
15
/11
6/1
17
/11
8/1
19
/11
10
/11
Th
ou
san
ds
Professional and Business Services
-7.0%
-6.0%
-5.0%
-4.0%
-3.0%
-2.0%
-1.0%
0.0%
1.0%
2.0%
34
34
34
34
34
35
35
35
35
10
/09
11
/09
12
/09
1/1
02
/10
3/1
04
/10
5/1
06
/10
7/1
08
/10
9/1
01
0/1
01
1/1
01
2/1
01
/11
2/1
13
/11
4/1
15
/11
6/1
17
/11
8/1
19
/11
10
/11
Th
ou
san
ds
Other Services
-20.0%
-15.0%
-10.0%
-5.0%
0.0%
5.0%
10.0%
30
35
40
45
50
55
10
/09
11
/09
12
/09
1/1
02
/10
3/1
04
/10
5/1
06
/10
7/1
08
/10
9/1
01
0/1
01
1/1
01
2/1
01
/11
2/1
13
/11
4/1
15
/11
6/1
17
/11
8/1
19
/11
10
/11
Th
ou
san
ds
Construction
-10.0%
-8.0%
-6.0%
-4.0%
-2.0%
0.0%
2.0%
4.0%
11.811.912.012.112.212.312.412.512.612.712.8
10
/09
11
/09
12
/09
1/1
02
/10
3/1
04
/10
5/1
06
/10
7/1
08
/10
9/1
01
0/1
01
1/1
01
2/1
01
/11
2/1
13
/11
4/1
15
/11
6/1
17
/11
8/1
19
/11
10
/11
Th
ou
san
ds
Information
0.0%
1.0%
2.0%
3.0%
4.0%
5.0%
6.0%
126
128
130
132
134
136
138
140
10
/09
11
/09
12
/09
1/1
02
/10
3/1
04
/10
5/1
06
/10
7/1
08
/10
9/1
01
0/1
01
1/1
01
2/1
01
/11
2/1
13
/11
4/1
15
/11
6/1
17
/11
8/1
19
/11
10
/11
Th
ou
san
ds
Education and Health Services
-3.5%-3.0%-2.5%-2.0%-1.5%-1.0%-0.5%0.0%0.5%1.0%1.5%
238
240
242
244
246
248
250
252
254
10
/09
11
/09
12
/09
1/1
02
/10
3/1
04
/10
5/1
06
/10
7/1
08
/10
9/1
01
0/1
01
1/1
01
2/1
01
/11
2/1
13
/11
4/1
15
/11
6/1
17
/11
8/1
19
/11
10
/11
Th
ou
san
ds
Government
MISSISSIPPI EMPLOYMENT TRENDS
Left Axis: Bar Graphs - Employment Levels. Right Axis: Line graphs - Annual Growth. Source: U.S. Bureau of Labor Statistics.