missouri fbma 2008 analysis and comparisons. 2008 fbma record summary 161 farms submitted analysis...
Post on 19-Dec-2015
217 views
TRANSCRIPT
Missouri FBMA2008 Analysis and
Comparisons
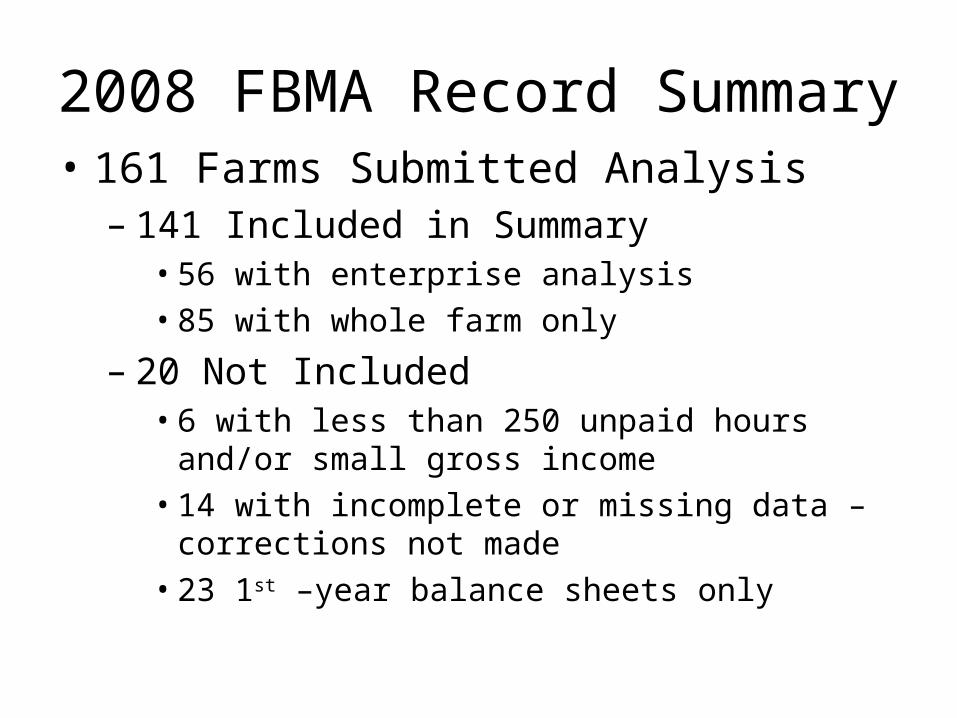
2008 FBMA Record Summary• 161 Farms Submitted Analysis
– 141 Included in Summary• 56 with enterprise analysis• 85 with whole farm only
– 20 Not Included• 6 with less than 250 unpaid hours and/or small
gross income• 14 with incomplete or missing data – corrections
not made• 23 1st –year balance sheets only

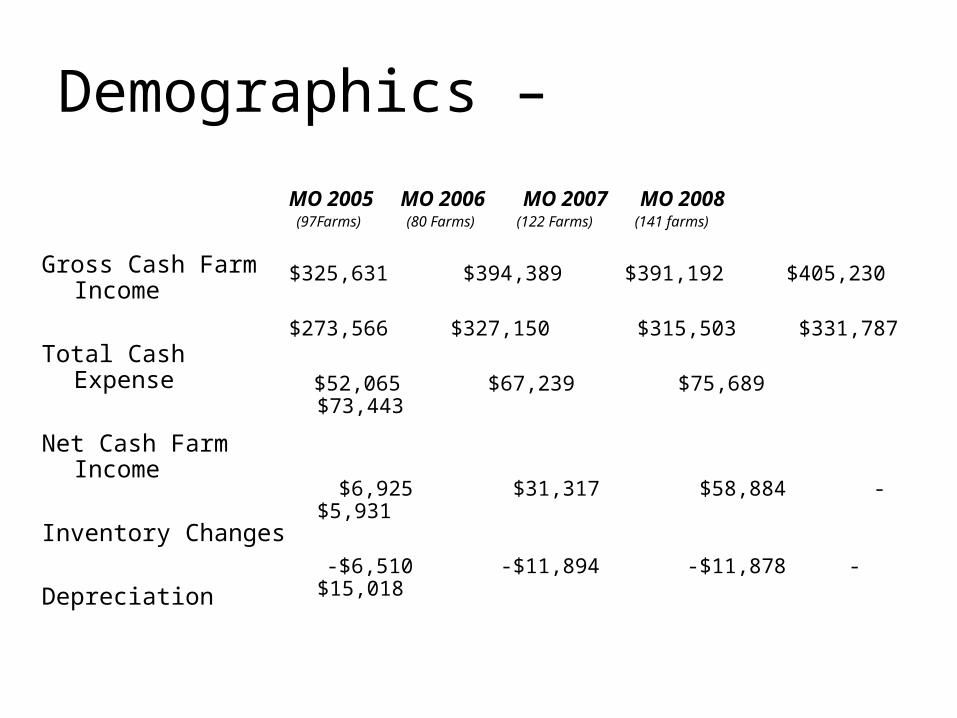
Demographics –
Gross Cash Farm Income
Total Cash Expense
Net Cash Farm Income
Inventory Changes
Depreciation
MO 2005 MO 2006 MO 2007 MO 2008 (97Farms) (80 Farms) (122 Farms) (141 farms)
$325,631 $394,389 $391,192 $405,230
$273,566 $327,150 $315,503 $331,787
$52,065 $67,239 $75,689 $73,443
$6,925 $31,317 $58,884 -$5,931
-$6,510 -$11,894 -$11,878 -$15,018
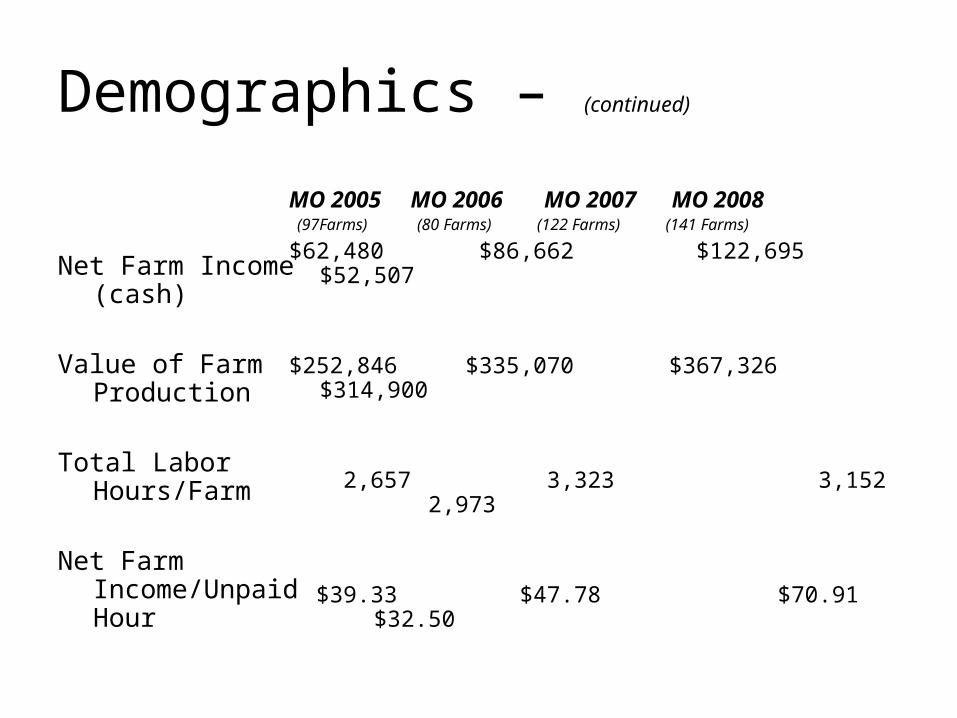
Demographics – (continued)
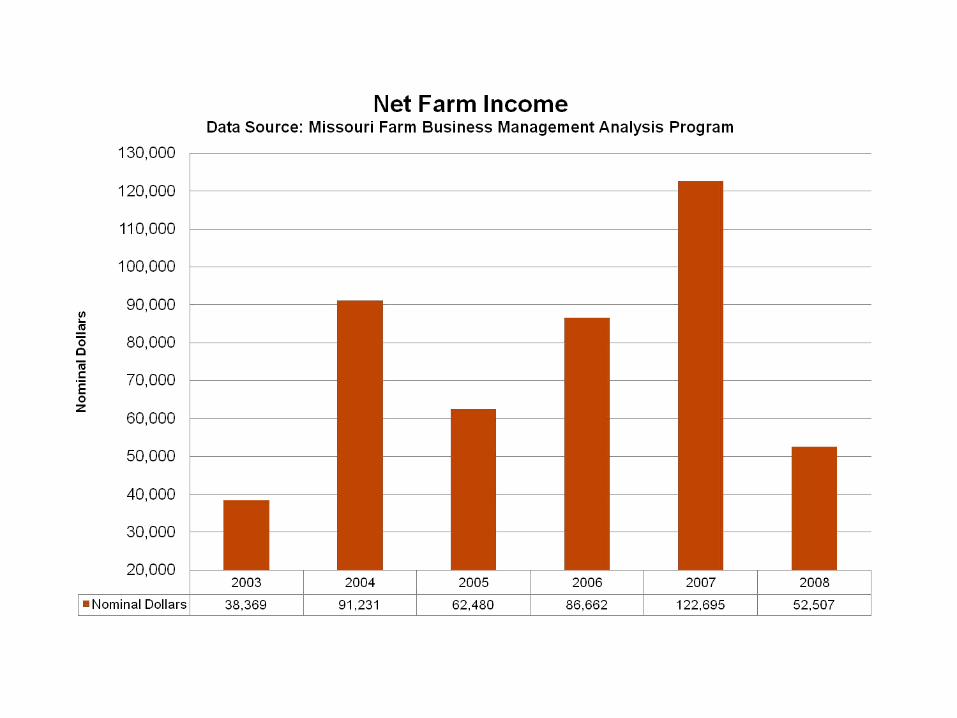
Net Farm Income (cash)
Value of Farm Production
Total Labor Hours/Farm
Net Farm Income/Unpaid Hour
MO 2005 MO 2006 MO 2007 MO 2008 (97Farms) (80 Farms) (122 Farms) (141 Farms)
$62,480 $86,662 $122,695 $52,507
$252,846 $335,070 $367,326 $314,900
2,657 3,323 3,152 2,973
$39.33 $47.78 $70.91 $32.50
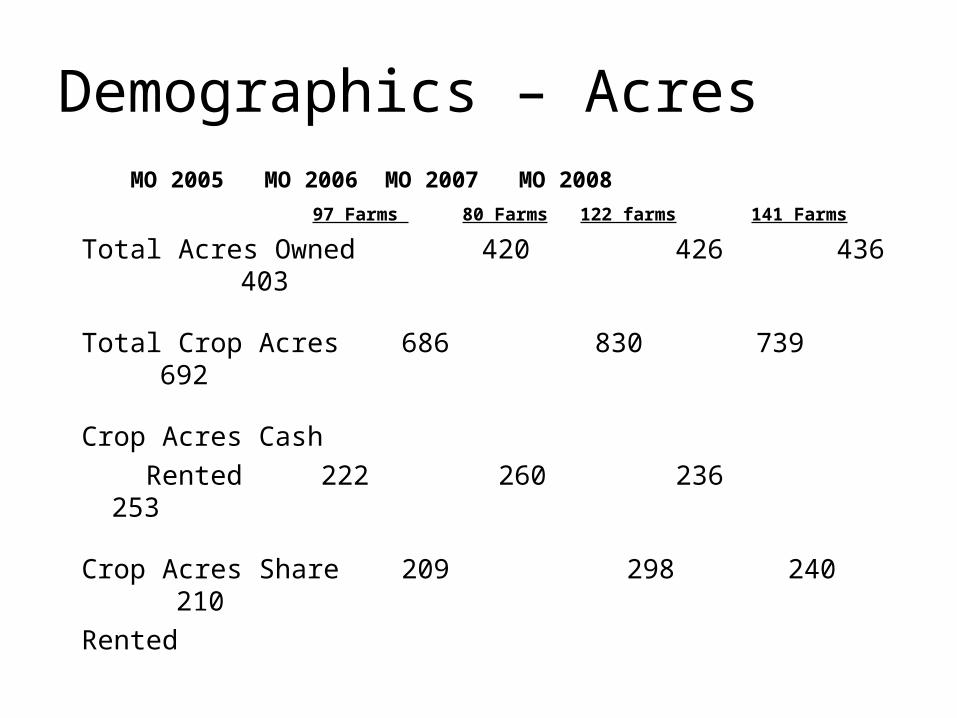
Demographics – Acres MO 2005 MO 2006 MO 2007 MO
2008
97 Farms 80 Farms 122 farms 141 Farms
Total Acres Owned 420 426 436 403
Total Crop Acres 686 830 739 692
Crop Acres Cash
Rented 222 260 236 253
Crop Acres Share 209 298 240 210
Rented

Demographics – Operators
MO 2005 MO 2006 MO 2007 MO 2007
97 Farms 80 Farms 122 farms 141 Farms
Average Age of 47.6 47.4 46.3 46.4
Operator
Average Number 24.3 25.3 23.6 23.2
of Years Farming

Demographics – Crop YieldsMO Ag. Statistical
ServiceMO FBMA Farms
2006/Avg 2007/Avg 2008/Avg 2006/Avg 2007/Avg 2008/Avg
Corn (bu.) 138 142 144 128 137 131
Soybeans (bu.) 38 37 38 40 40 34
Winter Wheat (bu.)
54 43 48 47 48 52
Grain Sorghum (bu.)
85 96 97 79 89 81
Hay, (T) Mixed2.3 2.3 2.6

Current Ratio
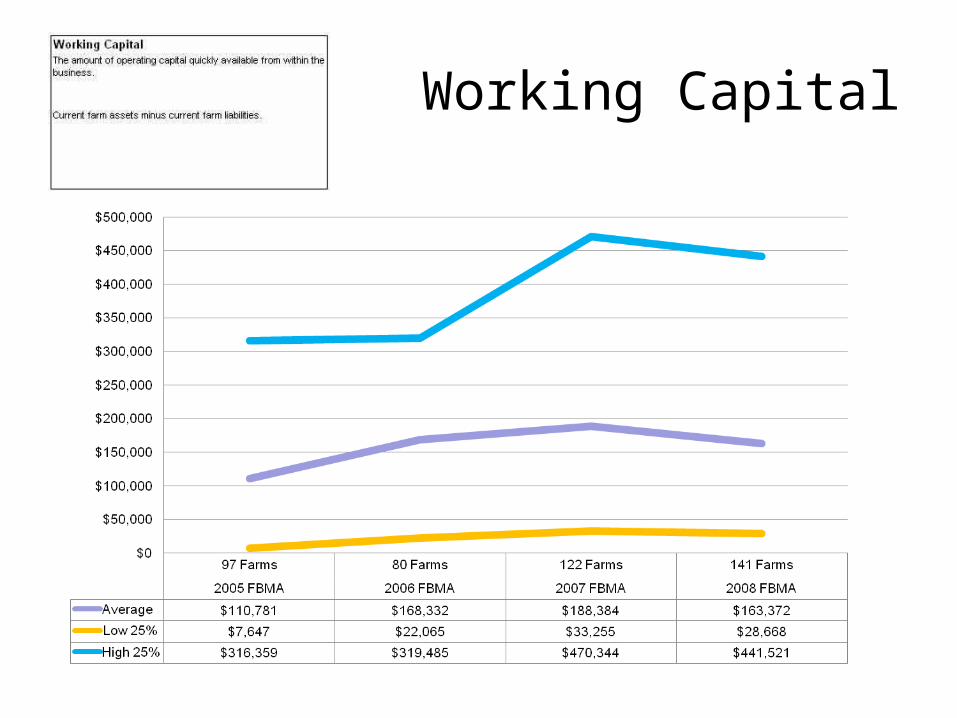
Working Capital

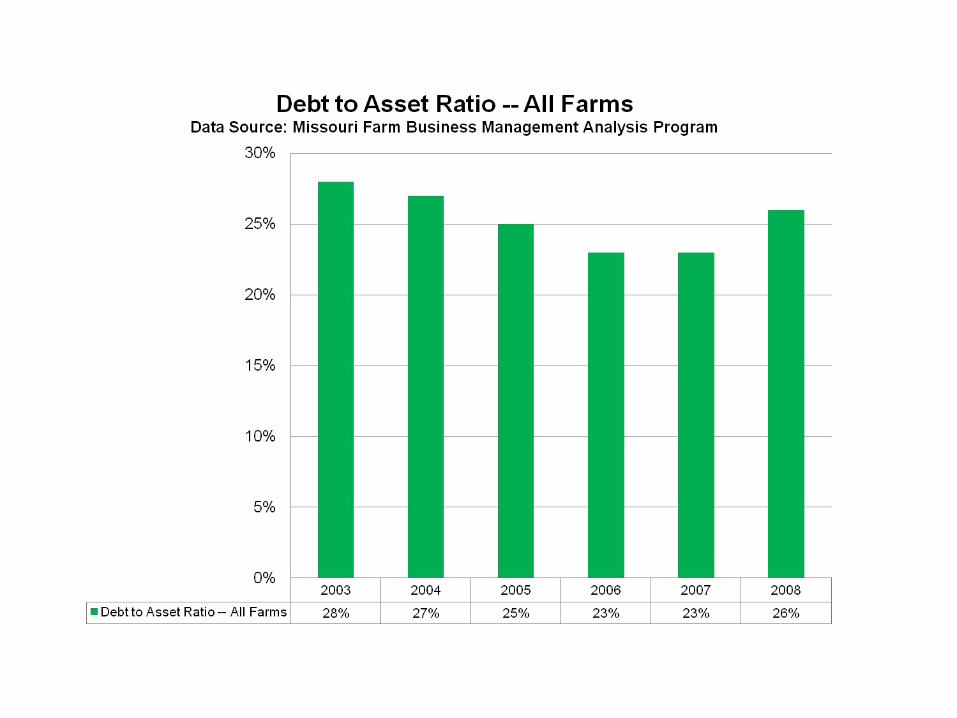
Farm Debt to Asset Ratio(MKT)
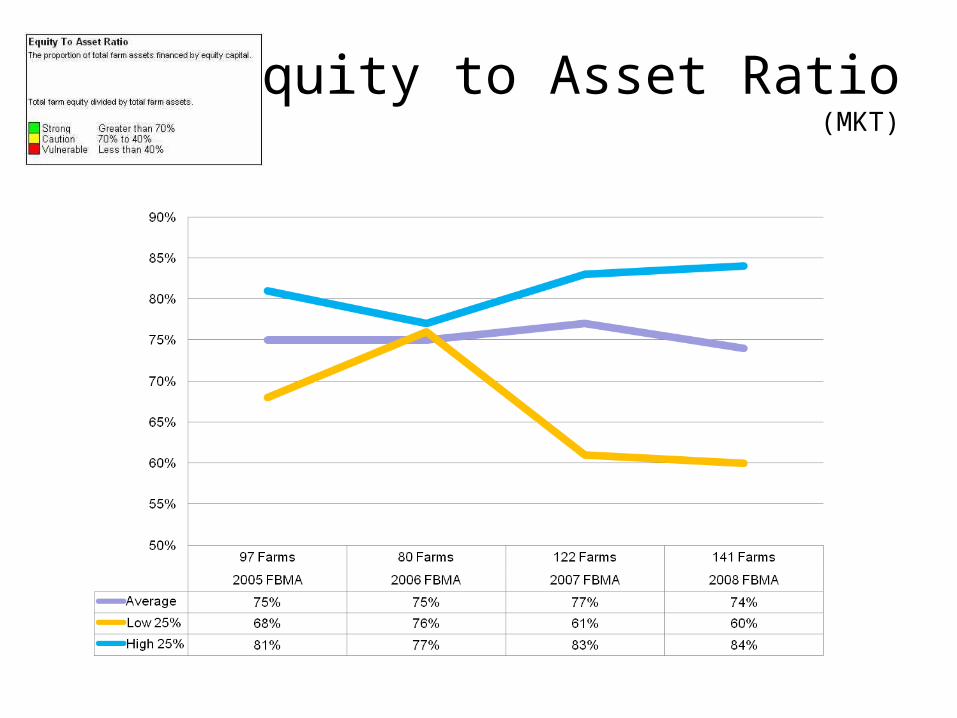
Farm Equity to Asset Ratio(MKT)

Farm Debt to Equity Ratio(MKT)

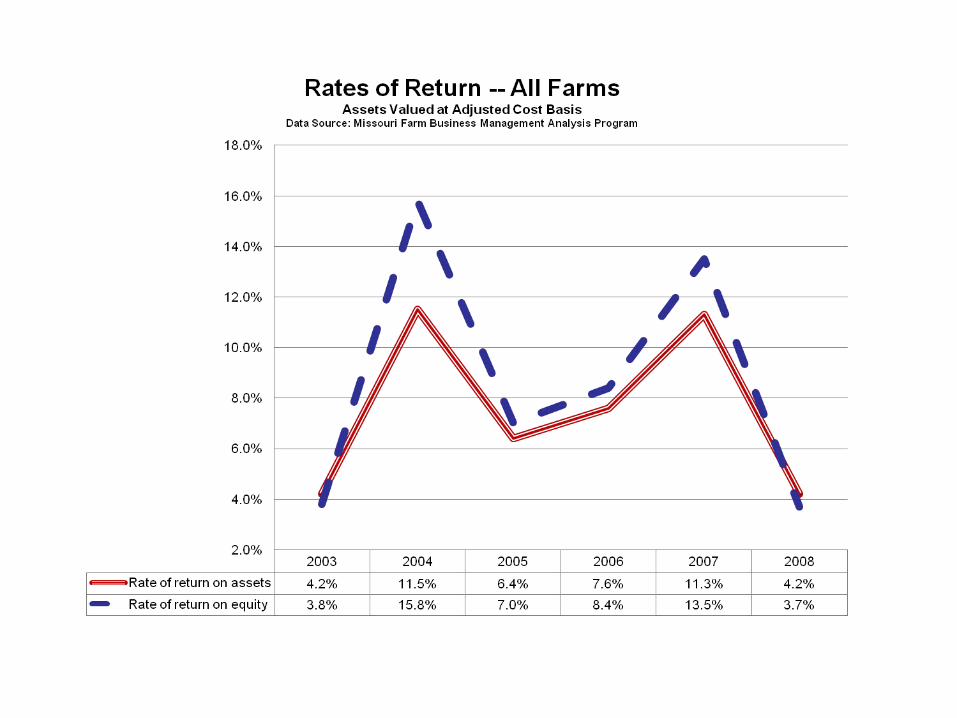
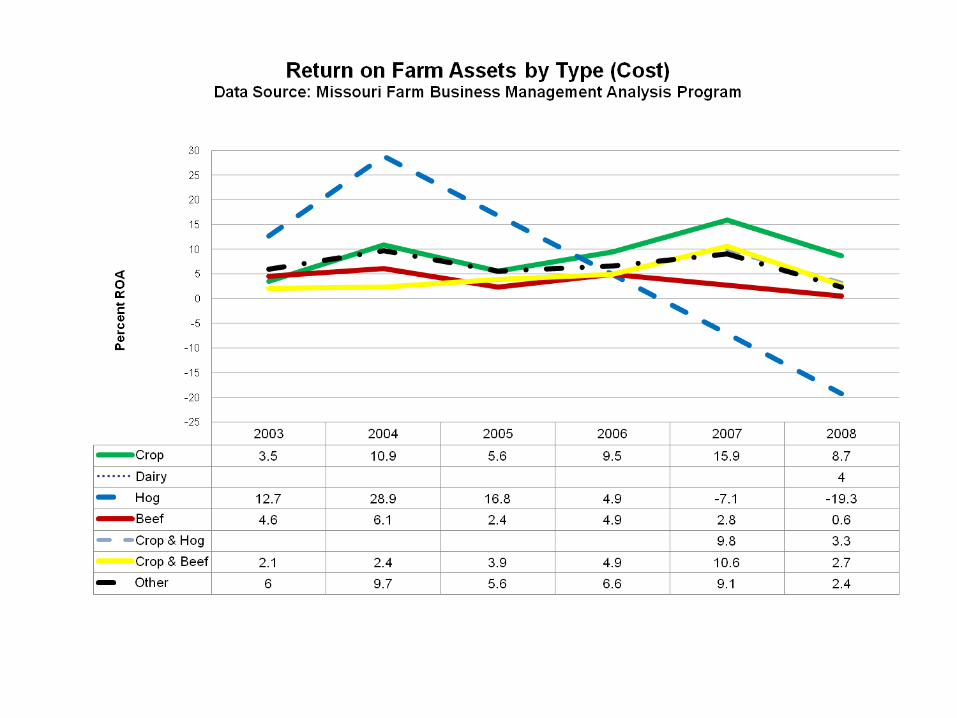
Rate of Return on Farm Assets(COST)
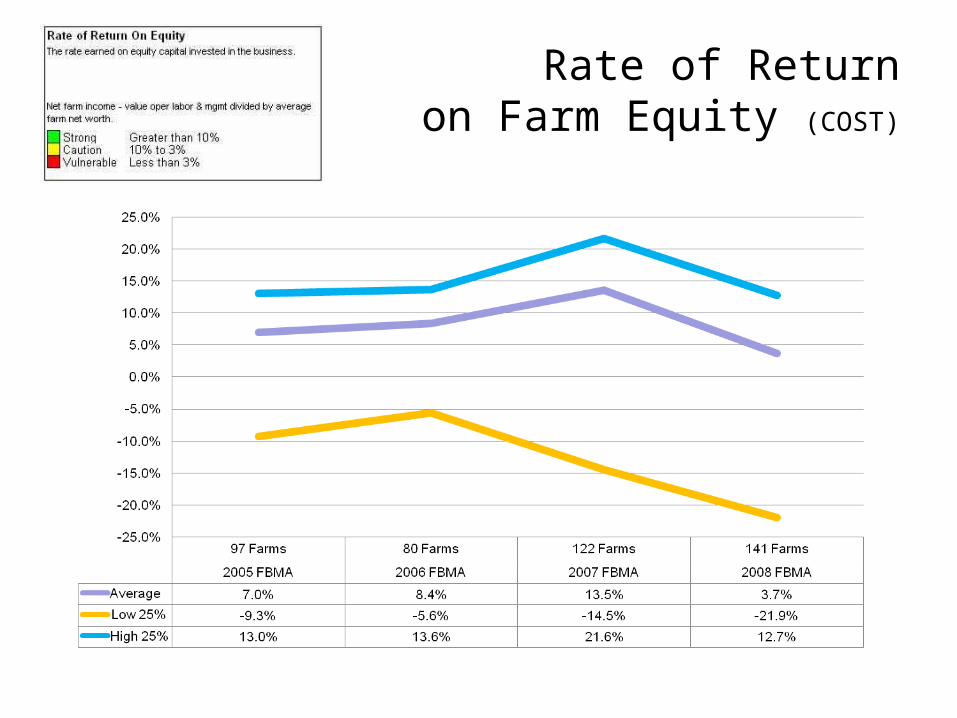
Rate of Returnon Farm Equity (COST)
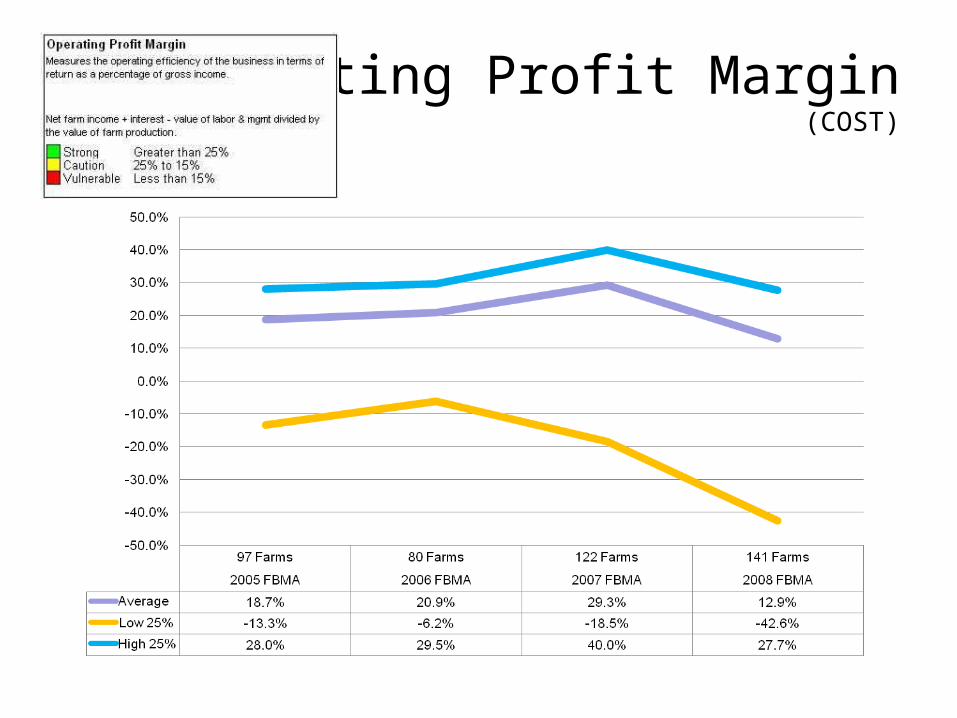
Operating Profit Margin(COST)
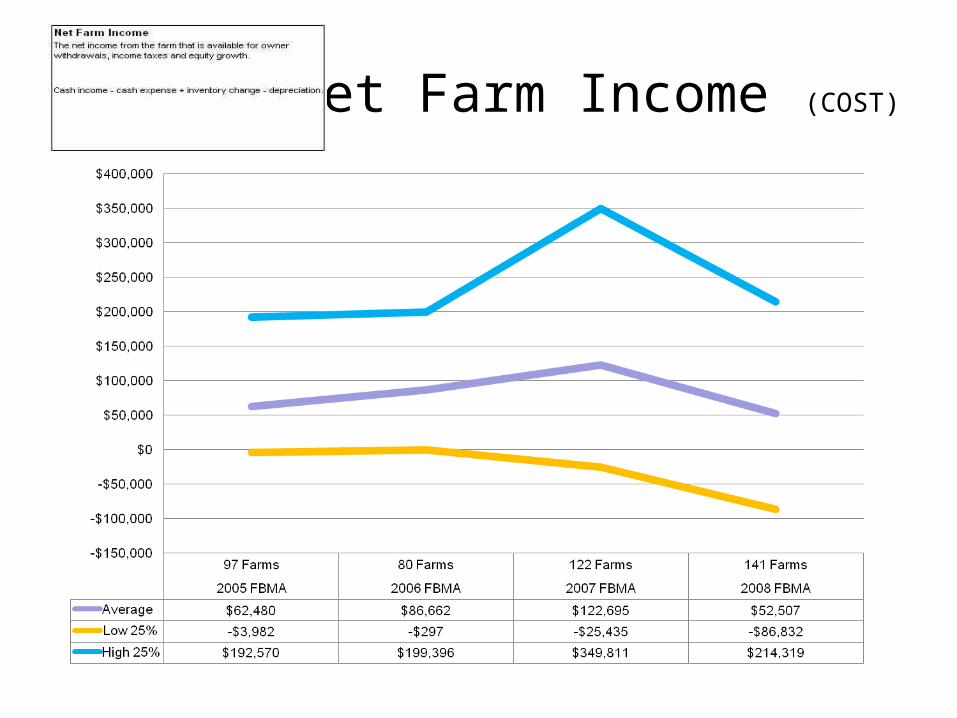
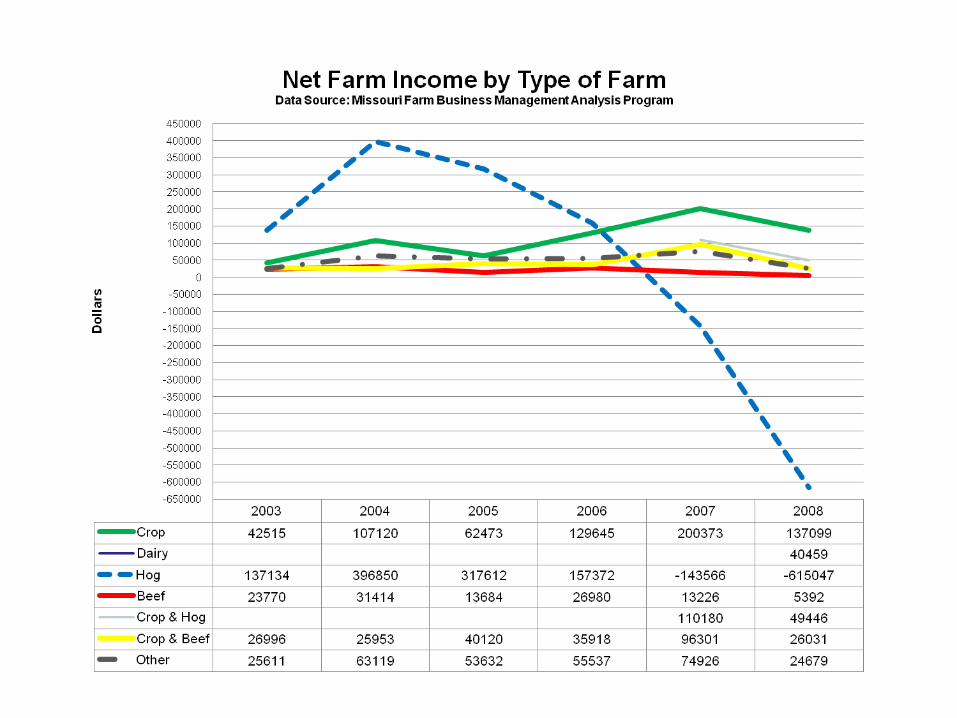
Net Farm Income (COST)

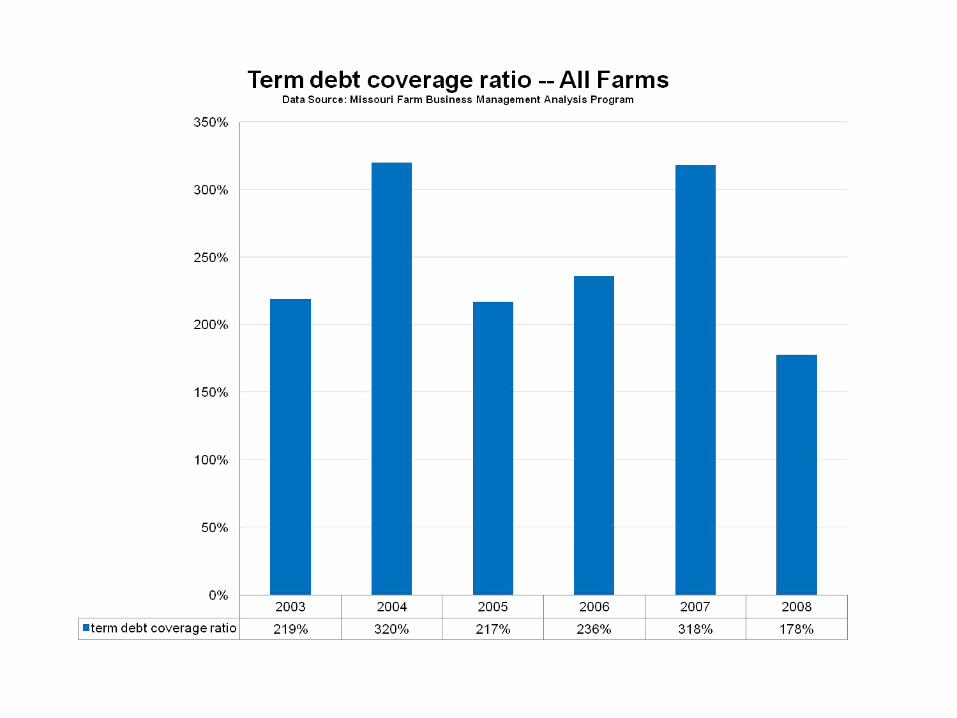
Term Debt Coverage Ratio
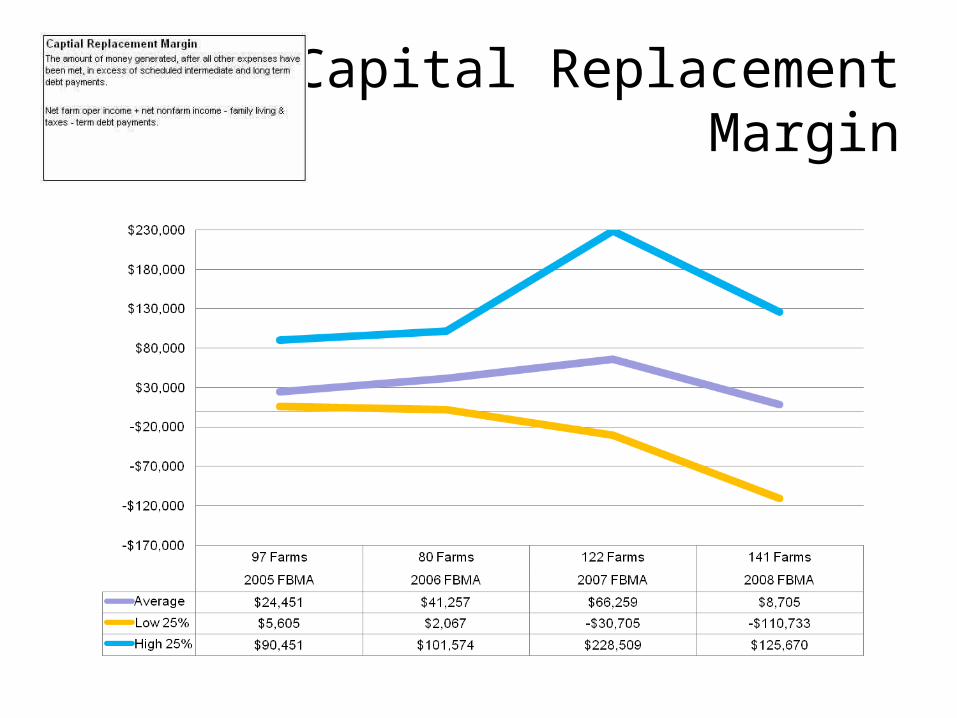
Capital ReplacementMargin
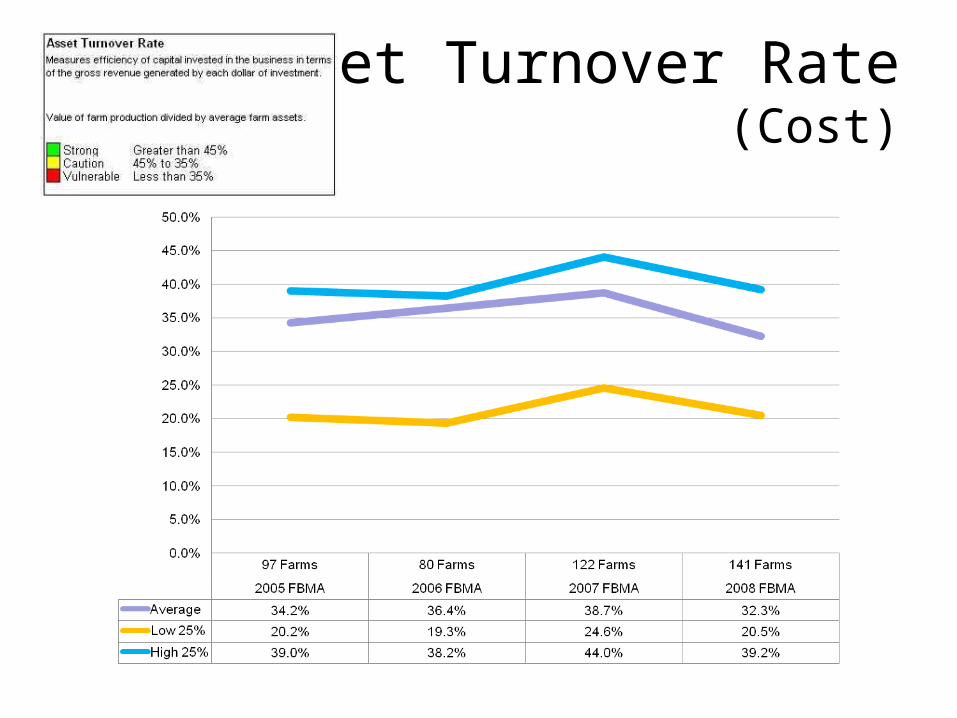
Asset Turnover Rate(Cost)

Operating Expense Ratio

Depreciation ExpenseRatio
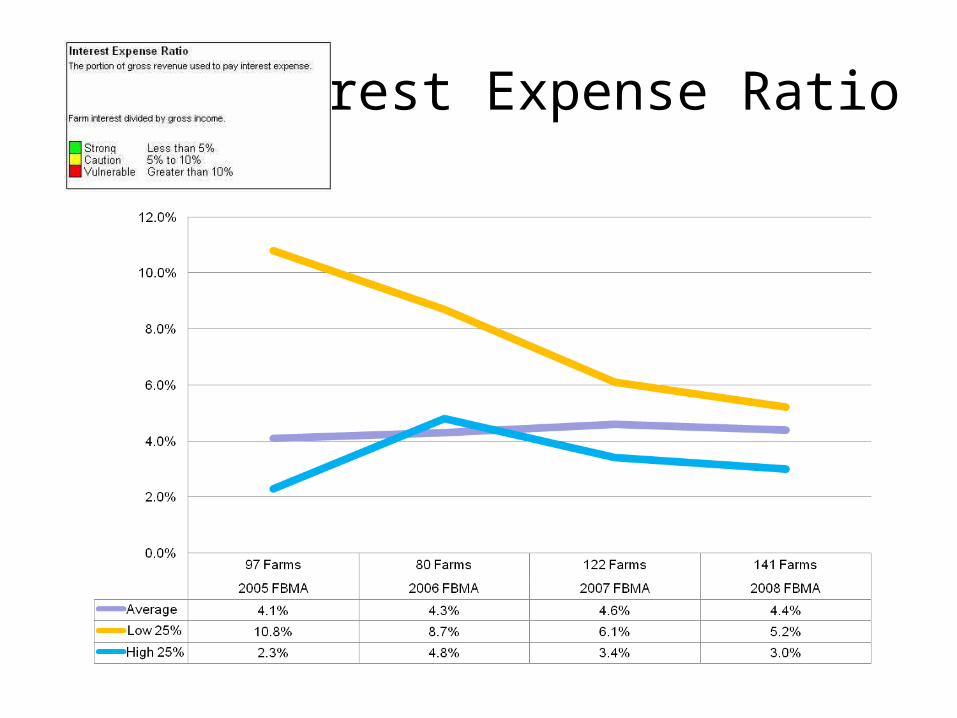
Interest Expense Ratio

Net Farm Income Ratio
What is the Economic Impact of an Average Farm in a Local Community?
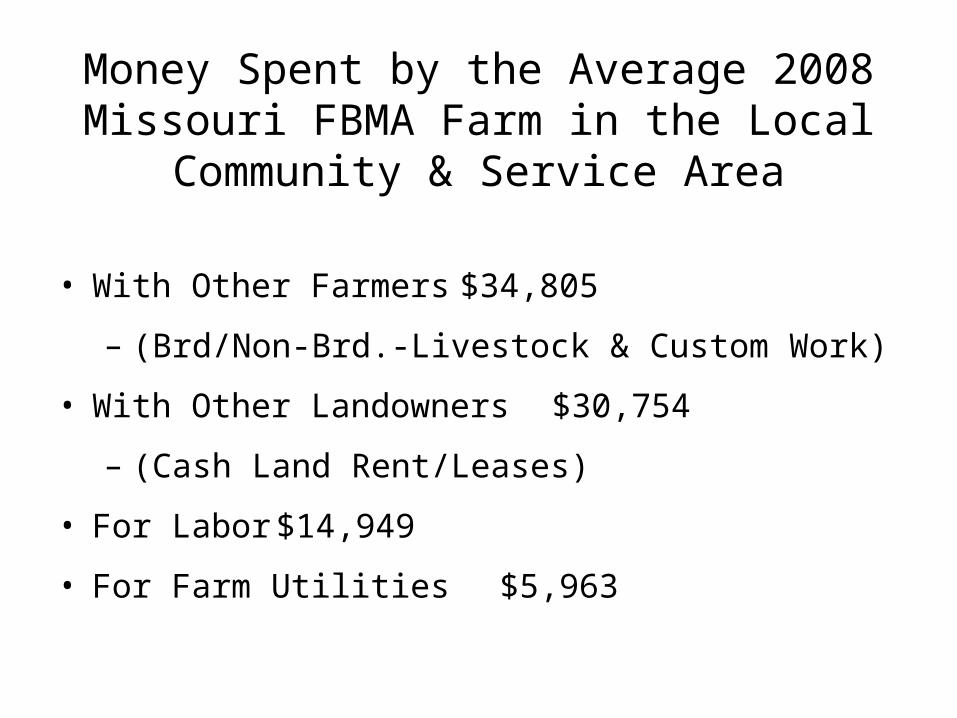
Money Spent by the Average 2008 Missouri FBMA Farm in the Local Community &
Service Area
• With Other Farmers $34,805
– (Brd/Non-Brd.-Livestock & Custom Work)
• With Other Landowners $30,754
– (Cash Land Rent/Leases)
• For Labor $14,949
• For Farm Utilities $5,963
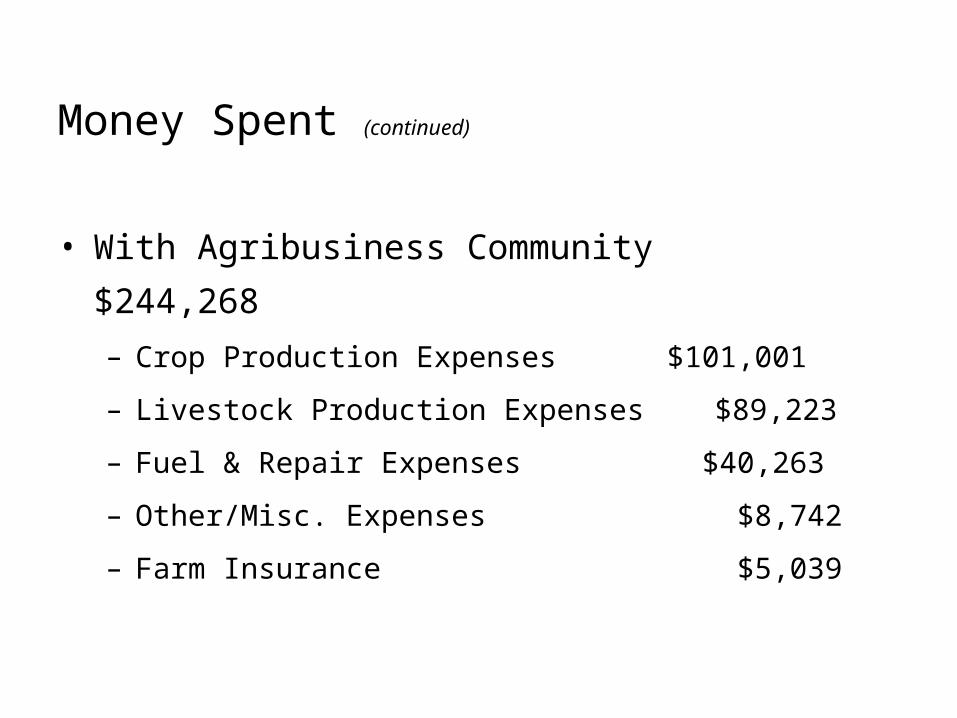
Money Spent (continued)
• With Agribusiness Community $244,268
– Crop Production Expenses $101,001
– Livestock Production Expenses $89,223
– Fuel & Repair Expenses $40,263
– Other/Misc. Expenses $8,742
– Farm Insurance $5,039
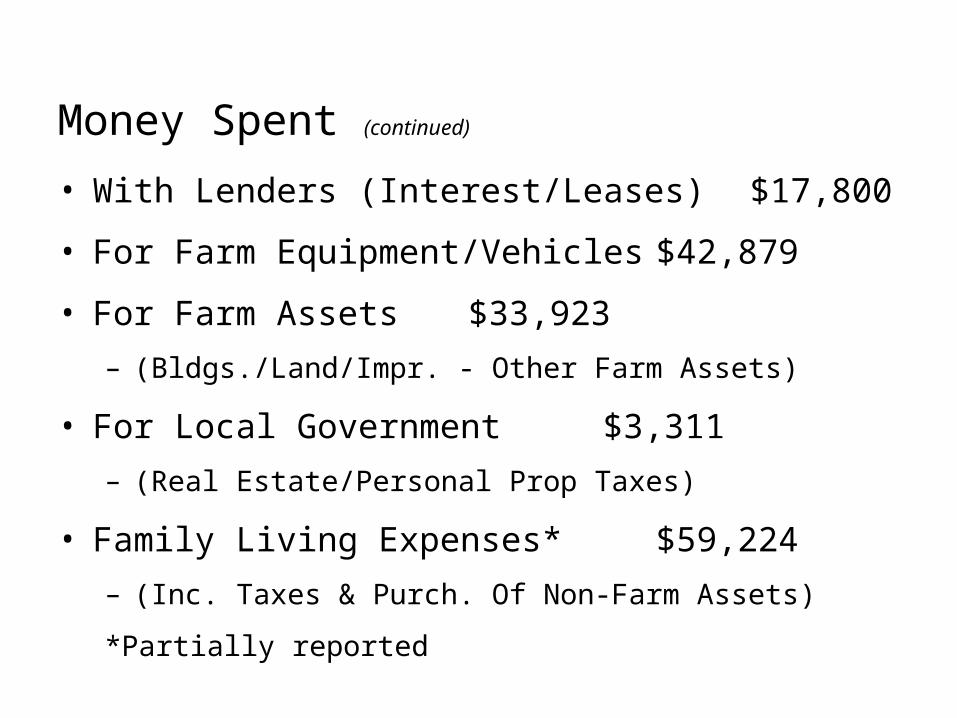
Money Spent (continued)
• With Lenders (Interest/Leases) $17,800
• For Farm Equipment/Vehicles $42,879
• For Farm Assets $33,923
– (Bldgs./Land/Impr. - Other Farm Assets)
• For Local Government $3,311
– (Real Estate/Personal Prop Taxes)
• Family Living Expenses* $59,224
– (Inc. Taxes & Purch. Of Non-Farm Assets)
*Partially reported

Total Annual Spending Within the Community or Service Area by the Average Missouri FBMA Farm…........................ $487,876
FBMA & FINBIN Comparisons 2005-2008