missouri tif report - university of minnesota
TRANSCRIPT
University of Minnesota Law SchoolScholarship Repository
Studies Institute on Metropolitan Opportunity
2003
Missouri TIF ReportThomas LuceUniversity of Minnesota Law School
Follow this and additional works at: http://scholarship.law.umn.edu/imo_studies
Part of the Law Commons
This Article is brought to you for free and open access by the University of Minnesota Law School. It has been accepted for inclusion in Studiescollection by an authorized administrator of the Scholarship Repository. For more information, please contact [email protected].
Recommended CitationThomas Luce, Missouri TIF Report (2003).
______________________________________________________________________________
RECLAIMING THE INTENT:TAX INCREMENT FINANCE IN THE KANSAS CITY
AND ST. LOUIS METROPOLITAN AREAS
Thomas LuceAmeregis, Inc.
A Discussion Paper Prepared forThe Brookings Institution Center on Urban and Metropolitan Policy
April 2003______________________________________________________________________________
ii
THE BROOKINGS INSTITUTION CENTER ON URBAN AND METROPOLITAN POLICY
SUMMARY OF RECENT PUBLICATIONS *
DISCUSSION PAPERS/RESEARCH BRIEFS
2003The State Role in Urban Land Development
City Fiscal Structures and Land Development
What the IT Revolution Means for Regional Economic Development
Is Home Rule the Answer? Clarifying the Influence of Dillon’s Rule on Growth Management
2002Growth in the Heartland: Challenges and Opportunities for Missouri
Seizing City Assets: Ten Steps to Urban Land Reform
Vacant-Property Policy and Practice: Baltimore and Philadelphia
Calling 211: Enhancing the Washington Region’s Safety Net After 9/11
Holding the Line: Urban Containment in the United States
Beyond Merger: A Competitive Vision for the Regional City of Louisville
The Importance of Place in Welfare Reform: Common Challenges for Central Cities andRemote Rural Areas
Banking on Technology: Expanding Financial Markets and Economic Opportunity
Transportation Oriented Development: Moving from Rhetoric to Reality
Signs of Life: The Growth of the Biotechnology Centers in the U.S.
Transitional Jobs: A Next Step in Welfare to Work Policy
Valuing America’s First Suburbs: A Policy Agenda for Older Suburbs in the Midwest
Open Space Protection: Conservation Meets Growth Management
Housing Strategies to Strengthen Welfare Policy and Support Working Families
Creating a Scorecard for the CRA Service Test: Strengthening Banking Services Under theCommunity Reinvestment Act
The Link Between Growth Management and Housing Affordability: The Academic Evidence
What Cities Need from Welfare Reform Reauthorization
Growth Without Growth: An Alternative Economic Development Goal for Metropolitan Areas

iii
The Potential Impacts of Recession and Terrorism on U.S. Cities
TREND SURVEYS
2003Beyond Edge City: Office Sprawl in South Florida
Boomers and Seniors in the Suburbs: Aging Patterns in Census 2000
Rewarding Work Through the Tax Code: The Power and Potential of the Earned Income TaxCredit in 27 Cities and Rural Areas
2002Modest Progress: The Narrowing Spatial Mismatch Between Blacks and Jobs in the 1990s
Smart Growth: The Future of the American Metropolis
Living on the Edge: Decentralization Within Cities in the 1990s
Timing Out: Long-Term Welfare Caseloads in Large Cities and Counties
A Decade of Mixed Blessings: Urban and Suburban Poverty in Census 2000
Latino Growth in Metropolitan America: Changing Patterns, New Locations
Demographic Change in Medium-Sized Cities: Evidence from the 2000 Census
The Price of Paying Taxes: How Tax Preparation and Refund Loan Fees Erode the Benefitsof the EITC
The Importance of Housing Benefits to Housing Success
Left Behind in the Labor Market: Recent Employment Trends Among Young Black Men
City Families and Suburban Singles: An Emerging Household Story from Census 2000
TRANSPORTATION REFORM SERIES
TEA-21 Reauthorization: Getting Transportation Right for Metropolitan America
Slanted Pavement: How Ohio’s Highway Spending Shortchanges Cities and Suburbs
Fueling Transportation Finance: A Primer on the Gas Tax
FORTHCOMING
Stunning Progress, Hidden Problems: The Dramatic Decline of Concentrated Poverty in the1990s* Copies of these and previous Brookings urban center publications are available on the web site,
www.brookings.edu/urban, or by calling the center at (202) 797-6270.
iv
ACKNOWLEDGMENTS
The author would like to thank several reviewers in Missouri and at the Brookings Institutionwho provided highly valuable comments on the first draft of the report. At Ameregis, Anne Discherand Myron Orfield made valuable suggestions that improved the content and readability of thereport; and the GIS staff met its usual high standards with the data collection and mapping tasks.
The Brookings Institution Center on Urban and Metropolitan Policy would like to thank theEwing Marion Kauffman Foundation for its support of this analysis of TIF spending, which grew outof a larger project examining growth trends and challenges in the state of Missouri.
ABOUT THE AUTHOR
Thomas Luce is research director at Ameregis, Inc., a research and geographic informationsystems firm that documents economic and social development in American metropolitan areas. Hisresearch focuses on state and local finance, metropolitan development, and intergovernmentalrelations. Before joining Ameregis, Luce was on the faculties of the Humphrey Institute of PublicAffairs, University of Minnesota, and the Department of Public Administration, Pennsylvania StateUniversity.
Comments on this paper may be directed to Thomas Luce at [email protected].
The views expressed in this discussion paper are those of the authors and are not necessarily those of thetrustees, officers, or staff members of The Brookings Institution.
Copyright © 2003 The Brookings Institution
v
EXECUTIVE SUMMARY
Tax increment finance (TIF) is a popular and potentially powerful tool for places that needeconomic development the most yet have the least to spend. By allowing jurisdictions to useportions of their tax base to secure public-sector bonds, the mechanism allows fiscally strappedlocalities to finance site improvements or other investments so as to “level the playing field” ineconomic development.
However, poorly designed TIF programs can cause problems. Not only can they increasethe incentives for localities to engage in inefficient, zero-sum competition for tax base with theirneighbors. Also, lax TIF rules may promote sprawl by reducing the costs of greenfield developmentat the urban fringe. It is therefore critical that state legislatures design TIF rules well.
In view of this, an analysis of the way TIF is designed and utilized in Missouri shows that:
• Missouri law creates the potential for overuse and abuse of TIF. Vague definitions ofthe allowable use of TIF permit almost any municipality, including those market forcesalready favor, to use it. Weak limits on its use for inefficient inter-local competition for taxbase touch off struggles between localities. And the inclusion of sales tax base in theprogram tilts it toward lower-wage jobs and retail projects, which rarely bring new economicactivity into a region.
• Thanks to these flaws, TIF is used extensively in high-tax-base Missouri suburbanareas with little need for assistance in the competition for tax base. This is especiallytrue in the St. Louis metropolitan area. There, TIF money very frequently flows to purposesother than combating “blight” in disadvantaged communities—its classic purpose. In fact,less than half of the 21 St. Louis-area cities that were using TIF in 2001 were disadvantagedor “at-risk” when evaluated on four indicaters of distress. On another measure, just seven ofthe 20 suburban areas using TIF fell into the “at-risk” category.
• TIF is also frequently being used in the outer parts of regions—particularly in the St.Louis area. Most notably, only nine of the St. Louis region’s 33 TIF districts lie in theregion’s core. Conversely, 14 of the region’s 38 TIF districts lie west of the region’s majorring road (I-270). These districts, moreover, contain 57 percent of the TIF-captured propertytax base in the region. By contrast, the Kansas City region shows a pattern more consistentwith the revitalization goals of TIF. The vast majority of the districts lie in the region’s centercity, though the huge size of the city means many are still geographically far-flung.
In sum, poorly designed TIF laws are being misused at a time when state and local fiscalpressures require every dollar be spent prudently. As a result, a potentially dynamic tool forreinvestment in Missouri’s most disadvantaged communities threatens to become an engine ofsprawl as it is abused by high-tax-base suburban areas that do not need public subsidies.

vi
For these reasons, Missouri would be well-served by significant reforms in the lawsgoverning TIF:
• The allowable purposes for TIF should be more strictly defined to target its use toplaces with the most need for economic development.
• Higher level review of local determinations that TIF subsidies will support netcontributions to the regional or state economy (the “but-for” requirement) should beimplemented.
• Local TIF administrators should be required to show that TIF subsidies are consistentwith land-use and economic development needs both locally and in nearby areas.
If such reforms were put in place, TIF could be returned to its attractive main purpose: that ofproviding resources that would not otherwise be available to localities that badly need them topromote needed economic development and redevelopment.
vii
TABLE OF CONTENTS
I. INTRODUCTION…………………………………………………………………………… 1
II. ADVANTAGES AND DISADVANTAGES OF TIF……………………………………………. 2
III. TAX INCREMENT SUMMARY IN MISSOURI……………………………………………….. 6
IV. CONCLUSIONS…………………………………………………………………………... 16
APPENDIX A……………………………………………………………………………………… 17
APPENDIX B……………………………………………………………………………………… 18
1
RECLAIMING THE INTENT:TAX INCREMENT FINANCE IN THE KANSAS CITY AND ST. LOUIS METROPOLITAN AREAS
I. INTRODUCTION
Tax increment finance (TIF) is a method to finance part of the public and private costsassociated with local economic development. It does this by removing tax base increases in areasdesignated as TIF districts from the general tax roles and using the revenues from this “captured” taxbase to finance site improvements or other economic development costs. In the standard model,public-sector bonds are used to raise the money needed to finance site improvements at thebeginning of the project. The revenues from the captured tax base are then used to repay the bonds.When the bonds have been retired, the captured tax base reverts to the general tax roles.
This study shows how TIF has been used in the St. Louis and Kansas City metropolitanareas. The following section, Section II, describes TIF in some detail, summarizes the pros and consof the mechanism, and discusses three issues of special concern—allowable purposes for TIFdistricts, the “but-for” clause and project evaluation. Section III summarizes TIF rules in Missouri,describes the distribution of TIF activities in the Kansas City and St. Louis metropolitan areas andevaluates the effect of TIF on state aid to school districts in the areas that use TIF. Section IVprovides concluding comments.
2
II. ADVANTAGES AND DISADVANTAGES OF TIF
TIF is a popular tool for local governments because it provides a way for them to financelocal economic-development initiatives by means other than disbursements from current taxrevenues.1 Indeed, from the local point of view, TIF appears to be a costless (or very low cost) wayto finance economic-development programs—if tax base increases in the TIF district would not haveoccurred without the site improvements, then the money used to finance the bonds would not havebeen available in the absence of TIF. In other words, if the new tax base in a TIF district is truly basethat would not have been available without the TIF funding, the local government gets something(funds for economic-development programming) for nothing (no decrease in the funds available forother purposes).
This feature of TIF is both its primary strength and its major weakness. It is a strengthbecause TIF generates funding for economic-development activities that otherwise might not beavailable (especially at a time when assistance of this sort from higher levels of government isdeclining). This is especially important in fiscally stressed places that both need the economicdevelopment the most and have the fewest resources to spend. It is a weakness because it reducesthe apparent costs of economic development activities that often generate no net additions to theoverall regional or state economy. When the economic activity encouraged by TIF fundingrepresents activity that would have occurred somewhere else in the metropolitan area or the state,then from the point of view of metropolitan or state officials, the TIF funding is simply an unneededpublic subsidy. The larger the geographic scope of your point of view, the more likely it is that TIFwill be viewed as simply another tool in the zero-sum competition for tax base that goes on in everypart of the country.
One implication of the potential zero-sum nature of TIF benefits relates to school finance. Ifstate governments distribute aid to localities or school districts based on local tax bases (excludingbase captured in a TIF district), then total state aid is likely to be greater than it would have been inthe absence of TIF. For instance, if a business locates in a TIF district in a St. Louis-area suburb andgenerates $1 million in TIF-captured tax base, this $1 million dollars of tax-base is not counted in thestate school aid formula that determines the amount of aid received by the local school district.However, if that business had located in St. Louis (outside of any TIF district), then it would havebeen counted in the tax base used to calculate school aid to St. Louis, reducing the amount of aidreceived there. In general, the net effect of a business locating in a TIF district rather than outside ofa TIF district is an increase in total school aid distributed by the state.2
TIF offers other important advantages. It is a powerful and flexible way for state and localgovernments to direct economic-development resources where they are most needed. It is powerfulbecause it leverages private resources—TIF bonds are repaid with tax revenues generated by the
1 By 1999 44 states had TIF legislation. Goshorn, Julie A. “In a TIF: Why Missouri Needs Tax IncrementFinancing Reform” Washington University Law Quarterly 77, p. 925.2 The actual situation in Missouri is more complicated than this because of the special treatment of selected“held harmless” school districts in the school aid formula. See Section III, part B.

3
private development fostered by the TIF district. It is flexible because the generated funds can bespent on a wide variety of activities, while many intergovernmental funding sources come withstrings attached. In the end, local officials—the players best able to evaluate special localcircumstances—determine how the money is spent.
Another strength of TIF is that projects it supports must weather a market test of a sort notoften applied to spending from general fund budgets. Local economic-development officials mustevaluate TIF projects to ensure that they will (or will be very likely to) generate the added tax baseneeded to finance the TIF bonds. If TIF expenses are financed with general obligation (GO) bonds—bonds backed by the assets of the issuing government—and the project fails to capture enough newtax base to finance the TIF bonds, the bonds must still be redeemed at some point from generalrevenues. Similarly, if TIF bonds are financed by revenue bonds—bonds backed only by theexpected revenue stream from the project—then questionable projects are unlikely to generatesupport from private investors concerned with protecting their investment.
To be sure, economic-development projects funded from a city’s annual general fund—forinstance, from the local economic-development agency’s annual budget—must also weather thereviews built into the budget process. However, this process is unlikely to compare the requiredcurrent expenditures to the resulting future revenue increases in as rigorous a manner as TIFfunding because failure would not put the same “lien” on future revenues that a TIF bond does.
The upshot of these advantages and disadvantages, then, is that states must design TIFrules well. Three related issues stand out: (1) the definition of allowable purposes for TIF districts; (2)the definition of “new” activity, or activity that would have occurred “but-for” the TIF subsidies; and(3) project evaluation requirements.
A. Allowable Purposes for TIF Districts
If TIF is to be something other than just another means for localities to “beggar-thy-neighbor”in the competition for tax base, it must be targeted in ways that limit its use to places with acompelling need for assistance in this competition. Different states define allowable purposes in avariety of ways, usually based either on the characteristics of the area to be included in the TIFdistrict or the purposes for which the TIF funds will be used.
Local characteristics commonly used to define allowable purposes include blight (usuallydefined as fully developed areas with a significant percentage of substandard or vacant buildings),brownfields (areas with soil or other environmental remediation required) or activity in a targetedindustry (usually declining industries such as manufacturing or mining). Allowable spendingcategories often include activities like low-income housing or industry retention. In addition, moststates (including Missouri) also add the catch-all “economic development” as an allowable purpose.This category, or one like it, is often the loophole that enables non-stressed places to use TIF forgreenfield development.
4
B. The “But-For” Clause
Most states require that TIF be used only to subsidize economic development that would nothave occurred without the subsidy. The intent is to prevent TIF funds from being used simply to shifteconomic activity around a region in a zero-sum competition for tax base. Unfortunately, the “but-for”requirement is inherently difficult to verify. As a result, it often consists of little more than arequirement that TIF funds not be used to lure existing firms from another location within the sameregion or state.
The difficulty of enforcing the “but-for” requirement makes it very important to carefully defineTIF’s allowable purposes. One way to minimize the costs of the violations of the “but-for” clause is tocarefully target TIF to geographic areas that are struggling or where development or redevelopmentis expensive but desirable for social reasons (such as redeveloping brownfields in areas with highunemployment). Another is to limit subsidies to activities that private markets do not serve well (suchas very low-income housing). The difficulty in policing the “but-for” requirement is the primary reasonthat vague allowable purposes like “economic development” create so much potential for TIF to bemisused.
C. Project Evaluation
There are two important parts of a good project review— appraising the financial viability ofthe project and evaluating the underlying economic development value of the proposed activity.
Because TIF often involves the use of GO bonds that put public assets at risk, it is veryimportant that TIF projects be evaluated thoroughly enough to ensure a high likelihood that the TIFsubsidies will generate the new tax base needed to finance the bonds. TIF projects that fail to do thisincrease local fiscal stress by requiring that funds be diverted from other purposes to finance thebonds. The need for thorough evaluation inevitably increases the difficulty and costs of TIF as aneconomic-development tool.
One way to ensure the proper evaluation is to require that TIF districts use only revenuebonds, rather than GO bonds. The use of revenue bonds forces TIF projects to pass a market test—potential investors must be convinced of the viability of the project itself, not simply of the financialviability of the issuing government. If an adequate evaluation of the project is not available or if theevaluation implies that the risk of default is significant, then investors are likely to require junk-bondlevel returns—very high interest rates that increase the costs of the project.
Because TIF is a financial tool, it is tempting to evaluate TIF projects on that basis alone.However, a potential TIF project should also be evaluated by how well it serves local land-use needsand by the net economic benefits it generates. The fact that a project that is viable financially doesnot necessarily imply that it represents the best use of available resources (such as land and publicfunds) or even that it is worth doing at all. For instance, a project that results in retail developmentthat increases tax base by enough to pay off the public costs of the project—meaning that it is
5
financially viable—may also consume land that would more appropriately be used for other purposeswhile generating only very low paying (or temporary) jobs with no real possibility of advancement forthe workers that get them. In short, TIF projects should be evaluated in the context of a local land-use plan that specifies the preferred distribution of local economic activity and in the context of aneconomic development plan that spells out a preferred path for the local economy.
All of the issues described in this section interact in important ways. For instance, if theallowable purposes for TIF limit its use to areas with very high unemployment or other social needs,then the “but-for” requirement becomes less important because the economic-development activitiesare being targeted to areas where the social value is greatest. Similarly, if a way can be found toenforce the “but-for” requirement, then TIF is unlikely to be used for greenfield development inprosperous areas where development subsidies are unneeded.
6
III. TAX INCREMENT FINANCE IN MISSOURI
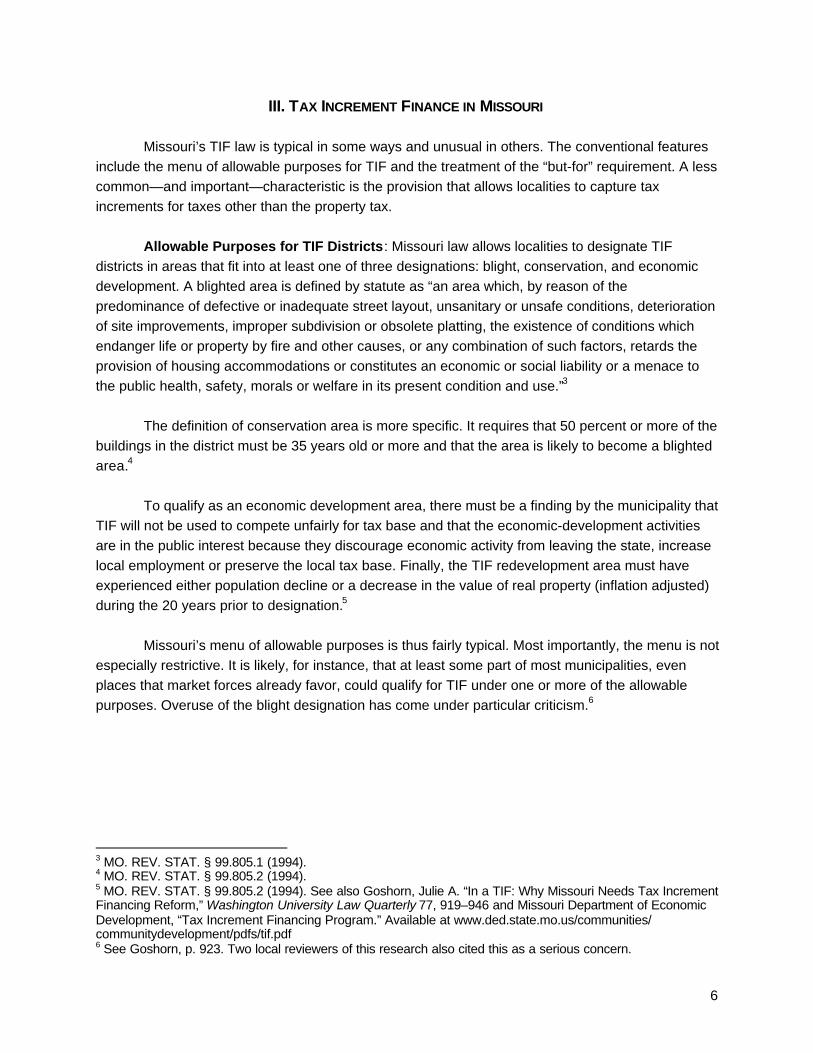
Missouri’s TIF law is typical in some ways and unusual in others. The conventional featuresinclude the menu of allowable purposes for TIF and the treatment of the “but-for” requirement. A lesscommon—and important—characteristic is the provision that allows localities to capture taxincrements for taxes other than the property tax.
Allowable Purposes for TIF Districts: Missouri law allows localities to designate TIFdistricts in areas that fit into at least one of three designations: blight, conservation, and economicdevelopment. A blighted area is defined by statute as “an area which, by reason of thepredominance of defective or inadequate street layout, unsanitary or unsafe conditions, deteriorationof site improvements, improper subdivision or obsolete platting, the existence of conditions whichendanger life or property by fire and other causes, or any combination of such factors, retards theprovision of housing accommodations or constitutes an economic or social liability or a menace tothe public health, safety, morals or welfare in its present condition and use.”3
The definition of conservation area is more specific. It requires that 50 percent or more of thebuildings in the district must be 35 years old or more and that the area is likely to become a blightedarea.4
To qualify as an economic development area, there must be a finding by the municipality thatTIF will not be used to compete unfairly for tax base and that the economic-development activitiesare in the public interest because they discourage economic activity from leaving the state, increaselocal employment or preserve the local tax base. Finally, the TIF redevelopment area must haveexperienced either population decline or a decrease in the value of real property (inflation adjusted)during the 20 years prior to designation.5
Missouri’s menu of allowable purposes is thus fairly typical. Most importantly, the menu is notespecially restrictive. It is likely, for instance, that at least some part of most municipalities, evenplaces that market forces already favor, could qualify for TIF under one or more of the allowablepurposes. Overuse of the blight designation has come under particular criticism.6
3 MO. REV. STAT. § 99.805.1 (1994).4 MO. REV. STAT. § 99.805.2 (1994).5 MO. REV. STAT. § 99.805.2 (1994). See also Goshorn, Julie A. “In a TIF: Why Missouri Needs Tax IncrementFinancing Reform,” Washington University Law Quarterly 77, 919–946 and Missouri Department of EconomicDevelopment, “Tax Increment Financing Program.” Available at www.ded.state.mo.us/communities/communitydevelopment/pdfs/tif.pdf6 See Goshorn, p. 923. Two local reviewers of this research also cited this as a serious concern.

7
The “But-For” Clause and Project Evaluation: The Missouri TIF statute requires that thelocal TIF commission prepare a redevelopment plan and determine whether TIF is needed to makethe project feasible—whether the project would not occur “but for” the TIF funding. The “but-for”requirement may be met in several ways, “such as the lack of development at the project site;additional costs of redevelopment; lack of private funds for the project; a projected pro-formaindicating that the projected return on investment (without the TIF assistance) is below a market rateof return, or other methods.”7
There are at least three serious shortcomings in this articulation of the “but-for” clause andthe project evaluation element. First, the “but-for” determination is strictly local. It is the responsibilityof the local TIF commission and the law makes no allowance for higher level review. This meansthat regional or state-level zero-sum concerns—the possibility that the development would occurelsewhere within the region or the state in the absence of the local subsidy—receives noconsideration. Second, even the local “but-for” hurdle is vague and set very low. For instance, sitesthat meet the “lack of development at the project site” requirement could potentially includegreenfield sites in relatively affluent areas. Finally, the redevelopment plan required by the lawincludes only the TIF site, with no reference to adjoining areas. While TIF commissions may havesome incentive to relate TIF plans to more general local economic development objectives, they arenot required to do so and they have no incentive to consider such concerns beyond municipalboundaries.
Potential Revenue Streams: As in most states, Missouri TIF districts may capture up to100 percent of the increment in real property taxes generated by TIF-supported development.However, unlike most states, the Missouri law also allows districts to capture 50 percent of localsales and utility tax increments.8 This creates an incentive for TIF users to implement sales-tax-intensive development strategies.9 In most cases, this means retail development, a type ofdevelopment that creates few high-wage jobs with strong career tracks. Competition for retaildevelopment is also very likely to represent a zero-sum game from the point of view of the region orthe state—new development in one part of the region/state is likely to simply be displacing activity inanother part of the region/state.
7 Missouri Department of Economic Development, “Tax Increment Financing Program,” p. 2. Available atwww.ded.state.mo.us/ communities/communitydevelopment/pdfs/tif.pdf8 Districts in St. Louis and Kansas City may also capture the increment in local income taxes—they are the onlylocalities in the state with the authority to tax income.9 Municipalities in the Kansas City and St. Louis metropolitan areas that use the sales tax rely very heavily onthe tax. In 1998, municipal sales tax revenues exceeded municipal property tax revenues by a factor of 2.8 inthose places.
8
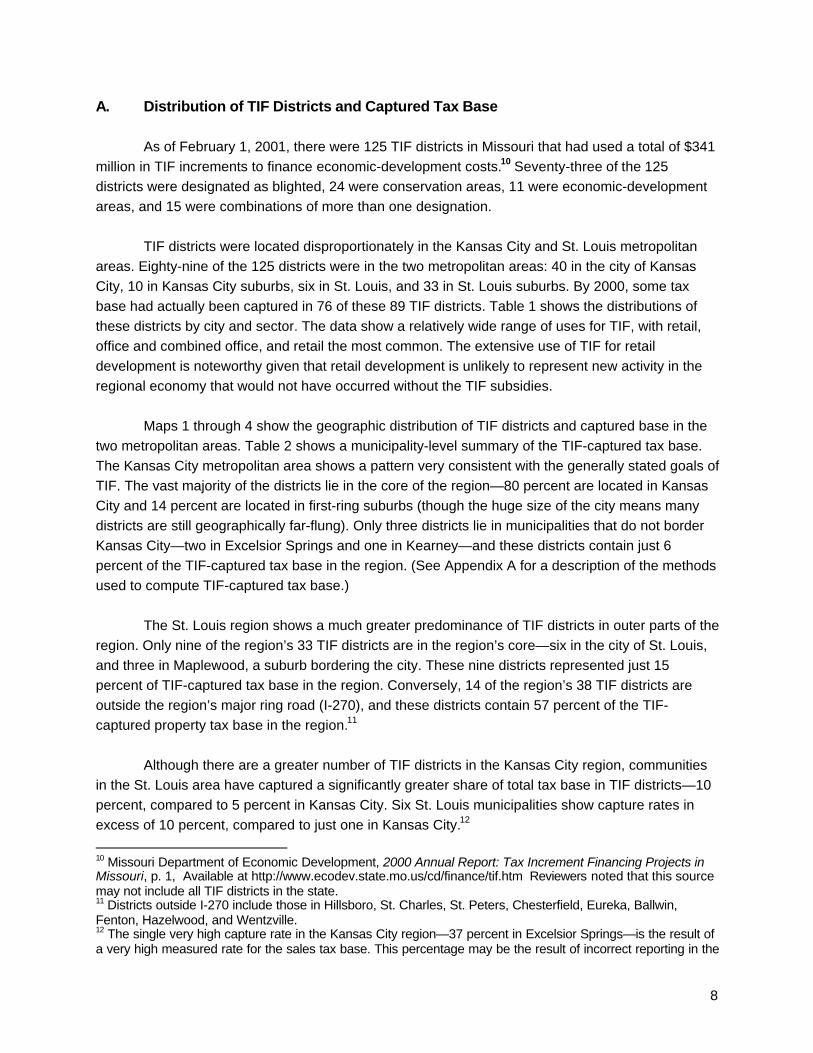
A. Distribution of TIF Districts and Captured Tax Base
As of February 1, 2001, there were 125 TIF districts in Missouri that had used a total of $341million in TIF increments to finance economic-development costs.10 Seventy-three of the 125districts were designated as blighted, 24 were conservation areas, 11 were economic-developmentareas, and 15 were combinations of more than one designation.
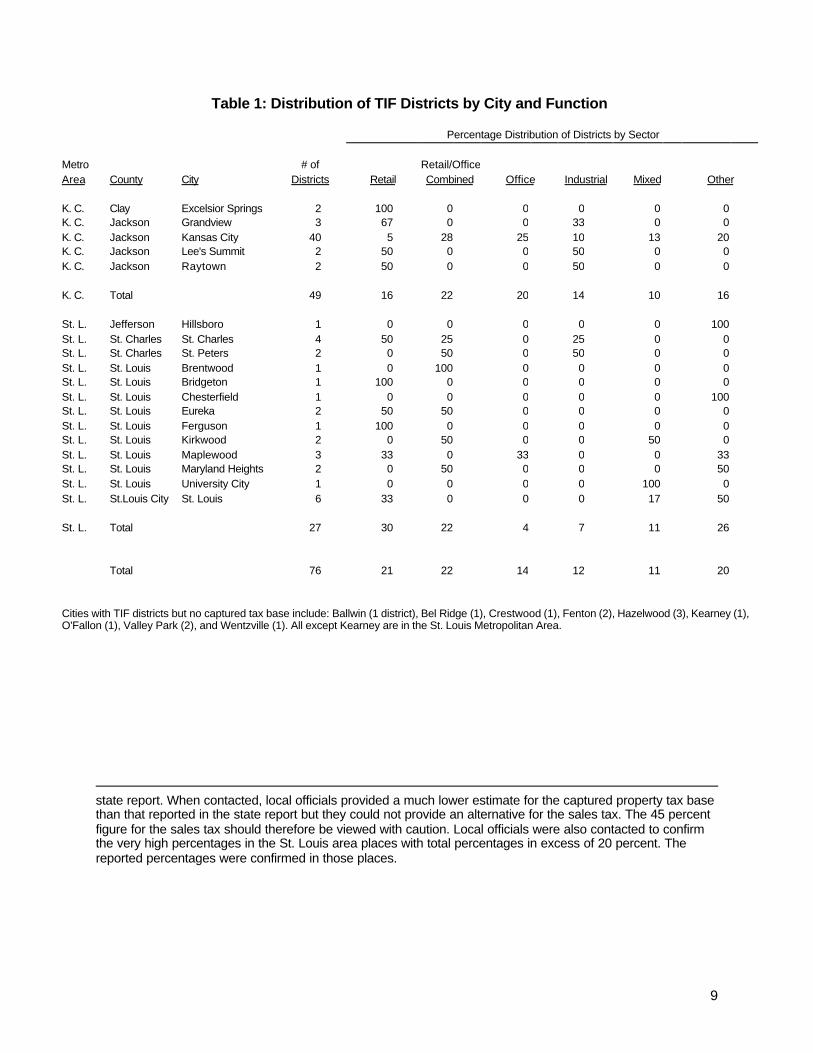
TIF districts were located disproportionately in the Kansas City and St. Louis metropolitanareas. Eighty-nine of the 125 districts were in the two metropolitan areas: 40 in the city of KansasCity, 10 in Kansas City suburbs, six in St. Louis, and 33 in St. Louis suburbs. By 2000, some taxbase had actually been captured in 76 of these 89 TIF districts. Table 1 shows the distributions ofthese districts by city and sector. The data show a relatively wide range of uses for TIF, with retail,office and combined office, and retail the most common. The extensive use of TIF for retaildevelopment is noteworthy given that retail development is unlikely to represent new activity in theregional economy that would not have occurred without the TIF subsidies.
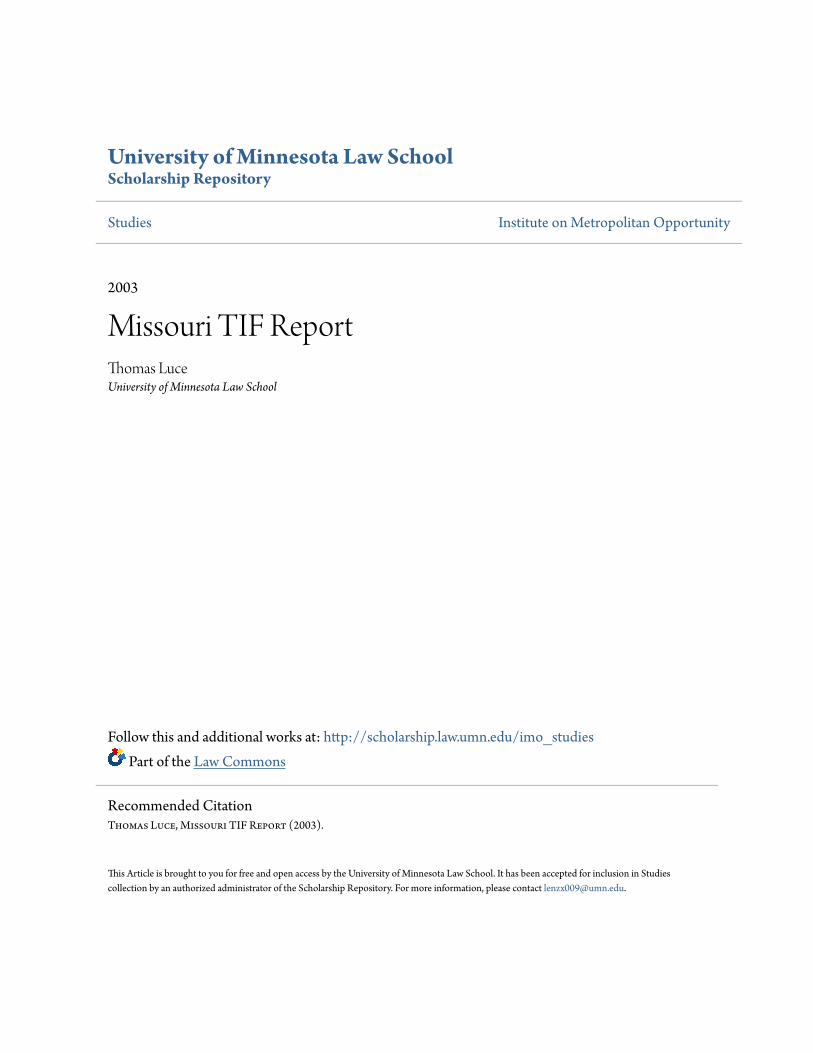
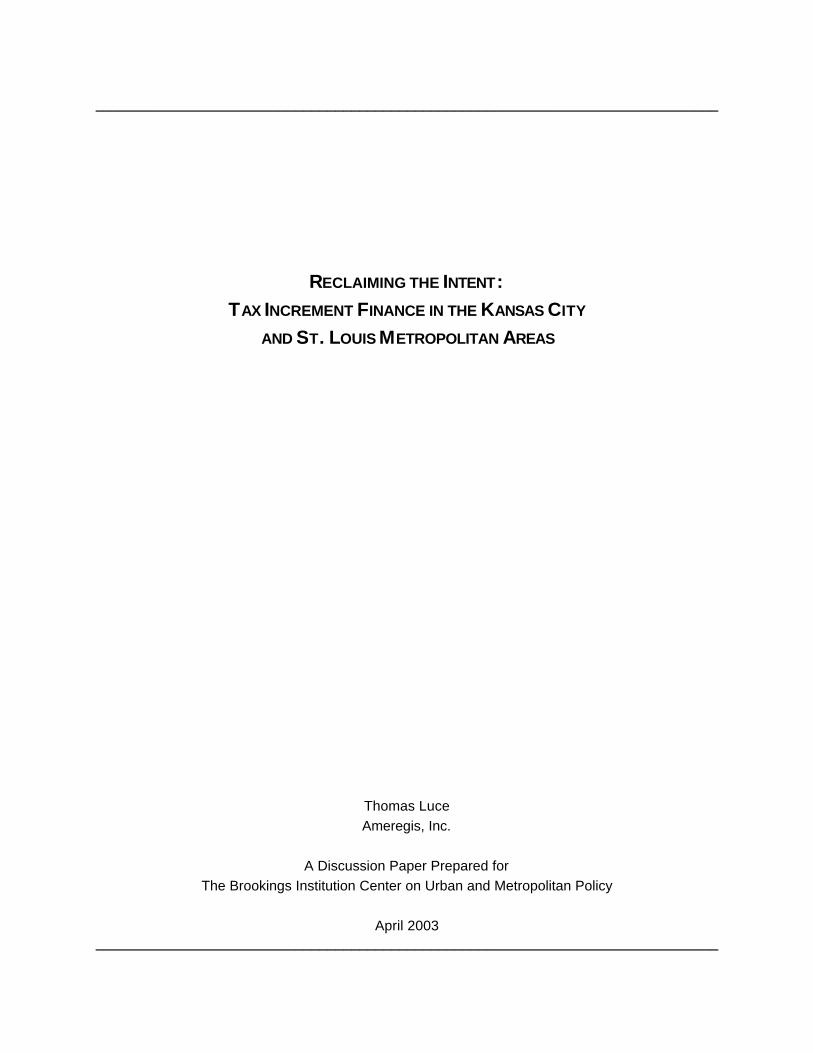
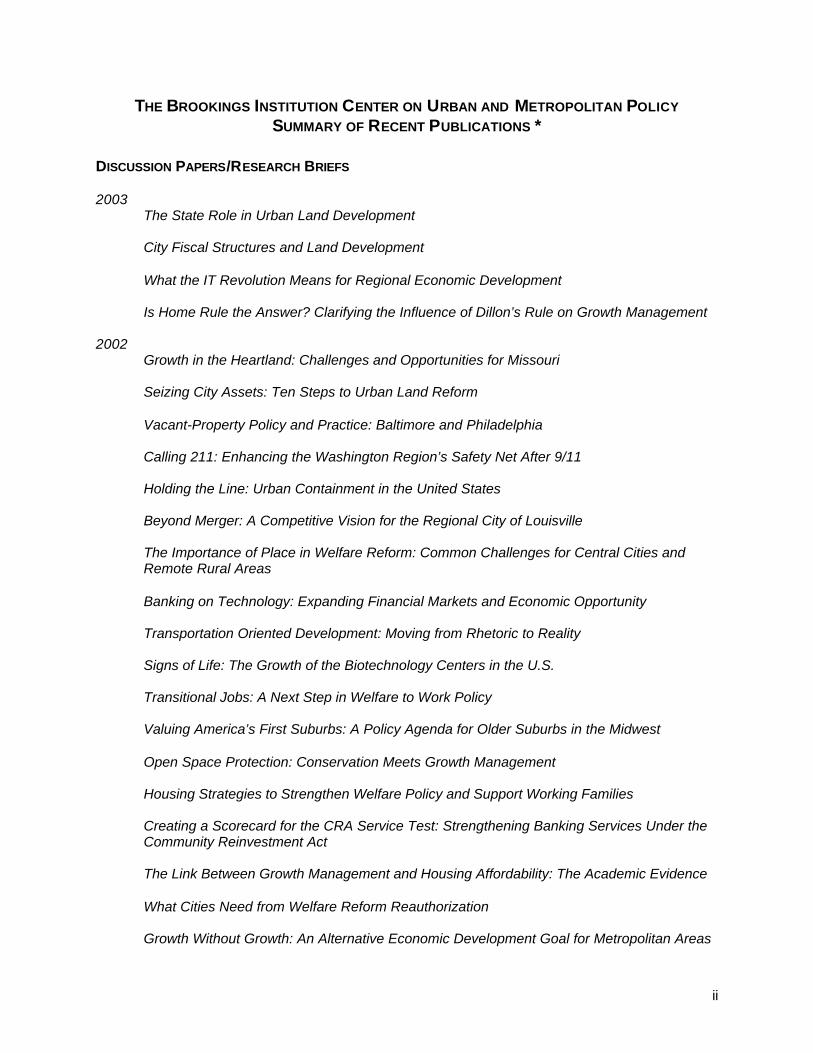
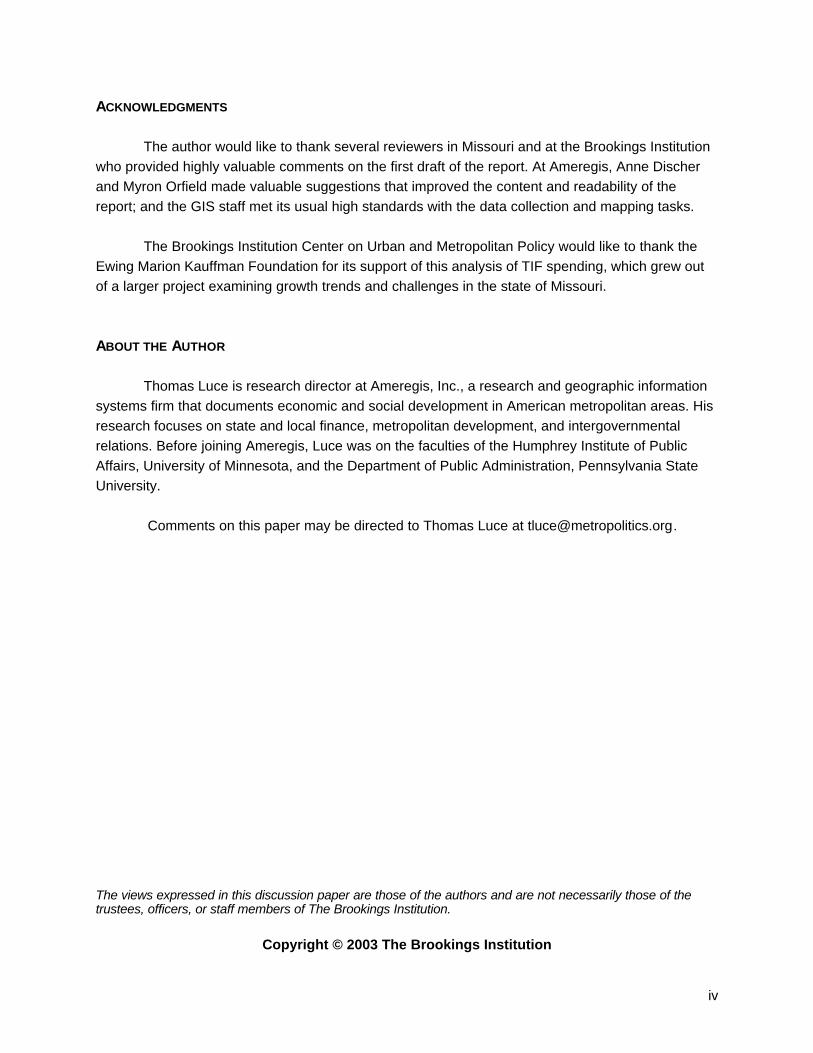
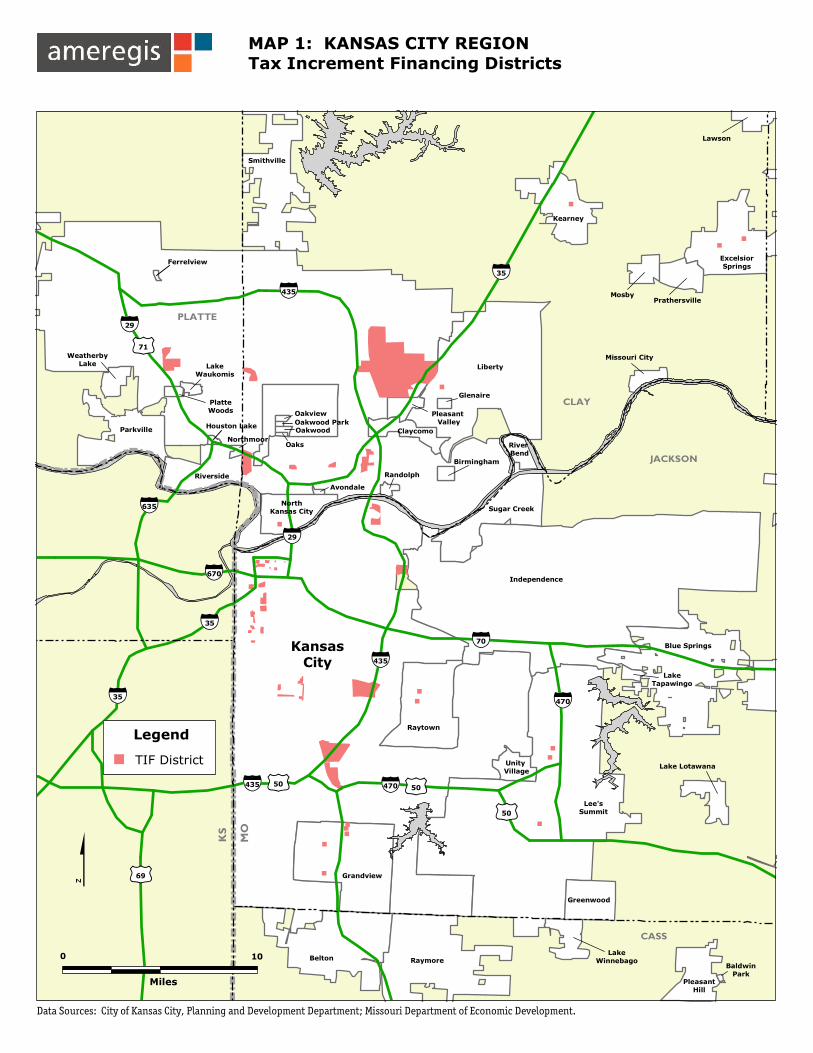
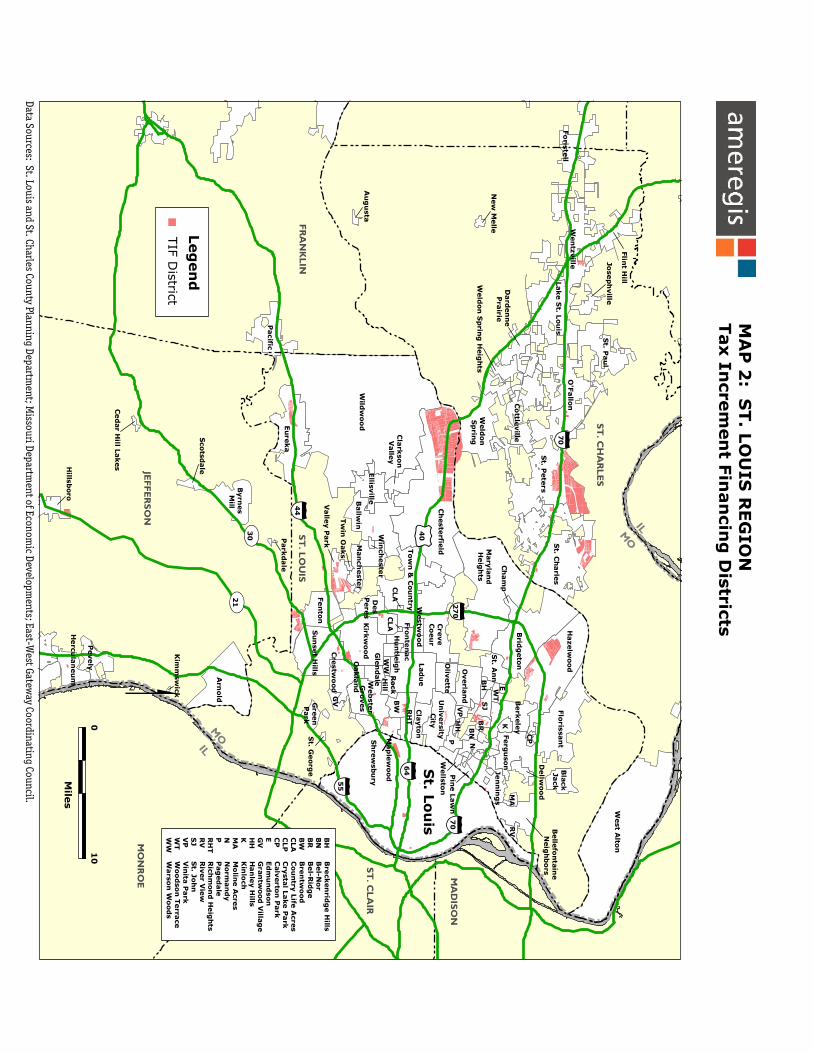
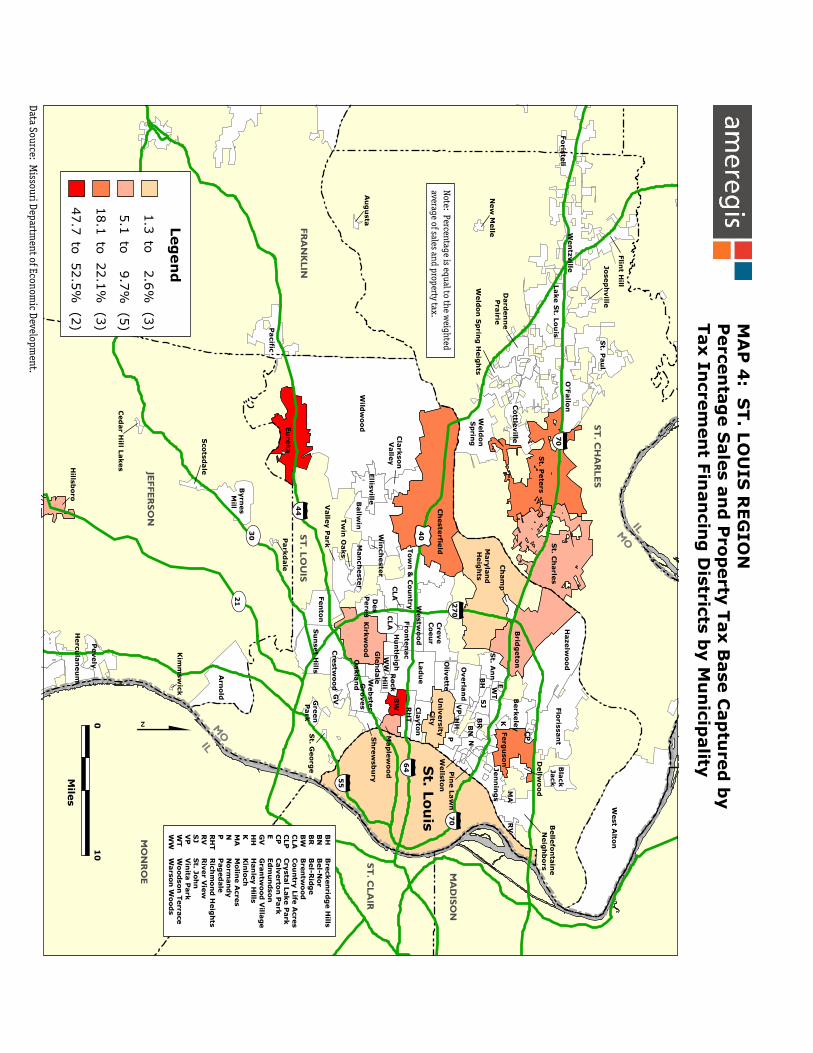
Maps 1 through 4 show the geographic distribution of TIF districts and captured base in thetwo metropolitan areas. Table 2 shows a municipality-level summary of the TIF-captured tax base.The Kansas City metropolitan area shows a pattern very consistent with the generally stated goals ofTIF. The vast majority of the districts lie in the core of the region—80 percent are located in KansasCity and 14 percent are located in first-ring suburbs (though the huge size of the city means manydistricts are still geographically far-flung). Only three districts lie in municipalities that do not borderKansas City—two in Excelsior Springs and one in Kearney—and these districts contain just 6percent of the TIF-captured tax base in the region. (See Appendix A for a description of the methodsused to compute TIF-captured tax base.)
The St. Louis region shows a much greater predominance of TIF districts in outer parts of theregion. Only nine of the region’s 33 TIF districts are in the region’s core—six in the city of St. Louis,and three in Maplewood, a suburb bordering the city. These nine districts represented just 15percent of TIF-captured tax base in the region. Conversely, 14 of the region’s 38 TIF districts areoutside the region’s major ring road (I-270), and these districts contain 57 percent of the TIF-captured property tax base in the region.11
Although there are a greater number of TIF districts in the Kansas City region, communitiesin the St. Louis area have captured a significantly greater share of total tax base in TIF districts—10percent, compared to 5 percent in Kansas City. Six St. Louis municipalities show capture rates inexcess of 10 percent, compared to just one in Kansas City.12
10 Missouri Department of Economic Development, 2000 Annual Report: Tax Increment Financing Projects inMissouri, p. 1, Available at http://www.ecodev.state.mo.us/cd/finance/tif.htm Reviewers noted that this sourcemay not include all TIF districts in the state.11 Districts outside I-270 include those in Hillsboro, St. Charles, St. Peters, Chesterfield, Eureka, Ballwin,Fenton, Hazelwood, and Wentzville.12 The single very high capture rate in the Kansas City region—37 percent in Excelsior Springs—is the result ofa very high measured rate for the sales tax base. This percentage may be the result of incorrect reporting in the
9
Table 1: Distribution of TIF Districts by City and Function
Percentage Distribution of Districts by Sector
Metro # of Retail/OfficeArea County City Districts Retail Combined Office Industrial Mixed Other
K. C. Clay Excelsior Springs 2 100 0 0 0 0 0K. C. Jackson Grandview 3 67 0 0 33 0 0K. C. Jackson Kansas City 40 5 28 25 10 13 20K. C. Jackson Lee's Summit 2 50 0 0 50 0 0K. C. Jackson Raytown 2 50 0 0 50 0 0
K. C. Total 49 16 22 20 14 10 16
St. L. Jefferson Hillsboro 1 0 0 0 0 0 100St. L. St. Charles St. Charles 4 50 25 0 25 0 0St. L. St. Charles St. Peters 2 0 50 0 50 0 0St. L. St. Louis Brentwood 1 0 100 0 0 0 0St. L. St. Louis Bridgeton 1 100 0 0 0 0 0St. L. St. Louis Chesterfield 1 0 0 0 0 0 100St. L. St. Louis Eureka 2 50 50 0 0 0 0St. L. St. Louis Ferguson 1 100 0 0 0 0 0St. L. St. Louis Kirkwood 2 0 50 0 0 50 0St. L. St. Louis Maplewood 3 33 0 33 0 0 33St. L. St. Louis Maryland Heights 2 0 50 0 0 0 50St. L. St. Louis University City 1 0 0 0 0 100 0St. L. St.Louis City St. Louis 6 33 0 0 0 17 50
St. L. Total 27 30 22 4 7 11 26
Total 76 21 22 14 12 11 20
Cities with TIF districts but no captured tax base include: Ballwin (1 district), Bel Ridge (1), Crestwood (1), Fenton (2), Hazelwood (3), Kearney (1),O'Fallon (1), Valley Park (2), and Wentzville (1). All except Kearney are in the St. Louis Metropolitan Area.
state report. When contacted, local officials provided a much lower estimate for the captured property tax basethan that reported in the state report but they could not provide an alternative for the sales tax. The 45 percentfigure for the sales tax should therefore be viewed with caution. Local officials were also contacted to confirmthe very high percentages in the St. Louis area places with total percentages in excess of 20 percent. Thereported percentages were confirmed in those places.
""
""
"
"
"
"
"
"
"
"
"
"
"
Oakwood Park
Ferrelview
BaldwinPark
Avondale
Oaks
Oakview
OakwoodNorthmoor
LakeTapawingo
Glenaire
Randolph
Birmingham
Missouri City
Pleasant Valley
LakeWinnebago
Lake LotawanaUnity Village
River Bend
PrathersvilleMosby
Lawson
NorthKansas City
Claycomo
PleasantHill
Greenwood
Kearney
ExcelsiorSprings
Sugar Creek
Smithville
Raytown
Blue Springs
Grandview
RaymoreBelton
Liberty
Lee'sSummit
KansasCity
Independence
Houston Lake
Riverside
Parkville
LakeWaukomis
PlatteWoods
WeatherbyLake
¡¢470
¡¢470
¡¢435
¡¢435
¡¢670
¡¢35
¡¢35
¡¢29
¡¢635
¡¢29
tu50
tu50
tu69
tu50
¡¢435
¡¢70
¡¢35
tu71
MAP 1: KANSAS CITY REGION Tax Increment Financing Districts
Data Sources: City of Kansas City, Planning and Development Department; Missouri Department of Economic Development.
$
Miles
0 10
KS
MO
CASS
JACKSON
CLAY
PLATTE
Legend
TIF District
ST. C
HA
RLES
MA
DISO
N
ST. C
LAIR
MO
NR
OE
JEFFERSO
N
FRA
NK
LINST
. LOU
IS
¡¢ 27
0
¡¢7
0
MO
IL
MO
IL
St. L
ou
is
Wild
woo
d
West A
lton
Ch
este
rfield
St. P
ete
rs
St. C
harle
s
Arn
old
Brid
geto
n
Hazelw
ood
Eu
reka
Lad
ue
Wen
tzville
Mary
lan
dH
eig
hts
Ballw
in
Flo
rissa
nt
Kirk
wo
od
Fen
ton
St. P
au
l
Pacific
Cre
ve
Co
eu
r
Su
nse
t Hills
Ferg
uso
n
Tow
n &
Cou
ntry
Lake S
t. Lou
isFo
ristell
Weld
on
S
prin
g
Berk
ele
y
Ellisv
ille
Pevely O
verla
nd
Byrn
es
Mill
Des
Pere
sM
an
cheste
r
Jen
nin
gs
St. A
nn
Co
ttleville
Un
iversity
C
ity
Web
ste
r G
roves
Oliv
ette
Cre
stw
ood
Cla
yto
n
Flin
t Hill
Fro
nte
nac
Valle
y P
ark
Hillsb
oro
Hercu
lan
eu
m
Dard
en
ne
Pra
irie
Bla
ck
Jack
Belle
fon
tain
e
Neig
hb
ors
N
SJ
BW
Cla
rkso
n
Valle
y
Gle
nd
ale
Jose
ph
ville
Map
lew
ood
P
RH
T
Gre
en
P
ark
Rock
Hill
Ch
am
p
Sh
rew
sbu
ry
Dellw
oo
d
Wellsto
n
Hu
ntle
igh
K
Sco
tsdale
BR
RV
BN
Oakla
nd
VP
Pin
e L
aw
n
Westw
ood
GV
BH
New
Melle
Au
gu
sta
CP
E
Tw
in O
aks
St. G
eorg
e
Ced
ar H
ill Lakes
Park
dale
O'F
allo
n
Kim
msw
ick
Weld
on
Sp
ring
Heig
hts
MA
WT
Win
cheste
r
CLA
CLA
WW
HH
tu4
0
UV2
1
UV3
0
¡¢5
5
¡¢4
4
¡¢7
0
¡¢6
4
MA
P 2
: ST. L
OU
IS R
EG
ION
Tax In
crem
en
t Fin
an
cing
Districts
$
Data Sources: St. Louis and St. Charles County Planning Department; M
issouri Department of Econom
ic Developments; East-W
est Gateway Coordinating Council.
Mile
s
01
0
BH
BN
BR
BW
CLA
CLP
CP
EGV
HH
KMA
NPRH
TR
VS
JV
PW
TW
W
Bre
cken
ridg
e H
illsB
el-N
or
Bel-R
idg
eB
ren
two
od
Cou
ntry
Life
Acre
sC
rysta
l Lake P
ark
Calv
erto
n P
ark
Ed
mu
nd
son
Gra
ntw
ood
Villa
ge
Han
ley H
illsK
inlo
chM
olin
e A
cres
Norm
an
dy
Pag
ed
ale
Rich
mon
d H
eig
hts
Riv
er V
iew
St. Jo
hn
Vin
ita P
ark
Woo
dso
n T
erra
ceW
arso
n W
ood
s
Leg
en
d
TIF D
istrict

Oakwood Park
Ferrelview
BaldwinPark
Avondale
Oaks
Oakview
OakwoodNorthmoor
LakeTapawingo
Glenaire
Randolph
Birmingham
Missouri City
Pleasant Valley
LakeWinnebago
Lake LotawanaUnity Village
River Bend
PrathersvilleMosby
Lawson
NorthKansas City
Claycomo
PleasantHill
Greenwood
Kearney
ExcelsiorSprings
Sugar Creek
Smithville
Raytown
Blue Springs
Grandview
RaymoreBelton
Liberty
Lee'sSummit
KansasCity
Independence
Houston Lake
Riverside
Parkville
LakeWaukomis
PlatteWoods
WeatherbyLake
¡¢470
¡¢470
¡¢435
¡¢435
¡¢670
¡¢35
¡¢35
¡¢29
¡¢635
¡¢29
tu50
tu50
tu69
tu50
¡¢435
¡¢70
¡¢35
tu71
MAP 3: KANSAS CITY REGION Percentage Sales and Property Tax Base Captured byTax Increment Financing Districts by Municipality
Data Source: Kansas City Economic Development Corporation.
$Miles
0 10
KS
MO
CASS
JACKSON
CLAY
PLATTE
Note: Percentage is equal to the weightedaverage of sales and property tax.
Legend
1.6%
4.1
37.0%
(1)
to 5.4% (3)
(1)
ST. C
HA
RLES
MA
DISO
N
ST. C
LAIR
MO
NR
OE
JEFFERSO
N
FRA
NK
LINST
. LOU
IS
¡¢ 27
0
¡¢7
0
MO
IL
MO
IL
St. L
ou
is
Wild
wo
od
West A
lton
Ch
este
rfield
St. P
ete
rs
St. C
harle
s
Arn
old
Brid
geto
n
Haze
lwo
od
Eu
reka
La
du
e
Wen
tzville
Mary
lan
dH
eig
hts
Ballw
in
Flo
rissan
t
Kirk
wo
od
Fen
ton
St. P
au
l
Pa
cific
Cre
ve
Co
eu
r
Su
nse
t Hills
Ferg
uso
n
To
wn
& C
ou
ntry
La
ke S
t. Lo
uis
Fo
riste
ll
Weld
on
S
prin
g
Berk
ele
y
Ellisv
ille
Pe
vely O
verla
nd
Byrn
es
Mill
Des
Pe
res
Man
cheste
r
Jen
nin
gs
St. A
nn
Co
ttleville
Un
iversity
C
ity
Web
ster
Gro
ves
Oliv
ette
Cre
stwo
od
Cla
yto
n
Flin
t Hill
Fro
nte
nac
Valle
y P
ark
Hillsb
oro
Hercu
lan
eu
m
Dard
en
ne
Pra
irie
Bla
ck
Jack
Belle
fon
tain
e
Neig
hb
ors
N
SJ
BW
Cla
rkso
n
Valle
y
Gle
nd
ale
Jose
ph
ville
Map
lew
oo
d
P
RH
T
Gre
en
P
ark
Ro
ckH
ill
Ch
am
p
Sh
rew
sbu
ry
Dellw
oo
d
Wellsto
n
Hu
ntle
igh
K
Sco
tsda
le
BR
RV
BN
Oa
kla
nd
VP
Pin
e L
aw
n
Westw
oo
d
GV
BH
New
Melle
Au
gu
sta
CP
E
Tw
in O
aks
St. G
eo
rge
Ced
ar H
ill Lakes
Pa
rkd
ale
O'F
allo
n
Kim
msw
ick
Weld
on
Sp
ring
Heig
hts
MA
WT
Win
cheste
r
CLA
CLA
WW
HH
tu4
0
UV2
1
UV3
0
¡¢5
5
¡¢4
4
¡¢7
0
¡¢6
4
MA
P 4
: ST
. LO
UIS
REG
ION
P
erce
nta
ge S
ale
s an
d P
rop
erty
Tax B
ase
Cap
ture
d b
yTax In
crem
en
t Fin
an
cing
Districts b
y M
un
icipality
$
Data Source: M
issouri Departm
ent of Economic D
evelopment.
Mile
s
01
0
BH
BN
BR
BW
CLA
CLP
CP
EGV
HH
KMA
NPRH
TR
VS
JV
PW
TW
W
Bre
cken
ridg
e H
illsB
el-N
or
Bel-R
idg
eB
ren
two
od
Cou
ntry
Life
Acre
sC
rysta
l Lake P
ark
Calv
erto
n P
ark
Edm
un
dson
Gra
ntw
ood
Villa
ge
Han
ley H
illsK
inlo
chM
olin
e A
cres
No
rman
dy
Pag
ed
ale
Rich
mo
nd
Heig
hts
Riv
er V
iew
St. Jo
hn
Vin
ita P
ark
Wo
odson
Terra
ceW
arso
n W
ood
sLeg
en
d
1.3
5.1
18.1
47.7
to 2.6
% (3
)
to 9.7
% (5
)
to 22.1
% (3
)
to 52.5
% (2
)
Note: Percentage is equal to the weighted
average of sales and property tax.
10
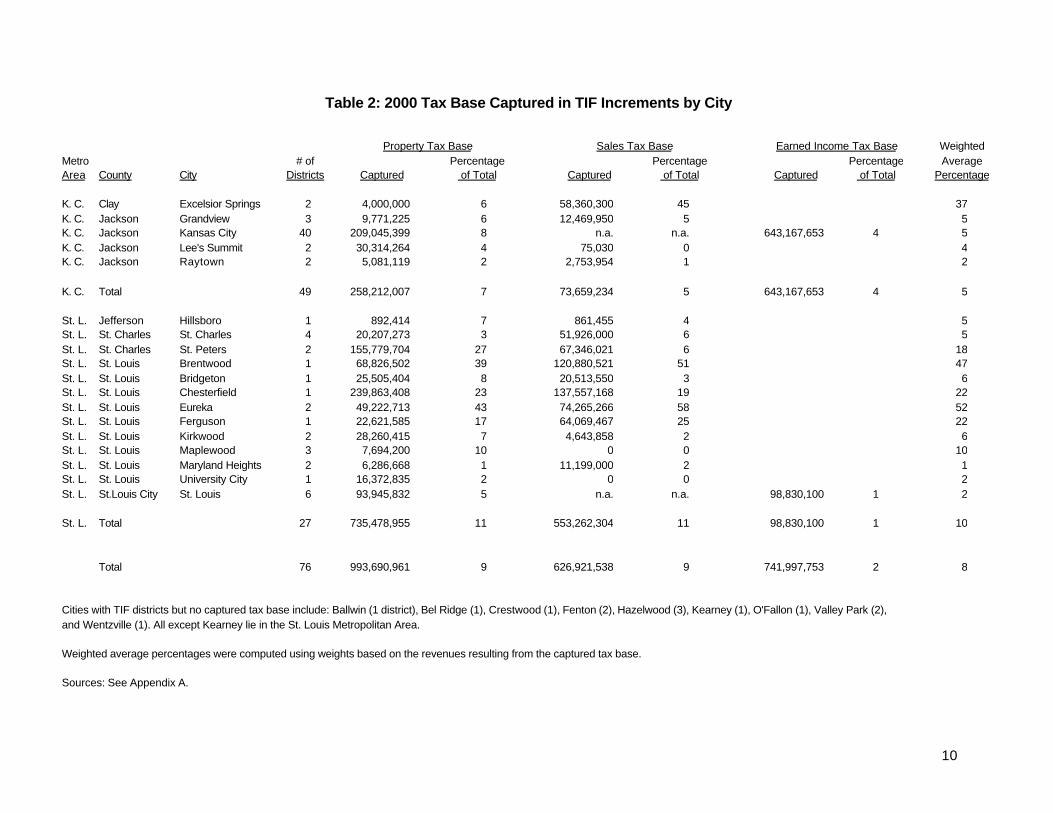
Table 2: 2000 Tax Base Captured in TIF Increments by City
Property Tax Base Sales Tax Base Earned Income Tax Base WeightedMetro # of Percentage Percentage Percentage AverageArea County City Districts Captured of Total Captured of Total Captured of Total Percentage
K. C. Clay Excelsior Springs 2 4,000,000 6 58,360,300 45 37K. C. Jackson Grandview 3 9,771,225 6 12,469,950 5 5K. C. Jackson Kansas City 40 209,045,399 8 n.a. n.a. 643,167,653 4 5K. C. Jackson Lee's Summit 2 30,314,264 4 75,030 0 4K. C. Jackson Raytown 2 5,081,119 2 2,753,954 1 2
K. C. Total 49 258,212,007 7 73,659,234 5 643,167,653 4 5
St. L. Jefferson Hillsboro 1 892,414 7 861,455 4 5St. L. St. Charles St. Charles 4 20,207,273 3 51,926,000 6 5St. L. St. Charles St. Peters 2 155,779,704 27 67,346,021 6 18St. L. St. Louis Brentwood 1 68,826,502 39 120,880,521 51 47St. L. St. Louis Bridgeton 1 25,505,404 8 20,513,550 3 6St. L. St. Louis Chesterfield 1 239,863,408 23 137,557,168 19 22St. L. St. Louis Eureka 2 49,222,713 43 74,265,266 58 52St. L. St. Louis Ferguson 1 22,621,585 17 64,069,467 25 22St. L. St. Louis Kirkwood 2 28,260,415 7 4,643,858 2 6St. L. St. Louis Maplewood 3 7,694,200 10 0 0 10St. L. St. Louis Maryland Heights 2 6,286,668 1 11,199,000 2 1St. L. St. Louis University City 1 16,372,835 2 0 0 2St. L. St.Louis City St. Louis 6 93,945,832 5 n.a. n.a. 98,830,100 1 2
St. L. Total 27 735,478,955 11 553,262,304 11 98,830,100 1 10
Total 76 993,690,961 9 626,921,538 9 741,997,753 2 8
Cities with TIF districts but no captured tax base include: Ballwin (1 district), Bel Ridge (1), Crestwood (1), Fenton (2), Hazelwood (3), Kearney (1), O'Fallon (1), Valley Park (2),and Wentzville (1). All except Kearney lie in the St. Louis Metropolitan Area.
Weighted average percentages were computed using weights based on the revenues resulting from the captured tax base.
Sources: See Appendix A.
11
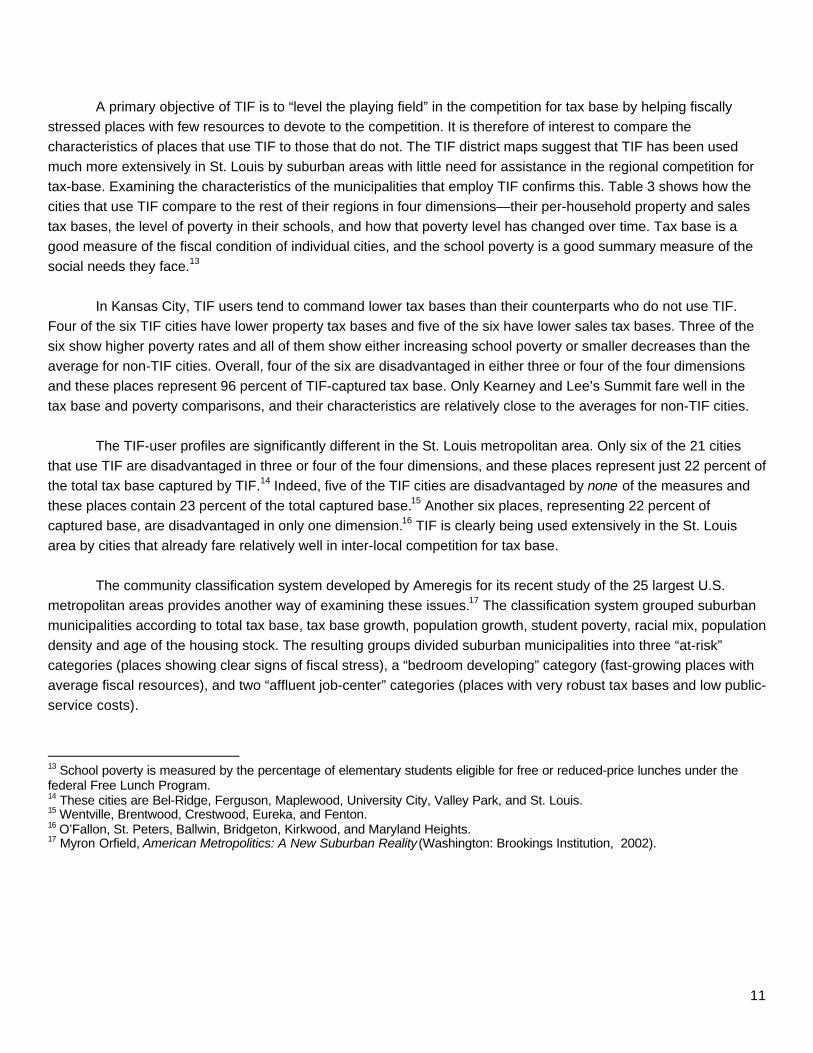
A primary objective of TIF is to “level the playing field” in the competition for tax base by helping fiscallystressed places with few resources to devote to the competition. It is therefore of interest to compare thecharacteristics of places that use TIF to those that do not. The TIF district maps suggest that TIF has been usedmuch more extensively in St. Louis by suburban areas with little need for assistance in the regional competition fortax-base. Examining the characteristics of the municipalities that employ TIF confirms this. Table 3 shows how thecities that use TIF compare to the rest of their regions in four dimensions—their per-household property and salestax bases, the level of poverty in their schools, and how that poverty level has changed over time. Tax base is agood measure of the fiscal condition of individual cities, and the school poverty is a good summary measure of thesocial needs they face.13
In Kansas City, TIF users tend to command lower tax bases than their counterparts who do not use TIF.Four of the six TIF cities have lower property tax bases and five of the six have lower sales tax bases. Three of thesix show higher poverty rates and all of them show either increasing school poverty or smaller decreases than theaverage for non-TIF cities. Overall, four of the six are disadvantaged in either three or four of the four dimensionsand these places represent 96 percent of TIF-captured tax base. Only Kearney and Lee’s Summit fare well in thetax base and poverty comparisons, and their characteristics are relatively close to the averages for non-TIF cities.
The TIF-user profiles are significantly different in the St. Louis metropolitan area. Only six of the 21 citiesthat use TIF are disadvantaged in three or four of the four dimensions, and these places represent just 22 percent ofthe total tax base captured by TIF.14 Indeed, five of the TIF cities are disadvantaged by none of the measures andthese places contain 23 percent of the total captured base.15 Another six places, representing 22 percent ofcaptured base, are disadvantaged in only one dimension.16 TIF is clearly being used extensively in the St. Louisarea by cities that already fare relatively well in inter-local competition for tax base.
The community classification system developed by Ameregis for its recent study of the 25 largest U.S.metropolitan areas provides another way of examining these issues.17 The classification system grouped suburbanmunicipalities according to total tax base, tax base growth, population growth, student poverty, racial mix, populationdensity and age of the housing stock. The resulting groups divided suburban municipalities into three “at-risk”categories (places showing clear signs of fiscal stress), a “bedroom developing” category (fast-growing places withaverage fiscal resources), and two “affluent job-center” categories (places with very robust tax bases and low public-service costs).
13 School poverty is measured by the percentage of elementary students eligible for free or reduced-price lunches under thefederal Free Lunch Program.14 These cities are Bel-Ridge, Ferguson, Maplewood, University City, Valley Park, and St. Louis.15 Wentville, Brentwood, Crestwood, Eureka, and Fenton.16 O’Fallon, St. Peters, Ballwin, Bridgeton, Kirkwood, and Maryland Heights.17 Myron Orfield, American Metropolitics: A New Suburban Reality (Washington: Brookings Institution, 2002).

12
Table 3: Community Characteristics: Places with TIF Districts Compared to Those Without
Percent of Total Share of 1998 1998 School Change inMetro Local Tax Base Regional Property Tax Sales Tax Poverty School PovertyArea County City Captured by TIF Captured Base Base per Household Base per Household 1998 1993--98
K. C. Clay Excelsior Springs 37 6 78,143 25,288 27 7K. C. Jackson Grandview 5 2 90,031 28,080 39 12K. C. Jackson Kansas City, MO 5 87 102,297 36,511 45 1K. C. Clay Kearney 0 0 117,825 29,003 4 -2K. C. Jackson Lee's Summit 4 3 133,332 22,831 7 -3K. C. Jackson Raytown 2 1 93,553 20,959 16 5
K. C. Total (Municipalities with TIF) 5 100 105,218 33,649 39 1
K. C. Rest of Metropolitan Area 0 0 113,728 25,307 21 -4
St. L. Jefferson Hillsboro 5 0 82,337 31,353 21 -5St. L. St. Charles O'Fallon 0 0 133,742 41,166 10 -5St. L. St. Charles St. Charles 5 5 99,343 35,392 15 -4St. L. St. Charles St. Peters 18 16 124,222 54,379 9 -6St. L. St. Charles Wentzville 0 0 186,609 79,824 29 -10St. L. St. Louis Ballwin 0 0 137,680 26,958 13 -7St. L. St. Louis Bel-Ridge 0 0 55,858 7,635 73 -3St. L. St. Louis Brentwood 47 14 155,986 65,890 19 -3St. L. St. Louis Bridgeton 6 3 173,977 102,315 25 25St. L. St. Louis Chesterfield 22 27 227,946 37,999 11 8St. L. St. Louis Crestwood 0 0 154,683 80,960 19 -6St. L. St. Louis Eureka 52 9 180,152 65,016 12 -16St. L. St. Louis Fenton 0 0 435,872 354,755 13 -4St. L. St. Louis Ferguson 22 6 68,635 28,194 46 5St. L. St. Louis Hazelwood 0 0 195,963 39,850 12 4St. L. St. Louis Kirkwood 6 2 140,947 24,420 15 -6St. L. St. Louis Maplewood 10 1 60,464 28,197 45 6St. L. St. Louis Maryland Heights 1 1 183,832 78,546 13 13St. L. St. Louis University City 2 1 86,822 12,750 45 -10St. L. St. Louis Valley Park 0 0 95,230 11,810 40 -24St. L. St. Louis City St. Louis 2 14 53,322 25,373 78 0
St. L. Total (Municipalities with TIF) 10 100 98,164 35,447 48 -3
St. L. Rest of Metropolitan Area 0 0 114,287 56,866 29 1
Sources: See Appendix A.
13
In the Kansas City area, three of the five suburban areas using TIF (Excelsior Springs,Grandview, and Raytown) fall into Ameregis’ at-risk categories, and the other two (Kearney andLee’s Summit) fall into the bedroom-developing category. In the St. Louis area just seven of the 20suburban areas using TIF fall in the at-risk categories (Bel-Ridge, Brentwood, Ferguson, Kirkwood,Maplewood, University City, and Valley Park), nine are bedroom-developing (Hillsboro, O’Fallon, St.Charles, St. Peters, Ballwin, Chesterfield, Eureka, Hazelwood, and Maryland Heights), and four areaffluent job centers (Wentzville, Bridgeton, Crestwood, and Fenton). These distributions support theanalysis based simply on tax base and poverty—TIF is much more likely to be used by non-stressedlocalities in the St. Louis area than in the Kansas City area.
B. TIF and State Aid for Public Schools
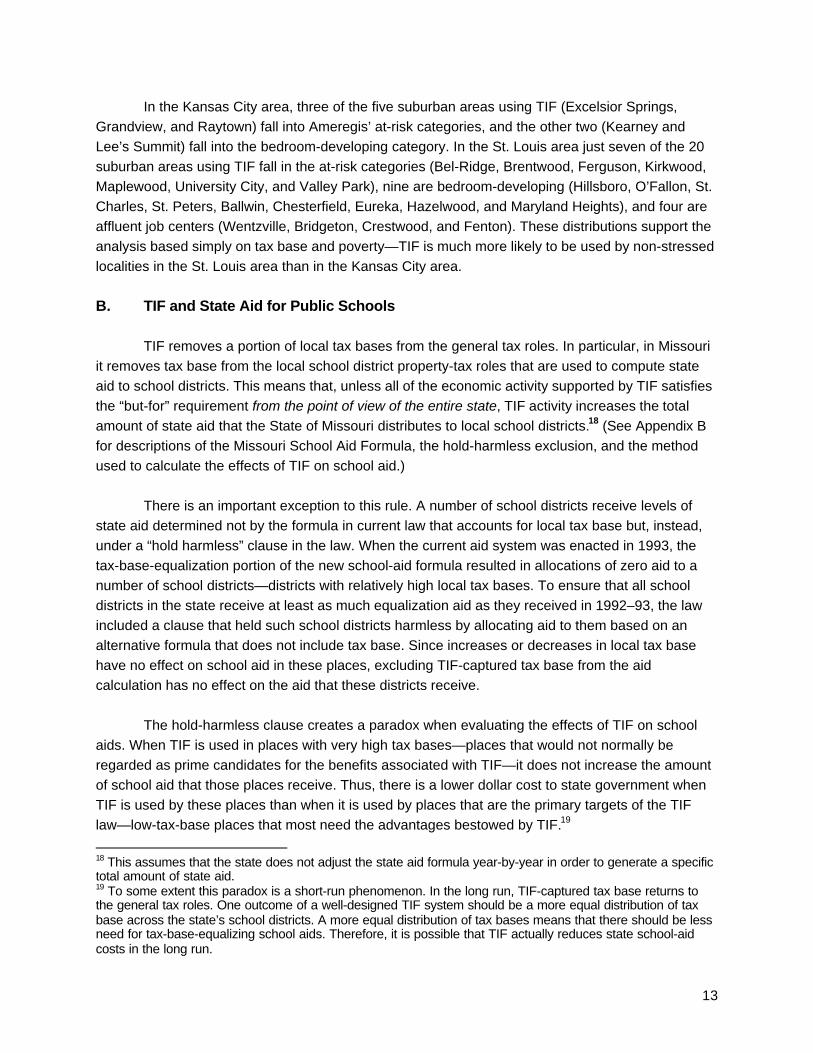
TIF removes a portion of local tax bases from the general tax roles. In particular, in Missouriit removes tax base from the local school district property-tax roles that are used to compute stateaid to school districts. This means that, unless all of the economic activity supported by TIF satisfiesthe “but-for” requirement from the point of view of the entire state, TIF activity increases the totalamount of state aid that the State of Missouri distributes to local school districts.18 (See Appendix Bfor descriptions of the Missouri School Aid Formula, the hold-harmless exclusion, and the methodused to calculate the effects of TIF on school aid.)
There is an important exception to this rule. A number of school districts receive levels ofstate aid determined not by the formula in current law that accounts for local tax base but, instead,under a “hold harmless” clause in the law. When the current aid system was enacted in 1993, thetax-base-equalization portion of the new school-aid formula resulted in allocations of zero aid to anumber of school districts—districts with relatively high local tax bases. To ensure that all schooldistricts in the state receive at least as much equalization aid as they received in 1992–93, the lawincluded a clause that held such school districts harmless by allocating aid to them based on analternative formula that does not include tax base. Since increases or decreases in local tax basehave no effect on school aid in these places, excluding TIF-captured tax base from the aidcalculation has no effect on the aid that these districts receive.
The hold-harmless clause creates a paradox when evaluating the effects of TIF on schoolaids. When TIF is used in places with very high tax bases—places that would not normally beregarded as prime candidates for the benefits associated with TIF—it does not increase the amountof school aid that those places receive. Thus, there is a lower dollar cost to state government whenTIF is used by these places than when it is used by places that are the primary targets of the TIFlaw—low-tax-base places that most need the advantages bestowed by TIF.19
18 This assumes that the state does not adjust the state aid formula year-by-year in order to generate a specifictotal amount of state aid.19 To some extent this paradox is a short-run phenomenon. In the long run, TIF-captured tax base returns tothe general tax roles. One outcome of a well-designed TIF system should be a more equal distribution of taxbase across the state’s school districts. A more equal distribution of tax bases means that there should be lessneed for tax-base-equalizing school aids. Therefore, it is possible that TIF actually reduces state school-aidcosts in the long run.
14
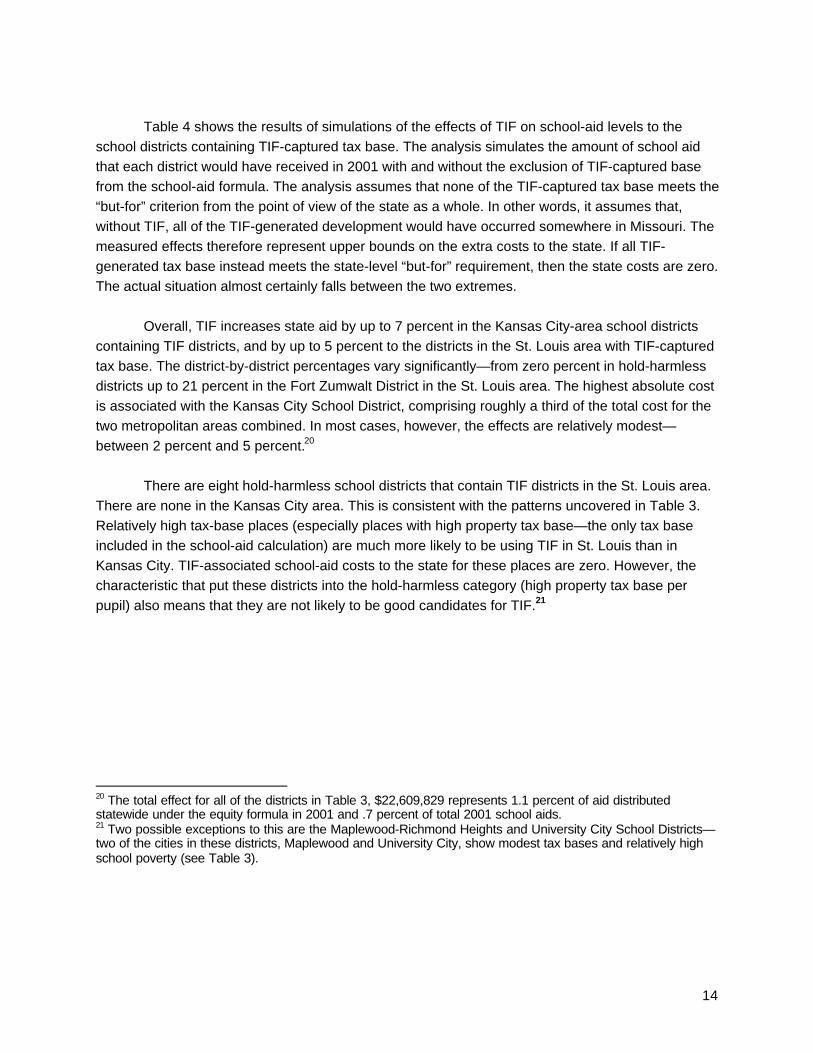
Table 4 shows the results of simulations of the effects of TIF on school-aid levels to theschool districts containing TIF-captured tax base. The analysis simulates the amount of school aidthat each district would have received in 2001 with and without the exclusion of TIF-captured basefrom the school-aid formula. The analysis assumes that none of the TIF-captured tax base meets the“but-for” criterion from the point of view of the state as a whole. In other words, it assumes that,without TIF, all of the TIF-generated development would have occurred somewhere in Missouri. Themeasured effects therefore represent upper bounds on the extra costs to the state. If all TIF-generated tax base instead meets the state-level “but-for” requirement, then the state costs are zero.The actual situation almost certainly falls between the two extremes.
Overall, TIF increases state aid by up to 7 percent in the Kansas City-area school districtscontaining TIF districts, and by up to 5 percent to the districts in the St. Louis area with TIF-capturedtax base. The district-by-district percentages vary significantly—from zero percent in hold-harmlessdistricts up to 21 percent in the Fort Zumwalt District in the St. Louis area. The highest absolute costis associated with the Kansas City School District, comprising roughly a third of the total cost for thetwo metropolitan areas combined. In most cases, however, the effects are relatively modest—between 2 percent and 5 percent.20
There are eight hold-harmless school districts that contain TIF districts in the St. Louis area.There are none in the Kansas City area. This is consistent with the patterns uncovered in Table 3.Relatively high tax-base places (especially places with high property tax base—the only tax baseincluded in the school-aid calculation) are much more likely to be using TIF in St. Louis than inKansas City. TIF-associated school-aid costs to the state for these places are zero. However, thecharacteristic that put these districts into the hold-harmless category (high property tax base perpupil) also means that they are not likely to be good candidates for TIF.21
20 The total effect for all of the districts in Table 3, $22,609,829 represents 1.1 percent of aid distributedstatewide under the equity formula in 2001 and .7 percent of total 2001 school aids.21 Two possible exceptions to this are the Maplewood-Richmond Heights and University City School Districts—two of the cities in these districts, Maplewood and University City, show modest tax bases and relatively highschool poverty (see Table 3).

15
Table 4: 2000 Property Tax Base Captured in TIF Increments and Associated School Basic Aid by School District
2001 Formula 2001 FormulaCaptured Aid Calculation Aid Calculation Hold
Metro Property Tax Percentage Excluding Including Percentage HarmlessArea School District Base of Total Captured Base Captured Base Difference Difference Districts
K. C. Excelsior Springs 40 4,000,000 3 7,984,208 7,858,212 125,996 2K. C. Grandview C-4 351,504 0 7,245,762 7,230,542 15,220 0K. C. Hickman Mills C1 28,424,651 7 17,384,224 16,223,582 1,160,642 7K. C. Kansas City 165,320,313 7 73,044,062 65,430,961 7,613,101 10K. C. Lee's Summit R-VII 30,314,264 4 29,885,564 28,636,617 1,248,947 4K. C. Liberty 10,636,220 3 12,741,804 12,333,372 408,432 3K. C. Park Hill 4,365,952 1 7,355,526 7,166,627 188,899 3K. C. Raytown C-2 14,799,103 3 14,447,228 13,888,659 558,569 4
K. C. Total 258,212,007 4 170,088,378 158,768,572 11,319,806 7
St. L. Brentwood 68,826,502 36 204,850 204,850 0 0 XSt. L. Ferguson-Florissant 22,621,585 3 20,498,078 19,434,864 1,063,214 5St. L. Ft. Zumwalt R-II 155,779,704 15 24,286,018 19,176,444 5,109,574 21St. L. Hazelwood 25,505,404 2 23,320,061 22,235,515 1,084,546 5St. L. Hillsboro R-3 892,414 1 6,640,101 6,614,462 25,639 0St. L. Kirkwood 28,260,415 4 862,791 862,791 0 0 XSt. L. Maplewood-Richmond Heights 7,694,200 5 371,653 371,653 0 0 XSt. L. Pattonville 6,286,668 1 1,578,523 1,578,523 0 0 XSt. L. Rockwood 289,086,121 14 9,297,391 9,297,391 0 0 XSt. L. St. Charles County R-V 11,789,430 9 788,069 788,069 0 0 XSt. L. St. Charles R-VI 8,417,843 1 6,079,079 6,079,079 0 0 XSt. L. St. Louis 93,945,832 3 108,412,229 104,409,215 4,003,014 4St. L. University City 16,372,835 5 4,721,300 4,721,300 0 0 X
St. L. Total 735,478,955 6 207,060,143 195,774,156 11,285,987 5
Total 993,690,961 6 378,304,924 355,695,095 22,609,829 6
School districts with TIF districts but no captured base include: Lindbergh R-VII (St. L., a Hold Harmless district), North Kansas City (K. C.) and Valley Park (St. L.).
Sources: See Appendix A.
16
IV. CONCLUSIONS
TIF has the potential to be a powerful tool to “level the playing field” in the competition for taxbase that occurs in all U.S. metropolitan areas. It can provide resources that otherwise would not beavailable to fiscally stressed localities to promote economic development and redevelopment.However, poorly targeted TIF laws may also contribute to sprawl by subsidizing greenfielddevelopment in high-tax-base suburban areas that need no assistance to compete effectively. Poorlydesigned TIF laws can further tilt the playing field, increasing the incentives for inefficient inter-localcompetition for tax base.
The Missouri TIF law clearly creates the potential for overuse or abuse. The blight,conservation, and the catch-all economic development categories are all vaguely defined. Inaddition, whether a particular use of TIF will result in unfair competition for tax base or violate the“but-for” requirement is a strictly local determination. These factors ensure that the Missouri lawinvites abuse.
Moreover, it appears that such abuse is taking place in the St. Louis metropolitanarea. Nearly 60 percent of the TIF-captured tax base in the St. Louis area is in the region’s outerareas. Similarly, nearly one-half of it lies in municipalities showing none or just one of the fourindicators of stress shown in Table 3.
These patterns clearly imply that the law should be revised to: (1) narrow the scope ofactivities or types of places eligible for TIF; (2) require review of the “but-for” implications of TIFprojects by some outside reviewer; and (3) require local TIF administrators to reconcile TIF planswith land use and economic development needs locally and in nearby areas.
If such reforms were put in place, TIF could be returned to its attractive main purpose inMissouri: that of providing resources that would not otherwise be available to localities that badlyneed them to promote economic development and redevelopment.
17
APPENDIX A: TIF-CAPTURED BASE CALCULATIONS
Data for TIF districts are from three sources. The Missouri Department of EconomicDevelopment’s 1999 Annual Report: Tax Increment Financing Projects in Missouri and 2000 AnnualReport: Tax Increment Financing Projects in Missouri—both available atwww.ecodev.state.mo.us/cd/finance/tif.htm—provided data on revenue from TIF-captured tax basein 1999 and 2000 for all districts except those in Kansas City. Data for Excelsior Springs andMaplewood were subsequently modified based on conversations with local TIF administrators. Datafor districts in the City of Kansas City came from the Tax Increment Financing 2001 Annual Report,Volumes 1 and 2, produced by the Economic Development Corporation, City of Kansas City.
Missouri Department of Economic Development reports do not provide direct estimates ofTIF-captured tax base. Instead they show cumulative revenues from TIF-captured property andsales tax base.22 The corresponding tax bases were estimated by computing revenues in 2000alone (the difference between cumulative 2000 revenues and cumulative 1999 revenues) anddividing by the appropriate local tax rate.
Because data for Kansas City districts in the state reports were not consistent in the twoyears, annual reports from the Kansas City Economic Development Corporation were used in placeof the state data. These reports show estimates of captured property tax base directly and revenuefrom captured income tax base.
Data on local tax bases, meanwhile, come from three sources. Local property tax rate andtax base data came from the relevant county assessor offices. Sales tax rate and revenue data arefrom the Missouri Department of Revenue. Income tax base for St. Louis and Kansas City werecomputed from revenue and rate data available at each city’s web site. Poverty data reported inTable 2 are from the National Center for Education Statistics.
22 Revenues from captured sales tax base are not shown for districts in St. Louis and Kansas City. Insteadincome tax revenues are shown.

18
APPENDIX B: MISSOURI SCHOOL AID CALCULATIONS
Missouri Basic School Aid Formula:
1. Foundation level of funding Pupils * operating levy (actual levy or 2.75mills, whichever is lower) * foundation taxbase per pupil ($1,307.89 in 2001)
Plus
2. Tax effort adjustment Pupils * excess levy (actual levy –2.75 mills or 0, whichever is greater) *foundation tax base per pupil ($1,307.89)
Minus
3. Tax base adjustment (lesser of 12/31/94 assessed value or prioryear’s AV) * income factor (an inflator forhigh-income places) * operating levy
4. Tax base growth adjustment (prior year’s AV – 12/31/94 AV) * incomefactor * operating levy
5. Other revenue Intangible taxes + state railroad and utilitytaxes + federal property revenue + federalimpact aid + proposition C funding + fairshare funding + free textbook funding
Equals
6. Basic Formula (1 + 2) – (3 + 4+ 5) or 0 if (1 + 2) –(3 + 4 + 5) is less than or equal to 0
Plus
7. At-risk adjustment (20% of foundation level per pupil from step1 * free or reduced lunch eligible students) +(30% of tax effort adjustment per pupilfrom step 2 * free- or reduced-lunch eligiblestudents)
Equals
8. Direct Apportionment

19
“Hold Harmless” Calculations:
If the direct apportionment per eligible pupil is less than each of two hold harmlesscalculations then the district’s basic aid equals the greater of the two hold harmless indicators timesthe number of eligible students. (Districts in this category are the “Hold Harmless” districts.)
If the direct apportionment per eligible pupil is greater than each of two hold harmlesscalculations then the district’s basic aid equals the direct apportionment minus the at-risk adjustment(or step 8 minus step 7).
Calculation of the Effect of TIF on School Aid:
The effect of TIF on basic aid levels was calculated by calculating basic aid with and withoutincluding the captured tax base in the prior year assessed value in step 4. In hold harmless districts,TIF has no effect on basic aid because the hold harmless calculations (which do not includeassessed value) replace steps 1 through 8.
Note: All of these calculations were made using the Basic School Aid Calculation Programavailable at the Missouri Department of Elementary and Secondary Education web site(www.dese.state.mo.us/divadm/finance/tools/).