mives multi-criteria approach for the evaluation
TRANSCRIPT

MIVES MULTI-CRITERIA APPROACH FOR THE EVALUATION,
PRIORITIZATION, AND SELECTION OF PUBLIC INVESTMENT
PROJECTS. A CASE-STUDY IN THE CITY OF BARCELONA
Pujadas, P. 1; Pardo-Bosch, F. 2; Aguado-Renter, A. 3; Aguado A1.
1 Department of Civil and Environmental Engineering, Division of Structures, Materials and Construction Technology,
School of Civil Engineering, Universitat Politècnica de Catalunya (UPC-Barcelona Tech), Barcelona, Spain 2
ESADE – Universitat Ramon Llull, Barcelona, Spain 3
Smart Engineering. Spin off of the Universitat Politècnica de Catalunya (UPC-Barcelona Tech), Jordi Girona 1-3, Parc
K2PIM, Barcelona, Spain
Abstract
A meaningful contribution to the evaluation of heterogeneous public investments is
described in this paper. The proposed methodology provides a step towards sustainable
urban planning in which decisions are taken according to clear, consistent and
transparent criteria assisted by the MIVES multi-criteria analysis framework. The
MIVES methodology combines Multi-criteria Decision Making (MCDM) and Multi-
Attribute Utility Theory (MAUT), incorporating the value function (VF) concept and
assigning weights through the Analytic Hierarchy Process (AHP). First, a
homogenization coefficient is calculated to develop the Prioritization Index for
Heterogeneous Urban Investments (PIHUI), so that non-homogenous alternatives may
be comparable. This coefficient measures the need of society to invest in each public
project through the consideration of its contribution to the regional balance, the scope of
its investment, the evaluation of the current situation and the values of the city. Then,
the MIVES multi-criteria framework is used to evaluate the degree to which each
investment would contribute to sustainable development. Different economic,
environmental and social aspects were considered through a decision framework,
constructed with the 3 aforementioned requirements, 5 criteria and 8 indicators. The
case study conducted for the Ecology, Urban Planning and Mobility Area of Barcelona
municipal council is presented in this paper, showing how this method performs
accurate, consistent, and repeatable evaluations.
KEYWORDS: Decision Making - MIVES - Multi-criteria - Urban Planning – Urban
Management – Public Investment
MIVES MULTI-CRITERIA APPROACH FOR THE EVALUATION,
PRIORITIZATION, AND SELECTION OF PUBLIC INVESTMENT
PROJECTS: A CASE-STUDY IN THE CITY OF BARCELONA
1- INTRODUCTION
The challenges to achieve sustainable urban development are increasing significantly as
the populations of our cities grow and their boundaries expand (Tiwari, 2003; Daigger,
2007; Lee and Chan, 2008 and Wallbaum et al., 2011). A large number of significant
non-homogeneous capital investment projects are proposed every year to Public
Administrations by a range of different stakeholders and agencies. However, limited
resources mean that the selection of all the proposed projects is quite obviously
impossible. These investments can have dramatic economic, environmental, and social
impacts due to the sheer volume of people who are directly and indirectly affected, so
decision-makers need to consider how to maximize their return on the investment of
public funds (Yin, Madanat, & Lu, 2009). As the gap between the available funds and
investment needs widens, identifying the most sustainable projects becomes a critical
activity.
The realities of the urban planning process demonstrate the difficulties of implementing
sustainable development as an objective in practice. Various investigations have shown
that human decision-makers have difficulties handling large amounts of complex
information in a consistent way. City councils and their agencies aim to develop
methodologies, in order to assure rational and systematic choices based on economic,
social and environmental grounds. In practice the most common form of analysis in
government is cost-effectiveness analysis (CEA), where the costs of different
homogeneous alternatives are compared. Other Monetary-based decision-support

techniques are: financial analysis (FA); and cost-benefit analysis (CBA). It should be
recalled that monetary-based techniques consider social and environmental aspects that
are identified as relevant impacts and are often (but not always) valued with various
limitations on both their methods and their accuracy. However, in some circumstances
they might be sufficient to change the resultant order (Dodgson et al, 2009). In these
circumstances multi-criteria analysis (MCA) techniques may be useful.
A number of multi-criteria methodologies have been developed over time with the aim
of providing a systematic framework that considers the multidimensional nature of the
real-world problem. MCM implies that each problem is broken down into its constituent
parts in order to understand the evaluation process (Cafiso et al., 2001). A complete
review of the MCA methodologies for ranking homogeneous alternatives developed
over the last twenty years can be found in Kabirb Sadiq and Tesfamariam (2013).
Although project prioritization is a widely used tool to evaluate and to rank projects, all
the existing research on this topic has mainly focused on the evaluation and the ranking
of transportation infrastructure planning projects and the selection of other
homogeneous alternatives. However, little (or no) attention has been paid to the
prioritization of non-homogeneous alternatives.
Thus, the main objective of this paper is to describe the MIVES methodology that has
been developed to assist decision-makers in finding strategies for the prioritization and
selection of heterogeneous investments projects. MIVES is a Multi-Criteria
methodology originally developed for the assessment of sustainability in construction
(San Jose and Cuadrado, 2010; Aguado et al. 2012; Pons et al. 2012; de la Fuente et al.,

2015) and the prioritization of homogenous (Viñoles et al., 2009) alternatives. Its main
contribution is that it combines Multi-criteria Decision Making (MCDM) and Multi-
Attribute Utility Theory (MAUT), incorporating the value function concept (Alarcón et
al., 2011) and assigning weights using the Analytic Hierarchy Process (AHP) (Saaty,
1980).
This methodology provides rational sustainability-based reasoning for the decision
criteria. A case study of the Area of Urban Ecology of the Barcelona Municipal Council
will guide the explanation of the methodology that is developed.
2.- MIVES MULTI-CRITERIA ANALYSIS
All classification and sorting techniques require the consideration of a realistic
framework that will consider the multidimensional nature of the real-world problem.
Consequently, the methodology in use should include all three sustainability dimensions
(ecological, financial, and social (United Nations, 2005)) in the prioritization processes.
The MIVES approach allows the consideration of such dimensions.
MIVES structures the problem within a multi-criteria analysis framework in which
different investment projects may be prioritized according to pre-established criteria, in
order to satisfy a pre-defined sustainable objective. A 3-level MIVES framework is
developed here, in order to set the pre-established criteria. The three levels range from
the most general to the most specific: requirements, criteria and indicators.
The weights are assigned by decision-makers using the Analytic Hierarchy Process
(AHP), to reflect the relative importance of each requirement, criterion and indicator for

the purposes of the prioritization. The AHP, originally devised by Saaty (1980), is a
linear additive model that converts subjective assessments of relative importance into a
set of overall scores or weights that are respectively based on pairwise comparisons
between criteria and between options. Thus, for example, in assessing weights, the
decision-maker is asked a series of questions, each of which inquires into how
important one particular criterion is in relation to another for the decision that is
addressed. Further details on the AHP process of creating the comparison matrix,
checking the consistency of the assessments and the calculation of the final weights of
the variables, may be found in Appendix A.
From the three levels of the framework analysis, indicators are the only concepts that
are evaluated during the prioritization process. Such an evaluation can be done using
qualitative or quantitative variables, and different units and scales depending on the
indicator. The value function (Alarcón et al. 2011) is a single mathematical function that
converts the qualitative and quantitative variables of the indicators, with their different
units and scales, into a single scale from 0 to 1. These respective values represent the
minimum and the maximum degree of satisfaction of the decision maker. In MIVES
this value function (eq. 1, for growing functions) depends on 5 parameters, the
variations of which generate all types of functions: concave, convex, lineal, or in an S
shape, according to the decisions that are taken. A complete description of the definition
of the function values may be found in Appendix B.
IVi = Bi ∗ [1 − e
−Ki∗(|X−Xmini|
Ci)
Pi
]
[1]

Previous MIVES frameworks were always developed for the evaluation and/or
prioritization of homogeneous alternatives. This fact allows the direct application of the
MIVES framework to all the studied alternatives, and its latter evaluation and ranking.
However, the problem faced in this paper is even more challenging, as it requires the
prioritization of a non-homogeneous set of alternative investments. This situation can be
solved by adapting the homogenization index concept developed by Pardo-Bosch, and
Aguado (2015).
3.- FRAMEWORK FOR THE INVESTMENT PRIORITIZATION INDEX
3.1- System boundaries
The framework presented in this paper was designed for the Barcelona Ecology, Urban
Planning and Mobility Area. This section of the Barcelona Municipal Council is
responsible for developing strategic projects aimed at reorienting Barcelona to a more
sustainable urban model. A large number of non-homogeneous public investment
projects are proposed every year in this area by many different stakeholder agencies.
The project proposals include infrastructural and service-related solutions: mobility,
energy, waste, urban planning, water, biodiversity and social cohesion. Moreover, when
proposed, the investment is at a preliminary stage and there are generally no clearly
defined details on the investment project.
The definition of a suitable homogenized decision framework is of great importance, to
arrive at the correct assessment. To that end, the most significant and discriminatory
variables were chosen in accordance with urban planning and investment experts.
3.2- Coefficient for the homogenization of the investment alternatives

The Homogenization Coefficient (HC), based on Pardo-Bosch and Aguado (2016), aims
to make heterogeneous investment projects comparable between them by assessing
them against identified needs in society. The HC considers four different but
complementary independent variables (Nn(Px)), which despite their generic character,
ensure the accuracy and representativeness needed in the analysis: (1) Contribution to
the Regional Balance (N1 or CRB); (2) Investment Scope (N2 or InS); (3) Evaluation of
the current situation (N3 or ECS); and, (4) Values of the City (N4 or VaC). All the
aforementioned variables are evaluated by means of attributes. Following the suggestion
of considering no more than 5 ranges in a decision, from Williams (2009), a score
ranging between 1 to 5 points was assigned to each variable (Nn(Px)) according to the
attribute-criteria defined in Table 1. As all Nn(Px) are independent variables, each score
is not conditioned by the others. The 4 variables are described below.
The variable Contribution to the Regional Balance (CRB) represents the level of public
investment in each district over the past few years with regard to its representativeness
in the whole city (it aims to consider a proportional distribution of wealth). A score
ranging between 1 to 5 (see Table 1) is assigned to the CRB variable depending on the
Investment Deficit (InD), calculated according to equation 2. For its calculation, the rent
level (RL), population density (PD), and the investments over the last 8 years (Inv) for a
specific district (i) and in relation to the total city (T) are considered.
𝐼𝑛𝐷 = (1 −
𝐼𝑛𝑣𝑖
𝐼𝑛𝑣𝑇 𝑥 100
𝛼1 ·𝐷𝑃𝑖
𝐷𝑃𝑇+ 𝛼2 ·
𝑅𝐿𝑇
𝑅𝐿𝑖
) [2]
The variable Investment Scope (InS) represents the scale of the investment project that is
proposed. It is measured as the weighted sum of two parameters (see eq. 3): the
population that can benefit from the new service (Population Served or PoS) and how

important, from fundamental to unnecessary, the investment is for that population
(service Importance or SeI). Both parameters (PoS and SeI) are at the same time
evaluated using the 1 to 5 range of the attribute-criteria defined in Table 1.
𝐼𝑛𝑆 = 𝛽1 · 𝑃𝑜𝑆 + 𝛽2 · 𝑆𝑒𝐼 [3]
The Evaluation of the current situation (ECS) is measured as the weighted sum of the
Condition of the Current Alternatives (CCA) and Saturation of the Current Alternatives
(SCA), see eq. 4. Again, both parameters (CCA and SCA) are evaluated using the 1 to 5
range of the attribute-criteria defined in Table 1. Note that the maximum marks from
among the three aspects - the condition state, the level of proximity and the level of
technical obsolescence – are assigned for the evaluation of the CCA.
ECS = 𝛾1 · 𝐶𝐶𝐴 + 𝛾2 · 𝑆𝐶𝐴 [4]
The variable Values of the City (VaC) aims to measure the alignment of each of the
investment projects with the intangible values of the City. Its calculation is done as the
weighted sum of the progress level of the unfinished investments (PUI) and the
alignment of the investments with the Strategic Concerns of the City (ASC), see eq. 5.
The ASC considers the principles to ensure a quality public space, a green and
biodiverse city, that is productive and resilient, a city committed to active mobility with
public involvement and commitment. The ASC is evaluated through a check list in
which a ranking of between 1 and 5 is given for each strategic concern. The final ASC
value is given as the average rank between the 5 better ranked concerns.
VaC = 𝛿1 · 𝑃𝑈𝐼 + 𝛿2 · 𝐴𝑆𝐶 [5]
Table 1 – Attribute-criteria for the variables defining the HC

Variable InD Points
CRB
0.95 < InD 5
0.91 < InD ≤ 0.95 % 4
0.88 < InD ≤ 0.91 3
0.85 < InD ≤ 0.88 2
InD ≤ 0.85 1
Variable PoS
𝜷𝟏 = 𝟎, 𝟒
SeI
𝜷𝟐 = 𝟎, 𝟔 Points
InS
City Essential 5
Inter-district High 4
District Normal 3
Neighborhood Low 2
Local None 1
Variable
CCA
𝜸𝟏 = 𝟎, 𝟔 SCA
𝜸𝟐 = 𝟎, 𝟒 Points
condition state
level of proximity
obsolescence
ECS
No service No service No service No service 5
Low Low Obsolete Overused 4
Acceptable Acceptable Acceptable Highly used 3
High High Updated Acceptable 2
Not applicable
Not applicable Not applicable Underused 1
Variable PUI
𝜹𝟏 = 𝟎, 𝟐
VaC
Attribute Points
PUI >75% 5
50% <PUI ≤ 75% 4
25% < PUI ≤ 50% 3
PUI ≤25% 2
New project 1
ASC
𝜹𝟐 = 𝟎, 𝟖
ASC Key-issues Attribute Points
Healthy and Vital City
Regenerative City
Green and Biodiverse City
Accessible and peaceful City
Productive and resilient
Sustainable
Metropolitan
Very high 5
High 4
Medium 3
Low 2
Very low 1

Finally, the HC for each investment project is calculated according to equation 6 as the
weighted sum of each of the Nn(Px) variables. The relative weights (w𝐻𝐶,𝑛) of the
variables CET ABA, ASP and GVA assigned by the decision makers are 0.48; 0.21;
0.10 and 0.21, respectively. The HC coefficient is a value ranging between 1 (not
needed) and 5 (highly needed) that affects some of the indicators involved in the
economic, environmental, and social requirements (see section 3.3).
HC (P𝑥) = ∑ w𝐻𝐶,𝑛 · N𝑛(P𝑥) [6]
This coefficient measures the need of the society to invest in each public project. One
may think that the HC could be directly used to rank the public investments, however,
even if one investment might be highly needed, it may not be sustainable enough and
consequently should not be prioritized. In this case, the public project should be
modified, in order to become more sustainable, so that the project would not only be
sustainable, but also highly needed, and consequently, well prioritized.
3.3- Decision framework
The Prioritization Index for Heterogeneous Urban Investments (PIHUI) aims to
evaluate the degree to which each investment project, if chosen, would contribute to the
sustainable development of the urban territory. According to the definition from the
Sustainable City Conference, held at Rio de Janeiro, in 2000: “The concept of
sustainability, as applied to a city, is the ability of the urban area and its region to
continue to function at levels of quality of life desired by the community without
restricting the options available to the present and future generations and causing
adverse impacts inside and outside the urban boundary” (Brebbia et al. 2000).

The economic, environmental and social repercussion of each investment will be
considered here, in order to consider all these aspects. The coherence,
representativeness, and objectivity of the criteria and indicators under consideration in
each requirement will guarantee the goodness and credibility of its results. With this
purpose the most significant and discriminatory indicators have exclusively been
considered. Table 2 shows the detailed list of the decision framework, constituted by the
3 aforementioned requirements, 5 criteria, and 8 indicators (the weight of each
requirement, criterion and indicator is presented in brackets).
Table 2 – Decision framework for the Investment Prioritization Index
Economic Requirement
In the Economic Requirement, two different criteria (investment balance (C1) and
investment return (C2)) are considered, to evaluate the economic impact of each
investment project.
REQUIREMENTS CRITERIA INDICATORS
R1. Economic
(20%)
C1. Investment
(80%)
I1. Annual Unitary Cost (70%)
I2. Exploitation Cost (30%)
C2. Cofinancing
(20%)
I3. Co-funding (100%)
R2. Environmental
(40%)
C3. Environmental
Contribution (100%)
I4. Environmental Contribution (100%)
R3. Social
(40%)
C4. Service Change
(50%)
I5. Service Quality Improvement (50%)
I6. Service Capacity Improvement (50%)
C5. Surrounding Impacts
(50%)
I7. Creation of Employment (30%)
I8. Social Agreement (70%)

C1 is at the same time divided into two indicators. Indicator I1 is the annual unitary cost
(AUC) and is based on Pardo-Bosch, F. and Aguado, A. (2015). It evaluates the
implementation costs (ImC) of each investment project considering its expected lifetime
(LT) and its HC according to eq. 7.
𝐴𝑈𝐶 =𝐼𝑚𝐶
𝐿𝑇 · 𝐻𝐶 [7]
Apart from the annual unitary cost, C1 also measures the annual economic effort needed
to maintain the service provided by the investment project (indicator I2). A score of 1
to 5 is assigned to the variable exploitation cost or ExC (according to the attribute-
criteria defined in Table 3). This value, affected by the HC yields annual maintenance
effort or AME (see eq. 8).
𝐴𝑀𝐸 = ExC · HI [8]
C2 is constituted only by Indicator I3 which aims to measure the possibility of obtaining
external funding to develop the investment. The variable for the calculation of I3 is
calculated as the product of the probability of obtaining funding (PrF), the quantity of
probable funding (QuF) and the HC. The variables PrF and QuF are directly obtained
assigning a 1-to-5 score according to the attribute-criteria of table 3.
𝐶𝑜𝐹 = 𝑃𝑟𝐹 · 𝑄𝑢𝐹 · 𝐻𝐼 [9]

Table 3 – Attribute-criteria for the variables defining the Economic Requirement
Variable ExC Points
AME
Very high 5
High 4
Medium 3
Low 2
Very low 1
Variable PrF QuF Points
CoF
Very high QuF >80% 5
High 60% <QuF ≤ 80% 4
Medium 40% < QuF ≤ 60% 3
Low 10% < QuF ≤40% 2
Very low QuF ≤ 10% 1
Environmental Requirement
Barcelona has a strict green policy, promulgating only environmental friendly
investments. Consequently, in this decision framework, the environmental requirement
is assessed as the level of positive environmental contribution of each investment
project. The only indicator used, I4, measures this contribution through the evaluation
of 7 environmental key-issues (𝐸𝐾𝐼𝑖). The 7 key issues considered are: (1) waste
management; (2) energy efficiency; (3) water use efficiency; (4) air quality; (5) acoustic
quality; (6) biodiverse city; and, (7) acceptable landscaping.
A score ranging from 1 (very poor) to 5 (very high) depending on the level of
improvement provided by the investment projects is assigned to each issue. The average
of the 5 most highly scored environmental key-issues affected by the HC (see eq. 10) is
used to calculate the environmental contribution (EnC) variable.
𝐸𝑛𝐶 = (∑ 𝐸𝐾𝐼𝑖
5
𝑖=1
) · 𝐻𝐶 [10]
Social Requirement
The Social Requirement evaluates the direct and indirect consequences that any
investment project can generate on the people that use or live with it. With the aim of
having a complete analysis, two criteria were used: C4. Service change and C5.
Surrounding impacts.
The service change criterion (C4) represents the idea that any investment should aim to
change the service given by either improving its quality (Service Quality Improvement
or SQI) or increasing its amount of users (Service Capacity Improvement or SCI),
which corresponds to indicators I5 and I6, respectively.
Indicator I5 (SQI) evaluates the service quality improvement in 5 different key-issues:
(1) security; (2) accessibility/comfort/mobility; (3) culture/education; (4) health/sport;
and (5) social cohesion. A score of 1 to 5, depending on the level of improvement
provided by the investment (according to the attribute-criteria defined in Table 4 that is
assigned to each quality key-issue (𝑄𝐾𝐼𝑖). The average of the 4 most highly scored key-
issues (𝑄𝐾𝐼𝑖) affected by the HC yields 𝑆𝑄𝐼 (see eq. 11), which is used to calculate I5.
𝑆𝑄𝐼 = (∑ 𝑄𝐾𝐼𝑖
4
𝑖=1
) · 𝐻𝐶 [11]
Similarly, the level of user increment (𝑈𝐼𝑛, according to the 1-to-5 attribute-criteria
defined in Table 4) affected by the HC is used to calculate the 𝑆𝐶𝐼 (see eq. 12).
𝑆𝐶𝐼 = 𝑈𝐼𝑛 · HC [12]

The surrounding impacts criterion (C5) is constituted by two indicators, I7 is the
Creation of Employment (CrE) and the I8 is Social Agreement (SoA). The first one
represents the amount of direct and indirect job positions that would be created due to
the implementation and use of the service or infrastructure under analysis (see eq. 13).
The latter somehow evaluates the social acceptance of the proposed investment. The 1-
to-5 attribute-criteria affected by the HC and defined in Table 4) are used to calculate I7
(CrE) and I8 (SoA) by means of the value function presented in table 4.
𝐶𝑟𝐸 = 𝜌1 · 𝐷𝐸𝐼 + 𝜌2 · 𝐷𝐸𝑆 + 𝜌3 · 𝐼𝐸𝑆 [13]
Table 4 – Attribute-criteria for the variables defining the Social Requirement
Variable
Level of improvement in the service quality
Key issues
𝑄𝐾𝐼𝑖 Attribute Points
SQI
security accessibility/comfort/mobility culture/education health/sport social cohesion
Very high 5
High 4
Medium 3
Low 2
Very low 1
Variable Level of users increment (UIn) Points
SCI
Very high 5
High 4
Medium 3
Low 2
Very low 1
Variable DEI
𝝆𝟏 = 𝟎, 𝟐 DES
𝝆𝟐 = 𝟎, 𝟐 IES
𝝆𝟑 = 𝟎, 𝟔 Points
CrE
DEI> 100 DES> 20 IES> 200 5
50 <DEI≤ 100 10 <DES≤ 20 100 <IES≤ 200 4
30 <DEI≤ 50 6 <DES≤ 10 60 <IES≤ 100 3
10 <DEI≤ 30 2 <DES≤ 6 20 <IES≤ 60 2
0 ≤ DEIx≤ 10 0 ≤ DES≤ 2 0 ≤ DES≤ 20 1
Variable Level of social agreement Points
SoA
Very high 5
High 4
Medium 3
Low 2
Very low 1

Value Functions
A value function is proposed for each indicator, in order to transform each evaluation to
a number from 0 to 1, thereby defining equivalences between the different units of the
indicators. The decision-making satisfaction criteria of each indicator involved in the
present study can be satisfactorily represented with decreasing (D) or increasing (I)
functions, these being linear (Lr), concave (Ce), convex (Cx) or S-shaped (S).
Accordingly, Table 5 shows the data and the form of each value function.
Table 5. Parameters and coefficients for each indicator value function
Prioritization Index for Heterogeneous Urban Investments (PIHUI)
The final result of the PIHUI for each investment project is calculated according to
equation 2 as the weighted sum of each indicator, IVj(Pi,x); see eq. 14. As previously
mentioned in section 2, the relative weights of each indicator(𝑤𝐼𝑗), criterion (𝑤𝐶𝑦
) and
requirement (𝑤𝑅𝑡) were calculated by means of the Analytic Hierarchy Process (AHP),
and the indicator IVj(Pi,x) with function values (see Appendix A and B, respectively).
INDICATORS X Xmin Xmax Pi Ci Ki Bi Shape
I1. Annual Unitary Cost AUC 0.0 5.E5 2.50 2.5E5 0.50 1.06 D-S
I2. Implementation Cost ImC 1.0 25.0 1.0 25.0 3.0 1.05 I-Ce
I3. Co-funding CoF 1.0 125.0 2.0 60.0 1.0 1.01 I-S
I4. Environmental Contribution EnC 5.0 125.0 2.0 100.0 2.0 1.05 I-S
I5. Service Quality Improvement SQI 4.0 100.0 2.0 50.0 1.0 1.02 I-S
I6. Service Capacity Improvement SCI 1.0 25.0 1.0 20.0 2.0 1.09 I-Ce
I7. Creation of Employment CrE 1.0 5.0 1.5 5.0 1.0 1.95 I-Cx
I8. Social Agreement SoA 1.0 5.0 1.0 1E4 1.0 2.5E3 I-Lr

PIHUI (P𝑥) = 100 · ∑ wRt· wCy
· wIj· IVj(P𝑥) [1
4]
A PIHUI value ranging between 0 (low priority) and 100 (high priority) prioritizes the
investment projects under evaluation. A qualitative assessment may be assigned to each
project according to the five PIHUI categories presented in table 6 (Pardo-Bosch, F. and
Aguado, A., 2015). The maximum and the minimum contributions to sustainability are
represented by levels A and E, respectively. According to Pardo-Bosch, F. and Aguado,
A. (2015), investment projects can hardly score over 80 due to the highly demanding
requirements of a multi-criteria analysis. Following the same logic, projects with an E
level score are in all likelihood directly rejected beforehand, because of their very low
contribution to sustainable development. Therefore, the projects will generally be
classified at the B, C, and D levels.
Table 6. Levels of PIHUI to classify the projects, ICE (2010) and ASCE (2013).
Level A Level B Level C Level D Level E
100≤ PIHUI <80 80≤ PIHUI <60 60≤ PIHUI <40 40≤ PIHUI <20 20≤ PIHUI <0
Sometimes the contribution of projects to the overall benefit of different scenarios is
highly intertwined and interdependent. According to Bagloee, S. A. and Asadi, M.
(2015), interdependency appears to be an intractable problem, when assessing the
contribution of projects to overall benefits. Thus, earlier studies have generally ignored
this issue or at best, have considered it indirectly, falling short of considering
interdependency.
However, the methodology presented here can be adjusted to account for project inter-
dependence by consecutive iteration once a project has been prioritized. Moreover,

using game-theory, instead of prioritizing individual projects one by one, the most
sustainable group or combination of projects can be prioritized.
4.- CASE STUDY
The feasibility, robustness, and coherence of the PIHUI - MIVES multi-criteria
approach is assessed in this section. To do so, 15 heterogeneous investment projects
under consideration at the Ecology, Urban Planning and Mobility Area of the Municipal
Council of Barcelona are evaluated and prioritized. A complete list of the 15 investment
projects together with a brief description may be found in table 7.
Table 7. List of the 15 heterogeneous public investment projects.
LIST OF INVESTMENTS TO EVALUATE
Nº INVESTMENT PROJECT DESCRIPTION DISTRICT
LOCATION
I-1 Urbanization of area around the new building for social
rehousing.
SANT
ANDREU
I-2 Enlargement of the sidewalk area, moving bar terraces and
motorbikes parking closer to the road EIXAMPLE
I-3 Increase the number and variety of the flora and fauna in
Collserola area.
BARCELONA
CITY
I-4 Optimization of the number and the distribution of the lights
around the city.
BARCELONA
CITY
I-5 Soil expropriation program to develop the larger project of
neighborhood transformations. LES CORTS
I-6 Initial project to collect all the different points of view of
stakeholders, with special social and environmental dimensions. EIXAMPLE
I-7 Works to consolidate the sewer system in the area. SANTS
MONTJUÏC
I-8 Listing the main issues to create a new methodology to evaluate
street variety in the city.
BARCELONA
CITY
I-9 City council program to resolve housing soil problems. BARCELONA
CITY
I-10 Creating a new methodology with a Smart City perspective to
rethink the social space
BARCELONA
CITY
I-11 Implementation of measures to evaluate the efficiency of actual
actions for air quality evaluation.
BARCELONA
CITY
I-12 Social plan for citizens to promote an energy saving culture. BARCELONA
CITY
I-13 Reorganization of public spaces, improving gardens and subway
entrances. GRÀCIA
I-14 Urban road tunnel to redirect Barcelona's traffic at one of the
points of highest traffic density. SANT MARTÍ
I-15 Organization of the area with sustainable and equity perspective
incorporating all stakeholder perspectives. SANT MARTÍ

4.2- Coefficient for the homogenization of the investment alternatives
Figure 1 presents the HC results for each of the 15 investment projects. Note that the
HC values that were obtained ranged between a minimum of 2.7 (for I-7) and a
maximum of 3.9 (for I-1).
Figure 1- Comparison of the HC values obtained for each investment
Among the four variables involved in the evaluation of the HC, the CRB (contribution
to regional balance) makes (according to the decision-makers) the most important
contribution. This variable is defined by the rent level (RL), population density (PD),
and the investment over the last 8 years (Inv). Therefore, the CRB, and consequently the
HC affects the decision in a way that: (1) the greater the investment in recent years in a
specific district, the lower its future investments will be; (2) the higher the density of the
district, the higher the need for future investment; and, finally, (3) the higher the
average district rent, the lower the required investment.
4.3- Decision framework
The decision framework is based on the economic, environmental and social
requirements previously developed in section 3.3. The weights the decision makers
assigned to these requirements using AHP were: 0.20; 0.40 and 0.40, respectively.
Figure 3 the results of prioritization ranking from highest to lowest priority.

Figure 2- Prioritization ranking of the 15 heterogeneous public investment projects.
4.3- Sensitivity study
This section aims to analyze the sensitivity of the methodology that has been developed.
A comparison of the investments ranking is assessed when the assigned weights
(w𝐻𝐶,𝑛) change, in order to study the influence of HC on the prioritization. Table 8
summarizes the 3 cases under study. (Case A represents the current weights chosen by
Barcelona City Council decision makers). As shown in Figure 3, changing the weights
of the four variables involved in defining index HI (CBR, InS, ECS and VaC), within a
range of reasonable values, leads to no major changes in the PIHUI outcome. Some of
the investments changed their priority ranking with the investment immediately above
or below. However, these changes are not significant, which reaffirms the robustness of
the approach.
Table 8- HC variable weights used for the sensitivity analysis
CRB InS ECS VaC
case A 0.48 0.21 0.10 0.21 case B 0.25 0.25 0.25 0.25 case C 0.35 0.35 0.20 0.10
Figure 3- Comparison of the prioritization ranking following changes to the weights of
the HC variables.
The comparison of the ranking of the investments is assessed when the assigned weights
of each requirement (see Table 9) change, in order to study the influence of the
decision-making criteria on the prioritization. In all the cases under study, the HC value
of case A was used. Case A.1 corresponds to the reference case (see section 3) with the
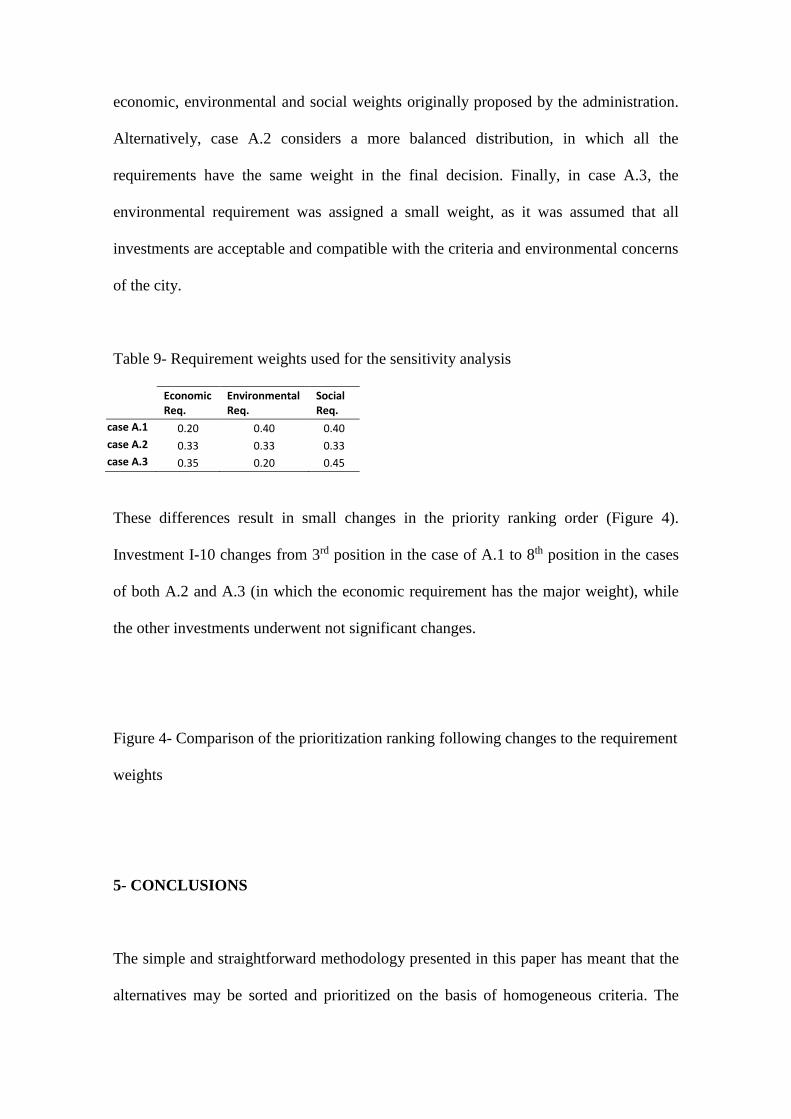
economic, environmental and social weights originally proposed by the administration.
Alternatively, case A.2 considers a more balanced distribution, in which all the
requirements have the same weight in the final decision. Finally, in case A.3, the
environmental requirement was assigned a small weight, as it was assumed that all
investments are acceptable and compatible with the criteria and environmental concerns
of the city.
Table 9- Requirement weights used for the sensitivity analysis
Economic Req.
Environmental Req.
Social Req.
case A.1 0.20 0.40 0.40
case A.2 0.33 0.33 0.33
case A.3 0.35 0.20 0.45
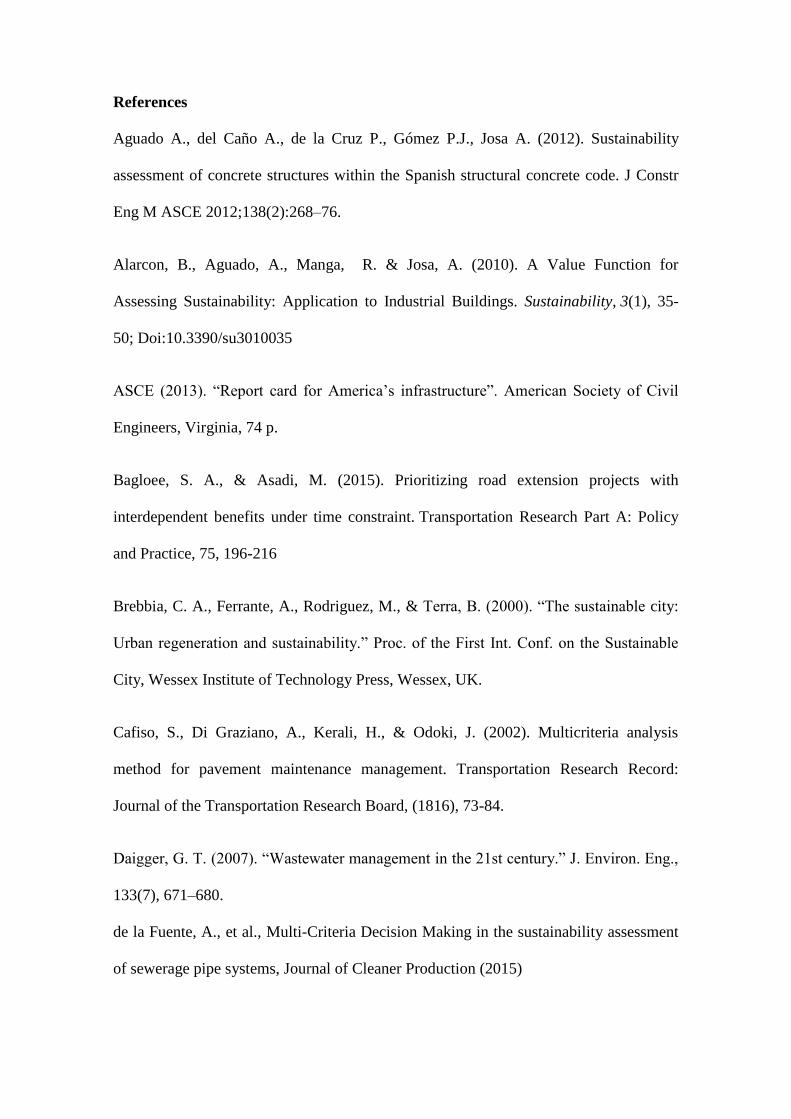
These differences result in small changes in the priority ranking order (Figure 4).
Investment I-10 changes from 3rd position in the case of A.1 to 8th position in the cases
of both A.2 and A.3 (in which the economic requirement has the major weight), while
the other investments underwent not significant changes.
Figure 4- Comparison of the prioritization ranking following changes to the requirement
weights
5- CONCLUSIONS
The simple and straightforward methodology presented in this paper has meant that the
alternatives may be sorted and prioritized on the basis of homogeneous criteria. The

PIHUI index provides a step towards sustainable urban planning in which decisions are
made according to clear, consistent, and transparent criteria.
The MIVES methodology has proven itself to be a proper approach, in order to consider
the main economic, environmental and social aspects in the decision framework.
Moreover, the HC coefficient has been developed, which measures the need of the
society to invest in each public project on the basis of its contribution to the regional
balance of investments, its investment scope, the evaluation of the current situation, and
the values of the city. This represents a meaningful contribution for the evaluation of
heterogeneous investments.
The case study conducted for the Barcelona Ecology, Urban Planning and Mobility
Area has yielded very satisfactory results, showing that accurate, consistent, and
repeatable evaluations can be performed. The method can be simply adapted, if the
decision-makers change the criteria by modifying the weights and the value functions
that are assigned to them. Moreover the robustness of the proposed approach would
make it easily applicable to other cities.

Appendix A.: Analytic Hierarchy Process
Construction of the pairwise comparison matrix
To build the pairwise comparison matrix, the decision maker is asked to rate the
importance of one particular criterion in relation to another in the context of the decision
that is addressed.
Checking the consistency of the pairwise comparison matrix.
Typically, some inconsistencies may arise during the assessment of the comparison of
each alternative (which may cause errors and uncertainty over logical results). The AHP
incorporates an effective technique for checking the consistency of the evaluations
made by the decision maker when building each of the pairwise comparison matrices
involved in the process. In this sense, Saaty introduced the Consistency Ratio (CR) for
the pairwise consistency matrix. If the CR exceeds 10%, it is recommended that the
decision maker revise the elicited preferences. The CR may be calculated using the
Consistency Index (CI) and the Random Index (RI), according to ec.A1.
𝐶𝑅 =
𝐶𝑜𝑛𝑠𝑖𝑠𝑡𝑒𝑛𝑐𝑦 𝐼𝑛𝑑𝑒𝑥
𝑅𝑎𝑛𝑑𝑜𝑚 𝐼𝑛𝑑𝑒𝑥=
𝐶𝐼
𝑅𝐼 [AA.1]
Saaty proposed to compute the Consistency Index (CI) by means of the largest eigen
value (𝜆𝑚𝑎𝑥) and the size (m) of the pairwise comparison matrix, according to eq. AA.2.
𝐼𝐶 = 𝜆𝑚𝑎𝑥 − 𝑛
𝑛 − 1 [AA.2]

The Random Index, i.e. the consistency index when the entries of A are completely
random. The values of RI for small problems (n ≤ 10) are shown in Table AA.1.
Table AA.1 Random Consistency Index (RI)
Matrix size n 1 2 3 4 5 6 7 8 9 10
RI 0.00 0.00 0.58 0.9 1.12 1.24 1.32 1.41 1.45 1.51
Calculate the weights of the variables
A number of methods can be used to estimate the set of weights that are most consistent
with the relativities expressed in the pairwise comparison matrix. Saaty’s basic method
of identifying the value of the weights depends on relatively advanced ideas in matrix
algebra and calculates the weights as the elements in the eigenvector associated with the
maximum eigenvalue of the matrix.
A more straightforward alternative, which also has some theoretical grounding, is to: (1)
calculate the geometric mean of each row in the matrix; (2) total the geometric means;
and, (3) normalize each of the geometric means by dividing each one by the total
calculated in the preceding step. The weights estimated by the two different methods
(taken to a number of significant figures for greater accuracy) are not identical, but it is
common for them to be very close.

Appendix B.: Value Function
The parameters that define the type of function are: Ki, Ci, X max., X min. and Pi. The
value of B that appears in equation 3 is calculated on the basis of the 5 earlier values
(Equation AB.1).
IVi = Bi ∗ [1 − e
−Ki∗(|X−Xmini|
Ci)
Pi
]
[AB.1]
where:
Xmini is the minimum x-axis of the space within which the interventions take
place for the indicator under evaluation.
X is the quantification of the indicator under evaluation (different or
otherwise, for each intervention).
Pi is a form factor that defines whether the curve is concave, convex, linear or
an “S” shape: concave curves are obtained for values of Pi < 1, convex and
“S” shaped forms for Pi > 1 and almost straight lines for values of Pi = 1.
In addition, Pi gives an approximation of the slope of the curve at the
inflection point.
Ci approximates the x-axis of the inflection point.
Ki approximates the ordinate of the inflection point.
Bi is the factor that allows the function to be maintained within the value
range of 0 to 1. This factor is defined by equation AB.2.

Bi = [1 − e−Ki∗(
|Xmaxi−Xmini|
Ci)
Pi
]
−1
[AB.2]
where: Xmax is the x-axis of the indicator that generates a value equal to 1 (in the case of
functions with increasing values).
Alternatively, functions with decreasing values may be used: i.e. they adopt the
maximum value at Xmin. The only difference in the value function is that the variable
Xmin is replaced by the variable Xmax, adapting the corresponding mathematical
expression.
Acknowledgments
The authors would like to thank the Urban Ecology section of Barcelona Municipal
Council for the material and technical assistance, in particular, Francisco Ullod, Oriol
Artisench, Tomas Gea and Montserrat Dominguez for their initiative, active
collaboration, and constant support during the project. Likewise, the authors are
thankful for the initial contribution of J.J. Rosell and infrastructures.cat. Finally, the first
author acknowledges the PDJ grant provided by the Departament d’Universitats,
Recerca i Societat de la Informació of the Generalitat de Catalunya.
References
Aguado A., del Caño A., de la Cruz P., Gómez P.J., Josa A. (2012). Sustainability
assessment of concrete structures within the Spanish structural concrete code. J Constr
Eng M ASCE 2012;138(2):268–76.
Alarcon, B., Aguado, A., Manga, R. & Josa, A. (2010). A Value Function for
Assessing Sustainability: Application to Industrial Buildings. Sustainability, 3(1), 35-
50; Doi:10.3390/su3010035
ASCE (2013). “Report card for America’s infrastructure”. American Society of Civil
Engineers, Virginia, 74 p.
Bagloee, S. A., & Asadi, M. (2015). Prioritizing road extension projects with
interdependent benefits under time constraint. Transportation Research Part A: Policy
and Practice, 75, 196-216
Brebbia, C. A., Ferrante, A., Rodriguez, M., & Terra, B. (2000). “The sustainable city:
Urban regeneration and sustainability.” Proc. of the First Int. Conf. on the Sustainable
City, Wessex Institute of Technology Press, Wessex, UK.
Cafiso, S., Di Graziano, A., Kerali, H., & Odoki, J. (2002). Multicriteria analysis
method for pavement maintenance management. Transportation Research Record:
Journal of the Transportation Research Board, (1816), 73-84.
Daigger, G. T. (2007). “Wastewater management in the 21st century.” J. Environ. Eng.,
133(7), 671–680.
de la Fuente, A., et al., Multi-Criteria Decision Making in the sustainability assessment
of sewerage pipe systems, Journal of Cleaner Production (2015)

Dodgson, J. S., Spackman, M., Pearman, A., & Phillips, L. D. (2009). Multi-criteria
analysis: a manual. Department for Communities and Local Government: London.
Kabir, G., Sadiq, R., and Tesfamariam, S. (2013). “A review of multi-criteria decision-
making methods for infrastructure management”. Structure and Infrastructure
Engineering, 10 (9), 1176-1210. doi:10.1080/15732479.2013.795978
ICE (2010). “The state of the nation infrastructure. Infrastructure 2010”. Institute of
Civil Engineers, London, 23 p.
Lee, G. K. L., and Chan, E. H. W. (2008). “Factors affecting urban renewal in high-
density city: Case study of Hong Kong.” J. Urban Plann. Dev., 134(3), 140–148.
Pardo-Bosch, F. and Aguado, A. (2015). “Investment priorities for the management of
hydraulic structures”. Structure and Infrastructure Engineering: Maintenance,
Management, Life-Cycle Design and Performance, 11(10), 1338-1351. doi: 10.1080 /
15732479.2014.964267
Pardo-Bosch, F., & Aguado, A. (2016). Sustainability as the key to prioritize
investments in public infrastructures. Environmental Impact Assessment. (submitted)
Pons O., & Aguado A. (2012) Integrated value model for sustainable assessment
applied to technologies used to build schools in Catalonia, Spain. Build Environ
2012;53:49–58.
Saaty, T. (1980) The Analytical Hierarchy Process, John Wiley, New York.
San-José J. T., & Cuadrado J. (2010) Industrial building design stage based on a system
approach to their environmental sustainability. Constr Build Mater 2010;24(4):438–47.

Tiwari, P. (2003). “Sustainable practices to meet shelter needs in India.” J. Urban Plann.
Dev., 129(2), 65–83.
United Nations (2005). Resolution Adopted by the General Assembly, p. 2, 60/1. World
Summit Outcome.
Viñolas B., Aguado A., Josa A., Villegas N., Fernández M. A. (2009) Application of the
value analysis for the integral and objective assessment of university professors. Revista
de universidad y sociedad del conocimiento 2009;6(1):22–37.
Wallbaum, H., Krank, S., and Teloh, R. (2011). "Prioritizing Sustainability Criteria in
Urban Planning Processes: Methodology Application." J. Urban Plann. Dev.,
10.1061/(ASCE)UP.1943-5444.0000038, 20-28.
Williams, M. (2009). Introducción a la Gestión de proyectos [The principles of project
management]. Anaya, Madrid, Spain, 224 pp.
Yin, Y., Madanat, S. M., & Lu, X. Y. (2009). Robust improvement schemes for road
networks under demand uncertainty. European Journal of Operational Research, 198,
470e479.
Zhang, Z., Singh, N., & Hudson, W. R. (1993b). Comprehensive ranking index for
flexible pavement using fuzzy sets model. Transportation Research Board, TRR 1397,
96-102.