mobile broadband spectrum demand
TRANSCRIPT
Mobile Broadband Spectrum Demand
December 2008
Copyright ©2008 Rysavy Research, LLC. All rights reserved.
http://www.rysavy.com
2 Mobile Broadband Spectrum Demand
Table of Contents
EXECUTIVE SUMMARY ............................................................................................ 3
FORWARD BY PROFESSOR WILLIAM WEBB............................................................ 4
1 INTRODUCTION............................................................................................... 5
2 MARKET FACTORS............................................................................................ 5
2.1 CRITICAL MASS-MARKET ADOPTION ..................................................................... 6 2.2 USE OF HIGH-BANDWIDTH DATA APPLICATIONS........................................................ 6 2.3 TRUE MOBILE BROADBAND USER EXPERIENCE .......................................................... 7 2.4 SMARTPHONE EFFECT....................................................................................... 8 2.5 APPLICATION INNOVATION EFFECT........................................................................ 9 2.6 INNOVATIVE PRICING......................................................................................10 2.7 FIXED-MOBILE SUBSTITUTION AND FIXED-MOBILE CONVERGENCE..................................10
3 QUANTITATIVE ANALYSIS............................................................................. 11
3.1 GROWTH IN IP TRAFFIC...................................................................................11 3.2 CURRENT MOBILE DATA GROWTH .......................................................................11 3.3 PROJECTED MOBILE DATA GROWTH .....................................................................12 3.4 CAPACITY OF WIRELESS NETWORKS RELATIVE TO APPLICATION DEMAND ..........................13 3.5 MONTHLY USAGE ANALYSIS ..............................................................................16 3.6 CAPACITY OF WIRELESS NETWORKS RELATIVE TO AVERAGE SUBSCRIBER USAGE .................18
4 OTHER SPECTRUM CONSIDERATIONS............................................................ 20
4.1 NEEDS OF ADVANCED TECHNOLOGY .....................................................................20 4.2 CONSUMER EXPECTATIONS ...............................................................................21 4.3 NEW WIRELESS ARCHITECTURES AND SPECTRUM IMPLICATIONS ....................................22 4.4 SPECTRUM ANALYSIS BY OTHER ORGANIZATIONS .....................................................23
5 CONCLUSION................................................................................................. 24
Rysavy Research provides this document and the information contained herein to you for informational purposes only. Rysavy Research provides this information solely on the basis that you will take responsibility for making your own assessments of the information.
Although Rysavy Research has exercised reasonable care in providing this information to you, Rysavy Research does not warrant that the information is error-free. Rysavy Research disclaims and, in no event, shall be liable for any losses or damages of any kind, whether direct, indirect, incidental, consequential, or punitive arising out of or in any way related to the use of the information.
3 Mobile Broadband Spectrum Demand
Executive Summary The convergence of the Internet and mobile computing is accelerating the consumption of licensed spectrum. For example, watching a YouTube video on a mobile phone or wireless enabled laptop consumes almost one hundred times the data bandwidth of a mobile voice call. And whereas a mobile voice call typically consumes 6 – 12 kbps, enhanced high‐speed mobile Internet access consumes up to 5 Mbps on today’s deployed networks. Thus, within the next decade, licensing significant amounts of additional spectrum will be imperative if the United States wants its mobile operators to continue expanding and upgrading the country’s wireless broadband networks.
Other organizations have studied the spectrum needs of emerging wireless networks in depth including an ITU report that projects a total national spectrum requirement of as much as 840 MHz by 2010, 1300 MHz by 2015 and 1720 MHz by the year 2020. These amounts far exceed currently available spectrum. Unlike the ITU Report, this report does not identify how much licensed spectrum will be needed, nor what bands are optimal, to ensure U.S. mobile networks stay ahead of exploding consumer demand. Rather, this report explains the dynamics of the U.S. mobile industry, including the trends behind the growth of the mobile broadband market, and quantifies the amount of data and spectrum consumed by new devices and applications.
Whereas previous wireless networks offered a somewhat sluggish data experience, third generation networks are providing users a true broadband experience. Faster speeds, as made available with 3G and other emerging wireless technologies, translate directly to user satisfaction. Current usage trends confirm this reality. Ericsson, a leading 3G infrastructure vendor, indicates data traffic is already three times the voice traffic on some UMTS networks they have measured within the last twelve months. A leading national wireless broadband provider predicts that by 2018, 3G/4G mobile data traffic will expand by a factor of 250 (conservative estimate) to 600 (aggressive estimate). In contrast, mobile voice traffic is expected to “only” triple in that same period.
The capacity of a wireless network (and therefore the network’s ability to support wireless broadband services and applications) in any given location depends on spectral efficiency, as well as the amount of spectrum the operator has available. Mobile network operators are currently implementing or considering various mechanisms to maximize capacity by managing bandwidth consumption in the absence of access to more licensed spectrum. While engineering greater spectral efficiency and building more cell sites will increase capacity, alone they are unlikely to address the expected magnitude of the demand. Long term, more spectrum is needed to enable U.S. mobile network operators to keep pace with consumer demand for more and faster mobile broadband.
In addition to helping providers match demand, making more commercial licensed spectrum available will facilitate the deployment of new wireless technologies that benefit from deployment across wide radio channels. However, allocating wider channels in existing, licensed spectrum bands to accommodate new technologies, while continuing to support legacy technologies, is technically and operationally difficult. This is because operators typically do not have large blocks of unused spectrum they can access across their coverage areas. Thus, deployment of new technologies will be greatly simplified if done through new, licensed bands. As it has throughout the history of the wireless industry, this additional deployment and expansion of network capabilities will support a robust cycle of innovation. Just as the Internet has provided fertile ground for new applications, it is inevitable that a mobile Internet will spur comparable, if not greater innovation. For example, there are over 10,000 applications for the iPhone, even though the developer tools were made available just this year.
Mobile broadband networks can only meet consumer demands for more and faster mobile broadband through access to more licensed spectrum, and deployment of more infrastructure. Given the long timeframes involved in going from planning to auction to deployment, planning for new licensed spectrum should begin as soon as possible.
4 Mobile Broadband Spectrum Demand
Forward by Professor William Webb Professor William Webb, FIEEE Head of Research and Development, Ofcom London, England Author, "Wireless Communications: The Future" and "Essentials of Modern Spectrum Management"
It appears that the time has finally come for wireless data services. After many years of hopes and false starts, the use of cellular‐data cards for laptops and inbuilt data capabilities in smart phones is growing rapidly. This in turn is dramatically increasing the traffic flow across wireless networks, both cellular and Wi‐Fi. It is difficult to predict how long this growth will continue for and difficult to know how well placed operators are to make use of network enhancements and smaller cells to accommodate this traffic. If traffic growth continues as predicted there is a strong likelihood that cellular operators around the world will face increased capacity constraints. This report helps provide further evidence as to the extent of the growth and discusses possible solutions to the problem. As such it is a valuable contribution to a debate which will unfold over the coming months and years.
This report suggests that a key part of the solution to resolving this will lie in operators gaining access to additional spectrum; however, as explained in the Report, more spectrum will only be part of the solution. As they are in the process of doing in the U.S., operators will also need to explore new, more efficient technologies, or new architectures, such as picocells and femtocells and decide on the best balance of all of these solutions to deliver sufficient network capacity.
Many entities are interested in more spectrum but those that value it the most will be the ones who can quickly put the spectrum to use and earn the greatest return on the capital they invest. Ensuring that spectrum is made available to those that value it the most and in a timely manner is the role of the national regulator ‐ the FCC in the US, Ofcom in the UK, etc. Some of the most progressive regulators are making use of the market to achieve this; using auctions as the only effective and transparent way to ensure that cleared spectrum goes to those that can generate the greatest value from it and trading to allow spectrum that is in use to change ownership as optimal uses change over time. Maximum flexibility is achieved through a "technology and policy neutral" approach that allows any piece of spectrum to be used by any technology and without associated policy constraints such as the need to provide services to particular sets of users or communities (these important requirements can be addressed in other ways).
The final piece in this puzzle is a recognition that spectrum in the frequency bands below around 4‐5GHz (with important exceptions) is generally more valuable used in a licensed application rather than license‐exempt or "spectrum commons." Research in the UK has shown that licensed applications such as cellular and broadcasting generate far more value to the economy than commons usage – in the case of the UK only 1% of the total value from the use of spectrum was generated by commons usage such as Wi‐Fi. Other developed countries are likely to see similar numbers. Since most commons usage is short range it therefore makes sense to place it above the frequencies that are readily usable for cellular and broadcasting. However, bands such as at 2.4 GHz are an exception to this because they would be of limited use to cellular due to the interference already occurring in the band. In passing, it is also worth noting that while innovation occurs in commons it also happens in licensed bands, and indeed many of the most important innovations of the last decade such as GPS, wireless email, mobile TV, texting and more have all occurred in licensed spectrum.
Cellular communications provides great economic value to a country and the addition of high‐speed data capabilities can only increase that value. Ensuring that there are as few barriers as possible to its widespread deployment should help grow this value much further to the benefit of all in the country. Any work that can help inform this is a valuable contribution to the debate.

1 Introduction Wireless technology upholds a vibrant industry at the heart of the American information economy with more than 264 million subscribers in the US today. A recent CTIA study anticipates that the total value of mobile broadband and voice services will exceed $427 billion by the year 2016, contributing $860 billion to the Gross Domestic Product over the next ten years.1 Increasingly, subscribers are using mobile‐data services with non‐voice revenue growing 40% in the first six months of 2008.2
The confluence of the Internet and mobile/wireless computing is accelerating the consumption of spectrum. With data applications able to consume far more bandwidth than voice and with an increasing number of mobile users engaging in ever more bandwidth‐intensive applications, it is only a matter of time before current commercial mobile‐radio spectrum is exhausted.
This report summarizes the market factors behind the growth of mobile broadband including items such as critical mass‐market adoption, use of high‐bandwidth applications, smartphone platforms that facilitate and stimulate demand for mobile data applications, innovative pricing, and accelerating fixed‐mobile substitution. This report also provides a quantitative analysis of demand for licensed spectrum and discusses the spectrum needs of advanced technologies.
Within the next decade, significant amounts of additional licensed spectrum will be imperative for expanding networks towards a ubiquitous mobile Internet, one that provides national economic advantages and that helps provide broadband to every American.
While some operators have attempted to use unlicensed spectrum to augment or take the place of wide‐area, licensed mobile‐broadband networks (e.g., municipal and metro Wi‐Fi networks), these “unlicensed” networks have experienced technical and business difficulties including poor indoor coverage. Therefore, they remain an unproven solution to expected demand for more spectrum. The focus of this report is thus on licensed spectrum and the US mobile networks that depend on it.
2 Market Factors We are at a unique and pivotal time in history, in which technology capability, consumer awareness and comfort with emerging wireless technology, and industry innovation are converging to create mass‐market acceptance of mobile broadband. These market factors are acting multiplicatively to accelerate usage of spectrum‐based services. The Sr. VP of Engineering and Operations at T‐Mobile recently stated “We are on the verge of an explosion in mobile broadband.”3
The market factors contributing to this impending explosion are shown in the following figure and are discussed below.
1 “Study Shows U.S. Economy Gets Major Boost from Wireless Broadband,” May 29, 2008 http://www.ctia.org/media/press/body.cfm/prid/1755.
2 Statistics released by CTIA 9‐12‐2008 at the CTIA WIRELESS I.T. & Entertainment 2008 show.
3 Neville Ray, Sr. VP of Engineering and Operations, Operator Panel, 3G Americas Analyst Conference, Dallas, October 14, 2008.

Figure 1: Multiplicative Effect of Multiple Market Factors
2.1 Critical MassMarket Adoption
With the percentage of wireless users taking advantage of the mobile Internet growing quickly, the market is reaching critical mass, in which the expanding market justifies significant investment by large companies. Recent entrants such as Apple (iPhone) and Google (Android smartphone platform) are two visible examples. As of May 2008, the number of active users of mobile Internet services in the US had doubled to 40 million users from just two years previously.4 A far greater number already use text messaging and are poised to start engaging in more sophisticated services. Ericsson predicts that mobile broadband subscriptions will match wireline broadband subscriptions on a global basis by 2009 and will exceed wireline by a factor of four by 2013.5
The result is a rapidly expanding customer base that encourages business investment in new networks, in new devices and in new applications, thus further fueling market growth.
2.2 Use of HighBandwidth Data Applications
Whereas wireless network deployments were initially driven by voice usage, it is wireless‐data applications that are now primarily driving capacity demand. On latest‐generation networks, data applications recently started to account for more traffic than voice. Popular applications such as mobile video are particularly data intensive. For example, watching a YouTube video on a mobile phone or laptop consumes almost one hundred times the data bandwidth of a voice conversation. Downloading a Microsoft PowerPoint file of five‐megabyte (Mbyte) size to view it on a phone or laptop consumes the same amount of data on the downlink as speaking on a phone for more than an hour. Later sections in this report examine these application impacts in detail.
4 Critical Mass ‐ The Worldwide State of the Mobile Web, Nielsen Mobile, July 2008.
5 Ericsson, North American Investor Relations Forum, Boston August 14, 2008.
6 Mobile Broadband Spectrum Demand
7 Mobile Broadband Spectrum Demand
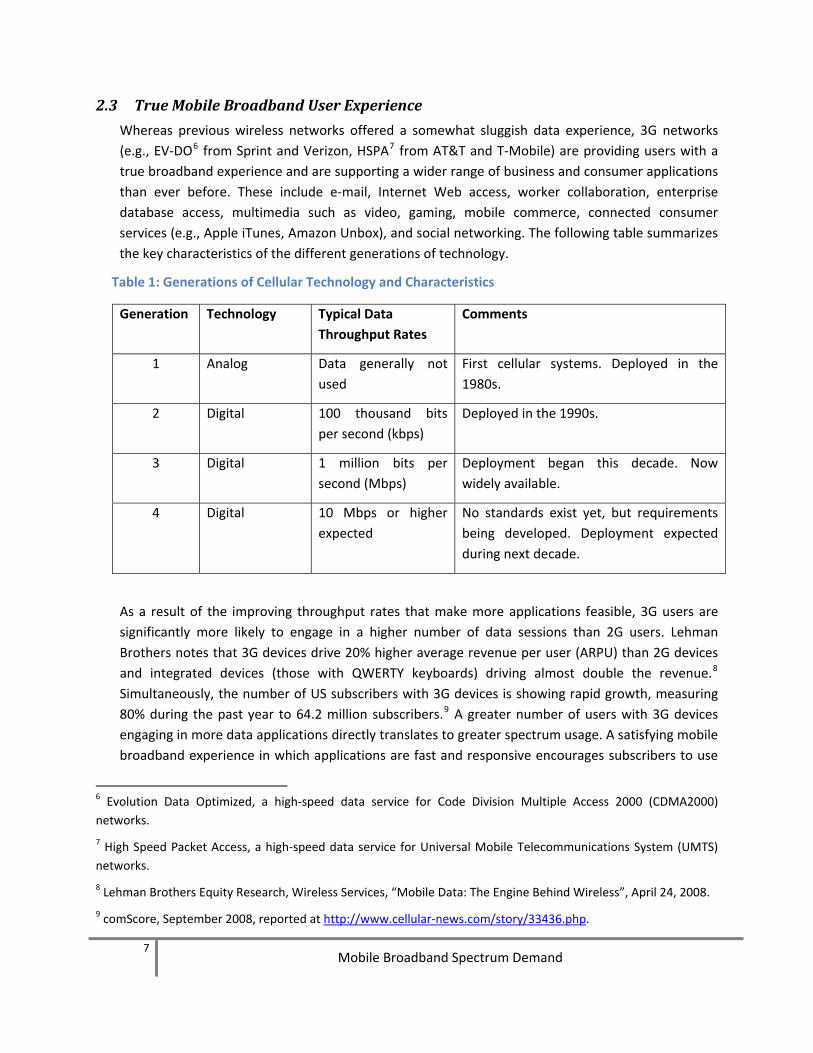
2.3 True Mobile Broadband User Experience
Whereas previous wireless networks offered a somewhat sluggish data experience, 3G networks (e.g., EV‐DO6 from Sprint and Verizon, HSPA7 from AT&T and T‐Mobile) are providing users with a true broadband experience and are supporting a wider range of business and consumer applications than ever before. These include e‐mail, Internet Web access, worker collaboration, enterprise database access, multimedia such as video, gaming, mobile commerce, connected consumer services (e.g., Apple iTunes, Amazon Unbox), and social networking. The following table summarizes the key characteristics of the different generations of technology.
Table 1: Generations of Cellular Technology and Characteristics
Generation Technology Typical Data Throughput Rates
Comments
1 Analog Data generally not used
First cellular systems. Deployed in the 1980s.
2 Digital 100 thousand bits per second (kbps)
Deployed in the 1990s.
3 Digital 1 million bits per second (Mbps)
Deployment began this decade. Now widely available.
4 Digital 10 Mbps or higher expected
No standards exist yet, but requirements being developed. Deployment expected during next decade.
As a result of the improving throughput rates that make more applications feasible, 3G users are significantly more likely to engage in a higher number of data sessions than 2G users. Lehman Brothers notes that 3G devices drive 20% higher average revenue per user (ARPU) than 2G devices and integrated devices (those with QWERTY keyboards) driving almost double the revenue.8 Simultaneously, the number of US subscribers with 3G devices is showing rapid growth, measuring 80% during the past year to 64.2 million subscribers.9 A greater number of users with 3G devices engaging in more data applications directly translates to greater spectrum usage. A satisfying mobile broadband experience in which applications are fast and responsive encourages subscribers to use
6 Evolution Data Optimized, a high‐speed data service for Code Division Multiple Access 2000 (CDMA2000) networks.
7 High Speed Packet Access, a high‐speed data service for Universal Mobile Telecommunications System (UMTS) networks.
8 Lehman Brothers Equity Research, Wireless Services, “Mobile Data: The Engine Behind Wireless”, April 24, 2008.
9 comScore, September 2008, reported at http://www.cellular‐news.com/story/33436.php.
8 Mobile Broadband Spectrum Demand
more data applications. This, in turn, drives operators to expand their 3G network deployments, as well as to enhance network capability, which then encourages developers to build new mobile‐data applications. For example, there are already more than 10,000 applications for the iPhone, even though the developer tools were only made available for it this year.10
According to Nielsen, faster speeds, as made available with 3G and other emerging wireless technologies, translate directly to user satisfaction, “As with PC Internet use, faster data transfer speeds closely relate to consumer satisfaction and will help to drive overall interest and adoption of the platform.”11 With “4G platforms”12 soon to be deployed, user experiences will continue to improve, further stimulating usage.
We are witnessing the culmination of massive network investment, technology innovation and development, spectrum deployment, and user sophistication. Continued growth, however, depends on operators’ ability to keep providing users with satisfying network performance. If networks become overloaded, the result is slower and more erratic throughput speeds, packet delays, unreliable application behavior, and disconnects.
2.4 Smartphone Effect
The use of smartphones, phones that incorporate computer and Internet capability and that can run a wide range of data applications, is surging. This is because an expanding 3G network footprint can now fully support their capabilities and, with rising volumes and economies of scale, they are much more affordable, with many models now priced around $100. Merrill Lynch anticipates that 40% of phones could be smartphones by 2010.13 The RIM BlackBerry, which owns a significant share of the smartphone market, has revealed the huge demand for wireless e‐mail, as well as other applications such as mobile Web browsing. Similarly, Apple’s iPhone demonstrates how a powerful handheld computer that has an intuitive user interface can stimulate usage. Nielsen’s studies show iPhone users are five times more likely to use the mobile Internet than the average mobile consumer.14 Wireless Week reports Ralph de la Vega, CEO of AT&T Mobility, as saying that “95% of iPhone users regularly surf the Internet with their phones and 51% of iPhone users watch videos on YouTube.”15
10 http://www.10000iphoneapplications.com/.
11 Critical Mass ‐ The Worldwide State of the Mobile Web, Nielsen Mobile, July 2008.
12 At this time, there is no formal definition of 4G. 4G requirements will be effectively defined in an International Telecommunications (ITU) project called International Mobile Telephone Advanced (IMT‐Advanced), with requirements expected in 2008 and first compliant networks expected around 2012. Nevertheless, systems such as WiMAX and Long Term Evolution (LTE) are called 4G platforms, since they will be enhanced in subsequent versions to meet IMT Advanced requirements.
13 Merrill Lynch, Global Wireless Matrix, 1Q08, July 18, 2008.
14 Critical Mass ‐ The Worldwide State of the Mobile Web, Nielsen Mobile, July 2008.
15 http://www.wirelessweek.com/article.aspx?id=161884.

9 Mobile Broadband Spectrum Demand
Goldman Sachs reports smartphone users as the mobile data leaders with 88% using their device for non‐calling activity.16
Other successful smartphone platforms include Windows Mobile, Palm OS and Symbian. Google’s new Android platform for smartphones is another example of the intense development occurring in handheld, mobile‐computing capabilities. This is especially relevant with one study predicting that by 2020 mobile phones will be the primary Internet devices for most people in the world.17
2.5 Application Innovation Effect
When companies began deploying broadband networks, nobody envisioned an application such as YouTube. But capability encourages innovation. Just as the Internet has provided fertile ground for new applications, it is inevitable that mobile broadband networks will spur comparable, if not greater, innovation. This occurs through a virtuous cycle in which more capable networks enable more applications, attracting greater usage and subscription rates, encouraging more developers to create better applications and devices, further stimulating demand and market growth. Operators, seeing a significant business opportunity, are emphasizing data services in their promotions, offers, and device features.
Furthermore, since mobile broadband networks and the Internet are increasingly intertwined, innovation in one readily extends to the other. Some of the key applications that appear to be driving mass‐market adoption of wireless broadband include mobile video, social networking, enterprise productivity, user‐generated content, instant messaging, location‐based services, and Web 2.0 applications.18 Users, particularly younger ones, are expecting the same Internet experience on their mobile devices as that available on desktop systems and vendors are responding. Opera, a leading mobile‐browser vendor, announced in September 2008 that its new browser will “bring the full desktop Web‐browsing experience including support for JavaScript, accelerated vector, and video content to smartphones and mobile Internet devices.”19
Using next‐generation infrastructure enhancements such as IP Multimedia Subsystem (IMS), operators will be able to make data services even more attractive by allowing applications to combine multiple types of communications and information dynamically including messaging, location, push‐to‐talk and video. For example, users will be able to start an instant‐messaging chat session and, in mid‐session, add voice or video communications. AT&T already offers a video‐sharing application based on IMS. These IMS applications, particularly video, will further increase spectrum usage.
16 The Goldman Sachs Group, Inc., Americas: Wireless¸ Mobile Data 1.1 – Recent Data Points Strengthen the Theme, June 2008.
17 Pew Internet & American Life Project, The Future of the Internet III, December 14, 2009.
18 Web 2.0 refers to technologies enabling rich Internet applications with dynamic and interactive content.
19 http://www.opera.com/pressreleases/en/2008/09/09/.
10 Mobile Broadband Spectrum Demand
2.6 Innovative Pricing
Many early service plans for wireless data, as well as voice, were based on usage. In 1998, AT&T Wireless introduced the first bucket plan called Digital One Rate, a plan that provided subscribers with a large number of voice minutes combined with no long distance or roaming charges. Usage surged and other operators quickly offered similar plans. Today, most pricing plans follow this model.
Similarly, flat‐rate pricing plans for modem cards and smartphones have resulted in user acceptance of mobile data and have significantly increased data consumption.20
2.7 FixedMobile Substitution and FixedMobile Convergence
In significant and increasing percentages, people are substituting mobile phones for their fixed‐line phones. The Center for Disease Control and Prevention’s National Center for Health Statistics on December 17, 2008 announced in preliminary results that during the first six months of 2008, nearly 17.5% of Americans were wireless only.21 This is consistent with a Nielsen report that by June 2008, 17.1 percent of US households had substituted a wireless phone for their landline phone with an annual growth of three‐four percent.22
Similarly, users are starting to use mobile broadband connections to the Internet as an alternative to wireline connections such as DSL. If people are already paying for wireless Internet service, they are reluctant to pay separately for wired Internet. Nielsen asserts, “Clearly, Internet access is the next frontier of wireless substitution.”23 Morgan Stanley makes the following statements, “We are also starting to see the early signs of wireless data substitution, as laptop cards and smartphones proliferate. The rollouts of WiMAX and LTE will make wireless data substitution even more compelling. Sweden & Austria have seen a significant impact on DSL adds from mobile broadband. Mobile broadband accounted for more than 70% of total broadband adds in Austria last year.”24
Furthermore, a large number of people with access to mobile broadband services may not have access to wireline services. This is where wireless technology can address the “digital divide” for broadband services. In fact, this is already happening for voice services. The Nielsen study reports that many voice substitutors are in lower‐income brackets (46% having a household income of $50,000 or less).
Lastly, today’s teenagers live and breathe by their mobile phones using them for voice, messaging and, increasingly, for sophisticated social networking features. Web‐centric mobile applications are
20 Note that flat‐rate pricing plans do have terms of service that apply some restrictions, such as a monthly cap.
21 http://www.cdc.gov/nchs/data/nhis/earlyrelease/wireless200812.htm.
22 Nielsen, “Call My Cell: Wireless Substitution in the United States,” September 2008.
23 Nielsen, “Call My Cell: Wireless Substitution in the United States,” September 2008.
24 Morgan Stanley, Telecom Services “Cutting the Cord: Voice First, Broadband Close Behind.” October 1, 2008.
11 Mobile Broadband Spectrum Demand
of greater interest to people under 25 than any other age group.25 Many of these younger people may never have any interest in a wireline connection.
Another market driver for spectrum consumption is fixed‐mobile convergence (FMC), referring to the ability to use mobile devices in a stationary (e.g., home) environment by connecting to local access points either via Wi‐Fi or via licensed commercial mobile radio spectrum using femto cells. There are a variety of architectural approaches for providing FMC, but the net effect is that users will increasingly use their mobile devices in all environments and for all communications, thus further stimulating spectrum demand.
3 Quantitative Analysis Increased mobile broadband use such as from the proliferation of smartphones with a consumer‐friendly form factor is already having a noticeable impact on existing networks. Yankee Group recently stated, “Few operators today are capacity challenged but they anticipate they will be, and some operators anticipate this with urgency.”26
There are a variety of of metrics available to substantiate the increasing amounts of data and spectrum that wireless applications are consuming. Such an analysis provides insight into the capacity and limits of today’s networks and available spectrum.
Since wireless operators do not disclose the precise amount of traffic and loading on their networks, this section uses a variety of other information to assess the demand being placed on spectrum. This includes the general growth of Internet Protocol (IP) traffic, current and projected mobile data growth, and the capacity of wireless networks relative to application and subscriber demands.
3.1 Growth in IP Traffic
There is tremendous growth in the overall amount of global Internet Protocol (IP) traffic. Cisco projects a doubling of IP traffic every two years through 2012.27 This growth will be through combination of bandwidth‐intensive applications such as video distribution, and from general Internet usage. With mobile Internet connectivity becoming the primary wireless application, Internet traffic growth translates to mobile broadband traffic growth, but at an even faster rate due to a rapidly growing base of users.
3.2 Current Mobile Data Growth
Mobile operators are already experiencing notable volumes of data traffic on their networks. Some examples of the current growth in mobile broadband data traffic follow. Ericsson, a leading 3G‐
25 Alcatel Lucent, Enriching Communications Magazine, “North America Entering Era of Integrated Business and
Technological Innovation”, http://www.alcatel‐lucent.com/enrich/v2i22008/article_c1a6.html?l=en.
26 Yankee Group Webcast, “Finding a Femto Future”, June 26, 2008.
27 Cisco, “Approaching the Zettabyte Era”, June 16, 2008.
12 Mobile Broadband Spectrum Demand
infrastructure vendor, indicates that data traffic is already three times voice traffic on UMTS networks they have measured with the previous 12 months experiencing more than a doubling of data traffic.28 Ofcom, the independent regulator and competition authority for the UK’s communications industries, provides data on two European operators in a recent report showing that data traffic on H3G’s network grew by a factor of seven in a six‐month period ending March 2008, and that Vodafone is experiencing similar growth with data traffic exceeding voice traffic.29 These examples demonstrate the rapid growth in mobile broadband traffic already occurring. The next section looks at how such growth will continue into the future.
3.3 Projected Mobile Data Growth
AT&T projects (against a baseline of 2G data traffic in 2007) that by 2018 3G/4G traffic will expand by a factor of 250 (conservative estimate) to 600 (aggressive estimate).30 In contrast, AT&T shows voice traffic tripling during that same period. In other words, data traffic will grow at a rate about one hundred times greater than voice traffic over the next ten years. A CAGR (Compound Annual Growth Rate) analysis of the AT&T figures shows between 130 and 170% CAGR of data between 2007 and 2010, and between 65% and 80% CAGR between 2007 and 2018. Cisco projects 125% CAGR growth in mobile broadband traffic through 2012.31 The importance of these growth rates is that it is unlikely that operators will be able to deliver satisfactory service in the future at these high‐traffic volumes using existing spectrum.
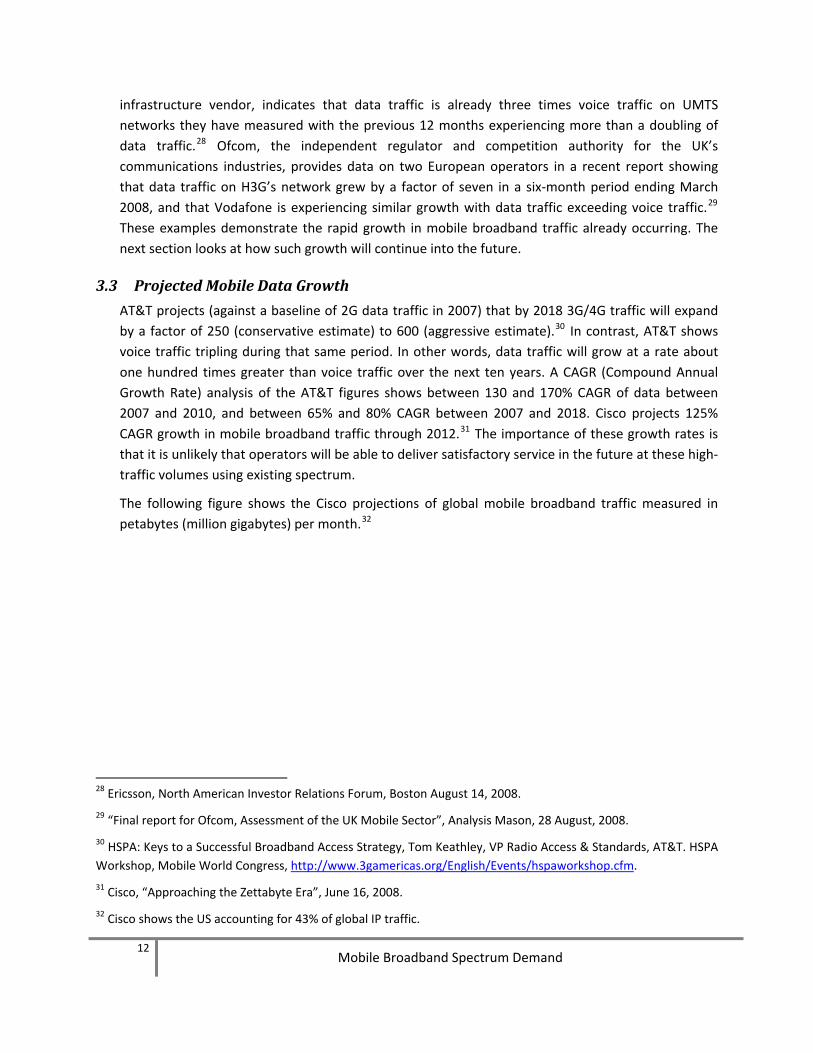
The following figure shows the Cisco projections of global mobile broadband traffic measured in petabytes (million gigabytes) per month.32
28 Ericsson, North American Investor Relations Forum, Boston August 14, 2008.
29 “Final report for Ofcom, Assessment of the UK Mobile Sector”, Analysis Mason, 28 August, 2008.
30 HSPA: Keys to a Successful Broadband Access Strategy, Tom Keathley, VP Radio Access & Standards, AT&T. HSPA Workshop, Mobile World Congress, http://www.3gamericas.org/English/Events/hspaworkshop.cfm.
31 Cisco, “Approaching the Zettabyte Era”, June 16, 2008.
32 Cisco shows the US accounting for 43% of global IP traffic.
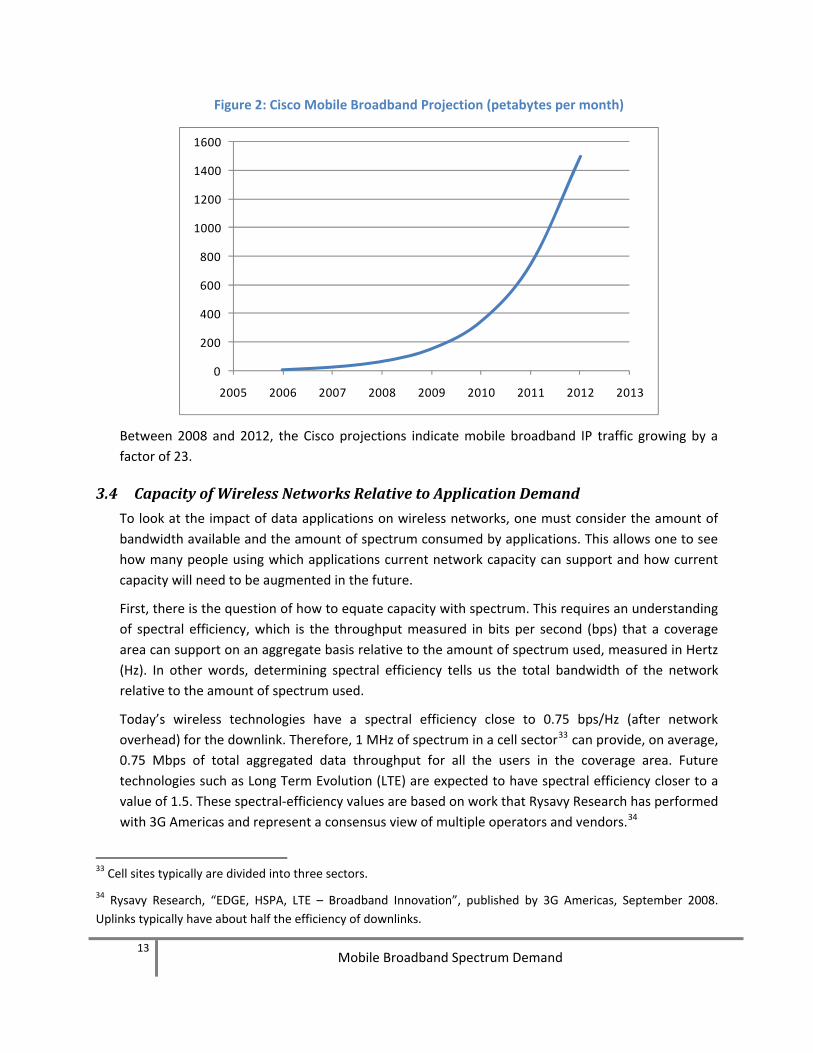
Figure 2: Cisco Mobile Broadband Projection (petabytes per month)
0
200
400
600
800
1000
1200
1400
1600
2005 2006 2007 2008 2009 2010 2011 2012 2013
Between 2008 and 2012, the Cisco projections indicate mobile broadband IP traffic growing by a factor of 23.
3.4 Capacity of Wireless Networks Relative to Application Demand
To look at the impact of data applications on wireless networks, one must consider the amount of bandwidth available and the amount of spectrum consumed by applications. This allows one to see how many people using which applications current network capacity can support and how current capacity will need to be augmented in the future.
First, there is the question of how to equate capacity with spectrum. This requires an understanding of spectral efficiency, which is the throughput measured in bits per second (bps) that a coverage area can support on an aggregate basis relative to the amount of spectrum used, measured in Hertz (Hz). In other words, determining spectral efficiency tells us the total bandwidth of the network relative to the amount of spectrum used.
Today’s wireless technologies have a spectral efficiency close to 0.75 bps/Hz (after network overhead) for the downlink. Therefore, 1 MHz of spectrum in a cell sector33 can provide, on average, 0.75 Mbps of total aggregated data throughput for all the users in the coverage area. Future technologies such as Long Term Evolution (LTE) are expected to have spectral efficiency closer to a value of 1.5. These spectral‐efficiency values are based on work that Rysavy Research has performed with 3G Americas and represent a consensus view of multiple operators and vendors.34
33 Cell sites typically are divided into three sectors.
34 Rysavy Research, “EDGE, HSPA, LTE – Broadband Innovation”, published by 3G Americas, September 2008. Uplinks typically have about half the efficiency of downlinks.
13 Mobile Broadband Spectrum Demand
14 Mobile Broadband Spectrum Demand
The capacity of a wireless network in any given location thus depends on the spectral efficiency, as well as the amount of spectrum the operator has available.
The following table illustrates some of the sector throughputs based on available bandwidth.
Table 2: Available Sector Throughputs Based on Bandwidth and Technology
Technology Bandwidth Assumption Spectral Efficiency Downlink Sector Throughput
EV‐DO One radio carrier of 1.25 MHz 0.75 0.94 Mbps
UMTS/HSPA Assumes entire 5 MHz radio channel used for data
0.75 3.75 Mbps
WiMAX 2/3 of 10 MHz (time division duplex) radio channel allocated for downlink
1.0 6.7 Mbps
LTE 10 MHz radio channel all available for data
1.5 15 Mbps
These sector throughput or capacity values, however, are not fixed. Operators can augment these capacity amounts by deploying additional spectrum and adding radio channels assuming the operator has access to additional spectrum. For example, if a CDMA operator had two EV‐DO radio channels deployed in a particular coverage area, then the sector capacity would double. As for actual user throughputs, EV‐DO operators such as Verizon indicate typical throughput rates of 600 kbps (thousands of bits per second) to 1.4 Mbps (millions of bits per second) and HSPA operators such as AT&T state 700 kbps to 1.7 Mbps. Actual throughput rates depend largely on signal quality and network loading in a particular geographic area. As the number of active users on the network increases in a specific area, particularly data users, throughputs for everyone decrease. Essentially, the capacity of a cell is divided among all active users accessing that cell. A cell will become saturated at some point, and the result will be slow and erratic service.
Given the physical reality just explained, mobile network operators are implementing or considering various mechanisms to manage bandwidth usage in the absence of access to more licensed spectrum. Efforts may include instituting monthly usage caps, encouraging off‐peak usage, and other network management tools. If consumers perceive an operator’s management techniques as being too restrictive, however, the value of the service diminishes. This could, in turn, reverse the consumer demand trend summarized above, which will then arrest the operators’ efforts to keep enhancing network capacity and capability to stay ahead of consumer demand.
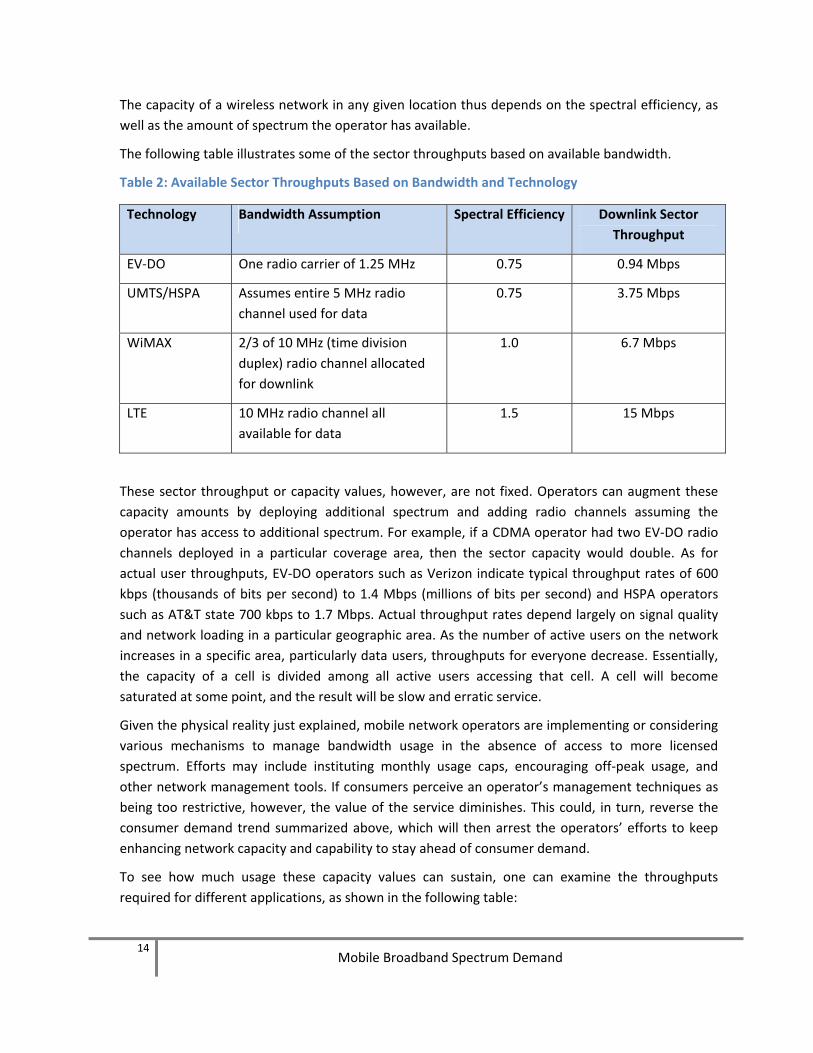
To see how much usage these capacity values can sustain, one can examine the throughputs required for different applications, as shown in the following table:
15 Mobile Broadband Spectrum Demand
Table 3: Application Bandwidth Requirements
Application Bandwidth
Mobile voice call 6 kbps to 12 kbps
Low-quality music stream 28.8 kbps
Medium-quality music stream 128 kbps
High-quality music stream 300 kbps
Video conferencing 384 kbps to 3 Mbps
Entry-level, high-speed Internet 1 Mbps
Internet streaming video 1 Mbps
Telecommuting 1 to 5 Mbps
Gaming 1 to 10 Mbps
Enterprise applications 1 to 10 Mbps
Standard definition TV 2 Mbps
Distance learning 3 Mbps
Basic, high-speed Internet 5 Mbps
High-Definition TV 7.5 to 9 Mbps
Multimedia Web interaction 10 Mbps
Enhanced, high-speed Internet 10 to 50 Mbps
Even though not all subscribers of a network are active at the same time, it is quite clear that several users within the same cell sector engaging simultaneously in high‐throughput applications (e.g., video streaming) can quickly strain the network impacting the user experience for every consumer accessing the network, even if they are not themselves engaging in bandwidth‐intensive activities. Rysavy Research has confirmed this in actual tests in which four simultaneous users on a 3G network in the same location resulted in decreased throughput speeds of less than 60% compared to the unloaded case.35 Mobile applications such as movie downloads and video streaming are becoming more popular and have the potential to consume available capacity in today’s mobile networks. Video consumes more bandwidth than almost any other application. As people access the Internet to download movies and other video entertainment, the amount of data consumed by mobile video will balloon, because consumers will not settle for accessing video only through their wireline connections. They will expect and demand that such content be accessible through their mobile broadband connections.
35 Rysavy Research Wireless Network Assessment, 2006, http://www.rysavy.com/Articles/Rysavy_Wireless_Performance.pdf.
16 Mobile Broadband Spectrum Demand
Given the finite capacity limits explained above, many application developers have employed highly efficient wireless application architectures often implemented via mobile middleware, as well as through highly compressed data objects. These approaches have helped mitigate the bandwidth consumption of certain popular mobile applications while also improving application performance. But application optimization alone will not resolve the bandwidth needs to support continuing escalating demand.
3.5 Monthly Usage Analysis
The second approach this report uses to examine spectrum demand is by examining the total monthly usage of typical applications.
To estimate the monthly consumption of different types of applications, one must make a certain number of assumptions about usage. Some estimates are as follows:
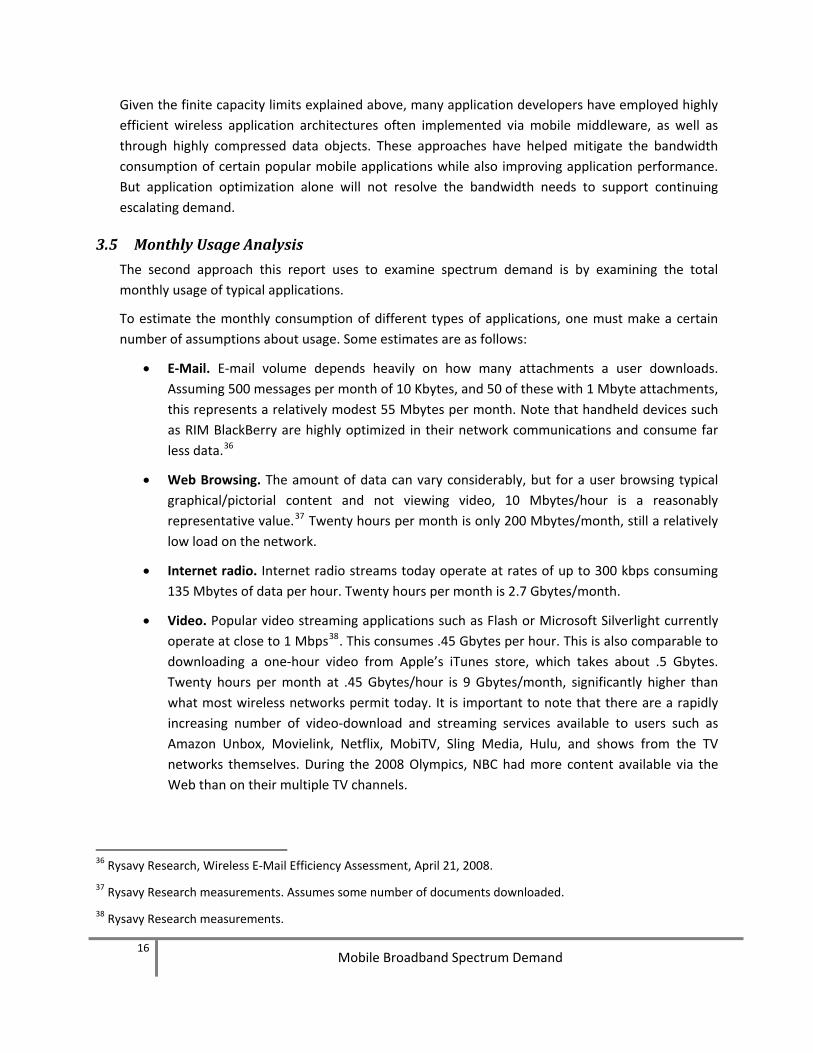
• E‐Mail. E‐mail volume depends heavily on how many attachments a user downloads. Assuming 500 messages per month of 10 Kbytes, and 50 of these with 1 Mbyte attachments, this represents a relatively modest 55 Mbytes per month. Note that handheld devices such as RIM BlackBerry are highly optimized in their network communications and consume far less data.36
• Web Browsing. The amount of data can vary considerably, but for a user browsing typical graphical/pictorial content and not viewing video, 10 Mbytes/hour is a reasonably representative value.37 Twenty hours per month is only 200 Mbytes/month, still a relatively low load on the network.
• Internet radio. Internet radio streams today operate at rates of up to 300 kbps consuming 135 Mbytes of data per hour. Twenty hours per month is 2.7 Gbytes/month.
• Video. Popular video streaming applications such as Flash or Microsoft Silverlight currently operate at close to 1 Mbps38. This consumes .45 Gbytes per hour. This is also comparable to downloading a one‐hour video from Apple’s iTunes store, which takes about .5 Gbytes. Twenty hours per month at .45 Gbytes/hour is 9 Gbytes/month, significantly higher than what most wireless networks permit today. It is important to note that there are a rapidly increasing number of video‐download and streaming services available to users such as Amazon Unbox, Movielink, Netflix, MobiTV, Sling Media, Hulu, and shows from the TV networks themselves. During the 2008 Olympics, NBC had more content available via the Web than on their multiple TV channels.
36 Rysavy Research, Wireless E‐Mail Efficiency Assessment, April 21, 2008.
37 Rysavy Research measurements. Assumes some number of documents downloaded.
38 Rysavy Research measurements.
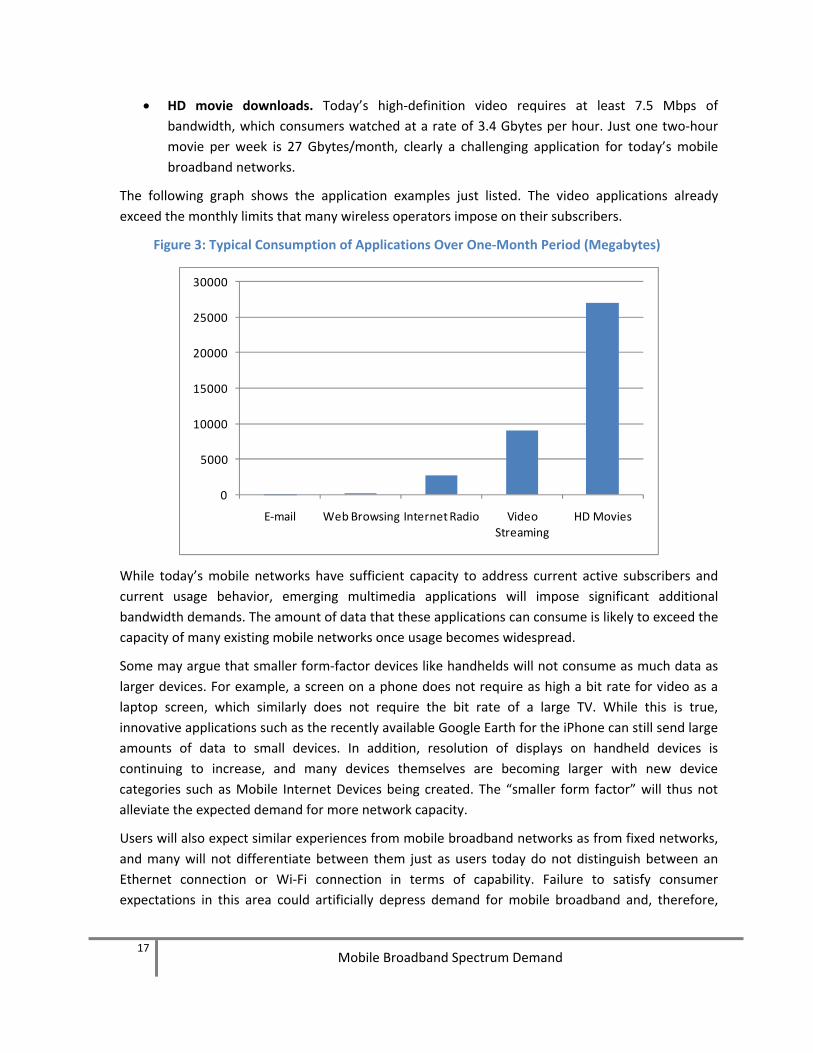
• HD movie downloads. Today’s high‐definition video requires at least 7.5 Mbps of bandwidth, which consumers watched at a rate of 3.4 Gbytes per hour. Just one two‐hour movie per week is 27 Gbytes/month, clearly a challenging application for today’s mobile broadband networks.
The following graph shows the application examples just listed. The video applications already exceed the monthly limits that many wireless operators impose on their subscribers.
Figure 3: Typical Consumption of Applications Over One‐Month Period (Megabytes)
0
5000
10000
15000
20000
25000
30000
E‐mail Web Browsing Internet Radio Video Streaming
HD Movies
While today’s mobile networks have sufficient capacity to address current active subscribers and current usage behavior, emerging multimedia applications will impose significant additional bandwidth demands. The amount of data that these applications can consume is likely to exceed the capacity of many existing mobile networks once usage becomes widespread.
Some may argue that smaller form‐factor devices like handhelds will not consume as much data as larger devices. For example, a screen on a phone does not require as high a bit rate for video as a laptop screen, which similarly does not require the bit rate of a large TV. While this is true, innovative applications such as the recently available Google Earth for the iPhone can still send large amounts of data to small devices. In addition, resolution of displays on handheld devices is continuing to increase, and many devices themselves are becoming larger with new device categories such as Mobile Internet Devices being created. The “smaller form factor” will thus not alleviate the expected demand for more network capacity.
Users will also expect similar experiences from mobile broadband networks as from fixed networks, and many will not differentiate between them just as users today do not distinguish between an Ethernet connection or Wi‐Fi connection in terms of capability. Failure to satisfy consumer expectations in this area could artificially depress demand for mobile broadband and, therefore,
17 Mobile Broadband Spectrum Demand
18 Mobile Broadband Spectrum Demand
reverse the trend of expanding the capacity and capability of wireless networks to stay ahead of demand.
3.6 Capacity of Wireless Networks Relative to Average Subscriber Usage
Another way of analyzing the capacity of a network and the number of data users it can support is through an analysis of the average throughput per subscriber. This differs from the previous sections that examined instantaneous peak throughputs of different applications and their monthly consumption.
Wireline broadband services have been available for quite some time, and trends in data consumption are fairly well understood. Based on this information, wireline Internet service providers (e.g., cable modem or DSL) design their networks to accommodate the total average demand of their subscribers. These data consumption values apply directly to mobile broadband networks as people in increasing numbers turn to mobile devices for Internet access. Siavash Alamouti, CTO of the Mobile Wireless Group at Intel, states that the killer application for mobile broadband networks such as WiMAX is “anything the Internet can provide today and possibly more.”39 In other words, the Internet is the application, so Internet consumption trends are particularly relevant for understanding mobile broadband network demands. A Goldman Sachs comment on smartphones concurs, “The larger screen size and improved user interface of these new devices are helping to more closely match the user experience in the wireless world with that of the wired world.”40
A typical average throughput‐per‐Internet subscriber value used today is about 50 kbps per subscriber. For instance, a November 2007 DOCSIS (Data over Cable Services Interface Specification) analysis indicated average usage of 40 kbps downstream and 20 kbps upstream.41 A 40 kbps value may seem extremely low compared to the multi‐megabit‐per‐second throughputs available with DOCSIS, but this value takes into account that only a subset of users are active at any one time and, of these, only some are communicating data at any moment in time. The average load‐per‐subscriber is thus an important number for predicting the demand on the total network.
These average demand values will keep rising for both wireline and wireless networks as Internet usage continues to increase. Discussing how to plan WiMAX networks, Nokia Siemens Networks, a wireless infrastructure vendor, projected in 2007 per‐subscriber, average throughput rates of 50 kbps to 100 kbps within three years.42
39 “Mobile WiMAX: Vision & Evolution,” http://www.ieee‐mobilewimax.org/downloads/Alamouti.pps.
40 The Goldman Sachs Group, Inc., Americas: Wireless¸ Mobile Data 1.1 – Recent Data Points Strengthen the Theme, June 2008.
41 Communications Technology. November 1, 2007, DOCSIS Migration Methodology, From A to B to "3", By Saifur Rahman, http://www.cable360.net/ct/operations/bestpractices/26403.html.
42 http://www.telecomasia.net/article.php?type=article&id_article=4742&id_sector=16.
19 Mobile Broadband Spectrum Demand
One can apply the average demand value to mobile networks as follows. Assuming a 50 kbps average throughput per subscriber, and using the per‐sector capacities in Table 2, one can readily see that the HSPA cell sector could support only 75 subscribers (3.75 Mbps divided by 50 kbps) and the LTE cell sector could support 300 subscribers (15 Mbps divided by 50 kbps). In the US today, there are, on average, over 1,000 subscribers for the major operators per cell site or over 333 subscribers per cell sector.43 Clearly, the HSPA cell, with one radio channel, could not accommodate all of its subscribers using data at current Internet levels. While today there are not a sufficient numbers of mobile broadband users to soak up all available capacity, Internet trends indicate that capacity will eventually be consumed.
There is another important consideration with respect to demand, namely peak geographic demand. The previous discussion was based on average per‐subscriber demand but, in practice, peak network demands are often localized (e.g., Presidential Inaugural events in Washington, DC, large sporting events, road‐traffic situations, high‐density residential areas). Peak geographic demands can be significantly higher than average demands. The industry needs enough spectrum to accommodate both average demands, as well as peak geographic demands.
There are three ways of increasing network capacity: increased efficiency (e.g., spectral efficiency) of new wireless technologies, more cell sites and deployment of additional spectrum.
Operators employ all three methods. The evolution from analog to digital, and now to 3G and next‐generation systems is one of improving spectral efficiency. Increased spectral efficiency, however, requires progressively more complex radio implementations and works best in low‐mobility, low‐noise and low‐interference environments. Moreover, there are both theoretical and practical limits to spectral efficiency and current systems are approaching these limits.44 Improving spectral efficiency is an important tool for creating greater network capacity, but alone will not be sufficient to address the magnitude of the expected demand for more bandwidth.
Increasing the number of cell sites can also dramatically increase overall network capacity and has been the tool operators have used most frequently to expand capacity since the inception of cellular networks. The whole basis of cellular is to efficiently reuse spectrum and the smaller the cell, the greater the capacity per unit area (e.g., today’s cell sites are easily one tenth the diameter of early sites). Operators will certainly increase the number of cell sites they deploy but, as with increasing spectral efficiency, so too there are practical limits to what can be accomplished by adding cell sites. Operators are also deploying pico cells to augment coverage, but this only addresses coverage and capacity for very localized areas.
43 Based on industry estimates of approximately 220,000 cell sites in the US. For example, see Paul Weiss, Current Telecom Developments, December 5, 2008.
44 For a more detailed discussion of the spectral efficiency of wireless technologies, and evolution of capability, refer to the Rysavy Research paper, “EDGE, HSPA, LTE – Broadband Innovation”, September 2008, http://www.rysavy.com/Articles/2008_09_Broadband_Innovation.pdf.
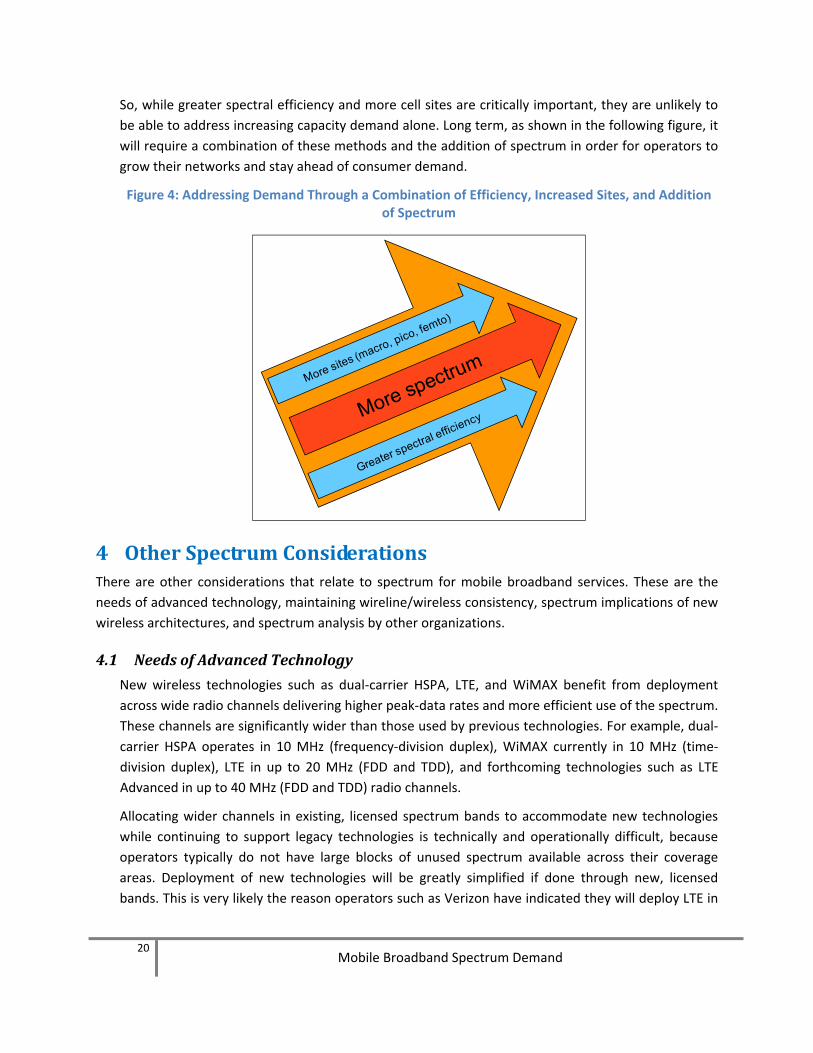
So, while greater spectral efficiency and more cell sites are critically important, they are unlikely to be able to address increasing capacity demand alone. Long term, as shown in the following figure, it will require a combination of these methods and the addition of spectrum in order for operators to grow their networks and stay ahead of consumer demand.
Figure 4: Addressing Demand Through a Combination of Efficiency, Increased Sites, and Addition of Spectrum
4 Other Spectrum Considerations There are other considerations that relate to spectrum for mobile broadband services. These are the needs of advanced technology, maintaining wireline/wireless consistency, spectrum implications of new wireless architectures, and spectrum analysis by other organizations.
4.1 Needs of Advanced Technology
New wireless technologies such as dual‐carrier HSPA, LTE, and WiMAX benefit from deployment across wide radio channels delivering higher peak‐data rates and more efficient use of the spectrum. These channels are significantly wider than those used by previous technologies. For example, dual‐carrier HSPA operates in 10 MHz (frequency‐division duplex), WiMAX currently in 10 MHz (time‐division duplex), LTE in up to 20 MHz (FDD and TDD), and forthcoming technologies such as LTE Advanced in up to 40 MHz (FDD and TDD) radio channels.
Allocating wider channels in existing, licensed spectrum bands to accommodate new technologies while continuing to support legacy technologies is technically and operationally difficult, because operators typically do not have large blocks of unused spectrum available across their coverage areas. Deployment of new technologies will be greatly simplified if done through new, licensed bands. This is very likely the reason operators such as Verizon have indicated they will deploy LTE in
20 Mobile Broadband Spectrum Demand
21 Mobile Broadband Spectrum Demand
their newly obtained 700 MHz band. Beyond co‐existence, many existing bands are simply not wide enough to accommodate these forthcoming wireless technologies.
The spectrum needs of emerging mobile technologies have been addressed by organizations such as Next Generation Mobile Networks (NGMN), which states: “Full deployments of next generation of mobile networks require 20 MHz channels. More than 120 MHz of harmonised spectrum would be needed to accommodate commonly envisaged deployment scenarios (involving parameters such as number of channels, number of operators, and choice of FDD or TDD technology).” NGMN also states “To reach the full potential of next generation mobile networks, larger channels (up to approximately 100 MHz, in higher frequency bands) will be needed.”45 Further, it should be noted that the ITU is already developing requirements for next‐generation systems that will include operation in up to 40 MHz radio channels, which is wider than many existing bands.46
4.2 Consumer Expectations
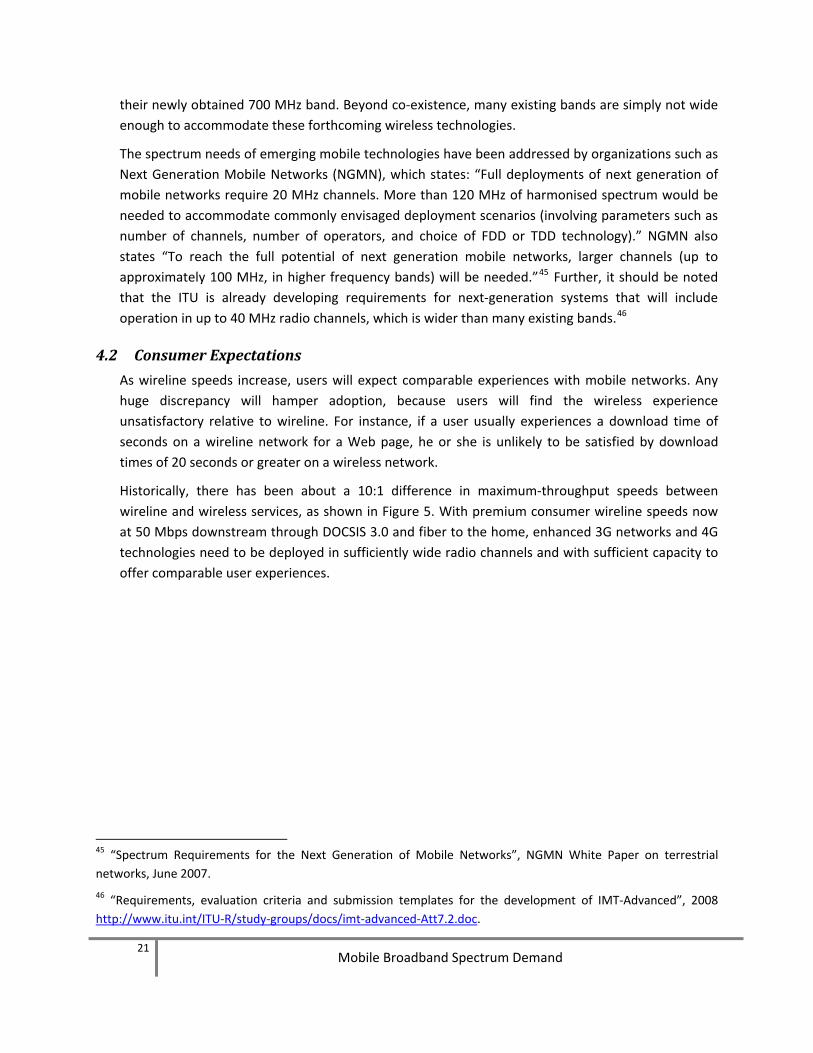
As wireline speeds increase, users will expect comparable experiences with mobile networks. Any huge discrepancy will hamper adoption, because users will find the wireless experience unsatisfactory relative to wireline. For instance, if a user usually experiences a download time of seconds on a wireline network for a Web page, he or she is unlikely to be satisfied by download times of 20 seconds or greater on a wireless network.
Historically, there has been about a 10:1 difference in maximum‐throughput speeds between wireline and wireless services, as shown in Figure 5. With premium consumer wireline speeds now at 50 Mbps downstream through DOCSIS 3.0 and fiber to the home, enhanced 3G networks and 4G technologies need to be deployed in sufficiently wide radio channels and with sufficient capacity to offer comparable user experiences.
45 “Spectrum Requirements for the Next Generation of Mobile Networks”, NGMN White Paper on terrestrial networks, June 2007.
46 “Requirements, evaluation criteria and submission templates for the development of IMT‐Advanced”, 2008 http://www.itu.int/ITU‐R/study‐groups/docs/imt‐advanced‐Att7.2.doc.
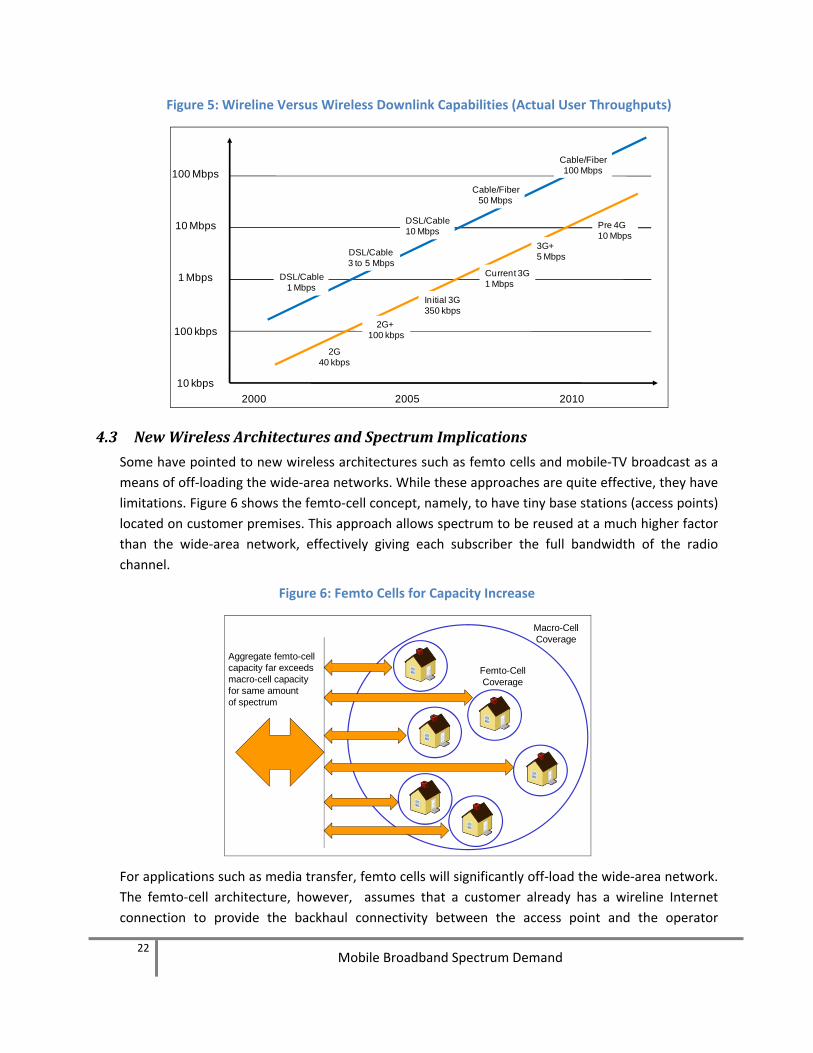
Figure 5: Wireline Versus Wireless Downlink Capabilities (Actual User Throughputs)
20102000 2005
100 kbps
10 kbps
1 Mbps
10 Mbps
100 Mbps
2G40 kbps
Initial 3G350 kbps
Current 3G1 Mbps
3G+5 Mbps
Pre 4G10 Mbps
2G+ 100 kbps
DSL/Cable1 Mbps
DSL/Cable3 to 5 Mbps
DSL/Cable10 Mbps
Cable/Fiber50 Mbps
Cable/Fiber100 Mbps
4.3 New Wireless Architectures and Spectrum Implications
Some have pointed to new wireless architectures such as femto cells and mobile‐TV broadcast as a means of off‐loading the wide‐area networks. While these approaches are quite effective, they have limitations. Figure 6 shows the femto‐cell concept, namely, to have tiny base stations (access points) located on customer premises. This approach allows spectrum to be reused at a much higher factor than the wide‐area network, effectively giving each subscriber the full bandwidth of the radio channel.
Figure 6: Femto Cells for Capacity Increase
Macro-CellCoverage
Femto-CellCoverage
Aggregate femto-cell capacity far exceeds macro-cell capacityfor same amountof spectrum
For applications such as media transfer, femto cells will significantly off‐load the wide‐area network. The femto‐cell architecture, however, assumes that a customer already has a wireline Internet connection to provide the backhaul connectivity between the access point and the operator
22 Mobile Broadband Spectrum Demand
23 Mobile Broadband Spectrum Demand
network. Thus, femto cells do not work if the goal is for mobile broaband to be an alternative to wireline connectivity. Secondly, it is not yet known how viable femto cells will actually be, as they pose massive logistical problems in terms of spectrum management, interference (between adjacent apartments, for example), configuration and management. Operators today manage tens of thousands of cell sites, but the number of femto sites, each similar to a cell site in functionality, will number in the millions.
Finally, while users may accept some degree of enhanced capability when in coverage of their femto cell, they will expect largely similar capabilities when using the network at large. The net effect is some amount of yet‐to‐be determined capacity relief but, by themselves, femto cells are not an alternative to providing necessary spectrum for mobile broadband networks.
Similarly, mobile TV provides a means of broadcasting video content so that each user receives the same set of channels. This is much more efficient than having a dedicated video stream to each user. Effective use of mobile TV will alleviate some network load for video content, but it is not an alternative for many video‐oriented applications such as YouTube that do not work in a broadcast model.
4.4 Spectrum Analysis by Other Organizations
The discussion above does not seek to quantify how much spectrum will be needed by when; rather, it seeks to show that current market and technology trends will very likely result in the exhaustion of currently available spectrum. Other organizations, however, have studied the spectrum needs of emerging wireless networks in depth. In particular, the International Telecommunications Union (ITU) conducted a highly detailed analysis of spectrum needs as a basis for work on the IMT Advanced Project. The ITU report, titled “Estimated Spectrum Bandwidth Requirements for the Future Development of IMT‐2000 and IMT‐Advanced,”47 projects a total spectrum requirement of as much as 840 MHz by 2010, 1300 MHz by 2015 and 1720 MHz by the year 2020. Even at a lower market development rate, the projections are 760 MHz by 2010, 1300 MHz by 2015 and 1280 MHz by 2020.
In the United States, only 194 MHz are currently available nationwide for CMRS use.48 However, even when one considers the total theoretical amount of spectrum that has been allocated specifically for CMRS (354 MHz)49 or the total amount of licensed spectrum theoretically available
47 Report ITU‐R M.2078, http://www.itu.int/publ/R‐REP‐M.2078‐2006/en.
48 Cellular, broadband PCS, and SMR currently in use. AWS‐1 spectrum is subject to clearing and relocation of incumbent government users and 700 MHz spectrum is subject to the DTV transition.
49 Comprising the cellular, broadband PCS, SMR, AWS‐1, and 700 MHz bands.
24 Mobile Broadband Spectrum Demand
for mobile services (approximately 680 MHz)50, that figure still falls well short of the spectrum needed to satisfy projected demand.
The ITU report has been endorsed and referenced by the organization Next Generation Mobile Networks, in their white report “Spectrum Requirements for the Next Generation of Mobile Networks,” June 2007, states, “Therefore, sufficient network capacity is a must to satisfy the end‐user expectations in terms of service quality, namely throughput and latency.”
5 Conclusion Widespread use of mobile broadband technology will not only support a thriving industry, but it will increase overall broadband penetration, which shows a strong positive correlation with the country’s economic welfare. For example, one study done across multiple countries shows a correlation in which every 1% increase in broadband penetration corresponds to $2,000 per capita higher GDP.51
This report has demonstrated that the capacity of mobile networks based on currently allocated and available licensed spectrum is finite and exhaustible based on current and expected broadband and Internet usage and innovation trends.
There are a number of market factors that are acting together to increase spectrum demand at an accelerating pace including ever‐more mobile life‐ and work‐styles, greater device sophistication, new bandwidth‐consuming applications, an increasing percentage of mobile users taking advantage of data applications, and ongoing industry innovation. Furthermore, for mobile broadband networks to provide a credible alternative and complement to wireline networks, they must be able to maintain pace with respect to performance and capacity. Mobile broadband networks can only meet these needs with the timely addition of new spectrum. Given the long timeframes involved in going from planning to auction to deployment, as experienced with the AWS and 700 MHz bands, planning for new spectrum should begin as soon as possible.
50 This figure includes 50 MHz of cellular spectrum, 24 MHz in the SMR bands, 120 MHz of broadband PCS spectrum, 90 MHz in the AWS‐1 band, 70 MHz in the 700 MHz bands, 195 MHz in the BRS and EBS bands, and 132.425 MHz in of MSS ATC spectrum.
51 “Trends in Accessibility of Services and Networks”, P. Tournassoud, http://www.alcatel‐lucent.com/enrich/v2i12008/article_c1a5.html.