mobile metal ion geochemical soil survey
TRANSCRIPT

MOBILE METAL ION 0 GEOCHEMICAL SOIL SURVEY
on the
ASHTON GROUP MINERAL CLAIMS
NTS 92U6W & 92U3W KAMLOOPS MINING DMSION
LATITUDE: 50°14'52" NORTH LONGITUDE: 121°23'45" WEST
OWNERS: J.M. ASHTON, P. Eng. S.E. APCHKRUM
OPERATORS: J.M. ASHTON, P. Eng. J.M. ASHTON & ASSOCIATES LTD. S.E. APCHKRUM
AUTHOR: J.M. ASHTON, P. Eng.
GEOPHYSICIST: D.G. MARK, P.Geo.
CONTRACTOR: GEOTRONICS CONSULTING INC.
SUBMITTED: 22 September, 2006
J. M. Ashton & Ass
1177 West Hastings Street Vancouver, British Columbia
on behalf of the Owners

SECTION 1.0
SECTION 2.0
SECTION 3.0
SECTION 4.0
SECTION 5.0
SECTION 6.0
SECTION 7.0
SECTION 8.0
SECTION 9.0
MOBILE METAL ION (MMI) GEOCHEMICAL SOIL SURVEY
on the
ASHTON GROUP MINERAL CLAIMS
NTS 92U6W & 92U3W
KAMLOOPS MINING DMSION
TABLE OF CONTENTS
INTRODUCTION
SUMMARY & RECOMMENDATIONS
LOCATION & ACCESS
PROPERTY & OWNERSHIP
EXPLORATION HISTORY
PHYSIOGRAPHY & OUTCROP
REGIONAL GEOLOGY
PROPERTY GEOLOGY & ALTERATION
MMI GEOCHEMICAL SOIL SURVEY
9.1 Introduction 9.2 Grid-Line Preparation 9.3 Background & Survey Objectives 9.4 Mobile Metal Ion Geochemical Theory & Fundamentals 9.5 Survey & Sampling Procedure 9.6 MMI Assaying 9.7 Data Preparation 9.8 MMI Survey Results 9.9 Defining Anomalous Classes & Plotting Results 9.10 Discussion of Results
Page
1
4
6
7
8
11
12
14
18
18 18 19 23 24 25 26 27 28 32

SECTION 10.0 EXPLORATION POTENTIAL
SECTION 11.0 COST STATEMENT
SECTION 12.0 CERTIFICATION of J. M. ASHTON, P. Eng.
SECTION 13.0 CERTIFICATION of D. G. MARK, P. Geo.
SECTION 14.0 REFERENCES
Table 9.3-1
Table 9.5-1
Table 9.8-1
Table 9.9-1
Table 9.9-2
Figure 1
Figure 2
Figure 3
Figure 4
Figure 5
Figure 5A
Figure 6
TABLES ASSOCIATED with TEXT
Rock Sample AO4- 102, Assay Results
Line & Sample Statistics
Background Values of Elements Determined by MMI Survey
Table of Anomalous Classes & Frequencies for Cu, Au, & As
Conventional Assay, Arsenic in Soils Anomalous Classes
FIGURES
Property Location Map
Claim Location Map
Regional Geology
Arsenic in Soils, Conventional Geochemistry
Composite Arsenic & Copper in Soils Geochemistry
2006 Survey Grid for MMI Geochemical Survey
MMI Soil Sampling, Line 4500 North Response Ratio Histogram for Au, As, Ag, & Cu
Page
42
44
47
48
49
Figure 7
Figure 8
Figure 9
Figure 10
Figure 11
Figure 12
Figure 13
MMI Soil Sampling, Line 4400 North Response Ratio Histogram for Au, As, Ag, & Cu
MMI Soil Sampling, Line 4500 North Response Ratio Histogram for Cu, Ni, Pb, Zn, Mo, & Co
MMI Soil Sampling, Line 4400 North Response Ratio Histogram for Cu, Ni, Pb, Zn, Mo, & Co
MMI Soil Sampling, Au in Soils Geochemistry
MMI Soil Sampling, As in Soils Geochemistry
MMI Soil Sampling, Cu in Soils Geochemistry
Composite Interpretation Sketch, Au & As Geochemistry & Spatial Relationships to Diagnosed: Porphyry 1 & Massive Sulphide Body H2
APPENDIX A
MMI Geochemical Data & Calculations for:
Group 1 Elements: Cu, As, Ag, & Au
Group 2 Elements: Cu, Ni, Pb, Zn, Mo & Co
APPENDIX B
MMI Assay Data for 42 Elements Assayed
APPENDIX C
Lithogeochemical Assay Results for Gold Pathfinder Elements; 2004 Suwey
Ashton Copper-Gold Prospect
MOBILE METAL ION (MMI) GEOCHEMICAL SOIL SURVEY
on the Ashton Group Mineral Claims
SECTION 1.0 - INTRODUCTION
The Ashton Copper-Gold Prospect is located about 12 miles (1 9 km) due east of the Village of Lytton, British Columbia. It has seen recorded mineral exploration over the area of interest since the discovery of a large, strong, single element copper-in-soils anomaly in 1969, partly associated with a mixed zone of hydrothermally altered volcanics and skarnification containing low grade copper minerals. The anomalous area was re-discovered as a result of a new multi-element soil survey conducted in 1993. Its size and strength corresponded well with the original survey. The copper-in-soils anomaly covers an area about 1 mile (1.6 lun) east to west by 1% miles (2.4 km) north to south and appears to be contained within a much larger area of hydrothermal alteration.
As a direct result of a geochemical soil sampling program and a shallow-probe induced- polarization survey conducted in 1993 by a property optionor, a seven (7) hole 650 metre percussion drilling program was carried out in 1994. The drilling encountered only low- grade copper averaging about 0.07% Cu throughout within propylitically altered rock. The drill holes were not logged in the customary geological manner by the then operating company who after the disappointing results relinquished their option on the property.
In 1995 a program of drill hole geological logging on a suite of percussion drill chips saved from the drilling was implemented followed by thin section petrographical work on selected samples from the hole logging. The results from this geoscientific effort showed that the area that was the focus of the drilling was pervasively altered and mineralized with very low grade copper occurs as disseminations and veins believed to be deposited along northerly trending shear structures noted in the area; and that the target area was composed of an episodically mineralized intrusive complex of: tonalite, quartz-diorite, diorite, diorite porphyry, albitite, and gabbro. Widespread alteration in the form of calcite flooding, and quartz-carbonate, pyrite-chalcopyrite veining was noted in all of the holes drilled in the area of interest. Of particular interest was the quartz-carbonate pyrite-chalcopyrite stockworks found in the bottom of PDH93-3. These mineralised structures may be indicative of economic copper mineralization in close proximity or at depth.
Significant skarnification and marblization is found proximal to the intrusive structures in drill holes and at surface largely along the east contact aureole of diagnosed Porphyry 1
1
Mobile Metal Ion (MM7) Geochemical Survey Report Ashton Copper-Gold

where the meta-sedimentary and meta-volcanic succession appears to predominate.
Petrographical work supported the broader findings of the geological work and concluded that in addition to the plutonic zones of tonalite (quartz-diorite) through to quartz-diorite, diorite and to gabbro that underlie the area of interest also includes their altered equivalents of pyroxene gabbro, pyroxenite, hornblende-diorite and homeblendite. The petrographical work also confirmed diorite porphyry, and albitite (albite porphyry). Alteration facies include albitization, pervasive calcification, epidotization, chloritization, hematization, sericitization, sausseritization, marbleization and skamification.
It was the combined results of the geological logging, petrographical study and the consulting geologist's discovery of a mineralized stockworks zone consisting of quartz- carbonate, pyrite-chalcopyrite veins and veinlets at the bottom 70 feet of PDH93-3 that motivated the 1999 reconnaissance deep-probe induced-polarization (IP) survey. The deep- probe IP survey used a dipole-dipole m y with an 'a' spacing of 100 metres and was surveyed down to 6-levels which provides a pseudosectional view of chargeability and resisitivity contrast down to about 1,400 metres (1,400 feet).
The 1999 IP survey was successll at partially delineating a large volume of chargeability that was partly embedded within or was below the shallow probe chargeability rind yet quite distinct from it as evidenced by a steep chargeability isopach gradient indicative of a phase change. This newly discovered target chargeability zone may come closest to surface in the vicinity of an extremely anomalous copper-in-soils anomaly. This chargeability anomaly which appears to be vertical goes to the survey depth of 420 metres (1,400 feet) and is open to depth. It is diagnosed as a mineralised porphyry body.
The survey also identified a large conductive body along the east contact zone of the chargeability anomaly. This diagnosed sulphide body dips about 40" to the east which is conformable in stratabound fashion to the monoclinic limy volcanic-sedimentary lithology.
The top of this conductive body is about 120 metres (400 feet) below surface and goes to depth along its dip length to beyond 420 metres (1,400 feet) vertically below the surface. Its strike dimension is unknown. It could be up to 100 metres in thickness.
A second deep-probe IP survey, consistent with the 1999 IP survey with penetration depth of 420 metres, was completed in 2004 to cross, from east to west, a strong total field magnetic anomaly of 4,600 gammas discovered in the 1990 magnetic survey. This anomaly has a half space dimension of about 500 metres north to south by 200 metres east to west.
The 2004 IP survey resulted in what is diagnosed as a second significant discovery on the property. This discovery consists of two large subcropping disseminated sulphide limbs on either side of the long axis of the magnetic body which appears to represent the core zone.
2
Mobile Metal Ion (MM7) Geochemical Survey Report Ashton Copper-Gold
The top of the east limb disseminated sulphide body is deeper than the west limb disseminated sulphide body. The two bilateral limbs and central magnetic core dip conformably about 50" to the west, to the depth measuring capability of the survey; and are open to depth. This magnetic core with two bilateral disseminated sulphide limbs appears to be similar in spatial configuration to the gold-rich calc-alkaline Island Copper deposit in which a central potassic alteration zone of quartz-feldspar porphyry containing hydrothermal magnetite was believed to be the "ore bringer".
Hence deep-probe IP surveying has identified what are believed to be two mineralized porphyry bodies located within perhaps less than 300 metres fiom each other along what appears to be a major north-south zone of structural weakness.
There are several geological, geochemical, and geophysical anomalous features that support the existence of these two diagnosed porphyry bodies and the conductive body associated with Porphyry 1 and these supporting features are described in the assessment work reports.
A review of historical multi-element soils geochemistry over Porphyry 1, diagnosed fiom the 1999 deep-probe IP survey, and the multi-element rock-chip assays fiom the 1994 percussion drilling into the propylitic zone of this porphyry revealed a number of very- anomalous and extremely-anomalous arsenic assays. The arsenic in soils was particularly strong over the south contact aureole or shoulder zone of Porphyry 1 and appears to be a separate contiguous yet overlapping feature to the anomalous copper-in-soils anomaly which generally terminates at the diagnosed porphyry contact.
Accordingly in 2004, a small lithogeochemical sampling program was conducted over the altered outcrop along the porphyry's south contact aureole and along the porphyry's east contact aureole above diagnosed Massive Sulphide Deposit H2.
A representative rock sample A04-102 taken fiom within Arsenic Anomaly 2 within the contact aureole of Porphyry 1 on assay was found to contain extremely-anomalous epithermal gold pathfinder elements Te, As, Sb, Hg, Se, and Ag.
It was the combination of the newly plotted arsenic anomalies fiom the 1993 survey along with the extremely anomalous gold pathfinder assays found in Sample AO4-102 that was the reason for motivating the Mobile Metal Ion (MM) soils survey on existing Line 4500, previously surveyed, and extending the sampling to un-sampled Line 4400 because the very positive gold-pathfinder assays are diagnostic of a blind gold bearing zone at depth at this location. Given the testimonials of blind gold discoveries using the MMI technique could provide additional support for this thesis if the results were anomalous in gold. Completing the survey over Line 4500 for which conventional geochemical data was available would provide a means to correlate assay data fiom the two independent type surveys.
Mobile Metal Ion (MMI) Geochemical Survey Report Ashton Copper-Gold

SECTION 2.0 - SUMMARY & RECOMMENDATIONS
2.1 Summary
The anomalous gold MMI Response Ratio results found along Line 4500 and Line 4400 which were the limits of this MMI survey, are significant. The anomalies indicate that in terms of probability a gold-rich magmatic-hydrothermal system, possibly of the porphyry related low-sulphidation epithermal type, has deposited gold, possibly in economic concentrations within structural and other permeable zones along the south contact aureole of Porphyry 1, diagnosed as a result of a reconnaissance deep-probe IP survey over the area in 1999. Similarly the strike and dip extension zones of Massive Sulphide Body H2, diagnosed fiom the same 1999 IP survey which were beyond the survey limits of the original conventional geochemical survey, yet included in the area of the recent MMI survey show coincidental anomalous arsenic and gold MMI Response-Ratios indicating that this sulphide body in terms of probability contains gold along with the earlier diagnosed copper.
According to the geoscientists who developed the MMI technique and whom are most knowledgeable about its anomalous implications, the anomalous gold MMI Response Ratios along with supporting silver MMI Response Ratios as are shown in the enclosed Histograms of Response Ratio data for these elements, are indicative of primary gold mineralization in place, at an unknown depth, precisely below each respective gold anomaly.
The results support an earlier diagnoses made fiom the extremely anomalous gold pathfinder elements, Te, As, Hg, Sb, Se, and Ag found in altered rock along this south contact aureole that an epithermal gold mineralising event probably of the porphyry related low-sulphidation epithermal type has occurred vertically below the sample site. As shown in Figure 4, Arsenic in Soils Geochemistry and in Figure 13, "Composite Interpretation Sketch, Au & As Geochemistry & Spatial Relationships to Diagnosed: Porphyry 1 and Massive Sulphide Body H2", the sample site is within the anomalous arsenic in soils zone and the contact aureole of diagnosed Porphyry 1.
The extremely anomalous tellurium at 200 times the average 1 ppb contained in the Earth's unaltered crust represents an almost certain diagnosis of an epithermal gold magmatic- hydrothermal mineralizing system where the mineral producing magma is the alkalic variety. As summarized by Jensen and Barton, 2000, "gold deposits associated with alkaline rocks include high-grade, gold-rich epithermal deposits, porphyry type copper-gold deposits and several other deposits types more speculatively linked to alkaline magmatism.
A similar discovery of anomalous gold pathfinder elements in skam and altered volcanics was made fiom two sample sites near the collar of drill hole RCA93-5 believed to be within the hydrothermal fluid outflow zone fiom the subcropping Massive Sulphide Body H2.
4
Mobile Metal Ion (MMI) Geochemical Survey Report Ash ton Copper - Go1 d
Each sample was extremely anomalous in tellurium at 2 10 ppb and 90 ppb respectively. The former sample was at the high end of the anomalous threshold in the elements Sb and Se whereas the latter sample was extremely anomalous in As and Se and anomalous in Hg. Without excluding the significance of the gold pathfinder elements, As, Sb, and Se, the tellurium itself is indicative of a gold-rich magmatic hydrothermal system at depth.
As the conventional arsenic in soils anomalies appear to agree with the arsenic MMI Response Ratio anomalies which in turn correspond with the gold MMI Response-Ratios, in terms of probability, the conventional arsenic anomalies are indicative of subcropping gold mineralization. Broadly speaking anomalous arsenic in soils covers a large part of the spatial projection to surface of diagnosed subcropping Porphyry Copper Deposit 1 and diagnosed subcropping Massive Sulphide Deposit H2. Notwithstanding, the very- anomalous and extremely-anomalous arsenic in soils anomalies in the vicinity of Porphyry 1 are still found beyond the contact out in the contact aureole at the anomalous threshold level.
Copper MMI Response-Ratios along Line's 4500 and 4400 within the southern contact aureole of the porphyry also appear to be mostly at the background or anomalous threshold level which closely agrees with the conventional copper-in-soils data which shows this area beyond the large copper anomaly located above the vertical projection of the diagnosed subcropping porphyry.
2.2 Recommendations
The following recommendations are made:
1. Still a priority is geological mapping of the entire property.
2. Extend the MMI survey another 500 metres to south of Line 4400 to at least Line 3900 and another 500 metres to the north of Line 4500 because the newly discovered gold zone is open in both size and gold Response-Ratio anomalous strength in both directions.
3. As was the same recommendation made as a result of the 1999 deep-probe IP survey, complete a detailed deep-probe induced polarization survey with at least 21 contiguous deep-probe survey lines with lines 100 metres apart and stations at every 100 metres between Line 4,000 North and Line 6,000 North and between Stations 800 East to 800 West. The survey lines must be cut and surveyed. The IP budget should allow for not less than 40 km of survey to include any necessary detailing. The results of this survey will provide a composite, integrated, and geophysically meaningful three-dimensional pseudosection of the intrusive complex and contact aureoles of each of the two diagnosed porphyries.
5
Mobile Metal Ion (MI) Geochemical Survey '~eport Ashton Copper-Gold
Given the probability that this intensely altered area could also host a porphyry related low-sulphidation epithermal gold system, the IP method is also suited to assessing epithermal deposits by identification of high-resistivity zones characteristic of silicification and quartz vein development. Similarly if the system includes high-sulphidation mineralization in the form of vuggy quartz veins/silicic cores or massive sulphides, resistivity and chargeability anomalies, respectively, may identify these structures. Similarly clay alteration zones which are found proximal to both high and low suphidation mineralization have characteristic low resistivity signatures.
The above coverage also includes diagnosed Porphyry 2, discovered in the 2004 reconnaissance deep-probe IP survey.
The geological and mineralogical theme of the property is becoming most complex. Drill targets should be based upon the detailed deep-probe IP survey, detailed geological and alteration facies mapping and expanded MMI geochemical survey integral with the geological mapping and IP coverage.
4. As per Gale's 1994 recommendation, diamond core drilling only, is recommended for testing the target structures in this complex geological environment.
SECTION 3.0 - LOCATION AND ACCESS
The Ashton Group of mineral claims is located approximately 19 km (1 1.8 miles) south of Spence's Bridge, British Columbia and south of the confluence of the Nicoamen River and Thompson's River where this river tums sharply west towards Lytton. Spence's Bridge is located approximately 170 km (1 10 miles) as the crow flies, northwest of Vancouver, British Columbia, on Trans-Canada Highway 1.
The Canadian Pacific Railway parallels the Trans-Canada Highway at this location on the east side of Thompson's River.
Locally, the northwest quadrant of the claim group is located about 1,000 metres south fiom the confluence of the Nicoamen River where it enters Thompson's River.
A good all-weather forest service road provides immediate and easy access to the central part of the claims southward off of the paved Trans-Canada Highway immediately north of the Nicoamen River and highway bridge. Several old logging roads with secondary tree growth cross the property and intersect with the main access road, thereby providing the potential for road access to a large portion of the area of interest through a minimum of rehabilitation.
6
Mobile Metal Ion (MMI) Geochemical Survey Report Ashton Copper-Go1 d

SECTION 4.0 - PROPERTY AND OWNERSHIP
The Ashton Group is comprised of the following mineral claims with expiry dates as shown subject to acceptance of this report. The claims all have a common anniversary date.
1 Mineral Claim
Rebecca 3
Rachel 1 Rachel 2 Rachel 3 Rachel 4
Mellisa
Total
Units Tenure No. Expiry Date
17 July 2007
17 July 2008
17 July 2009 17 July 2009 17 July 2009 17 July 2009
17 July 2009
All mineral claims are held by record in the name of J. M. Ashton, of Vancouver, British Columbia.
Mobile Metal Ion (MP4I) Geochemical Survey Report Ashton Copper -Go1 d

SECTION 5.0 - EXPLORATION HISTORY
The first recorded work on the Ashton Cu-Au Prospect was directed by Alfied A. Burgoyne, M.Sc., in October 1969. His work included a single element copper-in-soils survey which resulted in the delineation of a large area of highly anomalous copper in soils.
Burgoyne's work was followed up by J. W. Antal, Ph.D., P.Geo1. (Alberta) with a program of limited surface trenching, geological assessment and intrepretation. The trenching showed shear zone hosted copper mineralization in skam within part of the copper anomaly. There was no mention of intrusives. Antal in his November 1969 report concluded that the prospective area had the potential for hosting a large low-grade copper deposit at depth.
In 1990, a total-field magnetometer survey and Very Low Frequency Electromagnetic (VLF-EM) survey was carried out over what was believed to be the area of interest, under the direction of J. M. Ashton, P. Eng. The magnetic survey resulted in the discovery of a prominent, distinct, magnetic anomaly north of Line 5200N on the baseline with its major axis striking north-south with a maximum amplitude response of 4,600 gammas (Nanoteslas) above background. The % space dimension of the anomaly is about 500 metres (1,600 feet) north-south by 200 metres (650 feet) east-west.
The VLF-EM survey located a number of electromagnetic (EM) conductors with a characteristic north-south strike. These conductors are diagnosed as either structurally controlled ionic conductors or electronic conductors and could be combinations of both. The strongest EM conductor of the survey extends from Line 5000 North at Station 400 East to Line 5400 North, Station 500 East. This conductor coincides with a very strong linear copper-in-soils anomaly defmed in the 1993 soil survey. It also coincides with the interpreted semi-massive to massive-sulphide body at 120 metres (400 feet) depth discovered as a result of the 1999 deepprobe induced-polarization survey.
A petrographical study of a thin section in 1991 by consulting geologist P. B. Reid, Ph.D., from a representative rock sample taken by Ashton within the area of the magnetic anomaly showed that the altered rock specimen was:
"a heavily altered fine-grained pyroxene diorite? with the alteration assemblage consisting of calcite, chlorite, epidote, sphene, pyrrhotite, and hematite. The original rock has been nearly obliterated by alteration. The tourmaline, a major part of the alteration assemblage, indicates that hydrothermal solutions causing the alteration contained signif cant volatiles. "
This diagnostic thin section was the first petrographical confirmation of the intense alteration that pervades the area of interest.
In August 1992, consulting geological engineer R. E. Gale, Ph.D., P.Eng., examined the 8
- - - - -
Mobile Metal Ion (=I) Geochemical Survey Report Ashton Copper-Gold

prospect and confirmed the skamification reported by J.W. Antal, and also confirmed altered and unaltered diorite reported Ashton.
In April 1993, Kingston Resources Ltd. optioned the property from S. E. Apchkrum, the recorded owner at the time, and in June 1993 carried out a geochemical sampling and cursory geological mapping program to confirm the copper-in-soils anomalies identified by Burgoyne in 1969. The geochemical survey confirmed the Burgoyne copper anomaly and redefined its location. Kingston's geological mapping also confirmed that heavily altered diorite with disseminated magnetite was associated with the copper-in-soils anomaly.
In 1993 a shallow-probe induced-polarization (IP) survey using the pole-dipole array with a 50 metre 'a' spacing was conducted by Lloyd Geophysics Inc. Four (4) levels were surveyed which gives a maximum depth of penetration of the order of 100 metres (330 feet).
A significant chargeability anomaly of classic character was found to be co-incidental with the southwestern quadrant of the copper-in-soils anomaly and the altered diorite sporadically exposed at surface. This ellipsoidal anomaly, indicative of disseminated sulphides, using the 7.5 millisecond chargeability isopleth covers about 32 hectares (80 acres). Its major axis strikes about 290' azimuth.
In 1994 Kingston Resources Ltd. drilled 5 percussion drill holes into the highest amplitude portion of the chargeability anomaly and 2 percussion drill holes into anomalous geochemistry about 500 metres to the north-east of the chargeability anomaly. Kingston considered the drilling results disappointing and dropped their option in 1994.
In February 1994, Gale, at the request of Ashton, completed a detailed logging of a representative suite of cuttings saved from the drilling. Gale identified multiple episodes of altered and mineralised intrusives in the drilled area consisting of quartz-diorite, diorite, diorite-porphyry and gabbro in the high chargeability zone and significant skamification and marblization to the southeast. He also noted pervasive and widespread carbonatkition. Copper mineralization was found in disseminations and vein systems. He discovered that the bottom 70 feet of PDH93-3 contained a stockworks zone ofpyrite-chalcopyrile, quartz- carbonate veinlets.
At the recommendation of Gale, Ashton engaged Reid in 1995 to complete a petrographical study of selected drill chips. Read supported Gale's logging but added that widespread intrusions also include pyroxene gabbro, pyroxenite and homeblendite and their altered equivalents. Read also identified tonalite and albitite (albite porphyry) as intrusive species along with a host of hydrothermal alteration facies.
In June 1999, Geotronics Surveys Limited, under the direction of Geophysicist D. G. Mark, P. Geo. were engaged by Ashton to carry out a two-line reconnaissance deep-probe IP
9
Mobile Metal Ion (MMI) Geochemical Survey Report Ashton Copper-Gold
survey to cross the area of geochemical and lithological interest, previously drilled by Kingston. The survey was designed by Ashton to cross the target area in an east-west direction and orthogonally in a south-north direction. The survey used the dipole-dipole array with an 'a' spacing of 100 metres (328 feet). Six (6) levels were surveyed which represents a nominal 420 metres (1,400 feet) survey depth. Each survey line length was 2.2 km (6,888 feet).
The deep-probe survey resulted in the delineation of two large distinct anomalies below the area previously surveyed by Kingston. A large chargeability anomaly spatially distinct fiom the shallow-probe anomaly was found. This chargeability anomaly is diagnosed as a probable porphyry copper deposit. The second anomaly, along the eastern contact zone of the porphyry, is a conductivity anomaly diagnosed as a lithologically controlled semi- massive or massive-sulphide body at depth below the surface zone of hydrothermal alteration and skamification. Both of these targets are yet to be drilled.
The spatial orientation of the large disseminated-sulphide body (zone of anomalous chargeability) is such that the shallow probe IP survey in 1993 failed to detect it and all of the 1994 drill holes drilled in its vicinity failed to intercept it. Similarly, the top of the semi- massive sulphide body or massive-sulphide body was below the maximum survey depth of the shallow probe induced polarization survey.
In 2001, Mark conducted a total field magnetometer survey in the area to the south of the 1993 magnetometer survey between lines 5000 North and 4500 North which simply extends the 1993 coverage 500 metres to the south. The results of this survey produced no significant large distinct magnetic anomaly but several small distinct linear anomalies believed to be fault and shear hosted hydrothermal magnetite related to the large disseminated sulphide body. This magnetically responsive area is located at least 500 metres (1,650 feet) south fiom the prominent 4,600 gamma magnetic anomaly discovered in 1992.
In July 2004, Mark with his geophysical survey crew, under the direction of Ashton carried out a single-line reconnaissance deep-probe IP survey designed to intersect the south end of the 4,600 gamma magnetic anomaly. It was also near this location that the 1999deep-probe IP survey measured a very strong Self-potential anomalous response at minus 273 millivolts which in itself is diagnostic of a significant sulphide body at depth.
The 2004 deep-probe survey used the dipole-dipole array with an 'a' spacing of 100 metres (328 feet). Six (6) levels were surveyed which represents a nominal 420 metres (1,400 feet) survey depth. The survey line length was 1.6 lun (5,248 feet).
This survey resulted in the discovery of a second large disseminated sulphide body composed of two separate disseminated sulphide limbs which form up along the long axis of the of the 4,600 gamma magnetic anomaly. It is diagnosed as a probable gold-rich
10 -- - -- - - -
Mobile Metal Ion (MMI) Geochemical Survey Report Ash ton Copper - Go1 d

porphyry copper deposit and because of its magnetic core zone appears distinctly different from the large porphyry to the south of it. This target porphyry is yet to be drilled.
SECTION 6.0 - PHYSIOGRAPHY AND OUTCROP
The claims cover an area of moderate to steep topographical relief. The central and western part of the claims are traversed by a multiple switchback road that climbs the east side of the Thompson River canyon rising fiom the canyon bottom at 700 feet (213m) elevation to a saddle between two peaks at 3,500 feet (1,070 m) elevation within a distance of 2 miles (3.2 km). This represents an average mountain slope of about 25%. Locally the relief is moderate to steep, yet relatively easily accessible on old logging roads by foot from the main switchback road. Off-road travel requires extra exertion to negotiate the steep slopes.
The area of interest is part of the Cascade Mountains which are separated fiom the Coast Mountains to the west by the Fraser River. Thompson's River meets Fraser's River at Lytton about 8 miles (1 3 km) west from the property.
The Cascade Mountains are lower and less rugged than the Coast Mountains and generally consist of rolling and rounded summits, which is the case at the higher elevations on this property-
Generally, southern and western exposures on the property tend to be more open and easier to traverse, whereas northern and eastern slopes, and ravines, are much more heavily wooded. The area of interest on the property is a combination of westerly and northerly facing slopes that in places are open and in places are difficult to negotiate. Where old growth logging has occurred new growth is represented by denser deciduous trees and in places dense underbrush makes it difficult to traverse.
Conifer species in the area include Douglas Fir, Balsam, Spruce, and Lodgepole Pine.
Outcrop is generally lacking throughout the area of interest, so trenching is required to access the bedrock for mapping and sampling. Exposed outcrop over the entire property is estimated at not more than 10% of the surface area.
Overburden found in the percussion drill hole program of 1993 ranged in depth from 10 feet to 130 feet.
Mobile Metal Ion ( M U ) Geochemical Survey Report Ashton Copper-Gold

SECTION 7.0 - REGIONAL GEOLOGY
The regional geology is more recently described in the Geological Survey of Canada: Geology of Hope and Ashcroft Map Areas, British Columbia by J.W.H. Monger and shown on Map 42-1989, Ashcroft, British Columbia, from which the salient features are shown on Figure 3.
As described by S. W. Smith, Geologist, in his 1993 Assessment Work Report, the property straddles the boundary between the older Upper Triassic Mount Lytton Complex on the west side and the younger Middle to Upper Cretaceous Spences Bridge Group on the east.
The oldest rocks which are part of the Mount Lytton Complex occupy the area to the west of the property and may underly the property to some extent. These are layered quartz- feldspathic orthogneisses, mafic to dioritic volcanics, and metasedirnents. Monger (2001, Field Trip Notes) states that the Mount Lytton Complex in this area is overlain stratigraphically by, and elsewhere faulted against continental arc and intraplate volcanics of the 104 Ma Spences Bridge Group. According to Gale (1992) in a personal communication with Monger, Monger believes the limy rocks on the property are part of the Mount Lytton Complex and whether they are part of this oldest unit or are somewhat younger is still to be determined.
The Mount Lytton Complex has been interpreted by Monger to be part of the roots of the Late Triassic Nicola arc. The complex is fault bounded, on the west by the Fraser River fault system, and on the east by normal faults along the Thompson River. The Mount Lytton Pluton that is part of the complex has been age-dated at 212 Ma (Panish and Monger, 1992), which is very close to some dates reported from the central Guichon Batholith, which is located about 40 km to the northeast and contains the world-class Highland Valley ore bodies. Parrish and Monger interpret the Mount Lytton Complex and Guichon Batholith bodies to be part of the Upper Triassic magmatic arc complex that characterizes Quesnellia terrane, but state that they were probably emplaced at different structural levels, as suggested by their contrasting settings.
Monger speculates that the major structures that form the Guichon Batholith and the Mount Lytton Complex are related to early Mesozoic subduction/arc activity; those in the Guichon Batholith having formed in the upper part of the upper plate and those in the Mount Lytton Complex having formed in the lower part of the upper plate.
Gale (1993) believed the most interesting feature of the regional geology is the pronounced east-west structural grain of the Triassic rocks east of Lytton which appears to be abruptly terminated at its eastern end by one or more north-south faults along and parallel to the Thompson River. It is at the junction of these two strong structures that the Ashton Copper- Gold Prospect is located.
- - - - - -
Mobile Metal Ion ( M I ) Geochemical Survey Report Ashton Copper-Gold

Therefore as noted by Gale (1994) possibly copper-rich intrusive phases similar to those in the Guichon Batholith may also have formed in some intrusions in the Mount Lytton Complex.
Middle and Upper Cretaceous Spences Bridge Group rocks appear to unconformably overly rocks of the older Mount Lytton complex comprised of limy volcanics and limy sediments on the east side of the property. Here the Spences Bridge Group consists of an unaltered upper reddish coloured andesitic volcanic and may include locally felsic and matic flows and pyroclastics along with sandstone, shale and conglomerate beds. A major fault passes through the Spences Bridge Group on the east central part of the property andlor may represent the boundary between the Mount Lytton Complex and the Spences Bridge Group.
However exploration work conducted on the property from 1994 through to 1999, and in 2004, indicates that the property geology, a component of the regional picture, appears to be distinctively different fiom its contiguous neighbours, the Mount Lytton Complex to the west and the Spences Bridge Group to the east yet similar to the rocks to the north of the property across the Thompson River which were mapped by Brown (1981) as layered quartzo-feldspathic rocks in contact with weakly foliated plutonic zones ranging from tonalite through to diorite to gabbro.
This similarity was noted by Reid (1995) as a result of his thin section studies of rock chips recovered from a drilling part of the intrusive complex on the property. Reid concluded that rock types similar to those that Brown identified north of the property also underlie the property*
Monger shows the rocks mapped by Brown to the north of the property as younger granodiorite-quartz monzonite intrusions of the Mount Lytton Batholith
Thin section work by Reid (1995) shows that the intrusive rocks on the property are similar to those identified by Brown intrusive complex may share some similarities to both the dioritic and amphibolitic intrusions in the Mount Lytton Batholith and to the tonalite intrusions found associated with the younger granodiorite-quartz monzonite intrusions to the northwest of the property across the Thompson River.
Mobile Metal Ion ( M I ) Geochemical Survey Report Ash ton Copper -Gold
SECTION 8.0 - PROPERTY GEOLOGY & ALTERATION
Property surface geology is yet to be mapped. Salient portions have been mapped only cursorily where sparse outcrop was available in the geochemically anomalous area. Logging the percussion drilling cuttings provided the fnst look at the complex geology in the subcrop area of interest. However, what the spatial and temporal relationships of the many intrusive phases identified is presently unknown because the percussion drilling was unable to provide this data, including all important structural data. The most comprehensive and reliable geological data to date is that which was provided by Reid (1992), fiom a single thin section study; by Gale (1994), logging the percussion drill cuttings of 7 holes; and by Read (1995) from a comprehensive thin section study of drill chips selected by Gale as a result of his drill hole logging effort.
The geology is largely unexposed on surface but fiom observations of limited outcrop exposure and percussion drill hole data is different fiom the geology which is contiguous with it to the east and to the west. Geological work by Gale and Read indicate the probable scenario that this local area was intruded by an integral tonalite and diorite parent intrusive complex and further intruded by a complex of quartz-diorite, diorite porphyry, albitite and gabbro.
This intrusive complex lies between the east edge of the Mount Lytton Batholith and a major fault structure to the east which is the west edge of the Upper Cretaceous Spences Bridge Group. The fault structure is the southern extension of a major fault that extends down the Thompson River canyon to the north projecting into the central part of the property-
Monger shows part of the Mount Lytton Complex to the west of the property as composed of layered quartz-feldspar rock, amphibolite and mylonite. Therefore the property intrusive complex appears to have distinctively different lithology.
J. W. Antal (1969) described the volcanic-sedimentary lithology as a monoclinic structure dipping 40 degrees to the east.
Geological observations reported by S.W. Smith, Geologist, in his 'Assessment Report', Geological Mapping and Geological Sampling on the Ashton Property" of 20 September, 1993' have now been superceded by new interpretations by Gale and Read, however Smith's observations of some of the diorite outcrop and skarnification are still valid and noteworthy.
Mobile Metal Ion (MMI) Geochemical Survey Report Ashton Copper-Gold

Smith described the host volcanic-sedimentary rock succession on the east and southeast side of the mineral bearing intrusive complex as:
"The limestone varies from a clean white crystalline variety with a massive appearance to a thinly bedded grey silty variety. m e limestone be& were noted to be from 0.5 to 5 m thick Interbedded with the limestone was fine to medium-grained green volcanic tuff that war much wider in width. The volcanics were commonly limy. Locally these rocks were very strongly altered and fractured, with the strongest alteration seen in the vicinity of the old trenches in the northwestern portion of the Sheryl claim ". (now the Rebecca 2 claim)
Altered diorite found by this writer in surface outcrop at Line 5400 North, Station 2+50 West is dark-grey to black in colour and assayed 737 ppm copper. P.B. Read, Ph.D. (1990) reported the results of his petrographic study on this sample as follows:
"The original rock may have been a fine-grained pyroxene? diorite but this rock has been nearly obliterated by an alteration assemblage of tourmaline- epidote-calcite-chlorite-sphene-pyrite which is cut by a few albite-calcite veinlets. The tourmaline is a major part of the alteration assemblage and indicates the presence of signijcant volatiles in the solutions causing the alteration"
Therefore the volatiles were most likely copper-rich and are believed to have been exsolved from a copper-rich fluid during magma crystallization during porphyry formation.
According to Smith (1 993):
"hydrothermal alteration of the volcanics to the east and southeast was seen on a wide scale causing bleaching and quartdcarbonate veining within them. Epidote is the most common alteration mineral. Locally the diorite is so strongly altered that only epidote and magnetite can be seen. Secondary chlorite and calcite are also quite prevalent throughout the complex. The propylitic alteration (epidote, chlorite
pyrite) identifed in the volcanics and diorite provides surface indication that a signifcant porphyry style intrusive system underlies the area. "
The 1993, 7-hole percussion drilling program for each hole provided a suite of typical cuttings taken at 10-foot intervals. The cuttings were meticulously logged with the aid of a binocular microscope by Gale (1994), and this work was the fast in-depth study of property geology and alteration. Gale observed that there were at least three (3) distinct types of mineralized and altered intrusives within the subcropping area of interest. The intrusives
15
Mobile Metal Ion ( M I ) Geochemical Survey Report Ashton Copper-Go1 d

cited in his report conclusions included: quartz diorite, diorite, and gabbro. He also noted diorite-porphyry in the report details.
Part of Reid's (1 995) petrographical study conclusions included:
"the drill chips indicate that pyoxene gabbro, pyoxenite, and their altered equivalents are as widespread as horneblende diorite, horneblendite, and their altered products. Gale 'i identifications (1 994) of marble and calcsilicate shrn are verified and mean that metasedimentary roch are another element that must be included in the north end of the Mount Lytton Complextt.
Gale stated that mineralization occurs both as disseminated zones and mineralized vein systems, probably along the predominent northerly trend of structures noted in the area. Alteration in the form of calcite flooding and quartz and calcite veining was noted in all of the southernmost holes, RC93-1 through 93-5 and therefore is widespread throughout the latter area.
Essentially the aleration noted in the drilled area around the large disseminated sulphide target found in the 1999 deep-probe IP survey represents the propylitic zone of a probable copper bearing porphyry within the core area of the disseminated sulphide body.
The drilling also shows that marblization and skarnification found on surface on the east side of the drilled area appears to increase easterly and southeasterly and to depth within the contact aureole fiom the large disseminated sulphide body identified fiom the 1999 deep- probe IP survey.
Skamification with significant copper mineralization is found in surface outcrop along the old logging cut east of drill hole RCA93-5 and is also found sporadically where exposed in outcrop for more than 600 metres (2,000 feet) southeasterly fiom the edge of the disseminated sulphide body. The geochemical survey of 1969 also indicates narrow anomalous copper-in-soils zones striking northerly within this 600 metre interval to the southeast.
Monger (1989) mapped a major normal-fault that strikes about north-south and appears to pass near Station 400 of Line 100-South of Deep-Probe IP Survey 1. The fault extends northward to the Thompson River and coincides with it in undulating fashion with the northward extension of the river. The east side of the fault is down-thrown. No information on the fault's displacement is given.
Although speculation, a second major north-south striking normal-fault may lie between the west side of the intrusive complex and the Mount Lytton Batholith Complex in which case the property intrusive complex may be bounded on each side by major fault structures. The
16 - ---- -
Mobile Metal Ion ( M M I ) Geochemical Survey Report Ashton Copper-Gold

faulting has resulted in several north-south parallel shears and structural breaks within the altered area of interest and were sporadically noted in the limited exposed outcrop yet are most apparent from some of the strong north striking VLF-EM anomalies of which some are diagnosed as ionic conductors.
Prospecting surface outcrop, by the writer in 2004, on the west and south side of the property as shown in Figure 4 resulted in the discovery of a large zone of intensely fractured and broken quartz-diorite which is intensely hydrothermally altered (Reid, 2004, personal communication) with epidote and chlorite prominent, and with black vitreous crystals identified as tourmaline. This location appears to be above the large disseminated- sulphide body diagnosed as Porphyry Copper Deposit 1, found by the 1999 IP survey near its projected west extension. The stockwork fi-actures are filled with the low temperature zeolite mineral laumontite. This occurrence represents a significant westward extension of the known propylitic zone that overlies the disseminated sulphide body to the east.
The intensely altered, fractured, and broken diorite is diagnosed as the fractured margin, or shoulder zone of the proximal intrusive porphyry.
Another interesting structural feature contiguous with the quartz-diorite to the south is a breccia zone cemented with what may be hydrothermal calcite. The type of breccia is yet to be determined.
Mobile Metal Ion (MMI) Geochemical Survey Report Ashton Copper-Gold

SECTION 9.0 - MMI GEOCHEMICAL SOIL SURVEY
9.1 Introduction
The following six personnel from Geotronics Consulting Inc. under the supervision of D. G. Mark, P. Geo., carried out the Mobile Metal Ion (MMI) soil geochemical survey and the associated grid preparation including a section of baseline. J. M. Ashton, P. Eng., accompanied the field party to the property on the first day to locate the 1983 grid and confirm the location of the two-line MMI geochemical survey. Field work was conducted from July 11 to July 13,2006 inclusive:
The following personnel conducted the field survey:
Personnel Job Description
1. J. M. Ashton, P. Eng. 2. D. G. Mark, P. Geo. 3. Dan Kemp 4. Matt Fraser 5. Cody Allard 6. Travis Orange 7. Troy Macleod 8. Mattias Smith
Project Principal Project Manager & Consultant Party Chief & Soil Survey Technician Assistant Party Chief & Soil Survey Technician Survey Helper, Grid Layout & Linecutter Survey Helper, Grid Layout & Linecutter Survey Helper, Grid Layout & Linecutter Survey Helper, Grid Layout & Linecutter
9.2 Grid-Line Preparation
9.2.1 Introduction
As stated in Section 1 .O, Introduction, a large deep-probe induced-polarization (IP) survey is planned as soon as h d s are procured to cover the principal target areas on the property. The IP survey will cover at least that area between Line 4000 North and Line 5800 North generally between Stations 900 East and Stations 700 West to enable 111 coverage of the IP survey to 420 metres to 420 metres depth between Stations 500 East, to Stations 500 West.
Accordingly, it was considered to be cost effective to have the MMI sampling crew also prepare part of the baseline using chain measured and pegged line co-ordinates for the future IP survey. This will facilitate locating future grid lines properly tied into the MMI survey lines.
Mobile Metal Ion ( M M I ) Geochemical Survey Report Ashton Copper-Go1 d

The MMI geochemical soils survey covered Line 4500 North between Stations 700 East to Station 700 West, and Line 4400 North between Station 700 East and 450 West.
9.2.2 Preparation of Baseline & Grid Lines 45 North and 44 North
The baseline was surveyed with compass and chain. It is laid out in the direction of Astronomical North at an Azimuth of 00 degrees. The offset gridlines strike East from the Baseline at an Azimuth of 090 degrees and strike West from the Baseline at an Azimuth of 270 degrees.
During the course of the survey, the baseline and two grid-lines were tied into existing roads, trails, the existing property grid where found, and the common legal comer post of the Rebecca 2 and Rebecca 3 mineral claims which is located near Line 5000 North and the baseline.
1.4 km of baseline was prepared; and 2.55 km of gridline was prepared simultaneously as the MMI sampling took place.
Steep mountainous slopes and bush did reduce working efficiency.
9.3 Background & Survey Objective
A review of the 1994 conventional multi-element geochemical data, which did not include gold assays, revealed that there was a significant arsenic-in-soils anomaly, Arsenic Anomaly 2, along the south contact aureole of the interpreted porphyry body now identified as a Porphyry Copper Deposit 1. The arsenic data was plotted to show the relationship with the copper-in-soils anomaly and the interpreted position of the porphyry deposit. The arsenic anomaly is contiguous with, and partly overlaps the very strong copper-in-soils anomaly, Copper Anomaly 2, which terminates to the south in a diagonal line running southeast from about Line 4700 at the west end to east of the baseline on Line 4500 as shown in Figure 5. Arsenic is known as the best universal indicator for gold deposits.
There is one broad low level response arsenic anomaly, categorized as anomalous, which covers a part of the diagnosed porphyry. A distinct extremely anomalous arsenic anomaly, Arsenic Anomaly 2, is located along the south contact aureole of the porphyry and a small extremely anomalous arsenic anomaly, Arsenic Anomaly 2A, is within the boundary of the diagnosed porphyry east of the baseline embedded in a very anomalous copper area.
The strong Arsenic Anomaly 2 could be part of the metal zoning of the porphyry, or it could be a separate feature. The separate feature idea is supported by the altered rock sample, Sample A04-102 (Appendix C), taken near Line 4700, Station 400 West in 2004 which was extremely anomalous in gold pathfinder elements and diagnostic of the surface metal zoning
19
Mobile Metal Ion (MMI) Geochemical Survey Report Ash ton Copper -Go1 d

expression of an epithemal gold mineralizing event at depth, in which case a separate gold- rich magmatic-hydrothermal system at depth may have provided gold rich fluids to deposit epithemal gold below this area. The other alternative is a possible telescoped hydrothermal system related to Porphyry Copper Deposit 1 where both high-temperature porphyry mineralization and low temperature epithemal gold mineralization have occurred in close proximity through overprinting as mentioned by Jensen and Barton, 2000.
Another arsenic anomaly shown as Arsenic Anomaly 1 in Figure 4 and Figure 5 is considered very anomalous to extremely anomalous and is contiguous with very strong Copper Anomaly 1. Both of these anomalies are interpreted as surface geochemcial expressions related to diagnosed Massive Sulphide Deposit 1 whose apex subcrops these two linear geochemical features 120 metres (400 feet) below the surface. The arsenic in association with the copper could be indicative of gold associated with the copper in this interpreted massive sulphide body.
Because of the possibility that the anomalous arsenic here is a primary gold pathfinder element, led to a lithogeochemical prospecting trip to the property in the summer of 2004 to specifically examine and sample the rocks in the vicinity of Arsenic Anomaly 1 and Arsenic Anomaly 2.
Outcrop prospecting focused on Arsenic Anomaly 2 near Line 4700 North, Station 500 West resulted in the discovery of a large exposure of intensely fractured and broken diorite or gabbro, hydrothermally altered with epidote and chlorite predominating. Stock- work fractures are filled with the low temperature zeolite, laumontite (Read, thin section). The relict plagioclase has been heavily altered by sericite and zoisite. However, contiguous with this zone to the south a breccia zone with hydrothermally altered breccia clasts, believed to be diorite, are cemented with calcite containing about 30% CaC04. The pink to buff coloured calcite within the vugs appears almost plate-like. It is not known whether the calcite is hypogene or supergene.
According to Hedenquist et al, 2,000, in "Exploration for Epithermal Gold Deposits" p.267:
"alteration minerals can provide much information on the fluid source that developed them and he notes that the presence of adularia and calcite suggests relatively alkaline fluid perhaps generated from a neutral-pH fluid by the loss of CO2 during boiling"
"Zeolites also indicate somewhat alkaline conditions and, along with the occurrence of epidote, provide evidence for relatively low gas contents in the fluid"
"Calcite forms in place of zeolites from fluidi of high CO2 content. High gas content is favourable for ore formation because this implies a high H S content
2 0
Mobile Metal Ion ( M M I ) Geochemical Survey Report Ashton Copper-Gold
and thus a high gold solubility. "
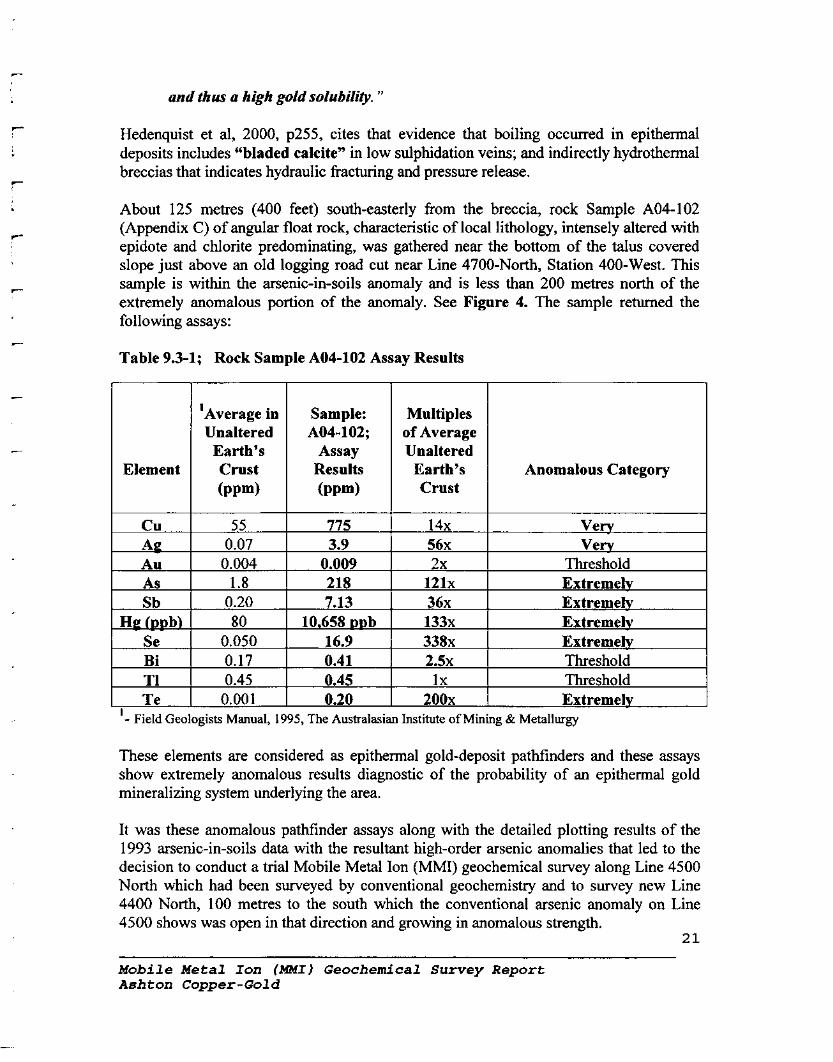
Hedenquist et al, 2000, p255, cites that evidence that boiling occurred in epithermal deposits includes "bladed calcite" in low sulphidation veins; and indirectly hydrothermal breccias that indicates hydraulic fracturing and pressure release.
About 125 metres (400 feet) south-easterly from the breccia, rock Sample A04402 (Appendix C) of angular float rock, characteristic of local lithology, intensely altered with epidote and chlorite predominating, was gathered near the bottom of the talus covered slope just above an old logging road cut near Line 4700-North, Station 400-West. This sample is within the arsenic-in-soils anomaly and is less than 200 metres north of the extremely anomalous portion of the anomaly. See Figure 4. The sample returned the following assays:
Table 9.3-1; Rock Sample A04402 Assay Results
Anomalous Category Element
Au 0.004 0.009 2x Threshold I
1 Average in Unaltered Earth's Crust (PPm)
Cu
'- Field Geologists Manual, 1995, The Australasian Institute of Mining & Metallurgy
Sample: A04-102;
Assay Results (PPW
Ae 0.07 3.9 56x Very A
55
As Sb
HP (ppb) Se Bi T1 Te .
These elements are considered as epithermal gold-deposit pathfinders and these assays show extremely anomalous results diagnostic of the probability of an epithermal gold mineralizing system underlying the area.
Multiples of Average Unaltered
Earth's Crust
It was these anomalous pathfinder assays along with the detailed plotting results of the
775
1.8 0.20 80
0.050 0.17 0.45 0.001
1993 arsenic-in-soils data with the resultant high-order arsenic anomalies that led to the decision to conduct a trial Mobile Metal Ion (MMI) geochemical survey along Line 4500 North which had been surveyed by conventional geochemistry and to survey new Line 4400 North, 100 metres to the south which the conventional arsenic anomaly on Line 4500 shows was open in that direction and growing in anomalous strength.
21
14x
218 7.13
10.658 ppb 16.9 0.41 0.45 0.20
Mobile Metal Ion (MMI) Geochemical Survey Report Ashton Copper-Gold
-- - - -
Very
121x 36x 133x 338x 2 . 5 ~ lx
200x
Extremely Extremely Extremely Extremely Threshold Threshold Extremely

Rock chip assays from all five percussion holes over variable but significant widths drilled into the propylitic zone of Porphyry Copper Deposit 1 returned extremely anomalous assays in As and Sb. According to Williams and Forrester, 1995, on metal zoning in porphyry copper deposits, As and Sb are enriched in open zones comprised of veins, breccias and other open features where sulphur is deficient, and typically ores of this nature occur at the base of the degassing zone.
However tellurium is considered the most diagnostically significant element of the gold- pathfinder assays obtained from the 2004 rock sampling program where Sample A04-102 showed extremely anomalous tellurium at 200 ppb; which is 200 times background in the unaltered Earth's crust. Tellurium abundance in mantle and crustal rocks are similar to gold. According to Jensen and Barton, 2000, Te is a fbndamental characteristic of alkaline-related hydrothermal systems. It is related to alkaline magmatism and is seen in some gold-rich porphyry copper deposits where they are characterized by telluride-rich mineralization, extensive carbonation, and voluminous K-metasomatism. Feldspar and carbonate-rich alteration appear to dominate.
Also according to Jensen & Barton:
"Alkaline epithermal systems are found in close spatial and temporal association with porphyry style mineralization where such juxtapositions of high and low temperature styles of alteration and mineralization are characteristic of telescoping hydrothermal systems"
"Alkaline-related gold deposits include high-grade, low temperature epithermal deposits and low-grade, high-temperature base metal-rich deposits. Deposits include those with mafk to intermediate rock types"
Thus far the intrusive host rock complex consists of mafic to intermediate rocks types. Included in their paper on alkaline-related hydrothermal systems, sodic alteration is also found peripheral to zones of potassic alteration which is also observed in the propylitic alteration zone of Porphyry 1 by the abundant albitization (and saussuritization) noted in thin section by Read, 1995, from drill chips selected by Gale, 1994.
Another potential diagnostic feature is the intense and widespread carbonatization pervading throughout the system reported by Gale, 1995, which may in part be related to undiagnosed low-temperature epithermal character which remains to be evaluated in this system. The voluminous carbonatization is an exhibition of a hydrothermal system with a considerable amount of carbon-dioxide involved. Hedenquist et al, 2000, states that: the loss of CO2 leads to the deposition of calcite. Whereas Jensen & Barton, 2000, cite T O 2 concentration related to alkaline magmatism are variable but are typically described as moderate to high. These observations are also supported by the common presence of voluminous carbonate alteration" and "The abundance of low-temperature carbonate alteration may be taken as additional evidence of for boiling. "
22
Mobile Metal Ion (MMI) Geochemical Survey Report Ash t on Copper - Go1 d

Hence the system is a complex one and may be interpreted in several ways; but each interpretation indicates a potential mineral resource that could have economic significance.
The arsenic anomaly shown in Figure 4 covers an area 400 metres east to west by 300 metres north-south which is open to the south and shows increasing strength in that direction; indicating a probable outflow zone to a hydrothermal alteration centre. The arsenic could be a vector to an epithermal precious metals resource at depth in this vicinity.
On the basis of relative mobility, in the epithermal and mesothermal precious metals environment, the highly mobile group elements Hg, As, Sb, Se, and T1 will travel upward and outward and have large and near surface halos followed in succession with depth by Au and Ag with increasing AgIAu ratio with depth. Te behaves similar to Sb and is also found in propylitic alteration zones.
9.4 Mobile Metal Ion (MMI) Geochemical Theory & Fundamentals
9.4.1 The Mobile Metal Ion 0 Geochemical Theory
Notwithstanding the above modem conventional multi-element geochemical techniques a Mobile Metal Ion (MMI) survey conducted over the known mineralized area and contiguous area could prove to be of significant benefit to locate the locus of more deeply buried mineralization and its associated metal zoning, at least that is what is espoused by the developers of the new technology. It would appear that this new technique when used in concert with other corroborating data could serve as an additional vector for the identification of an epithermal gold deposit which is the target sought in this survey.
Referring to the MMI Technical Bulletins provided by the developers of the MMI process, MMI Technology, a Division of Wamtech Pty. Ltd. of Australia, this unique method of analysis MMI is used to describe ions which have moved in the weathering zone that are only weakly or loosely attached to surface soil particles. Also according to the developers of the technique it has been proven using radioactive isotope geochemistry that these Mobile Metal Ions are transported from deeply buried mineral deposits to the surface. Geoscientists from around the world have been studying this phenomenon for many years. Research and case studies over known ore-bodies have shown that mobile metal ions accumulate in surface soils above mineralization indicating that the metals are derived from oxidation of the mineralization source.
Generally as the Mobile Metal Ions reach the surface they attach themselves weakly to the soil particles, and these specific ions are the ones measured by the MMI technique to fmd mineralization at depth. They are at very low concentrations and because the ions have recently arrived at surface they provide a precise "signal" of the location of subcropping concentrations of minerals that could prove to be economically significant. Their lifetime in
23
Mobile Metal Ion ( M M I ) Geochemical Survey Report Ashton Copper - Go1 d

the ionic state at surface is very limited because they are subject to degradation and molecular binding or fixation into molecular forms by weathering but as long as the flow of ions is maintained, are detectable. Their limited lifetime precludes their detection by lateral circulation; accordingly they do not move away from the source of mineralization.
Hence by only measuring the mobile metal ions in the surface soils, the MMI geochemistry is attested to produce very sharp anomalous responses directly over the source of the mobile ions. The source would be diagnosed as mineralization at depth which emit metal ions characteristic of that mineralization.
9.4.2 Fundamentals
Testimonials from the originators of the MMI technique and those whom have had practical experience, and from the results of several case studies, attest to the preciseness of the technique; e.g., anomalous MMI responses of the responding elements are indicative of the of the presence of that element directly below the sample site location.
To explain the significance of silver responses accompanying gold responses Walter Grondin, Ph.D., (personal communication, 6 September, 2006) consultant to SGS Minerals, Toronto, explained that gold anomalies accompanied by silver are indicative of primary gold mineralization whereas gold anomalies only, in the absence of silver, are representative of remobilisation. Supergene enriched gold deposits provide case study examples of gold anomalies that are not accompanied by silver.
9.5 Survey & Sampling Procedure
The old south to north Baseline was located and a section 1,400 metres long was cut out with axes and power saws. Baseline stations were marked every 25 metres with 60 cm wooden pickets with an aluminium tag stapled to each picket with the Baseline coordinates marked thereon.
The starting points for the MMI Geochemical Survey were at Baseline Stations 4400 North+OO, and 4500 North+OO. Survey sampling lines were run out on an east-west or west- east compass line and marked by blazing trees and attaching red flagging at appropriate intervals. Survey lines were placed simultaneously as soil sampling was being carried out. Sampling stations occurred at 50 metre intervals along each survey line. At each sampling Station 60 cm wood pickets were driven into the ground with an aluminium tag stapled to it with the Line and Station coordinates marked on the tag.
Mobile Metal Ion (MI) Geochemical Survey Report Ash ton Copper -Go1 d
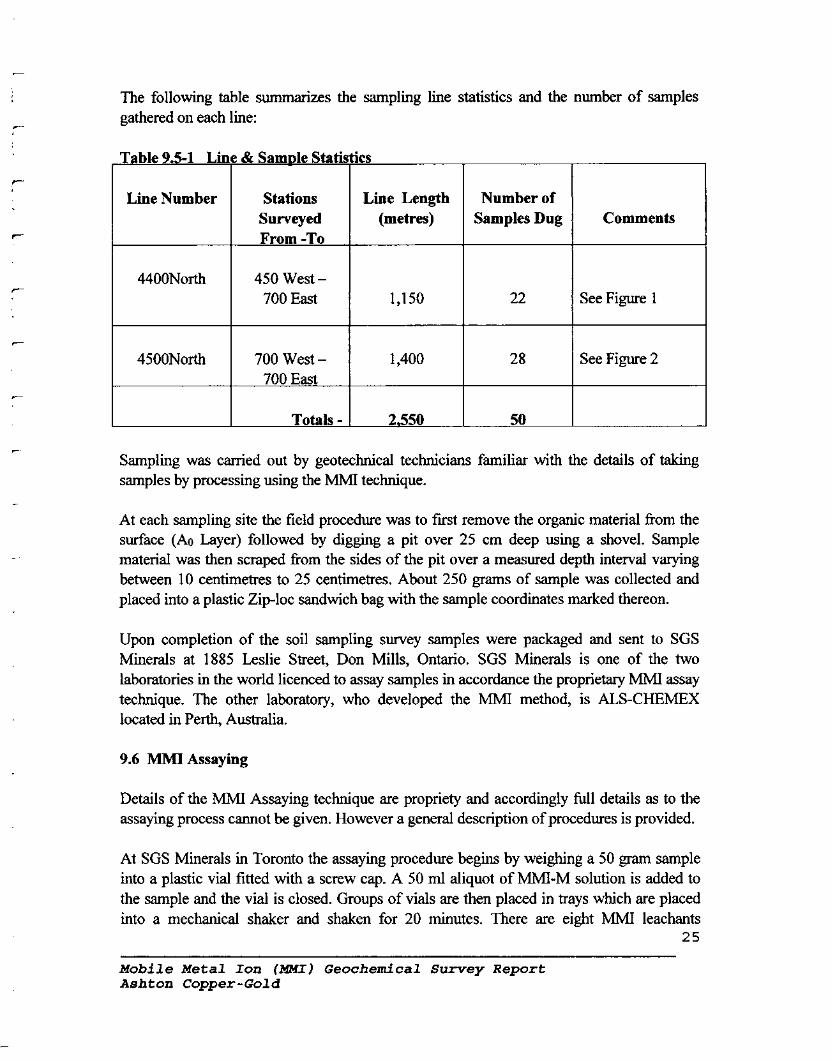
The following table summarizes the sampling line statistics and the number of samples gathered on each line:
Table 9.5-1 Lin
Line Number
I & Sample Statistics
Stations Line Length Surveyed (metres)
450 West - 700 East
700 West - 1,400
Totals - I 2,550
Number of Samples Dug Comments
See Figure 1
See Figure 2
Sampling was carried out by geotechnical technicians familiar with the details of taking samples by processing using the MMI technique.
At each sampling site the field procedure was to first remove the organic material fiom the surface (A0 Layer) followed by digging a pit over 25 cm deep using a shovel. Sample material was then scraped from the sides of the pit over a measured depth interval varying between 10 centimetres to 25 centimetres. About 250 grams of sample was collected and placed into a plastic Zip-loc sandwich bag with the sample coordinates marked thereon.
Upon completion of the soil sampling survey samples were packaged and sent to SGS Minerals at 1885 Leslie Street, Don Mills, Ontario. SGS Minerals is one of the two laboratories in the world licenced to assay samples in accordance the proprietary MMI assay technique. The other laboratory, who developed the MMI method, is ALS-CHEMEX located in Perth, Australia.
9.6 MMI Assaying
Details of the MMI Assaying technique are propriety and accordingly 111 details as to the assaying process cannot be given. However a general description of procedures is provided.
At SGS Minerals in Toronto the assaying procedure begins by weighmg a 50 gram sample into a plastic vial fitted with a screw cap. A 50 rnl aliquot of MMI-M solution is added to the sample and the vial is closed. Groups of vials are then placed in trays which are placed into a mechanical shaker and shaken for 20 minutes. There are eight MMI leachants
25
Mobile Metal Ion (MMI) Geochemical Survey Report Ashton Copper-Gold
currently available of which the MMI-M leachant represents the 42-element extraction.
The MMI-M solution is a neutral mixture of leachant solutions which have been specially developed to selectively release adsorbed ions fiom the soil substrate without attacking or influencing the natural mineralization of the soil or specific substrates. The leachate solution is applied to the sample for a 20 minute retention time which effectively collects loosely bound ions of any of the 42 elements on the soil substrate and holds the ions in solution. The ion-pregnant solution is allowed to sit overnight and subsequently centrifuged for 10minutes. The solution is then diluted to 20 times by volume which represents an overall dilution factor 200 times. This diluted solution is then transferred to plastic test tubes fiom which aliquots are taken for analyses on Inductively Coupled Plasma-Mass Spectrograph (ICP-MS) instrumentation.
Results fiom the ICP-MS instrumentation is processed automatically with the recovered assay data loaded into the Laboratory Information Management System (LIMS). Following quality control analysis the data results are available in software format or hardcopy.
9.7 Data Preparation
Data was prepared for interpretation purposes in accordance with the recommendations made in Warmtech Pty. Ltd's Version 5.04 of the MMI Manual for Mobile Metal Ion Geochemical Soils Surveys.
Two key sets of data are utilized for interpretation purposes. The first is determination of "Background Value" followed by determination of "Response Ratio".
Background Value is defined as the arithmetical average of the lowest quartile (25%) population of assays of the element being assessed as to its probable significance.
Once the Background Value is known then each assay for that element is normalized in relationship to the Background Value to arrive at a "Response Ration
Response Ratio is defmed by dividing the element assay value by the Background Value to anive at a mixed number (an integer and a decimal component). Mixed numbers are rounded off to arrive at a whole integer. Determination of anomalous character is made by comparative analyses of the magnitude of Response Ratio. An isopleth plot of response ratios can be utilized to construct areas of anomalous interest.
Response Ratio bar histograms were plotted for groups of elements that are suspected as sharing a common genetic relationship, e.g., Au, Ag, As, and Cu for each sample point along each line surveyed.
Mobile Metal Ion (MMI) Geochemical Survey Report Ashton Copper-Go1 d

Of the 42 elements assayed and reported on, only 9 elements are presented in coloured hardcopy histogram format. These elements were divided into two separate groups, Group 1; Au, Ag, As, Cu, and, Group 2; Cu, Pb, Zn, Mo, Co, and Ni. Three elements, C q As, and Au were plotted in contour form.
MMI copper was plotted to compare its relative Response-Ratio strength with the known conventional copper in soils geochemistry. Similarly arsenic was plotted to compare its relative Response-Ratio strength with the known conventional arsenic in soils geochemistry. These same element plots using two unique assay technologies when compared would be expected to closely replicate one another as the two soils surveys were essentially sampling the same populations of elements distributed in the soil even though the assaying employed fundamentally different extraction techniques.
Notwithstanding, the conventional assays will included metals accumulated in the soils from both mechanical and chemical dispersion from beyond the sample site whereas the MMI method measures only the upward dispersion of metal ions directly fiom the subcropping primary source of the metal. It is fundamental to the scientific method that even though two divergent means are used to test an hypothesis that similar conclusions be reached possibly more particularly if the metals are widely present. Essentially closely comparable results in form would provide validity of the new MMI technology.
By assaying for MMI gold where gold content of the soils had not previously been assayed by conventional method, showing a positive correlation with one of gold's primary pathfinder elements, arsenic, would enable, by extrapolation, the supporting diagnosis that the locations of the known conventional arsenic anomalies as shown in Figure 4 in terms of probability also represent potential subcropping areas of anomalous gold. According to Boyle, 1979, all investigators agree that As and Sb, particularly As are the best universal indicators for gold. Current geochemical literature continues to attest to this fact.
MMI Cu and MMI As for comparative analysis purposes with previous conventional arsenic and copper data were plotted in isopleth format over the integral MMI survey area and conventional geochemical survey area. Similarly, MMI gold was plotted to correlate it with both the MMI and conventional geochemical assay data. Response Ratio isopleth boundaries were plotted based upon the rule of geometric progression with the isopleths separating the various anomalous categories
9.8 MMI Survey Results
The following Background values are shown for Ashton Cu-Au and a project near Afton Mines. The Background values were determined by arithmetically averaging the lower quartile (25%) of the assay values for each of the respective elements. They are a comparison of background values at Ashton Cu-Au with the Afton camp and are provided
27
Mobile Metal Ion ( M I ) Geochemical Survey Report Ash ton Copper -Go1 d

because they were available and might be usem in the future. Comparative analysis may only be academic until studied in fUrther detail as to their relative significance. The Afton camp Background Values were measured in highly prospective altered ground contiguous to the former Afton Mines mineral property to the southwest.
Table 9.8-1; Background Values of Elements Determined by MMI Survey
Item
*,miLha Average Assay Value of Lower Quartile of Sample Population or
1. 2.
Background Value (~pb) C 7 C
Element
* Generally rounded off to nearest integer. Personal communication, D. G. Mark, P. Geo.
1- In the Afton area almost all of the arsenic sample population is at the Background level; whereas at Ashton Cu-Au, arsenic values are mostly in the three anomalous categories ranging fiom
anomalous, to very anomalous, to extremely anomalous.
Average Assay Value of Lower Quartile of Sample Population, or
Cu Au
Generally the Ashton Cu-Au background values, as shown, are consistently much higher than the Afton area except for gold, arsenic, and molybdenum which are essentially identical. Afton nickel backgrounds are very high compared with Ashton Cu-Au.
Bacbround Value (DD~) 1,374 0.108
9.9 Defining Anomalous Classes & Plotting Results
Defining anomalous character is a relative issue. A high Response Ratio under one set of geological and hydrothermal alteration conditions can be anomalous and warrants detailed follow-up as to the cause of the anomaly just as a low Response Ratio under another set of geological and alteration conditions can be anomalous and warrants detailed follow-up as to the cause of the anomaly. However where an anomaly coincides with another anomaly, or several anomalies including but not limited to well defined geophysical, geochemical, geological and alteration features the MMI method essentially becomes another supporting vector as to the likelihood or probability that the target is highly prospective for the commodity sought.
- - - - --
Mobile Metal Ion ( M M I ) Geochemical Survey Report Ashton Copper-Gold
The following, with minor modifications to facilitate contouring, is generally in accordance with the Wamtech Pty. Ltd's 2004, Version 5.04 MMI Manual.
After determining the Response Ratio of each target element a sample with a Response- Ratio of 2.5 units or less was arbitrarily considered low (whereas the MMI Manual chooses 1.0 unit) and is considered a background sample.
Samples within the Response Ratio range fiom 2.5 units to 5.0 units are considered to be within the anomalous threshold; but this selection was made only for contouring purposes. Samples with response ratios greater than 5 units could be considered significant depending upon the regolithflandform characteristics of the area and the sample spacing used for the survey. They caution: that due to the greater contrast inherent in the MMI technique Response Ratios in general need to be greater than 2 to 5 times background before being considered "anomalous ". If composite sampling has been employed then Response Ratios greater than 5.0 may be highly significant. Obviously, this may change depending upon the overall distribution and magnitude of Response Ratios in an area. For example some areas may have anomalous Au values at 10 whereas for another area the anomalous Au values may be those samples with a Response Ratio greater than 20.
The above is not too different to the ideas of Robert Boyle, 1979, where he cited average specific Background values in soils, weathered residiuum and glacial materials as Au, (5ppb); Ag, (0.1 to 0.5 ppm); Cu, (20ppm); As, (7ppm); plus a host of other elements. He stated that values above 10 ppb Au and 0.7 ppm Ag are generally anomalous and should prompt the prospector to investigate the cause. Anomalous values of the indicator elements cannot be stated with any assurance since the dispersion and enrichments characteristics of the various elements vary so widely. However, consistent values of 2 or 3 times the average abundance of the figures given above should receive attention.
Accordingly, as a first step to evaluate the results of the MMI survey three elements of interest were chosen, fiom the 42 separate element determinations made, for plotting purposes in order to assess their respective anomalous characters in relationship to the known geophysical, geochemical and geological anomalies within the MMI sampled area.
Isopleth plotting intervals to defme anomalous levels were chosen using the method of geometrical progression which best fits both Boyle's idea and the ideas given in the MMI Manual. Geometrical progression is a sequence of numbers in which the ratio of a term to its predecessor is always the same. In this case a succeeding group of numbers which defmes an anomalous interval is always nominally twice the preceding interval according to the following table. All anomalous intervals were plotted on the basis of this table.
-- - - - -
Mobile Metal Ion ( M M I ) Geochemical Survey Report Ashton Copper-Gold

Table 9.9-1; Table of Anomalous Classes & Frequencies for Cu, Au & As
Ratio" Class
Boundaries
Anomalous Class
Background
Frequency of Copper
Assavs
Anomalous Threshold
As shown on the data sheets, all Response Ratios are reported to the nearest second decimal place. However for data plotted in contop and profile form, Response Ratios were rounded off to the nearest whole integer except those that under round-off would have fallen into a lower class boundary.
30
Anomalous
Very Anomalous
Extremely Anomalous
TOTALS -
Included in Table 9.9-1 are the frequencies of element populations in accordance with the anomalous class and the class boundaries of the respective Class Boundaries. The elements of primary interest shown are Au, As & Cu. Accordingly, this table provides at a glance the frequency distribution of element populations according to the defined anomalous class. Because Backgrounds have been raised from 1.0 Response Ratio unit to 2.5 Response Ratio units only diminishes the size of the anomalous threshold area a bit and does nothing to change the anomalous areal extent of an anomaly.
Frequency of Gold Assays
12
The following table was constructed for the purposes of defining the conventional As assay in soils anomalous classes, from which the isopleth anomalous plots are found in Figures 4 and 5.
Frequency of Arsenic
Assavs
15
7
1
0
50
-- -
Mobile Metal Ion (=I) Geochemical Survey Report Ashton Copper-Go1 d
24
13 9
12
8
2
50
16
0
1
50
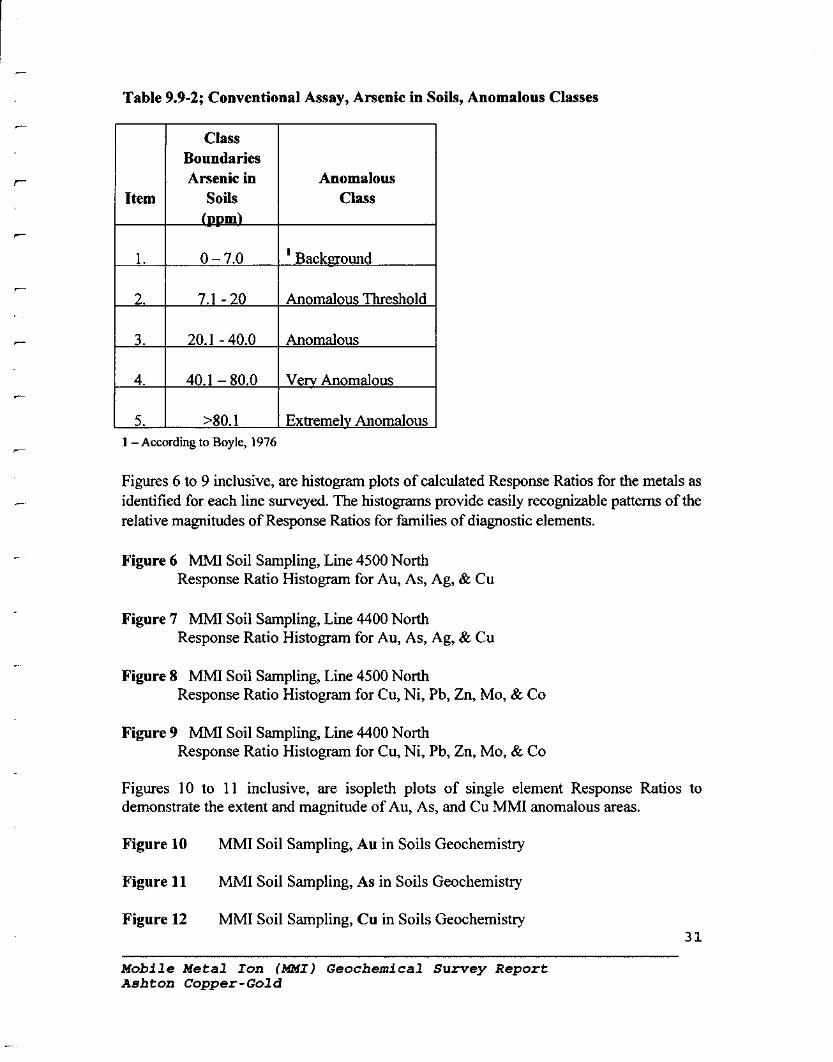
Table 9.9-2; Conventional Assay, Arsenic in Soils, Anomalous Classes
Item
1.
Class Boundaries Arsenic in
Soils bum)
2.
Anomalous Class
0 - 7.0
3.
1 5. 1 >80. 1 I Extremely Anomalous I
1 Background
7.1 - 20
4.
1 - According to Boyle, 1976
Anomalous Threshold
20.1 - 40.0
Figures 6 to 9 inclusive, are histogram plots of calculated Response Ratios for the metals as identified for each line surveyed. The histograms provide easily recognizable patterns of the relative magnitudes of Response Ratios for families of diagnostic elements.
Anomalous
40.1 - 80.0
Figure 6 MMI Soil Sampling, Line 4500 North Response Ratio Histogram for Au, As, Ag, & Cu
Very Anomalous
Figure 7 MMI Soil Sampling, Line 4400 North Response Ratio Histogram for Au, As, Ag, & Cu
Figure 8 MMI Soil Sampling, Line 4500 North Response Ratio Histogram for Cu, Ni, Pb, Zn, Mo, & Co
Figure 9 MMI Soil Sampling, Line 4400 North Response Ratio Histogram for Cu, Ni, Pb, Zn, Mo, & Co
Figures 10 to 11 inclusive, are isopleth plots of single element Response Ratios to demonstrate the extent and magnitude of Au, As, and Cu MMI anomalous areas.
Figure 10 MMI Soil Sampling, Au in Soils Geochemistry
Figure 11 MMI Soil Sampling, As in Soils Geochemistry
Figure 12 MMI Soil Sampling, Cu in Soils Geochemistry 31
Mobile Metal Ion (MMI) Geochemical Survey Report Asht on Copper - Go1 d

Figure 13, Composite Interpretation Sketch, provides a summary of the spatial relationship of anomalies and previously diagnosed mineral resources.
9.10 Discussion of Results
9.10.1 General
For the purposes of evaluating the MMI data isopleth contours were plotted for the principal metals of interest, gold, copper, and arsenic because historical conventional soils geochemical data exists for both copper and arsenic; but not gold. A correspondence of copper and arsenic of the MMI survey and the conventional geochemical survey data for the same elements could be usell in extrapolating the extent of anomalous gold areas which were not determined in the conventional soils survey but which are now of economic interest in assessing a gold component to the diagnosed porphyry copper body and the diagnosed massive sulphide body.
The two targets here, Ashton, 1999, is a porphyry copper deposit which was diagnosed fiom a deep-probe induced polarization survey conducted in 1999 as subcropping the large tabular extremely-anomalous copper-in-soils anomaly shown as Copper Anomaly 2 in Figure 4 and Figure 13, and a large conductivity-thickness anomaly diagnosed as a probable copper-rich massive-sulphide body underlying Copper Anomaly 1, at about 120 metres (400 feet) depth.
The propylitic zone of the diagnosed porphyry copper deposit as shown by the location of the drill holes in Figure 4 was drilled in 1994, but the chargeability data obtained fiom the 1999 deep-probe IP survey indicates that the 5 holes drilled failed to penetrate a highly anomalous chargeability zone which is spatially separate and below the 1993 shallow probe IP chargeability zone.
In addition the collecting of drill chips from every 10-foot percussion drilling sampling interval was not considered by the writer to have been suitable for collecting fme-gold because he believes that sludges and slimes were not collected; and hole recoveries were not believed to have been 100%. Although only every other 10 foot section of drill chips was assayed for gold there were still a few significant gold assays reported; up to 190 rnilligrams/tonne Au over 10 feet.
The 1993 geochemical soils survey between Line 4500 and Line 5100 did not include assaying for gold but it did assay for copper and the gold-pathfinder elements silver, antimony, arsenic, bismuth. Copper, arsenic and vanadium were the only anomalous results obtained and copper and arsenic are shown in Figure 4 and Figure 5. Vanadium appears to consistently accompany the copper assays. The minimum reportable assays for As, Bi, and Sb were 5.0 ppm. For Sb and Bi more sensitive assaying may have been required to detect
32
Mobile Metal Ion (MMI) Geochemical Survey Report Ash ton Copper -Gold
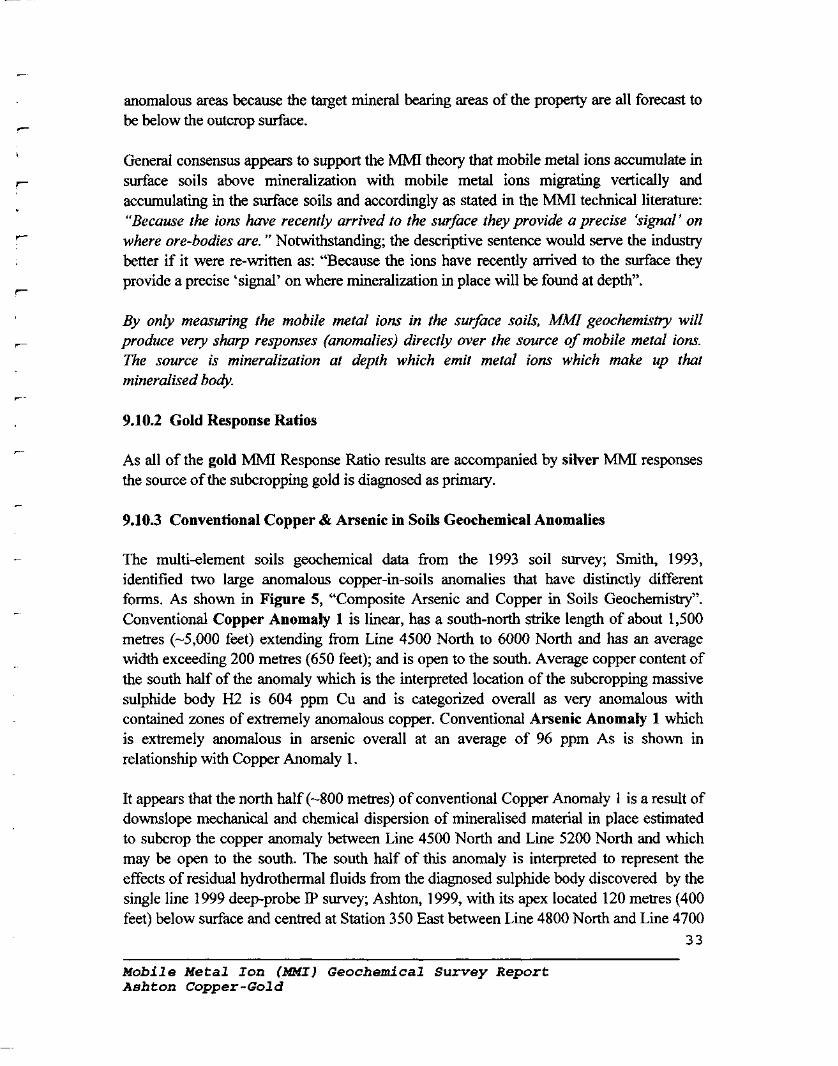
anomalous areas because the target mineral bearing areas of the property are all forecast to be below the outcrop surface.
General consensus appears to support the MMI theory that mobile metal ions accumulate in surface soils above mineralization with mobile metal ions migrating vertically and accumulating in the surface soils and accordingly as stated in the MMI technical literature: "Because the ions have recently arrived to the surface they provide a precise 'signal' on where ore-bodies are. " Notwithstanding; the descriptive sentence would serve the industry better if it were re-written as: "Because the ions have recently arrived to the surface they provide a precise 'signal' on where mineralization in place will be found at depth".
By only measuring the mobile metal ions in the surface soils, MMI geochemistry will produce very sharp responses (anomalies) directly over the source of mobile metal ions. i%e source is mineralization at depth which emit metal ions which make up that mineralised body.
9.10.2 Gold Response Ratios
As all of the gold MMI Response Ratio results are accompanied by silver MMI responses the source of the subcropping gold is diagnosed as primary.
9.10.3 Conventional Copper & Arsenic in Soils Geochemical Anomalies
The multi-element soils geochemical data from the 1993 soil survey; Smith, 1993, identified two large anomalous copper-in-soils anomalies that have distinctly different forms. As shown in Figure 5, "Composite Arsenic and Copper in Soils Geochemistry". Conventional Copper Anomaly 1 is linear, has a south-north strike length of about 1,500 metres (-5,000 feet) extending fiom Line 4500 North to 6000 North and has an average width exceeding 200 metres (650 feet); and is open to the south. Average copper content of the south half of the anomaly which is the interpreted location of the subcropping massive sulphide body H2 is 604 ppm Cu and is categorized overall as very anomalous with contained zones of extremely anomalous copper. Conventional Arsenic Anomaly 1 which is extremely anomalous in arsenic overall at an average of 96 ppm As is shown in relationship with Copper Anomaly 1.
It appears that the north half (-800 metres) of conventional Copper Anomaly 1 is a result of downslope mechanical and chemical dispersion of mineralised material in place estimated to subcrop the copper anomaly between Line 4500 North and Line 5200 North and which may be open to the south. The south half of this anomaly is interpreted to represent the effects of residual hydrothermal fluids fiom the diagnosed sulphide body discovered by the single line 1999 deep-probe IP survey; Ashton, 1999, with its apex located 120 metres (400 feet) below surface and centred at Station 350 East between Line 4800 North and Line 4700
33
Mobile Metal Ion (P4MI) Geochemical Survey Report Ash ton Copper - Go1 d

North.
Conventional Copper Anomaly 2 is tabular in form and extends between Line 4500 North and Line 5 100 North. It is contiguous with Copper Anomaly 1 along a north to south line through Station 250 East, and extends west to a line which runs south to north through Station 5OOWest. Copper Anomaly 2 overall is anomalous in copper with an average copper content of 414 ppm Cu and contains zones of extremely anomalous copper. Conventional Arsenic Anomaly 1 which is extremely anomalous in arsenic overall at an average of 78 ppm As is shown in relationship with Copper Anomaly 2.
The outline of each conventional copper and arsenic anomaly is shown in Figure 5, "Composite Arsenic and Copper Anomalies in Soils" and in Figure 13.
9.10.4 Massive Sulphide Body Target
The diagnosed massive sulphide body has a thickness of 100 metres. It dips about minus 40" East and is believed to conform to a volcanic-sedimentary monoclinic succession. The monoclinic structure was interpreted by Antal in 1969. Its dip length is more than 400 metres. Copper Anomaly 1 that has developed vertically above the apex of this diagnosed massive-suphide body would appearto represent its surface geochemical expression. Accordingly, this sulphide body could be relatively copper rich.
The sulphide body's strike extent is presently unknown. However if the copper anomaly between Lines 4500 North and 5000 North which is open in both north and south directions is reflecting the position of the subcropping sulphide body its size could be significant. Until 2004, there has been no satisfactory gold geochemical data to assess whether this sulphide body is likely to contain gold. However, recently, the arsenic in soils data fiom the 1993 survey; Smith, 1993, was plotted over Copper Anomaly 1 and resulted in the discovery of Arsenic Anomaly 1 which is nearly coincidental with the strongest part of the copper anomaly. The arsenic could be the gold pathfinder signature to gold mineralization associated with the diagnosed massive sulphide body.
As Anomaly 1 has an average As content of 96 ppm which is categorized as extremely anomalous. This anomaly has a strike length of about 400 metres (1,300 feet) and is open to the south.
Sampling of rock fiom an isolated skarn zone, Sample A04-106 (Appendix C) intercalated with the altered volcanics and sediments in the vicinity of drill hole RCA93-5 returned assays that were extremely anomalous in copper (>I 0,000 ppm ) and extremely anomalous in the gold-pathfinder element Te (210 ppb). This data provided the first substantive indication that the subcropping sulphide body in terms of probabilities contains gold along with copper mineralization. Ettlinger et al, 1989 quoted "The presence of bismuth andor
34 -- --
Mobile Metal Ion (=I) Geochemical Survey Report Ash ton Copper -Go1 d

tellurium in a skmn is regarded as indicative of high precious metals potential".
A second rock sample taken from the intensely altered volcanics, Sample A04-107 (Appendix C) was found to be extremely anomalous in Te (90 ppb), As (773ppm), Se (2.10 ppm) and Cu (1,759 ppm). This sample was anomalous in Hg (590 ppb).
Arsenic Anomaly 1 and the discovery of gold-pathfinder elements in its vicinity fiom two independent rock samples was one of the two reasons which motivated the implementation of the MMI geochemical survey. The other component is the much larger Arsenic Anomaly 2 discovered by the plotting of the arsenic in soils data over Copper Anomaly 2 and the extremely anomalous gold pathfinder assays of Sample A041 02 taken fiom within Arsenic Anomaly 2.
9.10.5 Porphyry Copper Deposit 1 Target
The estimated boundaries of the disseminated sulphide zone of diagnosed Porphyry Copper Deposit 1 were interpreted from the anomalous high-chargeability zone shown in the 1999 deep-probe IP pseudosections; Ashton, 1999, are shown in Figure 13 "Composite Interpretations Sketch". IP pseudosection observation depth for this survey was from a nominal 100 metres depth to a nominal 420 metres depth. The 1994 reverse circulation percussion drilling program consisting of 5 drill holes was undertaken over this target area to test the 1993 shallow-probe IP chargeability anomaly target which had a pseudosectional observation depth of only 50 to 100 metres which subcropped Copper Anomaly 1. The geological and alteration results fiom this drilling showed that drilling had only penetrated the propylitic alteration zone which was later substantiated fiom interpretation of the 1999 deep-probe IP survey results.
There were no gold in soils determinations in the 1993 geochemical soil survey so gold content of the soils was unknown. However, gold assays from every other 10-foot sampling interval of the percussion drilling program produced some anomalous gold with the highest assay being 190 mgltome indicating that the porphyry intrusive system which is not believed to have been penetrated by drilling may have a gold association.
Similarly as for gold, many potentially diagnostic gold pathfinder elements were not included in the multi-element soils geochemical data fiom the 1993 soil survey; Smith, 1993; except for arsenic. Plotting the arsenic in soils assays over the porphyry however produced Arsenic Anomaly 2 which extends fiom the south and southwest edge of Copper Anomaly 2 interpreted as the contact aureole of Porphyry Copper 1, shown in Figure 5 and Figure 13. Arsenic Anomaly 2 has an average content of 78 ppm As which is categorized as very-anomalous. Hence in its association with the porphyry intrusive may or may not be a metal zoning feature. It could be the overprinting signature of an epitherrnal mineralizing event associated with Porphyry 1. Alternatively it could be an epithermal precious metals
35
Mobile Metal Ion (=I) Geochemical Survey Report Ash t on Copper - Go1 d

pathfinder signature to a deeper magmatic-hydrothermal mineralizing system entirely.
The arsenic anomaly has width of about 400 metres along Line 4500 North and appears to be open and strengthening to the south.
The assay results from Sample A04-102, is the signature of an epithermal precious metals deposit at depth. As this sample was from within the very anomalous portion of the arsenic in soils anomaly the extent of the arsenic anomaly may be related to the size of a forecast precious metals deposit at depth.
The discovery of Arsenic Anomaly 2 and gold pathfinder assay data from Sample A04-102 was the second reason which motivated the MMI geochemical survey.
9.10.6 MMI Response Ratios & MMI Anomalies
For the purposes of this report four elements, gold, silver, arsenic and copper, from the MMI soils survey are of immediate interest because of their implied economic potential.
To perceive the relationship between gold, arsenic, and copper, the following isopleth maps were plotted to show the extent and magnitude of the Response-Ratios of the respective elements and also assess their relationships with the conventional copper and arsenic anomalous data that corresponds to the diagnosed porphyry target and diagnosed massive sulphide target.
Figure 10; MMI Soil Sampling, Au in Soils Geochemistry
Figure 11; MMI Soil Sampling, As in Soils Geochemistry
Figure 12; MMI Soil Sampling, Cu in Soils Geochemistry
9.10.7 Gold & Arsenic MMI Anomalies; and Conventional As Anomalies
As shown in the histograms, silver response-ratios accompany and correspond with all gold response-ratios. Accordingly the source of the gold is diagnosed as primary.
Generally there is a very strong correspondence of the As MMI anomalies with the Au MMI anomalies as there is very strong correspondence between the As MMI anomalies with the conventional As Anomalies. This can be seen by comparing Figure 10 gold MMI anomalies with Figure 11 arsenic anomalies; and by comparing Figure 10 MMI arsenic anomalies with Figure 4 conventional arsenic anomalies. In summary:
Mobile Metal Ion ( M I ) Geochemical Survey Report Ashton Copper-Gold

As MMI Anomaly 1 corresponds to Au MMI Anomaly 1. As MMI Anomaly 2 corresponds to Au MMI Anomaly 2. As MMI Anomaly 3 corresponds to Au MMI Anomaly 3B fiom Station 100 East to
Station 200 West. As MMI Anomaly 4 corresponds with a northwest single point part of the broad Au
MMI Anomaly 3B. As MMI Anomaly 5 corresponds with the southwest half of Au MMI Anomaly 4.
Hence there is very strong correspondence of As MMI Anomaly 2 with conventional As Anomaly 1. As MMI Anomalies 3, 4, and 5 as a group correspond with conventional Arsenic Anomaly 2 and appears to incorporate conventional Arsenic Anomaly 2A in that same group as the northeast part of As MMI Anomaly 3 is open and strikes into Arsenic Anomaly 2A which appears to be within the porphyry itself.
What appears to be most significant is that both arsenic and corresponding gold MMI anomalies are open to the south and to the north along a 1.0 krn (3,300 feet) fiont on Line 4400. Of this length anomalous gold occupies 640 metres (2,100 feet) of this fiont and anomalous arsenic occupies 550 metres (1,800 feet) of this fiont.
The general conclusion on arsenic as it relates to gold is that there is a one to one correspondence; hence there is the highest probability that a high-order arsenic anomaly also indicates gold at depth and that this magmatic-hydrothermal system produced and deposited gold, and the gold MMI anomalies are indicative of gold deposit sites at depth vertically below the respective anomalies according to the technical experts who developed the MMI assaying detection technique.
Referring to Figure 13, "Composite Interpretation Sketch, Au & As Geochemistry & Spatial Relationships to the Diagnosed: Porphyry and Massive Sulphide Body H2" all of the very strong conventional arsenic anomalies are shown as one integral As Anomaly 2, and are found beyond the interpreted porphyry contact with the country rock along the south and southwest contact aureole. The one exception is conventional As Anomaly 2B which appears embedded within the porphyry space. Similarly the very strong conventional As Anomaly 1 is found beyond the interpreted porphyry contact with the country rock along the east contact aureole.
The results of the MMI survey show that with almost certainty that the conventional arsenic anomalies extend more than 100 metres to the south fiom their present position; and similarly the coincident gold MMI anomalies with arsenic MMI anomalies with almost certainty extend north at least as far as the extent of the high-order conventional arsenic anomalies. Hence the prospective target area for gold mineralization along the contact aureole of Porphyry Deposit 1, shown in Figure 13, may cover an area larger than 800 metres by 250 metres.
37
Mobile Metal Ion (MMI) Geochemical Survey Report Ashton Copper-Gold

An inspection of all of the high-order conventional arsenic anomalies, Arsenic Anomaly 1, Arsenic Anomaly 2 and Arsenic Anomaly 2A in Figure 4 generally shows a bulls-eye pattern of extremely anomalous arsenic within their respective central zones. It is probable that these central zones represent hydrothermal fluid upflow and or outflow zones fiom the magmatic-hydrothermal system that pervaded this area.
As all the strong gold and arsenic anomalies adjacent to the porphyry appear to have formed along the shoulder zone of the diagnosed porphyry they could be representative of a porphyry related low sulphidation epithermal gold system.
9.10.8 Copper MMI Anomalies
The anomalous boundary of Copper Anomaly 2, which is located over the subcropping diagnosed Porphyry Copper Deposit 1 is shown in Figure 5. This anomalous plot is fiom data obtained fiom the 1993 multi-element soils survey. Within this boundary anomalous copper ranges fiom the anomalous category, 201 to 400 ppm Cu, to the extremely anomalous category, >801 ppm Cu. Copper Anomaly 2 drops off to anomalous threshold values (41 to 200 ppm Cu) on Line 4500 which at that time was the most southern line surveyed, whereas the linear Copper Anomaly 1 continues to be very anomalous, 401 to 800 ppm Cu, at Stations 350 East continuing through to Station 400 East. This anomaly is open to the south.
The MMI Cu assay data for Line 4500 generally shows background and anomalous threshold values for copper with some small anomalous copper sections terminating on that line. The copper anomalies that terminate are identified as Cu MMI Anomalies 1,2, 3, and 4. Only Cu MMI Anomaly 5 extends south to Line 4400. Background anomalous threshold isopleths are not plotted. The general conclusion is that the MMI copper in soils values die off similar to the conventional copper in soils values hence appear to correspond.
Generally copper MMI anomalies above the diagnosed massive sulphide body on Line 4500 Correspond with both Au MMI and As MMI anomalies but the copper MMI anomalies do not continue to Line 4400 whereas the gold and arsenic anomalies do; as shown on Figures 10, l l and 12.
Copper MMI Anomalies 3,4, and 5 on Line 4500 each correspond to gold MMI anomalies but there is no correspondence of Cu MMI Anomalies 3 or 5 with arsenic.
The one Cu MMI Anomaly 5 which extends to Line 4400 corresponds to both gold and arsenic MMI anomalies.
- - -- -
Mobile Metal Ion (MMI) Geochemical Survey Report Ashton Copper-Go1 d

9.10.9 Other Elements within the MMI Assay Data Set
The other elements assayed but not reviewed in this report will be of use for an in-house study as to their possiblelprobable significance.
9.10.10 Potential Host Permeabilities for Mineral Deposition
Cathles, 1978, showed examples of hydrothermal-fluid convection within the higher permeability fracture zone at an intrusive's edge. The fracture zone extends upward from the side of the intrusive into the shoulder zone. The width of this higher permeability fracture zone appears to be a function of the size of the intrusive heat source.
According to Corbett and Leach, 1996, magmatic-hydrothermal fluids and later magmatic- meteoric hydrothermal fluids commonly exploit fracture permeability above the margins of intrusives.
However there is another set of structural features at this target exploration site that may contribute to the fracture permeability around the south and southwest contact aureole of Porphyry 1, and that is the north-south shearing and subsidiary structural breaks to the major north-south fault that passes through the east side of this large altered area. Although north- south shearing can be observed in limited outcrop exposures, the 1990 VLF-EM Survey, Ashton, 1990, shows at least two VLF-EM Fraser Filtered anomalies striking south through the diagnosed porphyry and one anomaly passing to the east of Porphyry 1's contact. The widest VLF-EM conductor is estimated at 225 metres (-700 feet), The second widest is 100 metres (-300 feet) and the third widest is about 50 metres (-160 feet). These anomalies for the most part will be as a result of ionic conduction and be representative of wet shear zones or fault structures yet until diagnosed by other geophysical and geological means may also indicate true electronic conductors representative of hosting metallic mineralization.
As this location is believed to be a geodynamically active area, the intersection of shears with porphyry emplacement fracture permeability in the shoulder zone of Porphyry 1 is considered an ideal conduit system for both focusing mineral fluid flow and as a mineral deposit site.
9.10.11 Porphyry Related Low Subhidation Gold Systems
Thus far, the geological and geochemical data from this sector of Porphyry 1 indicates coincident high-temperature hydrothermal alteration consistent with the porphyry environment and a combined group of gold pathfinder lithogeochemical signatures with coincident strong anomalous gold MMI geochemistry over a large area are both consistent with an epithermal gold mineralising environment; probably of the low-sulphidation
39
Mobile Metal Ion (MMI) Geochemical Survey Report Ashton Copper-Go1 d

epithermal gold type. The extremely anomalous pathfinder element tellurium is significant as it points to a gold rich magmatic-hydrothermal system of the alkalic class which are noted for producing worldclass gold deposits.
Corbett and Leach summarized it aptly in their description of "Porphyry-Related Low- Sulphidation Systems"; abbreviated by the writer:
"During the upsurge of gold exploration in the 1980's it became difficult to place many southwest Pacific gold deposits types in the existing classification with the result that the group of gold deposits formerly described as epithermal were subdivided as porphyry- related low-sulphidation gold deposits according to crustal level of formation and relationship to the porphyry resource. The deposit types varied fiom the deepest porphyry levels to intermediate or mesothennal depths. Telescoping is common, and overprinting of alteration zonations may locally obscure the boundaries."
Their opening remarks included the following:
"In magmatic arcs at continental margins, high level porphyry intrusives are emplaced into impermeable host rocks such as older plutons, sediments, and metamorphic basement rocks. In these environments circulating hydrothermal fluids migrate along zones of permeability in competent host rocks provided by major structures and fracture permeabilities which include geological contacts, fractured domes or dyke margins. This focusing of hydrothermal fluids provides an ideal geological and hydrogeological environment for the formation of porphyry-related low sulphidation epithermal gold systems. "
The theme as presented by Corbett and Leach is now apparent on the Ashton Copper-Gold prospect.
9.10.12 Summary
The MMI survey appears to have discovered a significant gold bearing system proximal to the southern and southwestern contact zone of diagnosed Porphyry Copper Deposit 1. It also appears to have discovered a gold association with the diagnosed Massive Sulphide Body H2 which lies beyond the east contact zone of the porphyry.
The gold bearing zone along the southern and southwestern contact aureole of the porphyry consists of several integral gold MMI anomalies that appear to have a north south strike direction that is consistent with the direction of shearing and faulting on the property; consequently the inferred gold bearing zones appear to be structurally controlled. In addition, the shears and faults are interpreted as intersecting fracture permeabilities within the shoulder zone of the diagnosed porphyry.
40
Mobile Metal Ion (MMI) Geochemical Survey Report Ashton Copper-Gold
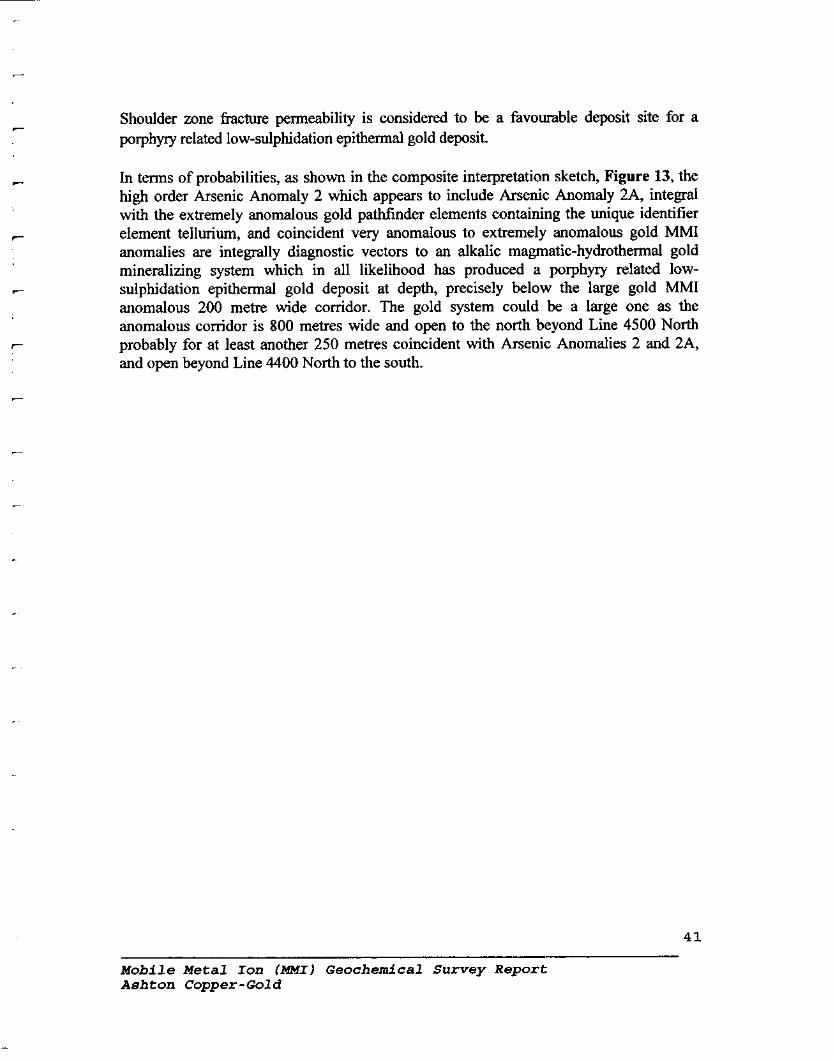
Shoulder zone hcture permeability is considered to be a favourable deposit site for a porphyry related low-sulphidation epithermal gold deposit.
In terms of probabilities, as shown in the composite interpretation sketch, Figure 13, the high order Arsenic Anomaly 2 which appears to include Arsenic Anomaly 2A, integral with the extremely anomalous gold pathfinder elements containing the unique identifier element tellurium, and coincident very anomalous to extremely anomalous gold MMI anomalies are integrally diagnostic vectors to an alkalic magmatic-hydrothermal gold mineralizing system which in all likelihood has produced a porphyry related low- sulphidation epithermal gold deposit at depth, precisely below the large gold MMI anomalous 200 metre wide comdor. The gold system could be a large one as the anomalous comdor is 800 metres wide and open to the north beyond Line 4500 North probably for at least another 250 metres coincident with Arsenic Anomalies 2 and 2A, and open beyond Line 4400 North to the south.
M o b i 1 e M e t a l Ion (MMI) G e o c h e m i c a l Survey R e p o r t A s h t o n C o p p e r - G o l d

SECTION 10.0 - EXPLORATION POTENTIAL
Monger, 1997, speculates that the Mount Lytton Complex and the Guichon Batholith were formed fiom the same subducted section of Oceanic Crust with the Guichon Batholith, a differentiate from the upper part of the upper plate of subducted crust and the Mount Lytton Complex representing the lower part of the upper plate. This leads to the interesting speculation that this intrusive event could have concentrated copper minerals from a copper- enriched crustal element in a similar fashion, as it stoped its way up towards the surface.
Reid, 1990, through petrographical study, described the area of alteration "as having experienced the passage of large quantities of hydrothermal fluids, containing significant volatiles, through the host rocks". Although this petrographical sample contained 750 ppm Cu it is known that low-density magmatic vapours carrying the volatiles which occur during devolatization can transport metals in low concentrations. Devolatilization occurs when a mineral bearing magma crystallizes producing a mineral bearing fluid phase and a volatile phase. This petrographical analysis provided the first indication of a style of alteration that is found at surface as a result of porphyry copper crystallization at depth resulting in the expulsion of mineralized magmatic- hydrothermal solutions and associated volatiles.
Exploration results prior to this report diagnosed two probable porphyry copper deposits on the property in close proximity with the likelihood that geophysically diagnosed Porphyry Copper Deposit 2 could in all probability be analogous to the gold-rich calc-alkaline variety of the Island Copper type. However diagnosed Porphyry Copper Deposit 1's gold potential could only be speculated upon because of a few 10-foot drill intercepts of 0.190 gramslt gold and 0.165 gramslt gold, in the propylitic zone, and some extremely anomalous gold pathfinder elements, As, Sb, and Bi throughout the alteration But most revealing were the very anomalous and extremely anomalous arsenic-in-soils anomalies that had not been previously plotted and studied as to the reason they were there.
The strong arsenic anomalies led directly to the discovery of the extremely anomalous gold pathfinder elements which included extremely anomalous tellurium in two strategic locations proximal to diagnosed Porphyry Copper Deposit 1. Diagnostically the tellurium and genetically related gold pathfinders in the contact aureole of Porphyry 1 are indicative of an epithermal gold mineralising system at depth associated with an alkalic magmatic hydrothermal system.
The very anomalous gold results of this Mobile Metal Ion (MMI) geochemical survey confirm that there is significant gold in the system at depth over a large area in the shoulder zone of diagnosed Porphyry Copper Deposit 1 and in terms of probabilities this deposit site is diagnosed as favourable for the discovery of an alkalic porphyry-related low-sulphidation epithermal gold deposit.
42
Mobile Metal Ion (MMI) Geochemical Survey Report Ashton Copper-Gold

In addition, a gold rich magmatic-hydrothermal system is evident in association with diagnosed Massive Sulphide Body H4 by the extremely anomalous gold pathfinder elements above this body which appears to be corroborated by the anomalous and very anomalous gold MMI results found above its strike and dip directions by this survey.
There is no doubt that this area is highly prospective for gold-rich alkalic porphyry copper deposits because it is located in the regional geological Quesnellia Terrane which hosts such notable alkalic deposits as the Afton-Ajax Cu-Au deposits; the Similco, Copper Mountain Cu-Au deposit; the Mount Polley Cu-Au deposit; the Mount Milligan Cu-Au prospect; and several other significant calc-alkaline copper-molybdenum gold-barren deposits also within Quesnellia; e.g., Highland Valley and Brenda. To this date the nature of the "ore bringer" porphyry at Ashton Cu-Au is not known because the target porphyry remains to be drilled.
However an alkalic porphyry-related low-sulphidation epithexmal gold deposit is more commonly found in the southwest Pacific and includes such notable examples; Corbett and Leach, 1996; as Porgera, Ladolam, Kidston , Cadia, Batu Hijau, etc. in their many unique varieties of occurrence which includes: porphyry copper-gold systems, quartz-sulphide gold * copper vein systems, carbonate-base metal gold systems, and epithermal quartz gold- silver systems.
However the porphyry component of the Ashton Cu-Au system has many alteration similarities with the regionally close Afton deposit.
The Afton Mine
The AAon Mine (the open pit phase previously mined out) is a gold rich alkalic porphyry deposits hosted by diorites. What is significant is that Afton has recently received an aggressive exploration program that resulted in the discovery of a significant new mineral resource expected to grow to three times the size of the original mined out resource. The new zone goes to depth and the deeper sections are much higher grade.
The mined out Afton deposit contained 30.84 million tomes of ore at an average grade of 1 .O% copper and 0.58 grams/tome gold. Today's in the ground value would be more than USs2.0 billion; whereas the new deposit contains a measured, indicated, and inferred resource of 76 million tomes grading 1.06% copper and 0.84 grams/tome gold. Today's in the ground value of the new deposit is more than USs6.0 billion.
- - - - pp pppp - - -- - -- p--ppp-
M o b i l e M e t a l Ion (MMI) G e o c h e m i c a l S u r v e y R e p o r t A s h t o n C o p p e r - G o l d
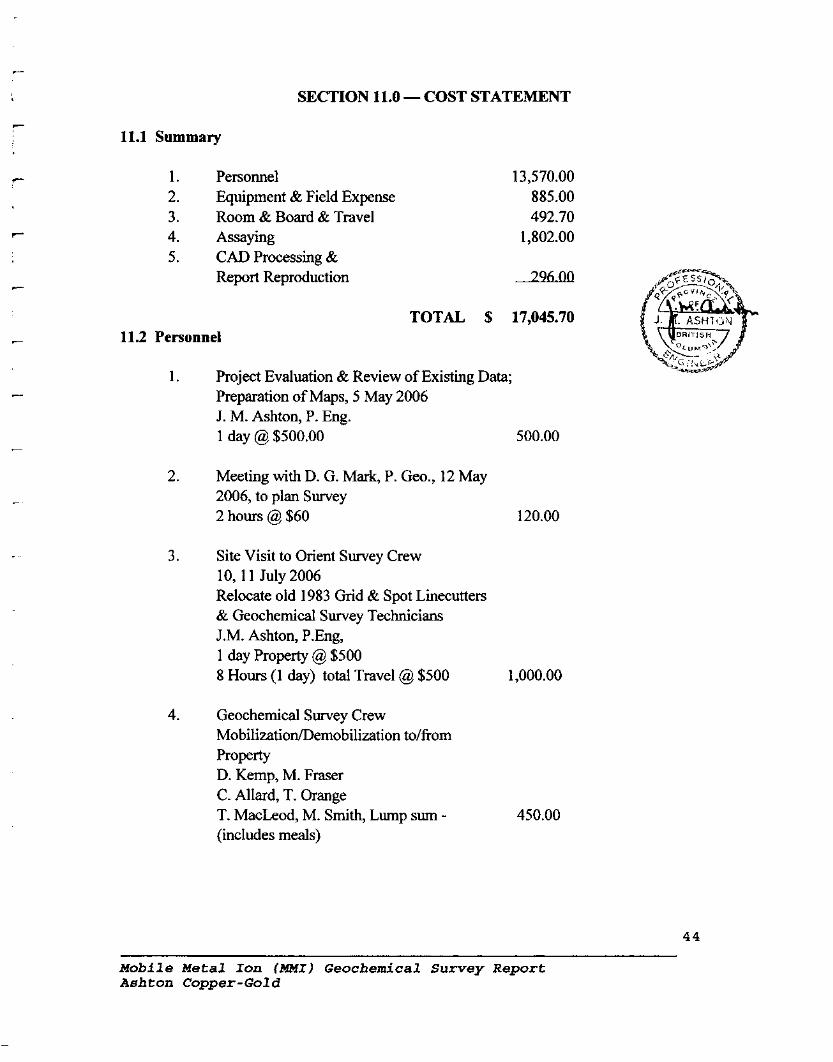
SECTION 11.0 - COST STATEMENT
11.1 Summary
1. Personnel 2. Equipment & Field Expense 3. Room & Board & Travel 4. Assaying 5. CAD Processing &
Report Reproduction
TOTAL $ 17,045.70 1 1.2 Personnel
1. Project Evaluation & Review of Existing Data; Preparation of Maps, 5 May 2006 J. M. Ashton, P. Eng. 1 day @ $500.00 500.00
2. Meeting with D. G. Mark, P. Geo., 12 May 2006, to plan Survey 2 hours @ $60
3. Site Visit to Orient Survey Crew 10 , l l July 2006 Relocate old 1983 Grid & Spot Linecutters & Geochemical Survey Technicians J.M. Ashton, P.Eng, 1 day Property @ $500 8 Hours (1 day) total Travel @ $500
4. Geochemical Survey Crew Mobilization/Demobilization tolfkom property D. Kemp, M. Fraser C. Allard, T. Orange T. MacLeod, M. Smith, Lump sum - (includes meals)
Mobile Metal Ion ( M M I ) Geochemical Survey Report Ash ton Copper -Go1 d

5. MMI Geochemical Survey ll", 12" & 13" of ~ u l ~ , 2006 D. Kemp, M. Fraser C. Allard, T. Orange T. MacLeod, M. Smith, Lump sum 3 days @ $1,8OO/day- (includes room & board)
6. Data Preparation D.G. Mark, P. Geo. -
7. Report Preparation May, July1 September 2006 J.M. Ashton, P. Eng. 7 days @ $500 per day -
8. CAD Drawing Preparation E.B. Catapia, C. Tech 20 hours @ $60.00
9. Word Processing, Collation Drawing Reproduction S. Apchkrum: 20 hours @ $45.00 - 900.00
10. Report Review D. Mark, P. Geo
Mobile Metal Ion (MMI) Geochemical Survey Report Ashton Copper-Go1 d

113 Equipment & Field Supplies Expense, l l m , 1 2 ~ , 1 3 ~ , July; 1. Mobilization/Demobilization
Truck rental & gas, lump sum - 2. Field Work
Truck Rental & gas, lump sum - 3. Gasoline & Survey Supplies -
Sub-Total 11.4 Room & Board & Travel,
1 om & 1 1" July, 2006; Site Visit J. M. Ashton, P. Eng, 1. Mileage; 580 km @$0.60 - 2. Meals - 3. Accommodation -
Sub-Total
11.5 MMI Assay Cost
Assay cost, 52 samples @ $34.00 per sample - Freight cost -
Sub-Total
11.6 CAD Processing & Report Reproduction 1. CAD Processing, Drafts
& Report & Drawing Reproduction
--
Mobile Metal Ion (=I) Geochemical Survey Report Ashton Copper-Gold

SECTION 12.0 - CERTIFICATION OF J.M. ASHTON, P. Eng
I, J. M. Ashton, of Suite 1750, 1177 West Hastings Street, Vancouver, British Columbia, hereby certify that:
I am a Consulting Electrical Engineer and principal in J. M. Ashton & Associates Ltd., Consulting Electrical Engineers. I also provide professional services in mineral exploration as a Mineral Explorationist.
I am a graduate of the University of British Columbia with a B. A. Sc. in Electrical Engineering (1 966).
I am a member in good standing, as a Professional Engineer, in the Association of Professional Engineers and Geoscientists of the Province of British Columbia.
I am a member of the Canadian Institute of Mining and Metallurgy.
I have practised as: a Mineral Explorationist, performing significant work related to all aspects of mineral exploration with a focus on geophysics; and as consulting electrical engineer; since 1969.
This report was prepared by me.
J. P. Eng.
Dated this 22nd day of September, 2006 Vancouver, British Columbia
Mobile Metal Ion ( M M I ) Geochemical Survey Report Ashton Copper-Gold

SECTION 13.0 - CERTIFICATION OF D. G . MARK, P. Geo.
I, David G. Mark, of the City of Surrey, in the Province of British Columbia, do hereby certify:
I am a consulting Geophysicist and principal of Geotronics Consulting Inc., with offices located at 6204 - 125th Street, Surrey, British Columbia.
I am a graduate of the University of British Columbia with a Bachelor of Science in Geophysics (1 968).
I am a member in good standing, as a Professional Geoscientist, in the Association of Professional Engineers and Geoscientists of British Columbia.
I have been practising my profession for the past 38 years and have been active in the mining industry for the past 41 years.
The field work for the gridline preparation and Mobile Metal Ion (MMI) geochemical survey described in this report was carried out by qualified Geotronics Consulting Inc. personnel under my supervision as Project Manager.
I provided data preparation services and technical consulting services to J. M. Ashton, P. Eng., pursuant to the preparation of this report.
I concur with the MMI geochemistry conclusions and conventional geochemistry conclusions in this report.
n.
Vancouver, British Columbia
Mobile Metal Ion (MMI) Geochemical Soil Survey Report Ash ton Copper- Gold

SECTION 14.0 REFERENCES
Antal, J. W., November 25, 1969: Geology of T Claims; Assessment Report No. 2532.
Ashton, J. M., 16 September, 2004: Deep-Probe Induced Polarization Survey 2 Report on the Ashton Group Mineral Claims; Assessment Report.
Ashton, J. M., September 24, 2001: Total-Field Magnetometer Survey Report on the Ashton Group Mineral Claims; Assessment Report.
Ashton, J. M., August 31, 1999: Deep-Probe Induced Polarization Survey Report on the Ashton Group Mineral Claims; Assessment Report.
Ashton, J. M., 26 August, 1994: Drilling Report on the Ashton Group Mineral Claims; Assessment Report.
Ashton, J. M., 30 August, 1990: VLF-EM & Magnetic Survey of the Burgoyne Group of Mineral Claims; Assessment Report.
Berger, B. R., Silberman, M. L., 1985, Relationships of Trace-Element Patterns to Geology in Hot-Spring-Type Precious Metals Deposits, in Reviews in Economic Geology, Volume 2, Geology & Geochemistry of Epithermal Systems editors Berger, B. M., & Bethke, P. M.
Boyle, R. W., 1979, The Geochemistry of Gold and its Deposits, Geological Survey of Canada, Bulletin 280, Energy, Mines and Resources Canada
Carr, J. M., Reed, A. J., 1976: Afton: A Supergene Copper Deposit, in Porphyry Deposits of the Canadian Cordillera, The Canadian Institute of Mining and Metallurgy, Special Volume 1 5,1976, p.376-387.
Cathles, L. M., 1978, Hydrodynamic Constraints on the Formation of Kuroko Deposits, in Mining Geology, Volume 28, pp257-265.
Corbett, G. J., Leach, T. M., 1996, Southwest Pacific Rim Gold-Copper Systems: Structure, Alteration, and Mineralization, Manual for an Exploration Workshop presented at Jakarta, August, 1996
Brown, D. A. (1981): Geology of the Lytton area, British Columbia; unpublished B.Sc. thesis, The University of British Columbia, Vancouver, British Columbia, 69 pages
Mobile Metal Ion (MMI) Geochemical Survey Report Asht on Copper - Go1 d

Burgoyne, A. A., October 3 1,1969: Copper Geochemical Soil Survey, Mineral Claims T1- T28. Assessment Report No. 253 3.
Ettlinger, A. D., Ray, G. E., 1989, Precious Metal Enriched Skarns in British Columbia, An Overview and Geological Study, Paper 1989-3, Mineral Resources Division, Geological Survey Branch, Province of British Columbia.
Gale, R. E., April 21, 1992: Summary Report and Recommendations, Ashton Copper Prospect, for Kingston Resources Ltd.
Gale, R. E., February 4, 1994: Logs of Drillhole-Cuttings, 1993 Reverse Circulation Drilling, Ashton Copper Prospect; unpublished report for 808 Exploration Services Ltd., 5 pages
Grondin, W., Personal Communication, 6 September, 2006.
Hedenquist, J. W., et al, 2000, Exploration for Epithermal Gold Deposits, in Hagemann, S. G., et al, editors, Gold in 2000, Reviews in Economic Geology, Volume 13, Society of Economic Geologists Inc.
Henley, R., 1996, Copper-Gold: Back to Basics, in Porphyry Related Copper & Gold Deposits of the Asia Pacific Region, Australia Mineral Foundation, Conference Proceedings, Cairns, 12- 1 3 August, 1 996.
Hildenbrand, T. G., 2001, Utility of Magnetic and Gravity Data in Evaluating Regional Controls on Mineralization: Examples fiom the Western United States in Richards, J. P. & Tosdal, R. M., editors, Structural Control on Ore Genesis, Reviews in Economic Geology, Volume 14, Society of Economic Geologists, Inc.
Jensen, E. P., & Barton, M. D., 2000, Gold Deposits Related to Alkaline Magmatism, in Hageman, S. G., et al, editors, Gold in 2000, Reviews in Economic Geology, Volume 13, Society of Economic Geologists Inc.
Mark, D. G., June, July, September, 2006 June, July, 1999; Personal Communications.
Monger, J. W. H., 2001 : Field Trip & Field Trip Notes of the Mount Lytton Complex and Contiguous Stratigraphy; Personal Involvement.
Monger, J. W. H., 1989: Geological Survey of Canada, Geology Map 42-1989 and accompanying notes.
Monger, J. W. H., June 1 993 : Personal Communication. 50
M o b i l e M e t a l Ion (MMI) G e o c h e m i c a l S u r v e y R e p o r t A s h t on C o p p e r - G o 1 d

Mutschler, F. E., Mooney, T. C., 1 993, Precious-Metal Deposits Related to Alkalic Igneous Rocks: Provisional Classification, Grade-Tonnage Data and Exploration Frontiers in Kirkham, R. V., Sinclair, W.D., Thorpe, R. I., and Duke, J. M., eds., Mineral Deposit Modeling: Geological Association of Canada, Special Paper 40, p. 479-520
Panish, R. R. and Monger, J. W. H., 1992: New U-Pb dates from southwestern British Columbia; in Radiogenic Age and Isotopic Studies: Report 5, GSC, Paper 91-2, p.87-108.
Read, P. B., July, 2004: Personal communication on rock samples obtained from Ashton Copper-Gold Prospect
Read, P. B., 10 January, 1995: Petrography of Drill Chips from Holes RCA93-1 to RCA93- 7, Ashton Property; unpublished report for J. M. Ashton, 10 pages.
Read, P. B., 1990: Petrography of Sample 54N 2+50W, Ashton Copper Property; unpublished report for J. M. Ashton, 3 pages.
Schroeter, T. G., 1995: Editor, Porphyry Deposits of the Northwestern Cordillera of North America Special Volume 46, Canadian Institute of Mining, Metallurgy and Petroleum
Smith, S. W., September 20, 1993: Geological Mapping and Geochemical Sampling on the Ashton Property, Assessment Report.
Induced Polarization, Applications and Case Histories, editors: Fink, J.B., Stemberg, B.K., McAlister, E. O., Wieduwult, W.K., & Special Editor S.H. Ward, Society of Exploration Geophysicists.
Jensen, E. P., & Barton, M. D., 2000, Gold Deposits Related to Alkaline Magmatism, in Hagemann, S. G., et al, editors, Gold in 2000, Reviews in Economic Geology, Volume 13, Society of Economic Geologists Inc.
Meinert, L. D., 1993, Igneous Petrogenesis and Skarn Deposits, in Kirkham, R. V., et al editors, Mineral Deposit Modeling: Geological Association of Canada, Special Paper 40, p. 569-583
Monger, J. W. H., 2001: Field Trip & Field Trip Notes of the Mount Lytton Complex and Contiguous Stratigraphy; Personal Involvement
-
Mobile Metal Ion ( M M I ) Geochemical Survey Report Ashton Copper-Gold

Wamtech Pty. Ltd, 2004, MMI Manual for Mobile Metal Ion Geochemical Soil Surveys, Version 5.04, MMI Technology, Bentley Australia
Williams, S. A., Forrester, J. D., 1995, Characteristics of Porphyry Copper Deposits in Price, F. W., Bolm, J. G., editors, Porphyry Copper Deposits of the American Cordillera, Arizona Geological Society, Digest 20
Mobile Metal Ion ( M M I ) Geochemical Survey Report Ashton Copper-Go1 d

Figures
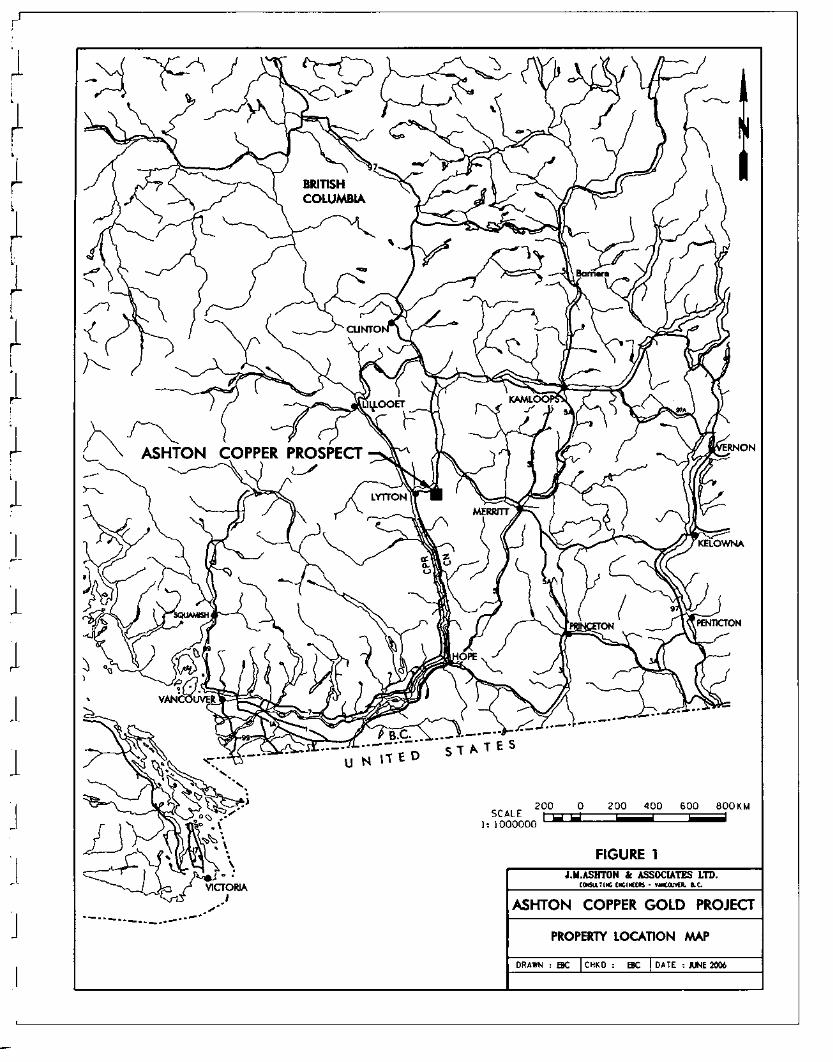
I DRAWN : EBC 1 CHKD : EBC 1 DATE : JUNE 2006

'. . RACHEL 1-4
311562 311563 311564 311565
FIGURE 2 J.M.ASHTON k ASSOCIATES LTD.
COIWlINC E f f i l l E R S - VUlCOWLR B.C.
ASHTON COPPER GOLD PROJECT
CLAIM LOCATION MAP
DRAWN t EBC 1 CHKD I JMA 1 DATE r JUNE 2006

LEGEND - FAULT -- . . .. . . ., INFERRED FAULT
LATE CRETACEOUS IKgd -GRANODIORITE,OUARTZ MONZONITE
ASHTON COPPER '.: PROSPECT
. \ . '. '.
- ALLUVIUM ' ' i. ..
EARLY AND MIDDLE CRETACEOUS JACKASS MOUNTAIN GROUP
SPENCES BRIDGE GROUP
KsB -FELSE, MAflC FLOWS AND SANDSTONE -SHALE KsBs - W C VOLCANICS -CONGLOMERATE
KJ SANDSTONE, ARGILLITE. CONGLOMERATE
TRIASSIC AND/OR JURASSIC U d -DIORITE. AMPHlBOLlTE MT. LMTON COMPLEX
SCALE 1:200000 0
FIGURE 3
I J.M .ASHTON k ASSOCIATES LTD. CMUTIWC ENGIBEERS - VAUCRMR ac.
ASHTON COPPER GOLD PROJECT
REGIONAL GEOLOGY
U g d -GRANODIORITE, QUARTZ MONZONlTf MT. LYTTON BATHOLITH U m -LAYERED OF ROCK, AMPHIBOLITE, MYLONITE MT. LYTTON BATHOLITH
DRAWN : EBC I CHKD : JMA I DATE : JUNE 2006
MOOIFED M E R J.W.H.MONGER GSC MAP 42-1989

ARSENIC ANOMALY 2
*ALTERED ROCK SAMPLE A04402 ANOMALOUS CATEGORY
Cu = 775 ppm WRY ANOMALOUS Ag = 3.9 ppm EXWWELY ANOMALOUS As = 218 ppm EXTREMELY ANOMALOUS Hg = 10,658 ppb MTREMELY ANOMALOUS Sb = 7.13 ppm EXIREMELY ANOMALOUS So = 16.9 ppm EXIEMELY ANOMALOUS Te = 200 ppb EXTREMELY ANOMALOUS
ARSENIC IN SOILS LEGEND
1-1 7.1-20 ANOMALOUS TnREYlOLD
40.140 VERY ANOMALOUS
I 1 >80.1 EXrREMELY ANOMALOUS
LENGTH (FEET)
m L Y ANOMALOUS ISOPLETH
NOTES 1. AMRAGE ABUNDANCE IN SOIW OF
m l s CRUST = 7ppm k 2. AMRAGE ABUNDANCE IN UNALTERED
IGNEOUS ROCKS = 2ppm k 3. STRATABOUND MMSlM SULPHlDE BODY
AT 120m DEPTH. WIDTH = loom, DIPS AT -40° EAST. MAGNOSED BY IP RESULTS & MINUS 336 mV SP ANOMMY.
SCALE 1:7.500 1 ? -
FIGURE 4
J.M.ASHTON k ASSOCIATES LTD. VANCOUVER. B R l T l S H COLUMBIA
ASHTON COPPER GOLD PROJECT
ARSENIC IN SOILS CONVENTIONAL GEOCHEMISTRY
ENGINEER : DRAWN : EBC
SWE : AS SHOWN DATE : JUNE 2006

INTRUSIM PORPHYRY SYSTEM
*ALTERED ROCK SAMPLE A04102 1. = 200 ppb b = 16.9 ppm Hg = 10,658 ppb k = 218 ppm Sb = 7.13 ppm
Aq - 3.9 ppm Cu = 775 ppm
NOTES 1. AVERAGE ABUNDANCE IN SOU OF
EARTH'S CAUST - 7ppm As 2. AVERAGE ABUNMNCE IN UNALTaKD
GNEOUS ROCKS = 2ppm An 3. TOP OF SlR4TABOUND MASSM SULPHIDE
BODY H2 AT 120m DEPTH. DWOSED BY IP RESULTS 6 MINUS 336 mV SP ANOMALY DIPS -400 EAST.
4. SAMPLE ADC102 SlGNATURE CLASSK: EPlTtiERMAL (KXD DEPOSIT AT DEPTH BELOW VERY ANOMALWS ARSENIC IN SOllS ANOMALY.
6. UNEAR COPPER ANOMALY 1 INTERPEED AS SURFACE D(PRESSI0N OF DIAGNOSED MASSlM SVLPHIDE BODY H2.
6.COPPERANOMALY2lNlERPRmDASSURFACE EXPRESSION OF DIAGNOSED PORPHYRY COPPER DEPOSIT 1.
7. ANOMALOUS VANADIUM IN S O U WNCIDENT wmc COPPER.
FIGURE 5
J.M.ASHTON & ASSOCIATES LTD. VANCOWER, BRITISM C Q W I A
ASHTON COPPER GOLD PROJECT COMPOSI'I'E
ARSENIC 6 COPPER IN SOILS GEOCHEMISTRY
c m n w r * J U l l E l A L Isuu. Asworm : EBC I = : AUCUnlOOd

5000 N
1500 N
1400 N
LINE r
LCP I
MELLISA P' MINERAL CWM
REBECCA 2 MINERAL CLAIM
REBECCA 3 MINERAL CLAIM
4S, 5E
W W W W
NOTES 1. MMI SURVEY GRID LINES
4500N & 4400N FROM STATIONS 700E TO 700W
2. MEASUREMENTS BY COMPASS & CHAIN.
FIGURE 5A J X A S H T O N & ASSOCIATES LTD.
VANCOUVER. B R I T I S H COCUUBIA
ASHTON COPPER GOLD PROSPECl
2006 SURVEY GRlD FOR MMI GEOCHEMICAL SURVEY
CE&oClsT : 1 SC&E : A S S H O W N
DRAW EBC 1 DATE I M A R C H 2007 1 CHECKED : J M A 1 REVISE0 :

Line
J.M. ASHTON &ASSOCIATES LTD ASHTON COPPER PROPERTY
Nicoamen River, Lytton Area Kamloops Mining Division, B C
HCiUKt 6 MMI SOIL SAMPLING - LINE 4500 Non
Response Ratio - Histogram for Au, AS, Ag & CU

I J.M. ASHTON & ASSOCl
.Cu HAS WAg HAu
m
I
uced by: GEOTRONICS C _ - - - NC
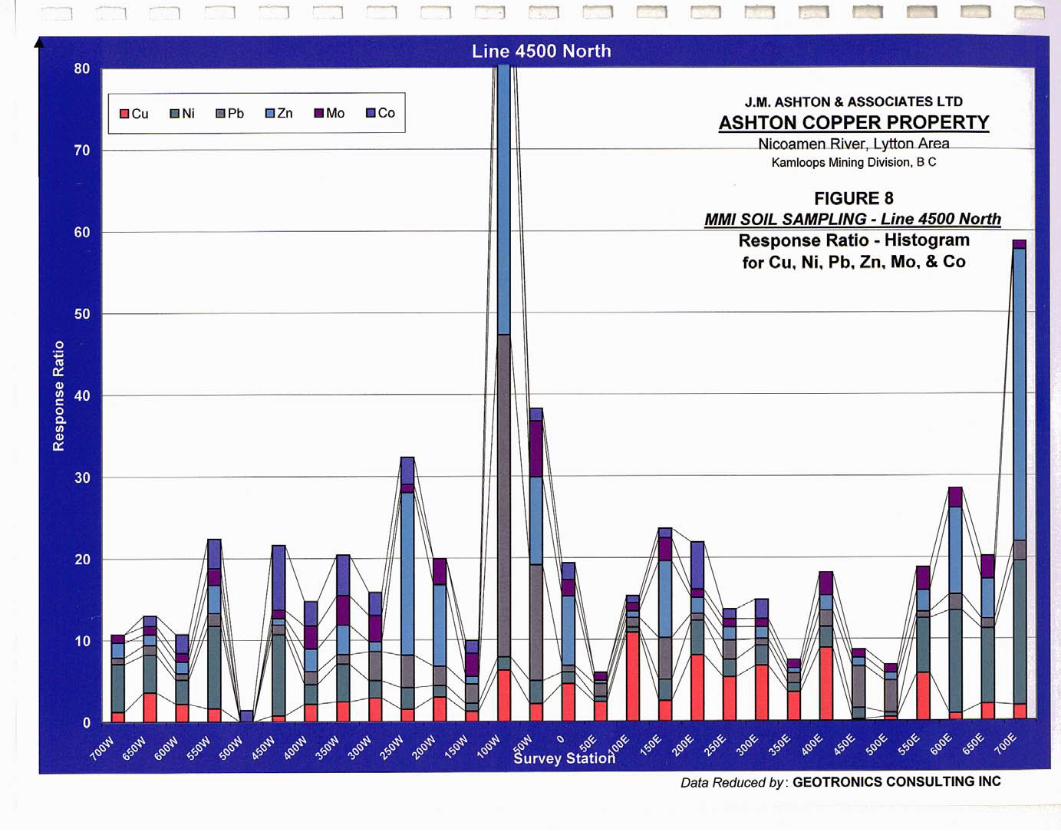

Line 4400 North
J.M. ASHTON &ASSOCIATES LTD
ASHTON COPPER PROPERTY N- Area
Kamloops Mining Division, B C
FIGURE 9
9 $Q+ Q ,$0L Z
Survev Station
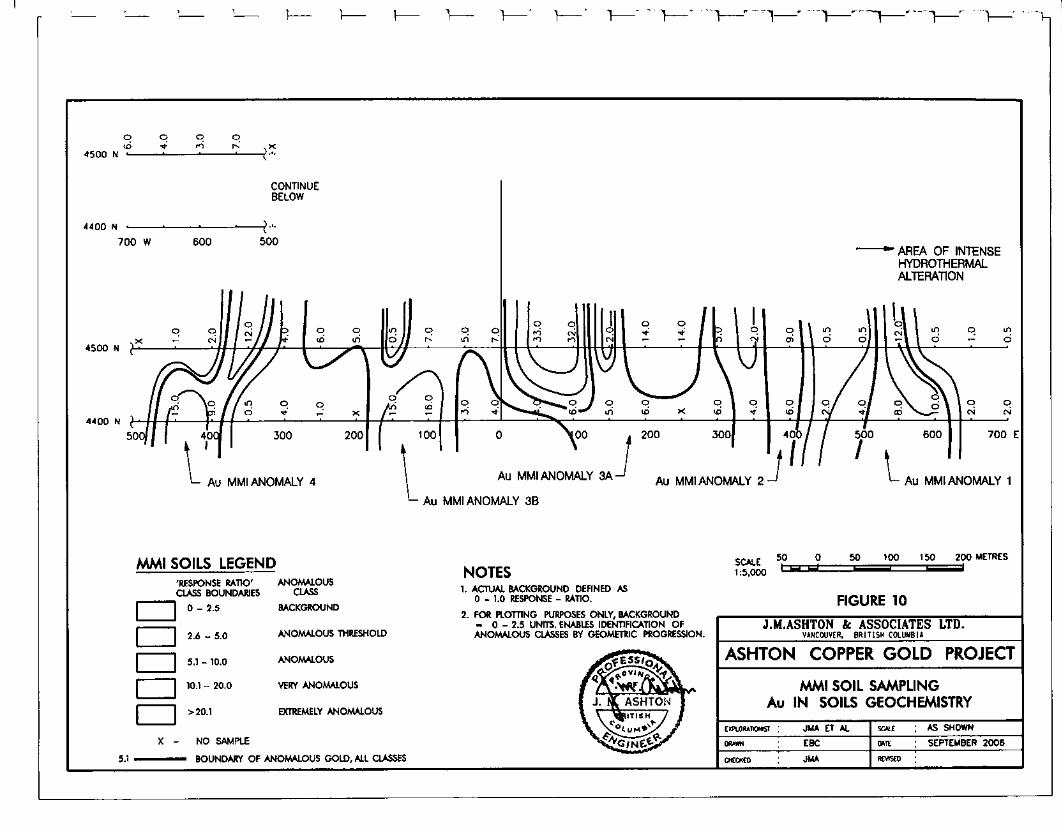
CONTINUE BELOW
- AREA OF INTEN HYDROTHERMAL ALTERATION
Au MMl ANOMALY 4 Au MMI ANOMALY 3A Au MMI ANOMALY 2
I- Au MMIANOMALY 3B
MMI SOILS LEGEND 'RESPONSE RATIO' ANOMALOUS CUSS BOUNDARJES CLASS
1-1 0 - 2.5 BACKGROUND
2.6 - 5.0 ANOMALOUS THRESHOLD
5.1 - 10.0 ANOMALOUS
10.1 - 20.0 VERY ANOMALOUS
> 20.1 EXTREMELY ANOMALOUS
X - NO SAMPLE
5.1 - BOUNDARY OF ANOMALOUS GOLD, ALL CUSSES
NOTES 1. ACTUAL BACKGROUND DEFINED AS
0 - 1.0 RESPONSE - RATIO.
2. FOR PLOTTING PURPOSES ONLY, BACKGROUND 0 - 2.5 UNITS. ENABLES IDENTIFICATION OF
ANOMALOUS CUSSES BY GEOMETRIC PROGRESSION.
SCALE 50 0 50 1 0 0 150 200 ME
1:5.ooo I rn rn
FIGURE 10
I J.M.ASHTON k ASSOCIATES LTD. VANCOUVER. BRIT ISH COLUMBIA
ASHTON COPPER GOLD PROJl
MMI SOIL SAMPLING Au IN SOILS GEOCHEMISTRY
~mo~~nomn : JMA fl AL SCKE : AS SHOWN
MU~M : EBC MTE : SEPTEMBER i
SE
2 d
R 4
700 E
LY 1
:TRE S
ECT
!006


CONTINUE BELOW
- AREA OF INTENSE HYDROTHERMAL ALTERATION
4 " : $ 9 K 2 K - X C
2 , ; 9 .- 9 C K O x C X C
C
500 400 300 'O0 'I 'OC 0 A
Cu MMI ANOMALY 4
Cu MMI ANOMALY 5 Cu MMI ANOMALY 3 Cu MMI ANOMALY 2 - Cu AbJOMALY 1
MMI SOILS LEGEND NOTES 'RESPONSE RATIO' ANOMALOUS CLASS BOUNDARIES CLASS 1. ACTUAL BACKGROUND DEFINED AS
0 - 1.0 RESPONSE - RATIO. 0 - 2.5 BACKGROUND 2. FOR PLOTTING PURPOSES ONLY, BACKGROUND
0 - 2.5 UNITS. ENABLES IDENflFlCATlON OF 1-1 2.6 - 5.0 ANOMALOUS THRESHOLD ANOMALOUS CLASSES BY GEOMmUC PROGRESSION.
5.1 - 10.0 ANOMALOUS
10.1 - 20.0 VERY ANOMALOUS
1-1 >20.1 ENREMELY ANOMALOUS
X - NO SAMPLE
5.1 - BOUNDARY OF ANOMALOUS COPPER, ALL CLASSES
SCME 50 0 50 100 150 200 METRES 1 :s,ooo
FIGURE 12
J.M.ASHTON 81 ASSOCIATES LTD. VANCOUVER. BR 1 T ISH COCUMB l A
ASHTON COPPER GOLD PROJECT
MMI SOIL SAMPLING Cu IN SOILS GEOCHEMISTRY
DRAWN : EBC I MK ; SEPTEMBER 2006
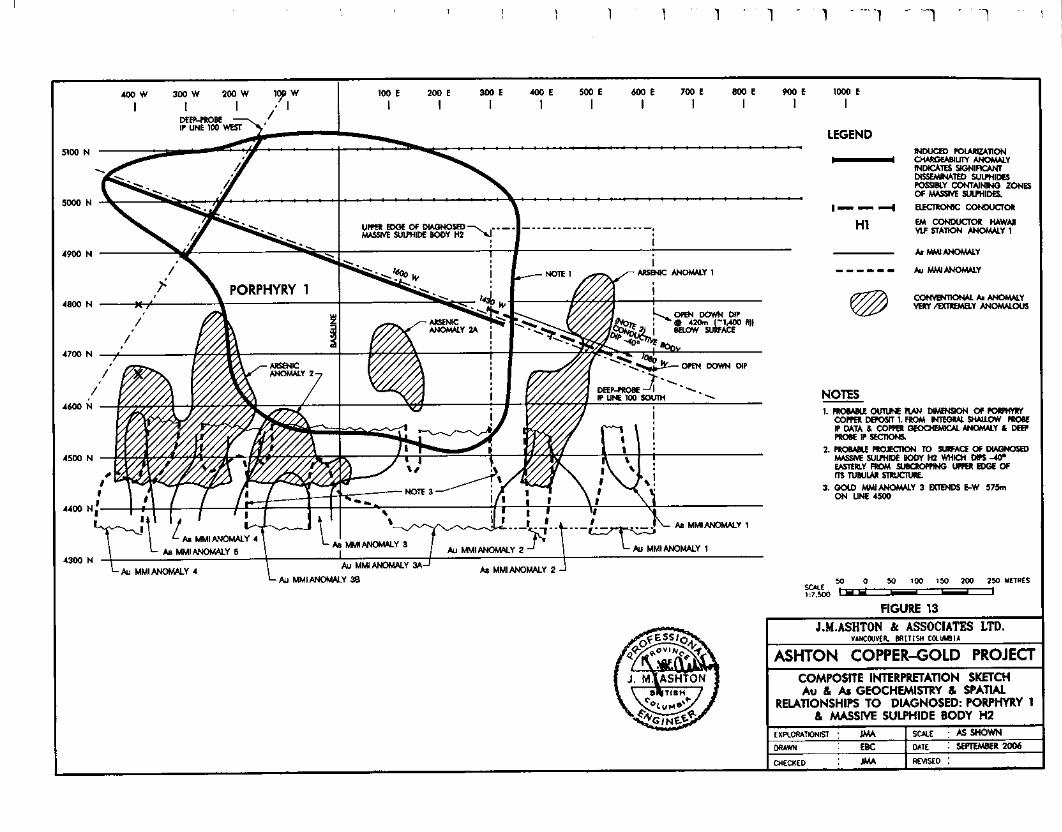
L AU MMl ANOMALY 38
LEGEND INDUCED #)UWUllON
DISSEMINATED SULPHIDES POSSIBLY CONTAINING ZONES OF MASSNE SULPHIDES
ELE-K: CONDUCTOR
EM CONDUCTOR HAWM W STATION ANOMALY 1
CONVENTIONAL k ANOMMY VERY /MTREMELY ANOMALOUS
NOTES 1. PROBABLE OUILINE PUN DlMENSlON OF FORPHW
COPPER DEFOSTT 1. FROM MM)RAL W O W PROBE IP DATA & COPPER GEOCHEMCAL ANOMALY & DEEP PROBE IP SECIK))JS.
2. PROBABLE PROJECllON TO SURFACE OF MAONOSED MMSM SULPHDE BODY H2 WHICH DIPS 400 USTERLY FROM SUBCROPPING UPPER EDGE OF rn NBUUR STRU~JRE.
3. GOLD MMl ANOMMY 3 EXENDS L W 57% ON UNE 4500
50 0 50 100 150 200 250 METRES S W E 1:7,500 -
FIGURE 13
J.M.ASHTON k ASSOCIATES LTD. VANCOUVER. BRITISH COLUMBIA
ASHTON COPPER-GOLD PROJECT COMPOSITE INTERPWATION SKETCH Au & As GEOCHEMISTRY & SPATIAL
RELATIONSHIPS TO DIAGNOSED: PORPHYRY 1 & MASSIVE SULPHIDE BODY H2
- . - . . . . . CHECKED : J M A J REVISED :

Appendix A
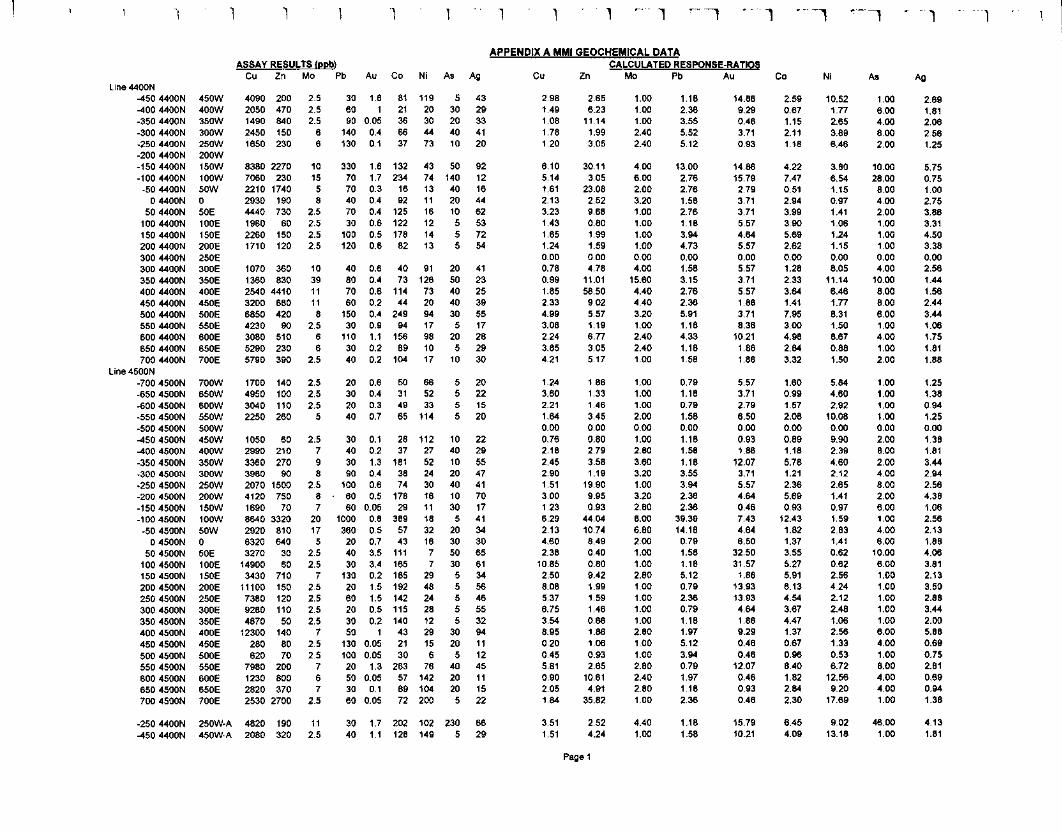
Line 4400N 450 4400N 400 4400N -350 4400N -300 4400N -250 4400N -200 4400N -150 4400N -1 00 4400N -50 4400N
0 4400N 50 4400N
100 4400N 150 4400N 200 4400N 300 4400N 300 4400N 350 4400N 400 4400N 450 4400N 500 4400N 550 4400N 600 4400N 650 4400N 700 4400N
Line 4500N -700 4500N -650 4500N -600 4500N -550 4500N -500 4500N 450 4500N 400 4500N -350 4500N -300 4500N -250 4500N -200 4500N -150 4500N -100 4500N -50 4500N
0 4500N 50 4500N
100 4500N 150 4500N 200 4500N 250 4500N 300 4500N 350 4500N 400 4500N 450 4500N 500 4500N 550 4500N 600 4500N 650 4500N 700 4500N
450W 400W 350W 300W 250W 200W 150W 1 OOW 50W 0 50E 100E l5OE 200E 250E 300E 350E 400E 450E 500E 550E 600E 650E 700E
700W 650W 600W 550W 500W 450W 400W 350W 300W 250W 200W 150W 1 OOW 50W 0 50E 1 OOE 150E 200E 250E 300E 350E 400E 450E 5OOE 550E 600E 650E 700E
1 1 1 1
ASSAY RESULTS (ppb) APPENDIX A MMI GEOCHEMICAL DATA
CALCULATED RESPONSE-RATIOS
Page 1

450 4400N -400 4400N -350 4400N -300 4400N -250 4400N -200 4400N -150 4400N -100 4400N -50 4400N
0 4400N 50 4400N
100 4400N 150 4400N 200 4400N 300 4400N 300 4400N 350 4400N 400 4400N 450 4400N 500 4400N 550 4400N 600 4400N 650 4400N 700 4400N
Line 4500N -700 4500N -650 4500N -600 4500N -550 4500N -500 4500N -450 4500N -400 4500N -350 4500N -300 4500N -250 4500N -200 4500N -1 50 4500N -100 4500N -50 4500N
0 4500N 50 4500N
100 4500N 150 4500N 200 4500N 250 4500N 300 4500N 350 4500N 400 4500N 450 4500N 500 4500N 550 4500N 600 4500N 650 4500N 700 4500N
450W 400W 350W m o w 250W 200w 1 SOW 1 OOW 50W 0 50E 1 OOE l5OE 200E 250E 300E 350E 400E 450E 500E 550E 600E 650E 700E
700w 650W 600W 550w 500w 450w 400w 350W 300w 250W 200W 1 SOW 100W 50W 0 50E 1 OOE 150E 200E 250E 300E 350E 400E 450E 500E 550E 600E 650E 700E
250W-A 450W-A
ASSAY RESULTS b b )
APPENDIX A MMI GEOCHEMICAL DATA ASSAYS ORGANIZED IN ASCENDING ORDER FOR CALCULATION OF LOWER
QjARTlLE BACKGROUND
1373.85 75.38462 2.5 25.385 0.1077 31.3077 11.308 5 16
CALCULATED BACKGROUND VALUES
PAGE 2

Appendix B
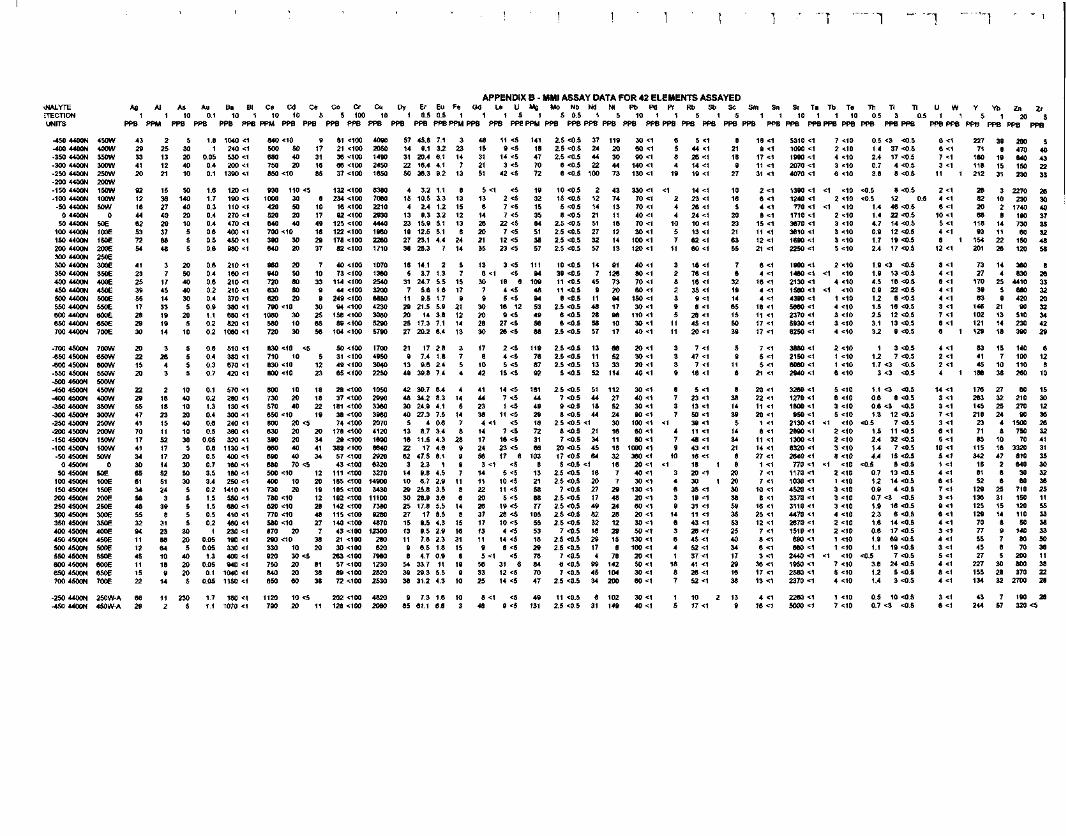
APPENDIX 6 - MMI ASSAY DATA FOR 42 ELEMENTS ASSAYED Co Cr Cu Dy Er Eu Fe Gd La U Mg Ma Nb Nd Ni Pb W R Rb Sb Sc
5 100 10 1 0 . 5 0 . 5 I 1 1 5 1 5 0 . 5 I 5 10 1 1 5 1 5 T B PPB PPB PPB PPB PPB PPM PPB PPB PPE F'PM PPB PPB PPB PPB PPB PPB PPB PPB PPB PPB F
\NALrn TECTION UNITS
AQ 1
PPB
Al As Au 1 10 0.1
PF'M PPB PPB
Ba Bi 10 1
PPB PPB
Ca Cd Ce 10 10 5
PPM PPB PPB I
Sm Sn 1
'PB PPB
Sr Ta Tb Te Th Ti TI 10 1 1 10 0.5 3 0.5
PPB PPBPPB PPB PPB Pf'BPPB
U W 1 I
PPB PPB

Appendix C

I 1 1
I 1 1 1 1 -7 - ) J - . - . , . -. - I ? I I \
5-
A& ANALYTICAL LABORATORIES LTD . 852 E. HASTINGS ST. VANCOWER BC V6A 1R6 PHONE(604) 25 3-3158 FAX(604) 253-1716 (IS0 9002 Accredited Co.)
GEOCHEMICAL ANALYSIS CERTIFICATE
J.M. Ashton 8 Associates Ltd. PROJECT Ashton Copper-Gold F i l e # A404199 Page 1 112 - 1157 M e l v i l l e St., Vancouver BC V6E 2x5 Submitted by: J.M. Ashtbn
SAMPLE# Mo Cu Pb Zn Ag Ni Co Mn Fe As U Au Th Sr Cd Sb 81 V Ca P La Cr Mg 8a T i 8 A1 Na K W Sc TI S Hg Se Te Gasample
~ p m ppm ppm ppm ppb ppm P P ~ PP P P P ~ ppm P P ~ PP ppm PW D P ~ PW P P ~ ): P P ~ P P ~ 3 ppm i: PW j! e 2 ppm ppm ppm 3 D D ~ PDm DDm DDm Om
Q4
STANDARD DS5 12.50 147.43 24.96 137.0 279 25.0 12.4 795 3.06 18.8 6.4 41.3 3.0 49.3 5.66 3.75 6.37 63 .78 .094 13.4 183.5 .70 142.2 ,096 17 2.12 ,033 . I5 4.9 3 .6 1.08 .03 173 5.0 .82 6.9 30
GROUP 1 F3O - 30.00 GM SAMPLE LEACHED WITH 180 ML 2-2-2 HCL-HNO3-HZO AT 95 DEG. C FOR ONE HOUR, DILUTED TO 600 ML, ANALYSED BY ICP/ES & MS. (>) CONCENTRATION EXCEEDS UPPER LIMITS. SOME MINERALS MAY BE PARTIALLY ATTACKED. REFRACTORY AND GRAPHITIC SAMPLES CAN LIMIT AU SOLUBILITY. - SAMPLE TYPE: P I ROCK P2 ROCK A
P Data-
A l l r e s u l t s are considered the c o n f i d e n t i a l p roper ty o f t he c l i e n t . Acme assumes the l i a b i l i t i e s f o r ac tua l cost o f t he ana lys i s only.