mobile services, spectrum and network evolution to 2025
TRANSCRIPT

Mobile Services, Spectrum and Network Evolution to 2025
A review for telecoms regulators and operators of key global developments, insights, trends, and best international practices, to inform future spectrum policy and management and operator strategies
March 2021

Content
1. Introduction and key findings ............................................................... 1
1.1 Background and scope ........................................................................ 1 1.2 Key findings ......................................................................................... 1
2. Mobile services and consumption in 2025 ........................................... 7
2.1 What will the world look like in 2025? ................................................... 7 2.2 Global evolution of demand by mobile service category .................... 15 2.2.1 Enhanced Mobile Broadband and Fixed Wireless Access ................. 16 2.2.2 The Internet of Things (IoT) ............................................................... 20 2.2.3 Contributions to total mobile data traffic ............................................. 22 2.2.4 Peak legacy-traffic point ..................................................................... 22 2.3 Technology split by region ................................................................. 24 2.4 Demand for mobile network capacity in 2025 .................................... 25 2.4.1 Mobile data consumption by region.................................................... 25 2.4.2 Impact of data speed targets .............................................................. 27 2.4.3 Capacity requirements by region ....................................................... 28 2.5 Far more spectrum is needed to meet future demand ....................... 29
3. The business case for 5G .................................................................. 31
3.1 Current state of the industry ............................................................... 31 3.2 5G investment requirements .............................................................. 33 3.3 Future industry revenue prospects ..................................................... 34 3.3.1 Potential revenue-growth areas ......................................................... 35 3.3.2 5G revenue prospects from eMBB ..................................................... 36 3.3.3 The opportunity from Fixed Wireless Access ..................................... 37 3.3.4 The IoT opportunity ............................................................................ 37 3.3.5 The wider ‘Enterprise’ opportunity ...................................................... 39 3.3.6 Quality-of-Service based pricing ........................................................ 40 3.3.7 Synthesis: future revenue prospects .................................................. 42 3.4 Operators need to bring down the cost per bit ................................... 43 3.4.1 Key drivers of capacity-related costs .................................................. 44 3.4.2 Bringing down total costs per bit ........................................................ 44 3.5 Individual operator perspective .......................................................... 45 3.6 Managing the transition from 4G to 5G .............................................. 46 3.7 Key spectrum-acquisition considerations ........................................... 49
4. Impact on society ............................................................................... 51
4.1 Contribution to the economy .............................................................. 51 4.2 Marginal impact of mobile communications on economic growth ...... 52 4.2.1 Studies covering the 2G and 3G era .................................................. 52 4.2.2 Studies spanning the 4G era .............................................................. 53 4.3 Impact of spectrum deployment on economic growth and welfare ..... 55 4.4 Ensuring the socio-economic gains materialise ................................. 56
5. Evolution of mobile networks and technology .................................... 58
5.1 From 4G to 5G ................................................................................... 58 5.2 RAN architecture evolution 2021 to 2025 ........................................... 58 5.2.1 Drivers for RAN evolution ................................................................... 58 5.2.2 Open RAN .......................................................................................... 60 5.2.3 Network Slicing .................................................................................. 62

5.2.4 Security .............................................................................................. 64 5.2.5 Synthesis: should industry back O-RAN or the 3GPP approach? ...... 66 5.3 Increasing the efficiency of spectrum use .......................................... 67 5.3.1 Sectorisation and MIMO enhancements ............................................ 68 5.3.2 Creating wider logical channels through Carrier Aggregation ............ 71 5.3.3 Wide-band deployment versus Carrier Aggregation........................... 72 5.3.4 Impact of wide-band deployment on network costs............................ 73 5.3.5 Enabling wide-band deployment through spectrum consolidation ..... 74 5.3.6 Reorganising paired spectrum into TDD bands ................................. 76 5.4 Network densification: macro sites versus small cells ........................ 76 5.5 Evolution of mobile asset sharing....................................................... 78 5.5.1 Traditional forms of network and spectrum sharing ............................ 78 5.5.2 Emerging neutral host networks ......................................................... 79 5.6 Heterogeneous networks ................................................................... 81 5.7 Device ecosystem .............................................................................. 82 5.8 Laying the foundations for 6G ............................................................ 85
6. Spectrum demand 2020-2025 ............................................................ 87
6.1 IMT requirements ............................................................................... 87 6.2 Current spectrum landscape and roadmap ........................................ 88 6.3 Quantifying spectrum demand ........................................................... 92 6.3.1 Methodology and key assumptions .................................................... 93 6.3.2 Spectrum to meet the 100 Mbit/s downlink requirement .................... 99 6.3.3 Extra spectrum to meet the 50 Mbit/s uplink requirement ................ 102 6.3.4 High bands in the context of dense-urban capacity needs ............... 104 6.3.5 Relationship between spectrum and the rural FWA opportunity ...... 104 6.3.6 Spectrum to meet the 10 Mbit/s/m2 requirement .............................. 106 6.4 Regulatory considerations ................................................................ 107
7. Spectrum management and pricing ................................................. 108
7.1 Public policy objectives .................................................................... 108 7.2 Spectrum award mechanisms .......................................................... 110 7.3 The trade-off between licence fees and socio-economic outcomes . 112 7.3.1 Policies relating to licence-fee generation ........................................ 112 7.3.2 International examples ..................................................................... 112 7.3.3 The ‘Sunk Costs’ myth ..................................................................... 114 7.3.4 Historical evidence on the welfare impact of licence fees ................ 115 7.3.5 Quantitative cross-country research ................................................. 117 7.3.6 Further impact of licence fees on the national interests ................... 118 7.4 Sustainable spectrum pricing ........................................................... 119 7.5 Interference coordination, coexistence, TDD synchronisation ......... 124 7.6 International best practices .............................................................. 126 7.6.1 The importance of regulatory certainty ............................................. 126 7.6.2 Moderating the total costs of licences .............................................. 127 7.6.3 Technology neutrality ....................................................................... 127 7.6.4 Spectrum packaging ........................................................................ 127 7.6.5 Timing of awards .............................................................................. 128 7.6.6 Spectrum trading .............................................................................. 128
8. Concluding remarks ......................................................................... 130
Appendix Overview of IMT bands ......................................................... 131

Glossary ......................................................................................................... 132
Exhibits
Exhibit 1: Plausible lower-bound need for spectrum up to 6GHz in 2025 ....... 5 Exhibit 2: Mobile data traffic in 2025 as multiple of 2020 traffic ...................... 7 Exhibit 3: iPhone 12 Pro video recording settings .......................................... 8 Exhibit 4: Data consumption per 1-hour of streaming .................................... 9 Exhibit 5: M2Consumer: baseball in 5G and 4 Dimensions ........................... 9 Exhibit 6: M2Consumer and M2Home: cloud gaming and VR ..................... 10 Exhibit 7: Network performance requirements ............................................. 11 Exhibit 8: M2Business: Mobile Private Networks ......................................... 12 Exhibit 9: IoT2Government, Business and Consumer: smart health ............ 13 Exhibit 10: Performance requirements for cellular IoT ................................... 14 Exhibit 11: IoT2Consumer and IoT2Business: smart vehicles ....................... 14 Exhibit 12: Mobile and IoT2Government: emergency services and city security
..................................................................................................... 14 Exhibit 13: The key service categories in the 5G era ..................................... 16 Exhibit 14: Mobile penetration as % global population (excluding IoT) .......... 16 Exhibit 15: 5G as % global connections (excluding IoT) ................................ 17 Exhibit 16: Unique eMBB adoption as % global population ............................ 18 Exhibit 17: eMBB usage per capita and per unique eMBB user ..................... 18 Exhibit 18: FWA penetration as % global population ...................................... 19 Exhibit 19: FWA usage per capita and per connection ................................... 20 Exhibit 20: Cellular IoT devices as % global population ................................. 21 Exhibit 21: Cellular IoT traffic per capita and per device ................................ 21 Exhibit 22: Total global mobile and 5G traffic per capita ................................ 22 Exhibit 23: Mobile traffic contributions by service category ............................ 22 Exhibit 24: 5G versus legacy AUPU in Korea (2019) ..................................... 23 Exhibit 25: 5G versus legacy AUPU (GBytes/month, September 2020) ........ 24 Exhibit 26: Breakdown of mobile subscriptions by technology ....................... 25 Exhibit 27: Mobile data traffic per capita (excl IoT) ......................................... 26 Exhibit 28: Total mobile data traffic CAGR 2019-2025 ................................... 26 Exhibit 29: Impact of speed targets on the site design load (capacity need) .. 28 Exhibit 30: Capacity need in 2025 as a multiple of capacity utilised in 2020 .. 29 Exhibit 31: Mobile market revenue indices (in real terms, median values) ..... 31 Exhibit 32: EBITDA minus Capex as % service revenues (median values) ... 32 Exhibit 33: Returns (ROIC) versus cost of capital (WACC) ............................ 32 Exhibit 34: Cumulative capex by region 2020-2025 (in $ millions) ................. 33 Exhibit 35: Global mobile revenue evolution (GSMA projections) .................. 35 Exhibit 36: 5G vs. 4G data pricing in Korea, shortly after the launch of 5G .... 36 Exhibit 37: GSMA perspective on the global IoT value chain ......................... 38 Exhibit 38: Relative positions within the IoT space ......................................... 39 Exhibit 39: Mean EU fixed broadband prices (€ per month) ........................... 40 Exhibit 40: QoS-based pricing ........................................................................ 42 Exhibit 41: Real-term revenue per bit index ................................................... 43 Exhibit 42: The mobile “Prisoners’ Dilemma” ................................................. 46 Exhibit 43: Typical distribution of customer ARPU across percentiles ........... 47 Exhibit 44: Managing the transition to 5G ...................................................... 47 Exhibit 45: Legacy sunset timetable in different markets ............................... 49 Exhibit 46: Value creation through spectrum acquisition ................................ 50 Exhibit 47: Benefits of mobile communications .............................................. 51

Exhibit 48: The historical GDP impact of mobile usage per 3G connection ... 53 Exhibit 49: Impact of 2G to 4G mobile on GDP .............................................. 54 Exhibit 50: Impact of halving prices per unit on Consumer Surplus ............... 55 Exhibit 51: Impact of large spectrum allocation at low prices (illustrative) ...... 56 Exhibit 52: Key elements of RAN evolution .................................................... 60 Exhibit 53: 3GPP versus O-RAN alliance approach ....................................... 64 Exhibit 54: Commercial LTE 900 MHz: 4x4 MIMO versus 2x2 MIMO ............ 69 Exhibit 55: Relative bandwidth and capacity by band .................................... 70 Exhibit 56: Huawei MIMO evolution roadmap ................................................ 71 Exhibit 57: Carrier aggregation example ........................................................ 72 Exhibit 58: Comparison 100 MHz contiguous vs two 50 MHz blocks ............. 72 Exhibit 59: Cost per bit depending on channel bandwidth .............................. 73 Exhibit 60: Cost per bit with per operator allocation of over 100 MHz ............ 74 Exhibit 61: Low-band consolidation in a 3-player market (illustration) ............ 75 Exhibit 62: Telus versus Rogers networks (Vancouver snapshot) ................. 77 Exhibit 63: Traditional network sharing versus Neutral Hosting ..................... 80 Exhibit 64: A mix of bands will be needed for coverage and capacity ............ 81 Exhibit 65: Band support in a sample of 5G smartphones ............................. 83 Exhibit 66: 5G versus 4G subscriptions in the first years of deployment ........ 83 Exhibit 67: Price evolution for a sample of Smartphones ............................... 84 Exhibit 68: Spectrum mix and the IMT 2020 requirements ............................. 87 Exhibit 69: European broadband policy .......................................................... 87 Exhibit 70: BEREC Very High Capacity Networks Criterion 4 ........................ 88 Exhibit 71: Low, mid and high frequency bands for 5G .................................. 88 Exhibit 72: Typical low and mid-band spectrum allocated to mobile in Asia ... 90 Exhibit 73: Typical spectrum used by mobile in Europe by 2023 ................... 91 Exhibit 74: Spectrum roadmap in Canada ...................................................... 91 Exhibit 75: Order of spectrum award and deployment priorities ..................... 92 Exhibit 76: Traffic demand and capacity supply model .................................. 94 Exhibit 77: Key 5G modelling assumptions for future urban environment ...... 99 Exhibit 78: Population and areas of sample cities ........................................ 100 Exhibit 79: DL area traffic demand and spectrum needs .............................. 101 Exhibit 80: Total low and mid-band spectrum need (MHz) to meet DL
requirement ................................................................................ 102 Exhibit 81: Additional mid-bands spectrum needs (MHz) to meet UL
requirement ................................................................................ 103 Exhibit 82: Low and mid-band spectrum needs (MHz) to meet both the DL and
UL requirements ......................................................................... 103 Exhibit 83: FWA covered homes per site model ........................................... 105 Exhibit 84: FWA households supported depending on speed and spectrum 106 Exhibit 85: Spectrum and area traffic capacity ............................................. 106 Exhibit 86: Spectrum policy objectives ......................................................... 108 Exhibit 87: Overview of main spectrum award mechanisms ........................ 110 Exhibit 88: Change in Government spectrum pricing policy in France ......... 113 Exhibit 89: Finland leads in mobile broadband ............................................. 116 Exhibit 90: Ratio of increases in welfare to reductions in licence fees ......... 118 Exhibit 91: Gauging the sustainability of fees for new spectrum .................. 120 Exhibit 92: Annuity calculation formula ......................................................... 120 Exhibit 93: Mobile industry revenue per MHz of spectrum deployed ............ 120 Exhibit 94: Cost per MHz to maintain spectrum TCO at 5% of revenues ..... 121 Exhibit 95: Annualised cost of spectrum % of revenue, selected countries .. 122 Exhibit 96: Spectrum Price Index ................................................................. 123 Exhibit 97: Overview of IMT bands ............................................................... 131

Authors
Stefan Zehle, MBA CEO, Coleago Consulting Ltd
Tel: +44 7974 356 258 [email protected]
Nick Fookes, MSc CFA Managing Consultant, Coleago Consulting Ltd
Tel: +44 7710 350 816 [email protected]

Mobile Services, Spectrum and Network Evolution to 2025
C:\Users\stefa\Dropbox\Projects\Huawei Spectrum Evolution Jan 2021\Deliverables\Desseminatation\Mobile Spectrum and Network Evolution to 2025 - Coleago - 24 Mar
© copyright Coleago 2021 1
1. Introduction and key findings
1.1 Background and scope
This report focuses on key global mobile developments, insights, trends, and best international practices. It draws on a wide range of sources, as referenced within the main text, and is intended chiefly for:
Telecoms Regulators ‒ to inform future spectrum policy and management; and
Mobile operators ‒ to support strategy development.
Scope of the report
The report considers the evolution of mobile services and applications, of the adoption and consumption of mobile data services, and of mobile network capacity requirements. These are projected to 2025, on a global and regional basis.
We also consider the economic implications of the changing mobile landscape, both from a societal and an industry perspective.
Taking account of the evolution of mobile networks and technology over the 2020-2025 period, we estimate spectrum demand for a sample of developed and emerging markets. Finally, we explore the implications for spectrum management and pricing, focusing on the sustainability of the industry and of the socio-economic gains delivered by mobile communications.
1.2 Key findings
Evolution of services and consumption (section 2)
In 2025, global mobile data traffic will be between 3x and 9.5x that in 2020, with 5G accounting for almost half of the total (section 2.1)
The main traffic growth drivers are increased consumption of video at increasing levels of quality, accounting for of 75% of total mobile traffic in 2025, followed by mobile e-gaming, projected to reach 25% of 5G traffic by 2022 (section 2.1)
Immersive 360-degree video and gaming will add to demand for low latency communications ‒ to avoid motion sickness when using VR headsets‒ and will boost data-speed requirements to up to 600Mbit/s for a ‘retinal’ 360-degree experience comparable to 4k TV (section 2.1)
Operators will shift from the sale of data volumes in Gbytes to selling data-speeds in Mbit/s (section 2.1); speed-experience targets of 100Mbit/s with 99% probability will roughly double the capacity requirement implied by the growth in traffic alone (section 2.4.2)
Meeting the exploding demand as well as the IMT 2020 Requirement of 100Mbit/s per user (as specified by the ITU) would entail growth in mobile network capacity of between 7x and 16.5x on a global basis, and between 15x and 35.5x in sub-Sharan Africa (section 2.4.3)
– These are seismic shifts: one can no longer speak of simple ‘evolution’ and ‘business as usual’
Twice as much capacity from legacy technologies (up to 4G) will be required in 2025 than utilised today (section 2.2.4)
Peak legacy-traffic points are expected to be reached between 2022-2024 in developed countries and after 2026 in all other markets (section 2.3)
We anticipate sustained, rapid growth in mobile data consumption. While increased adoption of mobile data
services is a factor, the overwhelming growth driver is video applications at
higher resolutions.

Mobile Services, Spectrum and Network Evolution to 2025
C:\Users\stefa\Dropbox\Projects\Huawei Spectrum Evolution Jan 2021\Deliverables\Desseminatation\Mobile Spectrum and Network Evolution to 2025 - Coleago - 24 Mar
© copyright Coleago 2021 2
To meet the capacity requirements in 2025, operators worldwide will need to secure significant amounts of additional spectrum and invest in technology enhancements (increased sectorisation and higher-order MIMO) and densify their networks (section 2.5)
5G network slicing will drive service diversity, opening-up mobile networks to a very broad range of specialised service-providers catering for key industries and verticals (section 2.1)
– Network slicing could also allow mobile operators to retain a share of the value from the rapid growth in private networks
The number and range of cellular IoT applications will explode, with mobile-connected devices growing 3.4x between 2019 and 2025 (section 2.1); however, the contribution tot total mobile traffic and connectivity revenues will remain modest (section 2.2.2)
Providing the necessary spectrum resources are made available to operators at accessible prices, the capabilities delivered by 5G could allow lower-income countries to narrow the digital gap with more advanced economies
The business case for 5G (section 3)
The general trends over the past decade point towards declining revenues and returns in real if not in nominal terms; returns on invested capital (ROIC) are below the cost of capital for a majority of leading operators, which is indicative of an industry under pressure (section 3.1)
Average global capex is projected to reach 17% of service revenues between 2020-2025 (section 3.2)
For 2020-2025, the GSMA projects nominal revenue growth of 1.5% per year in developing countries, 1% on developed markets and 1.2% globally ‒ all beneath inflation, implying declining revenue evolution in real terms (section 3.3)
While a degree of caution is warranted given historic trends, our view is that the industry should target a resumption of revenue-growth in line with the annual growth in GDP (sections 3.3.4, 3.3.6 and 3.3.7); we believe that the two main opportunities to drive revenue growth are:
– Moving up the IoT value chain, beyond the provision of simple connectivity; and
– Targeting Enterprise solutions (e.g. Mobile Private Networks); and
– Introducing quality-of-service based pricing across all customer segments
To create a positive overall 5G business case, total costs per bit incurred by operators need to fall at a similar rate as the total revenues per bit (section 3.4); this may be achieved through:
– The release of substantial amounts of additional spectrum with wide-band allocations at low prices (section 3.4.2)
– Increased asset-sharing across the industry (sections 3.4.2 and 5.5)
– Deploying technology enhancements such as sectorisation and higher-order MIMO, which typically cost less per bit than deploying new sites (sections 3.4.2 and 5.3)
– Maintaining high levels of competition between equipment vendors, by providing market access to the broadest range of international suppliers (section 3.4.2)
– Network virtualisation and open RAN strategies (sections 3.4.2 and 5.2.2)
The 5G investment case for individual operators is likely to remain positive, even if 5G does not lead to increased industry returns on aggregate: failure to invest would limit the future of individual operators (section 3.5)
In addition to securing and deploying additional spectrum, operators will
need to roll-out massive MIMO and deploy new sites (macros and small
cells)
The mobile value proposition is shifting from ‘best effort’ provision of
ever more Gbytes to the sale of improved data speed-experience.

Mobile Services, Spectrum and Network Evolution to 2025
C:\Users\stefa\Dropbox\Projects\Huawei Spectrum Evolution Jan 2021\Deliverables\Desseminatation\Mobile Spectrum and Network Evolution to 2025 - Coleago - 24 Mar
© copyright Coleago 2021 3
Many 4G networks are currently overloaded, while available 5G capacity is underutilised; this poses clear near-term challenges (section 3.6), which may require accelerated re-farming of legacy 2G and 3G bands initially to 4G, rather than straight to 5G; however:
– With the exception of 3.5GHz deployment (which is generally 5G-only), expanding 4G capacity will involve 5G-ready equipment (RF units and MIMO systems), providing a smooth future transition path to 5G in the relevant bands
– Once the peak legacy-traffic point is reached, Dynamic Spectrum Sharing (DSS) can be used to progressively shift available 4G capacity to 5G, enabling a gradual migration of traffic across technologies
– Operators should not charge a premium simply for access to 5G, as this may hamper the customer migration to 5G (rapid migration allowing more efficient use of network resources)
Socio-economic impact (section 4)
The absolute contribution of mobile communications to the economy is very large (section 4.1); mobile is estimated to have contributed $4.1 trillion in Economic Value Added (4.7% of global GDP) in 2029, supported 30 million direct and indirect jobs, and $0.5 trillion in public sector funding; by 2025:
– Economic Value Added will approach $5 trillion (4.9% of global GDP)
– The 5G ecosystem will enable $13.2 trillion in annual global economic output (9% of GDP), fuel $2.7 trillion in cumulative real GDP growth (adding 0.2 percentage points to real annual GDP growth), and support 22.3 million jobs
The marginal impact of mobile is also important: moderate changes in consumer outcomes bear heavily on welfare and economic development (sections 4.2 and 4.3); in particular:
– A 10% increase in mobile broadband adoption could fuel an increase of over 0.6% in GDP (section 4.2.2)
– Cellular IoT will power the 4th Industrial Revolution; A 10-percentage point increase in IoT connections could drive a 0.23 percentage point increase in Total Factor Productivity growth (section 4.2.2)
– A doubling of data usage drives an increase in Consumer Surplus of around 75% of customer spend (section 4.3); for a country like Nigeria for example, additional spectrum releases could fuel $17 billion in increased Consumer Surplus by 2025, nearly 4% of GDP
Consumer outcomes (hence also socio-economic gains) are highly sensitive to public policy decisions (sections 4.3, 4.4 and 7.3); spectrum availability, wide-band allocations and pricing are especially important
Evolution of mobile networks and technology (section 5)
While network virtualisation and open RAN strategies provide operational flexibility and enable operators to reduce costs, they also create vulnerabilities and security threats (section 5.2)
To deliver the massive increases in network capacity while containing total costs per bit, operators will need to increase the efficiency with which they use spectrum resources (section 5.3); possible measures include:
– Increased sectorisation and higher-order MIMO deployments (section 5.3.1)
– According to a conservative rule of thumb, 64x64 MIMO can deliver 3.3x more capacity per MHz than 2x2 MIMO; some of the capacity gains from MIMO can also be traded-off for improved coverage in urban areas, allowing higher mid-bands to behave like lower mid-bands
– By 2025, 128x128 MIMO order will be part of the general configuration in higher TDD mid-bands, with 32x32 MIMO in higher FDD mid-bands
Many 4G networks are overloaded while spare 5G capacity is under-
utilised, posing near-term challenges.
The huge value of mobile communications accrues
overwhelmingly to consumers rather than to the operators. Policies aimed at extracting capital from the industry
can have a disproportionate impact on socio-economic gains.
Regulators should pursue policies that reduce the financial burden on
operators, to maximise mobile industry output for the benefit of
consumers and society.

Mobile Services, Spectrum and Network Evolution to 2025
C:\Users\stefa\Dropbox\Projects\Huawei Spectrum Evolution Jan 2021\Deliverables\Desseminatation\Mobile Spectrum and Network Evolution to 2025 - Coleago - 24 Mar
© copyright Coleago 2021 4
– Deploying 4x4 MIMO in sub1GHz bands generates capacity gains in the order of 60% over 2x2 MIMO; this is especially significant given the importance of low-bands to support cell-edge users and given that roughly a third of all 4G traffic is currently carried by low bands
– By 2025, 8x8 MIMO will be part of the general configuration for low bands
– Wide-band deployments; these result in higher performance and are more cost-effective than narrow-band deployments, even when carrier aggregation is used to create wider logical channels (sections 5.3.4 and 5.3.5)
– For this reason, regulators pursue wider-band allocations in future awards (it is more efficient for operators to deploy wider holdings in fewer bands than narrow holdings across many bands)
– Wider band deployments across contiguous spectrum could be achieved through spectrum consolidation (via spectrum trading or sharing)
– Deployment of wider logical channels by using Carrier Aggregation (CA), when wide-band allocations are not available (section 5.3.2); note that CA leads to a loss of performance and is less cost-effective than wide-band deployment across contiguous spectrum in a single band (section 5.3.3)
– Reorganisation of FDD bands into more efficient TDD bands (section 5.3.6); this applies both to low and higher mid-bands
– This would boost downlink throughput for a given MIMO order, and would also generally enable higher-order MIMO deployments
– in higher mid-bands such as 2600MHz, added benefits would include avoidance of a 5MHz guard-band and greater cost-effectiveness of MIMO deployment (than deploying MIMO in narrower FDD plus TDD portions)
Europe is lagging the North America in small cell deployments, partly because gaining planning approval for a small site remains a lengthy and costly process in Europe (section 5.4)
– The US implemented the ‘5G Fast Plan’ in 2018, and the UK and EU are now pursuing policy initiatives to facilitate the planning process for small cells
– If the planning cycle for small cells can be accelerated and if site-rental costs for small cells can be kept to a minimum, we would expect small cells to feature more prominently in the 5G strategies of European operators
– In the future, we may see the emergence of mass produced, low cost and self-configuring ‘tiny cells’, leading to a further step-change in network topography
Increased asset sharing across the industry will help reduce aggregate costs; emerging neutral host models offer a simple route to asset sharing across multiple operators on a site-by-site basis (section 5.5)
– Crucially, these may deliver substantial net cost savings while avoiding the complexities and onerous constrains of formal asset-sharing JVs (section 5.5.2)
While the number of available frequency bands has increased significantly with each successive generation of mobile technology, band-support within individual devices is fast becoming a non-issue, with leading smartphones supporting up to 29 4G bands and up to 17 5G bands as of 2020 (section 5.7)
Spectrum demand 2020-2025 (section 6)
With new spectrum for 5G, the amount of spectrum used by mobile operators to satisfy the growth in mobile data will double between 2020 and 2025 (section 6.2)
A mix of spectrum spanning low (sub1GHz) to high (mm wave) bands are needed to meet the IMT 2020 requirements specified by the ITU (section 6.1)
To quantify spectrum need to meet the IMT 2020 requirements, one should focus on the areas with the highest concentration of mobile traffic, taking account of maximum viable network densities (section 6.3.1)
Wide-band deployments are key to efficient use of spectrum, and are far
preferrable to Carrier Aggregation.

Mobile Services, Spectrum and Network Evolution to 2025
C:\Users\stefa\Dropbox\Projects\Huawei Spectrum Evolution Jan 2021\Deliverables\Desseminatation\Mobile Spectrum and Network Evolution to 2025 - Coleago - 24 Mar
© copyright Coleago 2021 5
For a sample spanning high and low-income countries, we obtain the following estimates of low plus mid-band spectrum need in 2025 (section 6.3.3):
Exhibit 1: Plausible lower-bound need for spectrum up to 6GHz in 2025
High-income sample MHz Low-income sample MHz
France (Paris) 2,220 Pakistan (Karachi central) 1,990
Spain (Madrid) 2,170 Morocco (Rabat central) 1,260
Italy (Rome) 2,020 Jordan (Aman central) 810
Germany (Berlin) 1,830 Sudan (Khartoum) 690
Netherlands (Amsterdam-The Hague region)
1,420
Source: Coleago
Where the estimated low and mid-band spectrum demand exceed the available supply of IMT frequencies up to 6GHz, the shortfall would entail either:
– A failure to meet the IMT-2020 Requirements in exceptionally concentrated population areas; or
– Costly measures to overcome the shortfall, including higher than assumed network densification and/or deployment of technology enhancements that deliver significantly higher spectral efficiency gains than projected; and/or
– Even greater reliance on traffic offloading to high frequencies and indoor cells
High bands are required to deliver the IMT 2020 Requirement of 5G area traffic capacity of 10 Mbit/s/m2 in very high traffic density areas (section 6.3.6)
– 2GHz of upper mid-band spectrum (beneath 6GHz) plus 3GHz in the 26GHz band would allow this
Bandwidth shorfalls caused by a failure to release sufficient IMT-designated spectrum could result in substantial socio-economic harm (sections 6.3.3, 4.3, 4.4, and 7.6.5)
Greater spectrum holdings also allow greater penetration of fibre-like Fixed Wireless Access services, and would allow high-speed broadband services where fibre is uneconomic ‒ helping bridge the digital divide in rural areas (section 6.3.5)
Spectrum management and pricing (section 7)
The overarching aim of public policy must be to promote superior social outcomes, both in the near- and long term (section 7.1); in the context of spectrum management, this would entail:
– High welfare (consumer surplus) generated by high adoption and use of mobile communications services, at sustainably low or moderate prices
– Increased digital participation
– A strong positive contribution from mobile to economic growth, employment and productivity
To further these aims, policy makers should:
– Drive efficient use of spectrum
– Award spectrum on a technology neutral basis, allowing operators, driven by competition, to pursue the most efficient strategies (section 7.6.1)
– Package spectrum in wide, contiguous blocks (sections 5.3 and 7.6.4), and foster spectrum trading and/or sharing to allow spectrum consolidation and wider-band deployment (sections 7.6.4 and 5.3.5)
– Pursue effective policies related to interference-coordination and coexistence between spectrum users across the industry (section 7.5)
– Foster sustainable and efficient competition (section 7.1)
Regulators should seek to release as much mobile spectrum as possible,
as fast as possible. Spectrum shortfalls lead to consumer harm and
impede economic development.
Fostering wide-band deployments through efficient spectrum packaging and by encouraging spectrum trading
and/or sharing is very important for mobile performance and cost-
effectiveness.

Mobile Services, Spectrum and Network Evolution to 2025
C:\Users\stefa\Dropbox\Projects\Huawei Spectrum Evolution Jan 2021\Deliverables\Desseminatation\Mobile Spectrum and Network Evolution to 2025 - Coleago - 24 Mar
© copyright Coleago 2021 6
– A balance needs to be struck between the level of competition and the degree of cost duplication, to generate the best outcome; too many operators would also generate insufficient profits, collectively, to be sustainable
– Excessive spectrum concentration and excessive spectrum prices threaten the sustainability of competition in mobile markets
– Policies that decrease the financial burden on the industry promote the sustainability of competition
– Promote innovation and investment in mobile networks and services
– Ensure that market participants maintain adequate prospects for returns-generation (section 7.1)
– Provide regulatory certainty (section 7.6.1)
All main spectrum auction formats have vulnerabilities, and do not guarantee efficient allocation of scarce resources (section 7.2)
– Hybrid allocation processes involving the administrative award of a portion of the available usage-rights, with a market-based mechanism for residual bandwidth minimises the risk of adverse outcomes; this approach was used in the French 3.4GHz auction in 2020
Differences in prices paid for licences between countries are to a large extent due to differences in policy objectives (section 7.3.1)
While operators may justify paying up to full value for spectrum licences (section 3.7), there are important trade-offs between licence fees and socio-economic outcomes (section 7.3)
– It is sometimes argued that lump-sum fees charged for operator-licences do not bear on subsequent management decisions, because these fees effectively become ‘sunk costs’; however, this hypothesis is amply refuted by experimental as well as empirical evidence (section 7.3.3)
– As of 2009, the ratio of social gains was around 240-to-1 in favour of mobile services over licence revenues in the US (section 7.3.4)
– Recent quantitative cross-country research indicates that increases in welfare exceed foregone mobile licence fee receipts by an average of 2.5-to-1 (section 7.3.5)
– These findings are supported by direct evidence from a broad range of markets (section 7.3.4)
– In addition to the direct impact of licence fees on consumer welfare, policy makers need to take account of the indirect impact on productivity, GDP growth and tax revenues (section 7.3.6)
The sustainability of spectrum pricing can be gauged by looking at the annualised TCO of spectrum as a percentage of mobile operator revenue (section 7.4)
– Revenues per MHz are falling, so prices per MHz need to fall too in order to remain sustainable
– As a rule of thumb, when the annualised cost of spectrum reaches 10% of mobile operator service revenue, mobile operators may hit budget constraints, i.e. investment in mobile broadband and 5G is likely to be curtailed or delayed
Operators should be willing to ‘walk away’ from spectrum if prices exceed value, as they recently did in the Indian multiband award, where 700MHz spectrum was left unsold (section 3.7)
Prices per MHz for incremental spectrum cannot sustainably remain
the same as prices per MHz for legacy spectrum.

Mobile Services, Spectrum and Network Evolution to 2025
C:\Users\stefa\Dropbox\Projects\Huawei Spectrum Evolution Jan 2021\Deliverables\Desseminatation\Mobile Spectrum and Network Evolution to 2025 - Coleago - 24 Mar
© copyright Coleago 2021 7
2. Mobile services and consumption in 2025
2.1 What will the world look like in 2025?
The Digital Universe contains around 44 zettabytes (that is 44 billion TB, or 5.6 TB per capita) and roughly doubles in size every two years1. On YouTube alone, 300m hours of video content are currently viewed each day, more than half of which are accessed on mobile devices2. By 2025, 64 ZB of data will be created each year. This is almost 1.5x the size of the current Digital Universe and represents a fivefold increase in the total amount of data generated in 2020.
Emerging AI-based technologies will help us make sense of these vast quantities of data as well as manage and protect information and devices.
Video will continue to dominate the Internet, accounting for over 80% of total traffic. By 2025, mobile networks will carry the equivalent of 60 billion hours of HD video each month ‒ over 7 hours per adult, child and infant. Ultra-HD will account for a fifth of all Internet video3. e-Sports will break further into the mainstream, with cloud-gaming projected to reach 25% of 5G traffic by 20224. Immersive 360-degree video and gaming will be commonplace. Holographic TV will penetrate the home5.
Exhibit 2: Mobile data traffic in 2025 as multiple of 2020 traffic
Source: Coleago based on internal, IDC, Ericsson, GSMA and ITU forecasts
Mobile already accounts for more than half of all web-traffic6. In all likelihood, global mobile will enter its own ‘Zettabyte Era’ in 2021. Ericsson7 forecasts that mobile networks will carry 2.8 ZB of data on an annualized basis in 2025, while the GSMA’s projections imply a total of 1.9 ZB (this forms the basis for our lower bound). In 2015, the ITU projected that global mobile traffic would reach a staggering 6.5 ZB by 2025
1 The 7th Digital Universe study by IDC (2014) estimated aggregate 2013 digital content at 4.4 ZB and projected a tenfold growth by 2020. See https://corporate.delltechnologies.com/en-us/newsroom/announcements/2014/04/20140402-01.htm.
2 Fortunelords.com, December 2020. 3 Source: https://www.hdtvtest.co.uk/n/Video-Streaming-to-Account-for-82-Percent-of-all-
Internet-Traffic-by-2022. 4 Source: https://advanced-television.com/2019/04/12/forecast-cloud-gaming-25-of-5g-data-
traffic-by-2022/. 5 See for example the ‘Looking Glass 8k’ debuted at CES 2020 in Las Vegas;
https://lookingglassfactory.com/product/8k. 6 Source: https://www.statista.com/statistics/277125/share-of-website-traffic-coming-from-
mobile-devices/. 7 Ericsson Mobility Report, November 2020.
4x global 2020 traffic2.8 ZB annualized4% of total data created
Ericsson view, global mobile
9.5x global 2020 traffic6.5 ZB on an annualized basis10% of total data created in 2025
Upper bound, global mobile
Up to 8x 2020 developed market trafficColeago view,
developed markets
3x global 2020 traffic1.9 ZB annualized3% of data created
Lower bound, global mobile
9.5x
8x
4x
3x
In 2025, 1.5x more data will be created each year than is contained in the entire Digital Universe today.
Global mobile traffic will be between 3x and 9x higher in 2025 than in 2020
‒ depending heavily on extra spectrum availability and deployment.

Mobile Services, Spectrum and Network Evolution to 2025
C:\Users\stefa\Dropbox\Projects\Huawei Spectrum Evolution Jan 2021\Deliverables\Desseminatation\Mobile Spectrum and Network Evolution to 2025 - Coleago - 24 Mar
© copyright Coleago 2021 8
(excluding M2M)8. While this forecast may appear dated, its projection for 2020 was within 1.3% of Ericsson’s more recent estimate ‒ giving some credence the ITU’s earlier vision for mobile. Coleago’s internal view for developed markets is closer to the ITU’s global growth multiple.
Monthly averages of 100GBytes per 5G user may already be reached in some markets9 within the next five years.
Which of the above global mobile traffic forecasts comes closest to actuals will depend heavily on external factors ‒ namely how much and how quickly additional spectrum inputs are made available to (and deployed by) operators across the globe. It is worth noting that Ericsson’s global traffic forecasts are generally being updated upwards in each successive iteration. Its 2020 projection for 2025 (excluding Fixed Wireless Access) is 16% higher than its 2019 projection for 2025, and around double its 2015 projection for 202510. In this light, Ericsson’s latest forecasts might still be deemed to err on the conservative side.
The ITU’s global forecast might be taken as an unconstrained upper-bound, that could be realised if all identified IMT spectrum is released quickly around the globe, at prices that do not add significantly to the financial constraints of the industry.
Where will the growth in mobile data consumption come from?
The key question is, where will this dizzying rise in consumption come from? One component is growth in mobile broadband (MBB) adoption, which is discussed further in section 2.2. The main component, however, is increased traffic per active data user.
Exhibit 3 shows the video recording settings for the iPhone 12 Pro, and how easily data usage can be boosted by simply flicking a switch. Taking and sharing one minute of 4k HD video at 60 frames per second (FPS) consumes almost 10x more data than 720p HD video at 30 frames per second, the lowest quality setting on the iPhone 12.
Exhibit 3: iPhone 12 Pro video recording settings
Source: Coleago based on iPhone specifications; pictures from Hexus.net
8 Estimation 1 from ‘IMT traffic estimates for the years 2020 to 2030’, ITU, 2015. The report states that this estimation was provided by China.
9 See for example the projections of UK MVNO ‘GiffGaff’, published in 2018. These are available at https://www.ispreview.co.uk/index.php/2018/01/giffgaff-predict-uk-5g-mobile-data-use-per-user-100gb-2025.html.
10 Estimation 2 from ITU, 2015 (Ibid). In 2015, Ericsson was forecasting that annual mobile traffic would reach 1ZB in 2025.
Video and cloud gaming are the main applications driving the explosion in
mobile data consumption.

Mobile Services, Spectrum and Network Evolution to 2025
C:\Users\stefa\Dropbox\Projects\Huawei Spectrum Evolution Jan 2021\Deliverables\Desseminatation\Mobile Spectrum and Network Evolution to 2025 - Coleago - 24 Mar
© copyright Coleago 2021 9
Ericsson (2019) projects that video will account for 75% of all mobile traffic by 2025, up from 63% in 2019. Streaming one hour of HD 2K consumes 4x more data than an hour of SD video, while AR/VR streaming at a media rate of just 25Mbit/s consumes 17x more. And this is not the end: by 2025, 8K video and 24K 3D VR will be the new ‘high definition’, while 2K will be considered basic.
More people streaming more video at higher resolutions quickly translates into massive increases in data traffic.
Exhibit 4: Data consumption per 1-hour of streaming
Source: Coleago based on Androidcentral.com and Ericsson (2019) data
In May 2020, Korean wireless carrier LGU+ started to leverage the angles for an immersive experience over 5G. This season, the South Korean baseball league has given U.S. fans a now-familiar sight with 4DReplay angles and offered Korean fans a whole new experience with a mobile-streaming experience over LGU+’s 5G network.
In the US, NBA and NHL teams are working with 4DReplay to develop a way to stream entire games over a 5G wireless network.
Exhibit 5: M2Consumer: baseball in 5G and 4 Dimensions
Source: LGU+
SD
HD 720p
HD 1080p
HD 2k
UHD 4k
AR/VR at 25Mbps 12 GBytes
3 GBytes
7.2 GBytes
0.7 GBytes
0.9 GBytes
1.5 GBytes
4DReplay Brings 360-Degree Coverage to KBO League (May 2020)
One hour of HD 2K video streaming consumes 4x more data than an hour
of SD video. By 2025, 8K video and 24K 3D VR will be the new ‘HD’.

Mobile Services, Spectrum and Network Evolution to 2025
C:\Users\stefa\Dropbox\Projects\Huawei Spectrum Evolution Jan 2021\Deliverables\Desseminatation\Mobile Spectrum and Network Evolution to 2025 - Coleago - 24 Mar
© copyright Coleago 2021 10
5G will also have a deep impact on cloud gaming. While Ericsson forecasts that video will account for 75% of all mobile traffic, most of the 50 operators that attended Openwave Mobility’s Mobile Video Industry Council (MOVIC) Livecast in April 2019 believe that cloud gaming could represent 25% to 50% of 5G data traffic by 2022, based on the rapid progression of cloud gaming services in the preceding months11.
Further evidence that gaming is firmly entering the mainstream comes from Deloitte’s 2020 digital media trends survey. It found that during the crisis, a third of US consumers have, for the first time, subscribed to a video gaming service, used a cloud gaming service, or watched esports or a virtual sporting event. According to Deloitte, there are already 2 billion mobile gamers worldwide today.
Exhibit 6: M2Consumer and M2Home: cloud gaming and VR
Source: Images from Digi.com, Wallpaper Flare and VentureBeat
Immersive 360-degree video and gaming will add to demand for low latency communications ‒ to avoid motion sickness when using VR headsets‒ and will boost data-speed requirements (80-100Mbit/s for a VR headset resolution comparable to HD TV, and 600Mbit/s for a ‘retinal’ 360-degree experience comparable to 4k TV)12.
While increased total mobile data consumption is a very important factor, what drives network capacity requirements is the speed with which data needs to be transmitted in times of peak demand. The data speed-experience requirements of mobile customers have a large additional impact on network dimensioning, as discussed below.
From selling data volumes (GBytes) to selling speeds (Mbits/s)
The days of best-effort mobile data provision are numbered. To date, there has been scant differentiation by operators between different types of mobile applications: the consumption price for a GByte of live video streaming has invariably been the same as for a GByte of time-insensitive background-file transfers. Yet not all bits of data are the same: its costs far more to produce a fast bit than a slow one. It makes sense, therefore, to charge more for time-critical data than for best-effort data.
Between 2020 and 2025, mobile operators will shift from selling bundles of GBytes to selling data speeds and performance. In an era of unlimited data packages, quality of the data-experience rather than quantity becomes the key differentiation point.
11 Advanced-television.com, ibid. 12 ADVA blog: ‘Virtual Reality Check: Are Our Networks Ready for VR?’, 2016.
A third of US consumers tried eGaming or viewed eSports for the
first time during 2020. Mobile executives believe that cloud gaming may reach 25% of 5G traffic by 2022.
A bit of high-speed data is more costly to produce than a slow bit.
Mobile operators will shift from selling data bundles to selling speeds and
performance.
In an era of unlimited data plans, quality of the data-experience
becomes the point of differentiation.
Mobile Services, Spectrum and Network Evolution to 2025
C:\Users\stefa\Dropbox\Projects\Huawei Spectrum Evolution Jan 2021\Deliverables\Desseminatation\Mobile Spectrum and Network Evolution to 2025 - Coleago - 24 Mar
© copyright Coleago 2021 11
The evolving customer-value proposition may yield opportunities for operators to stem the declining trend in real, global mobile revenues (described in section 3.1). Introducing Quality of Service-based pricing could potentially generate sustainable premiums for applications that are more costly to serve.
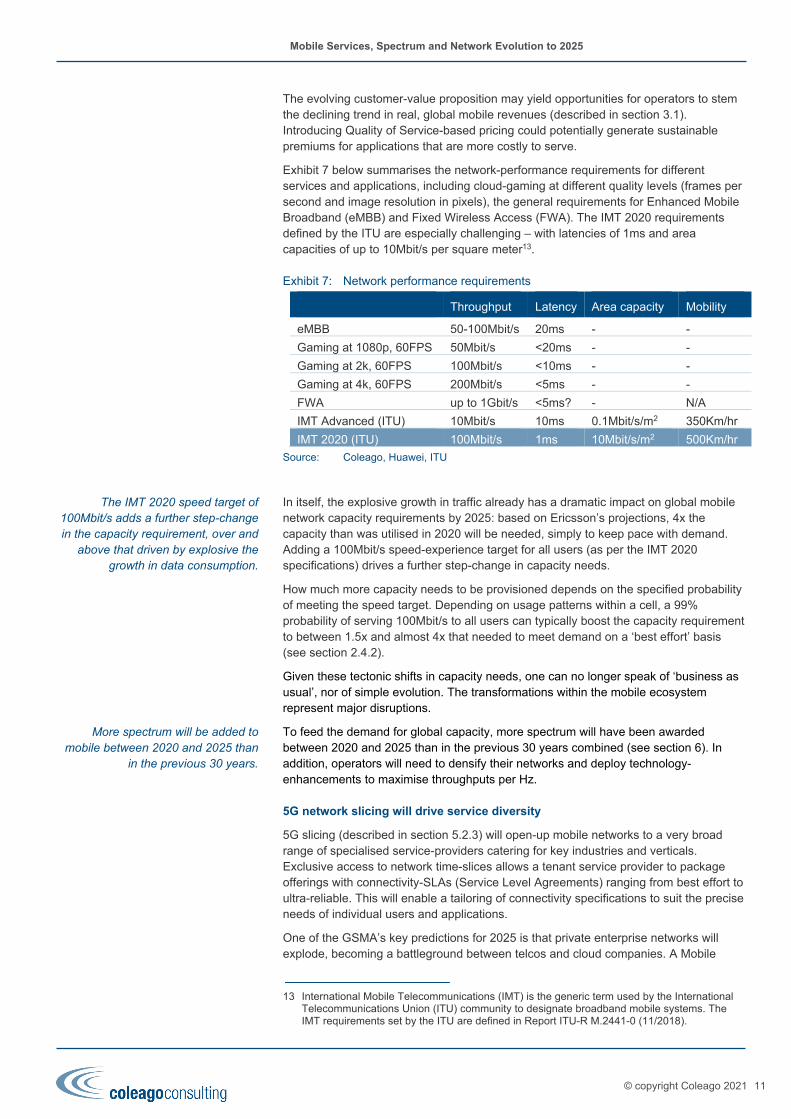
Exhibit 7 below summarises the network-performance requirements for different services and applications, including cloud-gaming at different quality levels (frames per second and image resolution in pixels), the general requirements for Enhanced Mobile Broadband (eMBB) and Fixed Wireless Access (FWA). The IMT 2020 requirements defined by the ITU are especially challenging ‒ with latencies of 1ms and area capacities of up to 10Mbit/s per square meter13.
Exhibit 7: Network performance requirements
Throughput Latency Area capacity Mobility
eMBB 50-100Mbit/s 20ms - -
Gaming at 1080p, 60FPS 50Mbit/s <20ms - -
Gaming at 2k, 60FPS 100Mbit/s <10ms - -
Gaming at 4k, 60FPS 200Mbit/s <5ms - -
FWA up to 1Gbit/s <5ms? - N/A
IMT Advanced (ITU) 10Mbit/s 10ms 0.1Mbit/s/m2 350Km/hr
IMT 2020 (ITU) 100Mbit/s 1ms 10Mbit/s/m2 500Km/hr
Source: Coleago, Huawei, ITU
In itself, the explosive growth in traffic already has a dramatic impact on global mobile network capacity requirements by 2025: based on Ericsson’s projections, 4x the capacity than was utilised in 2020 will be needed, simply to keep pace with demand. Adding a 100Mbit/s speed-experience target for all users (as per the IMT 2020 specifications) drives a further step-change in capacity needs.
How much more capacity needs to be provisioned depends on the specified probability of meeting the speed target. Depending on usage patterns within a cell, a 99% probability of serving 100Mbit/s to all users can typically boost the capacity requirement to between 1.5x and almost 4x that needed to meet demand on a ‘best effort’ basis (see section 2.4.2).
Given these tectonic shifts in capacity needs, one can no longer speak of ‘business as usual’, nor of simple evolution. The transformations within the mobile ecosystem represent major disruptions.
To feed the demand for global capacity, more spectrum will have been awarded between 2020 and 2025 than in the previous 30 years combined (see section 6). In addition, operators will need to densify their networks and deploy technology-enhancements to maximise throughputs per Hz.
5G network slicing will drive service diversity
5G slicing (described in section 5.2.3) will open-up mobile networks to a very broad range of specialised service-providers catering for key industries and verticals. Exclusive access to network time-slices allows a tenant service provider to package offerings with connectivity-SLAs (Service Level Agreements) ranging from best effort to ultra-reliable. This will enable a tailoring of connectivity specifications to suit the precise needs of individual users and applications.
One of the GSMA’s key predictions for 2025 is that private enterprise networks will explode, becoming a battleground between telcos and cloud companies. A Mobile
13 International Mobile Telecommunications (IMT) is the generic term used by the International Telecommunications Union (ITU) community to designate broadband mobile systems. The IMT requirements set by the ITU are defined in Report ITU-R M.2441-0 (11/2018).
The IMT 2020 speed target of 100Mbit/s adds a further step-change in the capacity requirement, over and
above that driven by explosive the growth in data consumption.
More spectrum will be added to mobile between 2020 and 2025 than
in the previous 30 years.
Mobile Services, Spectrum and Network Evolution to 2025
C:\Users\stefa\Dropbox\Projects\Huawei Spectrum Evolution Jan 2021\Deliverables\Desseminatation\Mobile Spectrum and Network Evolution to 2025 - Coleago - 24 Mar
© copyright Coleago 2021 12
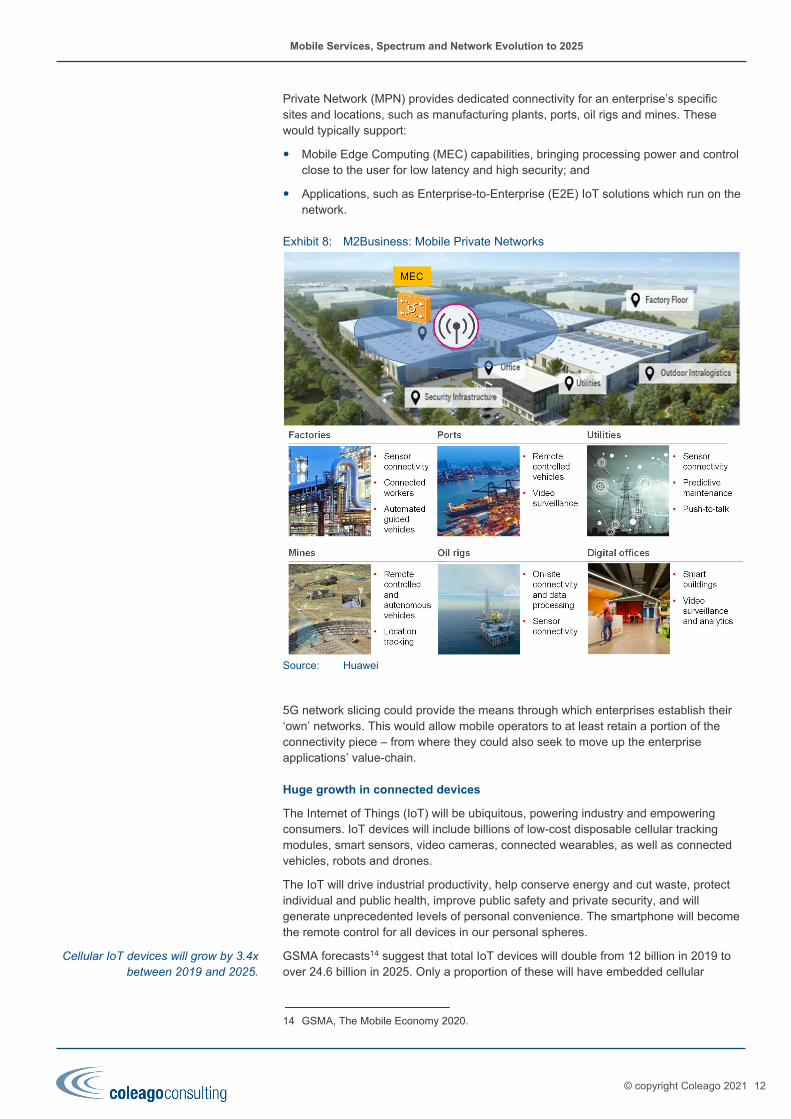
Private Network (MPN) provides dedicated connectivity for an enterprise’s specific sites and locations, such as manufacturing plants, ports, oil rigs and mines. These would typically support:
Mobile Edge Computing (MEC) capabilities, bringing processing power and control close to the user for low latency and high security; and
Applications, such as Enterprise-to-Enterprise (E2E) IoT solutions which run on the network.
Exhibit 8: M2Business: Mobile Private Networks
Source: Huawei
5G network slicing could provide the means through which enterprises establish their ‘own’ networks. This would allow mobile operators to at least retain a portion of the connectivity piece ‒ from where they could also seek to move up the enterprise applications’ value-chain.
Huge growth in connected devices
The Internet of Things (IoT) will be ubiquitous, powering industry and empowering consumers. IoT devices will include billions of low-cost disposable cellular tracking modules, smart sensors, video cameras, connected wearables, as well as connected vehicles, robots and drones.
The IoT will drive industrial productivity, help conserve energy and cut waste, protect individual and public health, improve public safety and private security, and will generate unprecedented levels of personal convenience. The smartphone will become the remote control for all devices in our personal spheres.
GSMA forecasts14 suggest that total IoT devices will double from 12 billion in 2019 to over 24.6 billion in 2025. Only a proportion of these will have embedded cellular
14 GSMA, The Mobile Economy 2020.
Cellular IoT devices will grow by 3.4x between 2019 and 2025.

Mobile Services, Spectrum and Network Evolution to 2025
C:\Users\stefa\Dropbox\Projects\Huawei Spectrum Evolution Jan 2021\Deliverables\Desseminatation\Mobile Spectrum and Network Evolution to 2025 - Coleago - 24 Mar
© copyright Coleago 2021 13
connectivity. Many will link to fixed networks via WiFi or be tethered to mobile networks via Bluetooth. Some remote, outdoor devices will be connected to the Internet via Satellite links. Enterprise IoT will overtake consumer in 2024, accounting for 65% of all new IoT connections between 2020 and 2025.
The GSMA predicts that 5G will be the first mobile technology that has a greater impact on industry than on consumers. According to the Vodafone IoT Barometer (2019), 76% of adopters describe their IoT projects as ‘mission-critical’ and 8% say their “entire business depends on IoT”.
The GSMA anticipates that the highest absolute growth in IoT (cellular and non-cellular) will come from the ‘smart buildings’ enterprise vertical (3.3 billion new connections) followed by the ‘smart home’ segment (2.0 billion new connections).
Cellular IoT will account for a growing share of machine-type connections. Ericsson projects around 5.1 billion cellular IoT devices by 2025, accounting for a fifth of all IoT connections (up from 12% in 2019). This implies a 3.4x increase in the number of cellular IoT devices over the period.
Much of the growth in cellular IoT will come from low-cost asset trackers, smart vehicles, sensors, cloud robots, cloud AR and VR, and advanced cloud gaming. According to the GSMA, more than half of people aged 55+ in high-income countries will be prescribed a connected health device by their doctor ‒ a tenfold increase from the 5% estimate for 2019. This will provide a tremendous boost to public-health management capabilities and efficiency.
Exhibit 9: IoT2Government, Business and Consumer: smart health
Source: Image from Multos.com
Although the total number of cellular IoT connections is set to be large, most devices will only consume very small amounts of data. For this reason, the contribution of IoT to total mobile traffic is expected to be modest (see sections 2.2.2 and 2.2.3 below). However, many cellular IoT applications will add to demand for:
Ubiquitous mobile coverage, both indoors and in remote locations; and
Ultra-low latencies to support critical IoT communications.
76% of enterprise IoT projects are described as mission-critical, with
entire businesses depending on IoT in 8% of cases.

Mobile Services, Spectrum and Network Evolution to 2025
C:\Users\stefa\Dropbox\Projects\Huawei Spectrum Evolution Jan 2021\Deliverables\Desseminatation\Mobile Spectrum and Network Evolution to 2025 - Coleago - 24 Mar
© copyright Coleago 2021 14
Exhibit 10: Performance requirements for cellular IoT
IoT category Throughput Latency
Enhanced Machine-Type communications (eMTC) 1-6Mbit/s 20ms
Ultra-reliable, low latency communications (uRLLc) 2-6Mbit/s 10ms
Source: Huawei
While cellular IoT will deliver very high incremental value to society, the connectivity element is likely only to have a moderate impact on operator revenues. Unless the operator-offering can move beyond simple data conveyance, the mobile industry will simply be an enabler of ‒ rather than a participator in‒ the value creation from IoT (see section 3.3.4 for further discussion on this topic).
Exhibit 11: IoT2Consumer and IoT2Business: smart vehicles
Source: Image from IEEE.org
Emergency Services communications
Over the next 5 years, blue-light services (police, fire and ambulance services) will rely increasingly on public mobile networks for their critical communications.
Exhibit 12: Mobile and IoT2Government: emergency services and city security
Source: Huawei with connected bodycam image from Axon
Key drivers for this migration include:
The high cost of maintaining a dedicated private network infrastructure for a relatively small base of users;
Unless operators can move beyond simple data conveyance, the mobile
industry will enable rather than participate in the huge value creation
from IoT.

Mobile Services, Spectrum and Network Evolution to 2025
C:\Users\stefa\Dropbox\Projects\Huawei Spectrum Evolution Jan 2021\Deliverables\Desseminatation\Mobile Spectrum and Network Evolution to 2025 - Coleago - 24 Mar
© copyright Coleago 2021 15
The high site redundancy within public networks (overlapping coverage provided by capacity sites, especially in urban areas); and
The possibility to establish secure, private virtual networks over public mobile infrastructure and systems.
Emergency services and PPDR (Public Protection and Disaster Relief) will have prioritized access to mobile bandwidth both for their critical communications and IoT applications.
Emerging versus high-income economies
In less affluent countries, where fixed networks are less widely developed, mobile will continue to do more of the ‘heavy lifting’.
Providing the necessary spectrum resources are made available to operators at accessible prices, the capabilities delivered by 5G could allow lower-income countries to narrow the digital gap with more advanced economies.
Extending coverage to remote areas
The proportion of the global population outside the coverage-area of fixed or mobile broadband networks will continue to dwindle. According to GSMA statistics, the global coverage gap already halved from 18% in 2015 to 9% in 2019. The largest coverage gains will be made in sub-Saharan Africa, where the gap stands at 26% of the population. Ericsson anticipates that by 2026, the global 4G coverage gap will drop to around 5% of the population, with 5G covering around 60% of the global population.
A mixture of networks will be used to bridge the digital divide in remote areas, including low-band mobile, low-earth orbit (LEO) satellites15, as well as fleets of solar-powered drones and high-altitude balloons16.
Asset-sharing between operators may also pave the way towards expansion of the land-based mobile footprint to areas that would otherwise be uneconomic. The Shared Rural Network (SRN) initiative in the UK is a prime example.
2.2 Global evolution of demand by mobile service category
Given the exploding number of applications that rely on mobile networks, it is increasingly impractical to consider each individually. Focusing instead on key service categories in the 5G era is more tractable. These include:
1. Enhanced Mobile Broadband (eMBB)
2. Fixed Wireless Access (FWA)
3. 4/5G-enabled Internet of Things (IoT) applications, also referred to as Enhanced Machine Type Communications (eMTC); these can be sub-divided into Massive and Critical MTC
15 Elon Musk’s Starlink enterprise seems to be a front-runner in this space. In the US, Starlink was recently awarded £1bn from the FCC to provide rural coverage in 35 states; see https://www.zdnet.com/article/elon-musks-spacex-starlink-lands-885m-to-bring-satellite-broadband-to-35-us-states/.
16 In the first half of 2020, for example, Google’s Loon already deployed 35 balloons at a stratospheric altitude of nearly 20km, providing 4G coverage across 80,000 square-km in central and western Kenya. Balloons, which can operate for 100 consecutive days before being brought back to earth, had previously only been used to provide emergency coverage following natural disasters. See https://www.nytimes.com/2020/07/07/world/africa/google-loon-balloon-kenya.html.
Subject to spectrum availability, 5G could allow lower-income nations to
narrow the digital gap with affluent markets.

Mobile Services, Spectrum and Network Evolution to 2025
C:\Users\stefa\Dropbox\Projects\Huawei Spectrum Evolution Jan 2021\Deliverables\Desseminatation\Mobile Spectrum and Network Evolution to 2025 - Coleago - 24 Mar
© copyright Coleago 2021 16
Exhibit 13: The key service categories in the 5G era
Source: ITU, Huawei, Ericsson, Coleago
Recent projections of mobile market evolution have been provided by the GSMA (February 2020) and Ericsson (November 2020). As outlined in the preceding section, both of these suggest substantially lower total global traffic by 2025 than projected by ITU. Both the GSMA and Ericsson views might thus be deemed closer to the lower-bound of plausible expectations.
Because Ericsson’s forecasts provide a more detailed breakdown however, we concentrate on these to gauge the relative contributions from each key service category. The results of the following analysis feed into our assessment of the business case for 5G (see section 3). In section 2.4, we will return to all three global traffic forecasts to examine their implications for future network capacity requirements.
2.2.1 Enhanced Mobile Broadband and Fixed Wireless Access
While the GSMA and Ericsson both anticipate strong growth in the adoption and consumption of mobile data services, Ericsson is more optimistic on the outlook for 5G in 2025.
Exhibit 14: Mobile penetration as % global population (excluding IoT)
Source: Coleago based on GSMA and Ericsson global forecasts
69%
72%
106%
109%
2% 22%
74%
79% 10
4%
107%
4%
35%
0%
20%
40%
60%
80%
100%
120%
2020 2025 2020 2025 2020 2025
% p
opul
atio
n
GSMA Ericsson
Unique mobile users Mobile connections 5G connections

Mobile Services, Spectrum and Network Evolution to 2025
C:\Users\stefa\Dropbox\Projects\Huawei Spectrum Evolution Jan 2021\Deliverables\Desseminatation\Mobile Spectrum and Network Evolution to 2025 - Coleago - 24 Mar
© copyright Coleago 2021 17
Exhibit 15: 5G as % global connections (excluding IoT)
Source: GSMA and Ericsson global forecasts
According to both Ericsson and the GSMA, more 5G connections are added today than across all legacy technologies. This means that the peak for ‘legacy adoption’ has already been reached. Globally however, 4G is still growing in absolute terms. Ericsson’s forecasts imply that the 4G peak will be reached in 2022, while the GSMA’s projections suggest this will occur in 2023.
The speed with which new mobile technologies are adopted by consumers is increasing with each successive generation. 4G penetrated the mobile base far quicker than 3G, and 5G is anticipated to be even faster. Globally, Ericsson anticipates that 5G adoption will surpass 500m connections within 2.5 years from the introduction of the technology, whereas this took 5 years for 4G (see section 5.7 for additional details and further discussion on the device ecosystem and the diffusion of 5G devices).
Presentation of demand by service category
Based on Ericsson’s forecasts, we estimate eMBB and FWA adoption rates relating to unique users (or unique premises for FWA)17. This avoids the problem of multiple SIMs generating penetration figures significantly exceeding actual adoption.
We also show usage in each category per capita, as well as per unique user, rather than on a per-SIM basis. Per-capita usage allows us more readily to gauge relative traffic intensity across mobile service categories. Showing average traffic per unique user also avoids the multi-SIM distortion problem18.
Enhanced Mobile Broadband (eMBB)
Total unique adoption (excluding FWA and IoT) is projected to grow by 4 percentage points between 2019 and 2025, reaching 77% of the global population by 2025. However, unique eMBB adoption is projected to grow by 1.7x between 2019 and 2025, approaching 90% of global mobile users (excluding FWA and IoT) by 2025. While mobile is a mature industry at the aggregate level, mobile data is clearly still in the rapid growth phase of the product lifecycle.
17 For simplicity, our estimates assume that eMBB is subject to multiple SIMs per mobile user, but FWA connections are not.
18 Clearly, a market with a higher multi-SIM ratio (due for example to a different subscriber-accounting approach) would show lower average SIM usage than an otherwise identical peer. This could distort the comparison between the two markets.
2%6%
9%
13%
16%
20%
4%
7%
15%
20%
25%
32%
0%
5%
10%
15%
20%
25%
30%
35%
2020 2021 2022 2023 2024 2025
% o
f con
nect
ions
GSMA Ericsson
The peak for global 4G adoption will be reached between 2022 and 2023.
It will take 2.5 years from the introduction of 5G to reach 500m
connections ‒ twice as fast as 4G.
In 2025, there will by 1.7x more eMBB users than in 2019, accounting
for 90% of total non-FWA users.

Mobile Services, Spectrum and Network Evolution to 2025
C:\Users\stefa\Dropbox\Projects\Huawei Spectrum Evolution Jan 2021\Deliverables\Desseminatation\Mobile Spectrum and Network Evolution to 2025 - Coleago - 24 Mar
© copyright Coleago 2021 18
Exhibit 16: Unique eMBB adoption as % global population
Source: Coleago based on Ericsson global forecasts
Growth in data adoption is compounded by strong growth eMBB usage per capita and per unique connection, driving massive increases in total network load.
Exhibit 17: eMBB usage per capita and per unique eMBB user
Source: Coleago based on Ericsson global forecasts
It is worth noting that Ericsson increased its 2025 global projection for usage per smartphone by 5GBytes between its November 2019 update and its November 2020 report ‒ a 20% increase.
Key drivers of growth in per-user eMBB traffic include:
Increases in network capacity and performance following 5G plus additional spectrum deployments, allowing for increased consumption at lower prices per GByte;
Use of eMBB as a substitute for fixed broadband, particularly in less affluent consumer segments, including younger customers living in shared accommodation; and
Increasing use of higher video quality, driving up total data use per minute of video accessed on mobile devices.
43%
51%57%
60%64%
67% 69%
73% 73% 74% 75% 76% 76% 77%
0%
10%
20%
30%
40%
50%
60%
70%
80%
90%
2019 2020 2021 2022 2023 2024 2025
% p
opul
atio
n
Unique eMBB adoption Total unique mobile, excl. FWA
4.46.4
8.811.3
14.7
18.4
22.7
1013
15
19
23
27
33
0
5
10
15
20
25
30
35
2019 2020 2021 2022 2023 2024 2025
GB
ytes
per
mon
th
eMBB usage per capita eMBB usage per unique eMBB user

Mobile Services, Spectrum and Network Evolution to 2025
C:\Users\stefa\Dropbox\Projects\Huawei Spectrum Evolution Jan 2021\Deliverables\Desseminatation\Mobile Spectrum and Network Evolution to 2025 - Coleago - 24 Mar
© copyright Coleago 2021 19
Fixed Wireless Access (FWA)
While eMBB allows fixed-broadband substitution by tethering a mobile device, FWA represents a distinct product category. An FWA connection represents a distinct subscription and is an alternative to a fixed (wired) broadband service.
Exhibit 18: FWA penetration as % global population
Source: Coleago based on Ericsson global forecasts
While FWA penetration is projected to grow by 3x over the period, driven mainly by:
Increased mobile data speeds coupled with low latencies; and
Falling prices per GByte.
Indeed, wide-band 5G deployments will make FWA increasingly competitive relative to fixed broadband alternatives, including cable and fibre broadband. According to a survey conducted by Deloitte in the US19, 63% of consumers stated that the top reason to adopt 5G is for “better connectivity inside the home”.
Nevertheless, FWA will likely still account for a small proportion of total mobile broadband connections in 2025 (1.9% penetration versus 69% for eMBB). However, one should bear in mind that fixed broadband ‒ whether it is wired or wireless‒ is typically shared between members of a household or occupants of business premises. Accordingly, the number of actual FWA users will significantly exceed the number of FWA subscriptions. Because of this, and because of the nature of fixed broadband use, traffic per FWA connection will be far higher than that per eMBB subscription (which normally serves just one individual).
19 Deloitte, 2020: https://www2.deloitte.com/us/en/insights/industry/technology/5g-cloud-gaming.html.
0.7%0.8%
1.0%
1.2%
1.4%
1.6%
1.9%
0.0%
0.2%
0.4%
0.6%
0.8%
1.0%
1.2%
1.4%
1.6%
1.8%
2.0%
2019 2020 2021 2022 2023 2024 2025
% p
opul
atio
n
For 63% of consumers, better connectivity inside the home is the
top reason to adopt 5G.

Mobile Services, Spectrum and Network Evolution to 2025
C:\Users\stefa\Dropbox\Projects\Huawei Spectrum Evolution Jan 2021\Deliverables\Desseminatation\Mobile Spectrum and Network Evolution to 2025 - Coleago - 24 Mar
© copyright Coleago 2021 20
Exhibit 19: FWA usage per capita and per connection
Source: Coleago based on Ericsson global forecasts
To put the projected FWA usage in perspective, average monthly traffic per fixed broadband connection in the UK already stood at 429 GBytes in 2020, up from 315 GBytes in the previous (pre-Covid19) year and just 240 GBytes in 201820. This entails growth in average usage of 36% in 2020, partly driven by Covid19, versus 31% in 2019.
A further reference point is the service definition in the Connect America Fund Phase II Auction (Auction 903) rural broadband funding programme. The 100 Mbit/s broadband service must include a 2 Terabyte monthly usage allowance.
To the extent mobile FWA can approach the performance of fixed broadband ‒ which 5G certainly should‒ an 18% CAGR in average global FWA usage per connection (as implied by Ericsson’s projections) certainly seems plausible: when given high speeds with generous data allowances at affordable prices, consumers invariably find ways to utilise them.
The disproportionately high unit traffic results in total global FWA usage reaching 28% of total eMBB traffic ‒ despite FWA adoption levels reaching less than 3% of unique eMBB penetration.
2.2.2 The Internet of Things (IoT)
5G enables the Internet of Things (IoT) with Massive Machine Type Communications (mMTC) as well as Critical MTC, which relies on Ultra Reliable and Low Latency Communications (uRLLC). With this capability 5G is an enabling platform for what has been described as the “4th industrial revolution”21.
The majority of IoT devices will continue to rely on Wi-Fi and/or tethered mobile for connectivity. (Note that while tethered mobile devices will drive overall network traffic, this is already accounted for under the eMBB usage forecasts). Nevertheless, as outlined in Section 2.1 above, a growing proportion of IoT devices will have embedded cellular connectivity ‒ around 5.1 billion in 2025, according to Ericsson, accounting for a fifth of all connected machines.
To give a sense of scale, Ericsson’s projections are shown below as a % of global population. The Massive IoT curve corresponds with cat-M and NB-IoT devices, which
20 Ofcom Connected Nations 2020 UK Report, December 2020. The average usage spans copper DSL, cable and fibre broadband connections.
21 Klaus Schwab, The Fourth Industrial Revolution, Magazine of Foreign Affairs, 12 Dec 2015.
0.8 1.21.8
2.6
3.7
5.1
6.4
124151
183
222
267
311337
0
50
100
150
200
250
300
350
400
0
1
2
3
4
5
6
7
8
2019 2020 2021 2022 2023 2024 2025
GB
ytes per month per connectionG
Byt
es p
er m
onth
per
cap
ita
FWA usage per capita FWA usage per connection
The rural broadband funding programme in the US specifies a
usage allowance of 2TB per month for the 100Mbit/s service.

Mobile Services, Spectrum and Network Evolution to 2025
C:\Users\stefa\Dropbox\Projects\Huawei Spectrum Evolution Jan 2021\Deliverables\Desseminatation\Mobile Spectrum and Network Evolution to 2025 - Coleago - 24 Mar
© copyright Coleago 2021 21
have a smooth evolution path to 5G. By 2025, these will account for around 40% of all cellular IoT devices. The broadband (BB) and Critical IoT curve in Exhibit 20 represents 4G and 5G devices. According to Ericsson, the majority of these will be served by 4G. ‘Legacy’ refers to 2G and 3G devices, which are decreasing in absolute terms.
Exhibit 20: Cellular IoT devices as % global population
Source: Coleago based on Ericsson global forecasts
While the number of 4/5G cellular IoT devices is expected to approach the number of unique eMBB subscribers worldwide, the total traffic contribution from these is expected to remain small. The GSMA estimates that IoT connectivity will account for around 5% of total mobile industry revenues in 2025. Assuming that the contribution to traffic is broadly aligned with revenues, we obtain the following global traffic estimates.
Exhibit 21: Cellular IoT traffic per capita and per device
Source: Coleago based on Ericsson and GSMA data
The average consumption per device obtained above belies huge dispersion in actual usage rates ‒ with multitude trackers and sensors transmitting very small amounts of data, and a minority of cellular IoT devices accounting for the bulk of the IoT total.
While IoT’s contribution to total mobile traffic may remain comparatively low, it is worth noting that connected video cameras (e.g. bodycams, mobile-connected CCTV and
8%11%
18%
24%33%
45%
55%
19%22%
28%
35%
44%
55%
64%
0%
10%
20%
30%
40%
50%
60%
70%
2019 2020 2021 2022 2023 2024 2025
As
% g
loba
l pop
ulat
ion
Massive MTC BB and Critical MTC
Total excluding legacy Total including legacy
0.1 0.3
0.5
0.9
1.4
0.20.3
0.6
0.8
1.2
1.7
2.3
0.0
0.5
1.0
1.5
2.0
2.5
2019 2020 2021 2022 2023 2024 2025
GB
ytes
per
mon
th
IoT traffic per capita IoT traffic per device

Mobile Services, Spectrum and Network Evolution to 2025
C:\Users\stefa\Dropbox\Projects\Huawei Spectrum Evolution Jan 2021\Deliverables\Desseminatation\Mobile Spectrum and Network Evolution to 2025 - Coleago - 24 Mar
© copyright Coleago 2021 22
car-cams) generate uplink traffic. Accordingly, these could make efficient use of underutilised FDD-uplink resources.
2.2.3 Contributions to total mobile data traffic
Based on the above, and including Ericsson’s view on 5G traffic evolution, we obtain the following projections for aggregate mobile traffic per capita.
Exhibit 22: Total global mobile and 5G traffic per capita
Source: Coleago based on Ericsson global forecasts, including IoT traffic
Note: the vast bulk of global legacy traffic by 2025 will be 4G. While 5G traffic will grow faster over the period, there is still considerable growth left in 4G, implying a need to expand 4G capacity significantly in most markets worldwide.
Exhibit 23: Mobile traffic contributions by service category
Source: Coleago based on Ericsson and GSMA data
2.2.4 Peak legacy-traffic point
Ericsson’s forecasts suggest that global 5G traffic will approach 50% of total mobile in 2025, with legacy data-traffic likely reaching its absolute peak in 2027. According to these projections, legacy data traffic will more than double between 2020 and 2025.
This would mean that in 2025, capacity from legacy technologies (such as 4G) would need to be twice that utilised by global networks today. Expanding 4G capacity to such
5.37.6 9.6 11.2 13.5 15.3 16.30.1
1.23.0
5.5
9.0
14.3
5.37.7
10.8
14.2
18.9
24.4
30.6
0.0
5.0
10.0
15.0
20.0
25.0
30.0
35.0
2019 2020 2021 2022 2023 2024 2025
GB
ytes
per
mon
th
Total legacy traffic per capita total 5G per capita
88% 88% 85% 81% 78% 76% 75%
11% 11% 14% 17% 19% 20% 20%
3% 4% 5%
0%
10%
20%
30%
40%
50%
60%
70%
80%
90%
100%
2019 2020 2021 2022 2023 2024 2025
% eMBB % FWA % IoT
Ericsson’s forecasts imply that in 2025, twice as much capacity from legacy technologies will be needed
than utilised today.

Mobile Services, Spectrum and Network Evolution to 2025
C:\Users\stefa\Dropbox\Projects\Huawei Spectrum Evolution Jan 2021\Deliverables\Desseminatation\Mobile Spectrum and Network Evolution to 2025 - Coleago - 24 Mar
© copyright Coleago 2021 23
a degree in the 5G era is clearly undesirable ‒ albeit the associated investment should support a smooth transition to 5G, since 5G equipment also supports 4G. Once the peak legacy-traffic point is reached, Dynamic Spectrum Sharing (DSS) can be used to progressively shift available 4G capacity to 5G ‒ enabling a gradual migration of traffic across technologies (see section 3.6 for a further discussion on managing the transition from 4G to 5G).
Ericsson’s traffic and 5G adoption forecasts (see Exhibit 66 in section 5.7 for additional details) also imply that global average 5G usage per 5G connection will be 1.9x higher than average legacy traffic per legacy connection in 2025, which seems reasonable. Higher 5G-to-legacy ratios are observed in some markets today, as shown below.
In November 2019, in Korea, 5G already accounted for 21% of total mobile traffic from just 6.8% of connections22. This implies a ratio of 5G Average Usage per User (AUPU) to legacy AUPU of well over 3x.
Exhibit 24: 5G versus legacy AUPU in Korea (2019)
Source: MSIT, Strategy Analytics
The high relative AUPU, shortly after the introduction of 5G, will likely reflect the fact that early 5G adopters are likely to include heavier data users. In addition, 5G users are likely to be less constrained by congestion than legacy-technology users, and a better experience stimulated consumption.
Over time, however, the 5G-to-legacy AUPU multiple may drop, as later adopters upgrade their devices and data-plans. By September 2020, the 5G-to-4G AUPU multiple estimated by OpenSignal for Korea dropped to 2x ‒ from over 2.5x in December 2019, according to MSIT/Strategy Analytics estimates.
22 Tweet by Phil Kendal of Strategy Analytics, 31 January 2021; see https://www.lightreading.com/5g/5g-now-carrying-21-- of-all-mobile-traffic-in-south-korea/d/d-id/757235.

Mobile Services, Spectrum and Network Evolution to 2025
C:\Users\stefa\Dropbox\Projects\Huawei Spectrum Evolution Jan 2021\Deliverables\Desseminatation\Mobile Spectrum and Network Evolution to 2025 - Coleago - 24 Mar
© copyright Coleago 2021 24
Exhibit 25: 5G versus legacy AUPU (GBytes/month, September 2020)
Source: OpenSignal
Higher 5G-to-legacy AUPU ratios might be expected in emerging markets, where FWA may be more prominent and where the 5G base is likely to concentrate the more affluent customers (who may be heavier data users) ‒ albeit 5G consumption may initially be hampered by limited coverage. Over time, however, there should be limited fall-back to 4G from 5G devices.
Finally, the higher mobile performance achievable with 5G enables services and applications that would be comparably unattractive over 4G, such as advanced cloud gaming, immersive video and fibre-like broadband substitution. By 2025, these could significantly boost 5G versus legacy AUPU.
Taking all the preceding factors into account, Ericsson’s forecast 5G-to-legacy AUPU ratio of 1.9x in 2025 seems entirely plausible.
In the next section, we consider both the technology split and its implications for peak legacy-traffic on a regional basis.
2.3 Technology split by region
The 2020 Ericsson Mobility Report provides the following breakdown of subscriptions by technology. Clearly, the levels of 5G adoption in developed markets in 2026 (and 2025) will be far higher than the global average, and so too will be the levels of 5G traffic.

Mobile Services, Spectrum and Network Evolution to 2025
C:\Users\stefa\Dropbox\Projects\Huawei Spectrum Evolution Jan 2021\Deliverables\Desseminatation\Mobile Spectrum and Network Evolution to 2025 - Coleago - 24 Mar
© copyright Coleago 2021 25
Exhibit 26: Breakdown of mobile subscriptions by technology
Source: Ericsson Mobility report, November 2020
Peak legacy-traffic points
Taking Ericsson’s forecasts as a basis23, we estimate through interpolation that the peak legacy-traffic points would likely occur in:
2022 for North America;
2023 for Western Europe;
2024 for North-East Asia; and
After 2026 in all other regions.
2.4 Demand for mobile network capacity in 2025
2.4.1 Mobile data consumption by region
Global mobile broadband traffic grew by 88% in 2018, 49% in 2019 and an estimated 53% in 202024. Key drivers of this observed explosion in usage include both increased smartphone adoption and increased data usage per smartphone.
Exhibit 27 shows regional forecasts of average monthly traffic per capita between 2019 and 2025, based on GSMA data. We also show scaled 2025 usage levels, which assume that the GSMA is correct on relative usage by region, but that the actual global average is as per Ericsson’s figure of 29 GBytes per capita per month.
23 This includes the ratio of 5G to 4G usage per connection implied by Ericsson’s forecasts, which we have applied equally across all regions for simplicity.
24 Ericsson Mobility Reports: Q4 2018, Q4 update 2019 and November 2020
Depending on the country, GSMA projects mobile data traffic between 3
to 7 times 2020 levels. Ericsson is even more bullish globally, yet even
its forecast may be conservative.
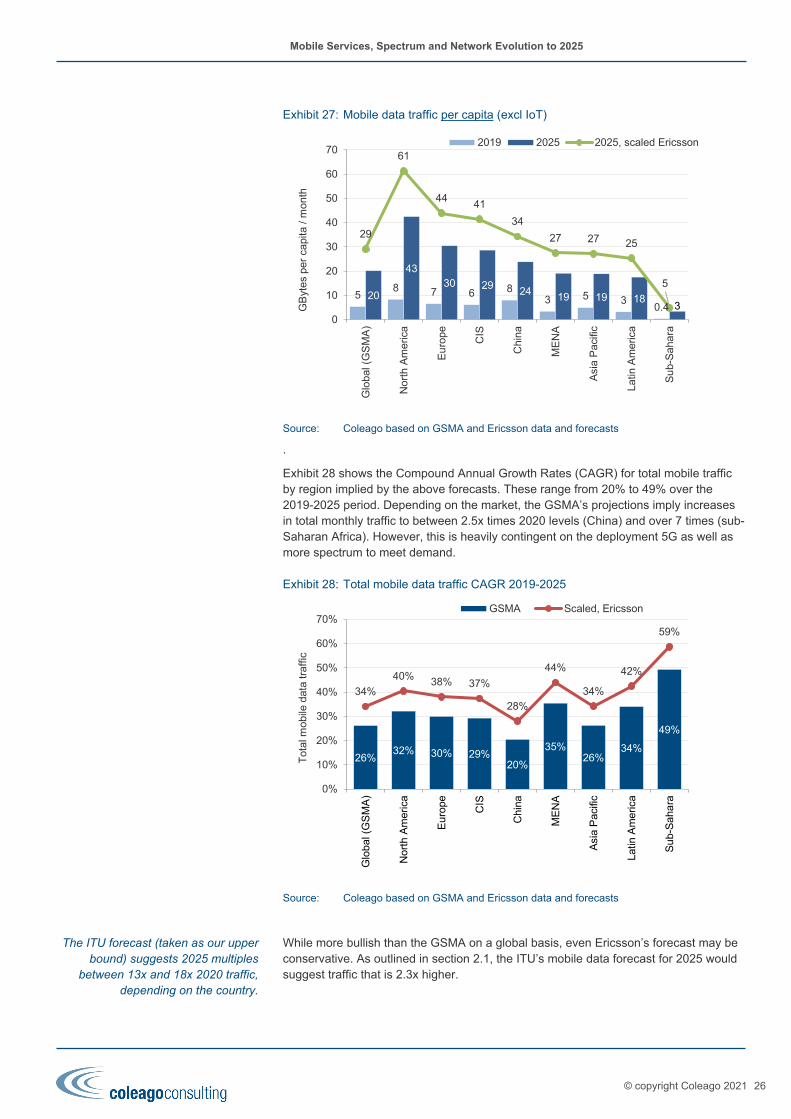
Mobile Services, Spectrum and Network Evolution to 2025
C:\Users\stefa\Dropbox\Projects\Huawei Spectrum Evolution Jan 2021\Deliverables\Desseminatation\Mobile Spectrum and Network Evolution to 2025 - Coleago - 24 Mar
© copyright Coleago 2021 26
Exhibit 27: Mobile data traffic per capita (excl IoT)
Source: Coleago based on GSMA and Ericsson data and forecasts
.
Exhibit 28 shows the Compound Annual Growth Rates (CAGR) for total mobile traffic by region implied by the above forecasts. These range from 20% to 49% over the 2019-2025 period. Depending on the market, the GSMA’s projections imply increases in total monthly traffic to between 2.5x times 2020 levels (China) and over 7 times (sub-Saharan Africa). However, this is heavily contingent on the deployment 5G as well as more spectrum to meet demand.
Exhibit 28: Total mobile data traffic CAGR 2019-2025
Source: Coleago based on GSMA and Ericsson data and forecasts
While more bullish than the GSMA on a global basis, even Ericsson’s forecast may be conservative. As outlined in section 2.1, the ITU’s mobile data forecast for 2025 would suggest traffic that is 2.3x higher.
58 7 6 8
3 5 30.4
20
4330 29
24 19 19 183
29
61
4441
34
27 27 25
5
0
10
20
30
40
50
60
70
Glo
bal (
GS
MA
)
Nor
th A
mer
ica
Eu
rope
CIS
Chi
na
ME
NA
Asi
a P
acifi
c
Latin
Am
eric
a
Su
b-S
aha
ra
GB
ytes
per
cap
ita /
mon
th
2019 2025 2025, scaled Ericsson
26%32% 30% 29%
20%
35%26%
34%
49%
34%
40% 38% 37%
28%
44%
34%
42%
59%
0%
10%
20%
30%
40%
50%
60%
70%
Glo
bal (
GS
MA
)
Nor
th A
mer
ica
Eu
rope CIS
Chi
na
ME
NA
Asi
a P
acifi
c
Latin
Am
eric
a
Su
b-S
aha
ra
Tot
al m
obile
dat
a tr
affic
GSMA Scaled, Ericsson
The ITU forecast (taken as our upper bound) suggests 2025 multiples
between 13x and 18x 2020 traffic, depending on the country.

Mobile Services, Spectrum and Network Evolution to 2025
C:\Users\stefa\Dropbox\Projects\Huawei Spectrum Evolution Jan 2021\Deliverables\Desseminatation\Mobile Spectrum and Network Evolution to 2025 - Coleago - 24 Mar
© copyright Coleago 2021 27
Scaling the regional projections on the basis of Ericsson’s global forecast implies 2025 traffic in China will be 3.4x the levels in 2020, and a 10x multiple for sub-Saharan Africa;
The ITU forecast (taken as out upper bound) would suggest multiples of 13.5x for China and and 18x for sub-Saharan Africa.
2.4.2 Impact of data speed targets
The growth in total data traffic highlighted above indicates the minimum by which mobile network capacity needs to grow to meet demand on a ‘best effort’ basis. By best effort, we mean delivery of a given quantity of GBytes during the busy hour without regard to data-speed experience requirements. Ericsson’s global view (4x higher global traffic in 2025 than in 2020) means that without any speed-experience target, network capacity would need to be 4x greater in 2025 than utilised today25.
In addition to higher volumes of data however, customers are increasingly demanding higher performance ‒ in terms of experienced data speeds as well as latency for time-critical applications. If operators shift to selling speeds, then they need to deliver data speeds consistently ‒ and they need to dimension their networks accordingly.
Data-speed experience targets have a substantial incremental impact on demand for network capacity. Carrying a given total amount of GBytes in a cell during the busy hour is one thing. Transmitting the same quantity at a consistently high speed to all users is another: twice as much capacity is needed to deliver 100MB each to two users in the same second than one second apart. Dimensioning for speed (instead of just for total GBytes over a period) requires a statistical approach26.
As shown in Exhibit 29 below, a 100Mbit/s data-speed experience target for all users (with 99% busy-hour probability27) entails a design load in Mbits/s within any part of the network that may be 1.5-3.7x higher than the requirement for simple ‘best-effort’ provision. The site design load represents the amount of capacity that the site is designed to deliver.
We find that an existing site serving 250 GBytes in the busy hour on a best-efforts’ basis in 2020 would need 8x the capacity to deliver a 4-fold growth in total traffic, with a 100Mbits/s speed-experience with 99% probability. This represents almost an order of magnitude increase.
25 Assuming that the busy-hour traffic parameters and distribution across sites remains the same, which would seem plausible.
26 The calculations are similar to those used in the 2G circuit voice era. For a given total amount of site traffic in the busy hour, the lower the specified ‘failure rate’ (akin to the ‘blocking rate’), the higher the required site capacity.
27 The 99% ‘busy-hour probability’ means that there is a 1% chance that a user will obtain speeds below 100Mbps under the specified busy-hour network loading. Heavier than normal busy hour traffic in the cell would lead to a higher ‘failure’ rate.
To deliver 4x more traffic with a 100Mbit/s speed target with 99%
probability, a site may require 8x its current capacity in 2025.

Mobile Services, Spectrum and Network Evolution to 2025
C:\Users\stefa\Dropbox\Projects\Huawei Spectrum Evolution Jan 2021\Deliverables\Desseminatation\Mobile Spectrum and Network Evolution to 2025 - Coleago - 24 Mar
© copyright Coleago 2021 28
Exhibit 29: Impact of speed targets on the site design load (capacity need)
Source: Coleago
2.4.3 Capacity requirements by region
Calculating the impact of speed targets on total extra capacity needed across the network is a complicated affair. The relative increase in capacity requirement will be lower in busy parts of the network, with a higher proportional step-change for less busy sites.
In our illustrative estimates of capacity needs on a regional basis, we have assumed that a data speed-experience target of 100Mbit/s with 99% probability leads on average to a doubling of the design load across the network.
In Exhibit 30 below, we show the resulting capacity multiple (2025 requirement versus utilisation in 2020) based on GSMA regional traffic forecasts, and the same scaled on the basis of the ITU’s global forecast. As evidenced in the graph, this yields a very wide range between the GSMA best-effort lower bound and the ITU upper-bound with speed target. Adding the speed target to Ericsson’s forecasts (not shown in the graph) would yield results that are slightly higher than those implied by the ITU forecast on a best-effort basis.
If the ITU is correct about the global traffic in 2025 and the GSMA is correct about relative variations across the regions, we obtain an 18x capacity multiple in Sub-Saharan Africa assuming network dimensioning for ‘best effort’ supply. Delivering the implied increase would certainly present substantial challenges for operators.
If we add the data-speed target specified in the ITU’s IMT 2020 requirements, capacity need grows to a staggering 35x the amount currently in use. This would call for massive allocations of additional spectrum and huge investments. It seems fair to question whether the Sub-Sharan economy would be able to support these.
0
2,000
4,000
6,000
8,000
10,000
12,000
0 500 1,000 1,500 2,000 2,500 3,000 3,500
Site
des
ign
load
in M
bits
/s
Site traffic in Busy Hour (GBytes/Site/hour)
100Mbps, 99% probability 100Mbps, 95% probability50Mbps speed target 20Mbps speed targetBest effort
3.7x best effort
1.5x best effort
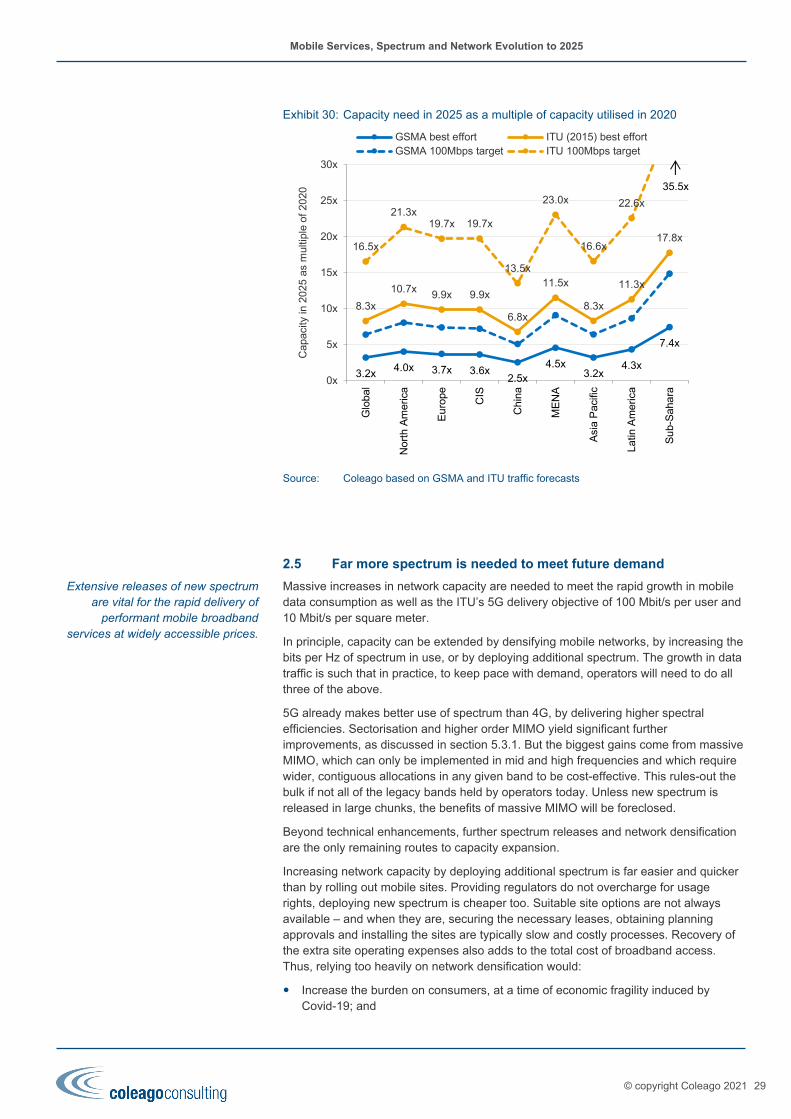
Mobile Services, Spectrum and Network Evolution to 2025
C:\Users\stefa\Dropbox\Projects\Huawei Spectrum Evolution Jan 2021\Deliverables\Desseminatation\Mobile Spectrum and Network Evolution to 2025 - Coleago - 24 Mar
© copyright Coleago 2021 29
Exhibit 30: Capacity need in 2025 as a multiple of capacity utilised in 2020
Source: Coleago based on GSMA and ITU traffic forecasts
2.5 Far more spectrum is needed to meet future demand
Massive increases in network capacity are needed to meet the rapid growth in mobile data consumption as well as the ITU’s 5G delivery objective of 100 Mbit/s per user and 10 Mbit/s per square meter.
In principle, capacity can be extended by densifying mobile networks, by increasing the bits per Hz of spectrum in use, or by deploying additional spectrum. The growth in data traffic is such that in practice, to keep pace with demand, operators will need to do all three of the above.
5G already makes better use of spectrum than 4G, by delivering higher spectral efficiencies. Sectorisation and higher order MIMO yield significant further improvements, as discussed in section 5.3.1. But the biggest gains come from massive MIMO, which can only be implemented in mid and high frequencies and which require wider, contiguous allocations in any given band to be cost-effective. This rules-out the bulk if not all of the legacy bands held by operators today. Unless new spectrum is released in large chunks, the benefits of massive MIMO will be foreclosed.
Beyond technical enhancements, further spectrum releases and network densification are the only remaining routes to capacity expansion.
Increasing network capacity by deploying additional spectrum is far easier and quicker than by rolling out mobile sites. Providing regulators do not overcharge for usage rights, deploying new spectrum is cheaper too. Suitable site options are not always available ‒ and when they are, securing the necessary leases, obtaining planning approvals and installing the sites are typically slow and costly processes. Recovery of the extra site operating expenses also adds to the total cost of broadband access. Thus, relying too heavily on network densification would:
Increase the burden on consumers, at a time of economic fragility induced by Covid-19; and
3.2x4.0x 3.7x 3.6x
2.5x4.5x
3.2x4.3x
7.4x
8.3x
10.7x 9.9x 9.9x
6.8x
11.5x
8.3x
11.3x
17.8x16.5x
21.3x19.7x 19.7x
13.5x
23.0x
16.6x
22.6x
0x
5x
10x
15x
20x
25x
30x
Glo
bal
Nor
th A
mer
ica
Eu
rope CIS
Chi
na
ME
NA
Asi
a P
acifi
c
Latin
Am
eric
a
Su
b-S
aha
ra
Cap
acity
in 2
025
as m
ultip
le o
f 20
20
GSMA best effort ITU (2015) best effortGSMA 100Mbps target ITU 100Mbps target
35.5x
Extensive releases of new spectrum are vital for the rapid delivery of
performant mobile broadband services at widely accessible prices.
Mobile Services, Spectrum and Network Evolution to 2025
C:\Users\stefa\Dropbox\Projects\Huawei Spectrum Evolution Jan 2021\Deliverables\Desseminatation\Mobile Spectrum and Network Evolution to 2025 - Coleago - 24 Mar
© copyright Coleago 2021 30
Unduly delay and constrain mobile development, with adverse socio-economic consequences (see section 4).
In short, extensive releases of new spectrum are vital for the rapid delivery of performant mobile broadband services at widely accessible prices. However, simply increasing the total MHz of available mobile bandwidth will not be sufficient: MNOs need the right mix of low-, mid- and high-band spectrum to keep pace with demand across their entire networks. Estimates of the spectrum requirements of the mobile industry are provided in section 6.3 for a sample of developed and emerging markets.

Mobile Services, Spectrum and Network Evolution to 2025
C:\Users\stefa\Dropbox\Projects\Huawei Spectrum Evolution Jan 2021\Deliverables\Desseminatation\Mobile Spectrum and Network Evolution to 2025 - Coleago - 24 Mar
© copyright Coleago 2021 31
3. The business case for 5G 5G will have a deep impact on society as well as on the mobile industry. In this section, we focus on the operators’ perspective, while the socio-economic implications are discussed in section 4.
We start with a review of mobile market-returns trends during the past decade and gauge the current state of the industry. Next, we focus on 5G investment requirements, the prospects for revenue growth, and what is needed to create a positive 5G case for operators on aggregate. Finally, we examine issues relating to the transition from 4G to 5G.
3.1 Current state of the industry
The 5G investment requirements come at a stage of the mobile industry lifecycle in which revenues are declining in the majority of markets, in real if not in nominal terms.
In mid 2020, Bank of America Merrill Lynch observed that:
“Globally, average mobile service revenue increased +0.5% year on year. Developed markets growth of 1.3% was ahead of Emerging markets at -0.4%. In Developed markets, North America led with growth of 2.6% year on year followed by Developed EMEA at +0.3% and Asia-Pacific at -0.6% year on year. In Emerging markets service revenue growth was led by a 0.4% year-on-year increase in Emerging Asia, followed by -0.3% year on year in EEMEA and -5.7% year on year in Latin America”.28
Adjusting for inflation, this entails a global decline of -2.7% in real terms. The majority of markets experienced declines in nominal terms, with North America the only region showing growth in real terms (around 1%).
The graph below shows the declining trend in real mobile market revenues over the past decade29. The values represent real-term revenues as a % of 2010 results.
Exhibit 31: Mobile market revenue indices (in real terms, median values)
Source: Coleago based on data from Bank of America Merrill Lynch
28 Bank of America Merrill Lynch, Global Wireless Matrix, 14 July 2020. 29 Median of index values, based on data and projections from Bank of America Merrill Lynch
Global Wireless Matrix 30 April 2019. Contains estimates for 2018 and 2019. The grouping of countries by income levels follows the World Bank’s definition, applied to forecast 2020 GDP per capita. The sample contains 8 markets in the low and lower-middle income group (below $3,995 per capita), 10 in the upper-medium group ($3,995 to $12,376 per capita) and 32 markets in the high-income group (above $12,376 per capita).
0%
20%
40%
60%
80%
100%
120%
140%
2010 2011 2012 2013 2014 2015 2016 2017 2018 2019
2010
= 1
00%
Low and lower-middle income marketsUpper-middle income marketsHigh income markets
5G investments come at a stage when mobile revenues in most
markets are declining in real terms.

Mobile Services, Spectrum and Network Evolution to 2025
C:\Users\stefa\Dropbox\Projects\Huawei Spectrum Evolution Jan 2021\Deliverables\Desseminatation\Mobile Spectrum and Network Evolution to 2025 - Coleago - 24 Mar
© copyright Coleago 2021 32
In some individual markets, revenues declined markedly, driven by competition. India is an extreme example of this, where revenues declined by 14% in 2017. In all three income groups, real 2019 revenues were below 2017 levels.
This overall decline is even sharper for free cash flows. Increasing capex (relative to sales) over the past decade has added to pressure on returns. The evolution of earnings before interest, tax, depreciation and amortisation (EBITDA) minus capex as a % of service revenues ‒ an approximation for free cash flow margin‒ is shown below.
Exhibit 32: EBITDA minus Capex as % service revenues (median values)
Source: Coleago based on data from Bank of America Merrill Lynch
Declining revenues in real terms coupled with a general erosion in margins (especially for lower income markets) results in a marked deterioration in industry returns.
This might not be an issue if the industry were previously enjoying super-normal returns and if the decline was simply bringing these in line with the cost of capital. However, a review of recent Returns on Invested Capital (ROIC) across a sample of operators is indicative of an industry under pressure.
Exhibit 33: Returns (ROIC) versus cost of capital (WACC)
Source: Coleago based on data from gurufocus.com
0%
5%
10%
15%
20%
25%
30%
35%
2010 2011 2012 2013 2014 2015 2016 2017 2018 2019
% o
f ser
vice
rev
enue
s
Low and lower-middle income marketsUpper-middle income marketsHigh income markets
-20%
-15%
-10%
-5%
0%
5%
10%
15%
Vo
dafo
ne G
roup
MT
N
Am
eric
a M
ovil
Bh
arti
Cel
lula
r
Vo
dafo
ne-I
dea
Tel
efon
ica
Ve
rizon
T-M
obi
le U
SA
Deu
tsch
e T
elec
om
Vo
daco
m
Med
ian
ROIC WACC ROIC minus WACC
Most operators in our sample are achieving returns that are lower than
their cost of capital. This is unsustainable in the long run.

Mobile Services, Spectrum and Network Evolution to 2025
C:\Users\stefa\Dropbox\Projects\Huawei Spectrum Evolution Jan 2021\Deliverables\Desseminatation\Mobile Spectrum and Network Evolution to 2025 - Coleago - 24 Mar
© copyright Coleago 2021 33
Only 4 out of the 10 operators in our sample are currently earning their cost of capital. These are mostly leading players, with strong positions within their key markets. Accordingly, these are not representative of the industry as a whole. The situation for later entrants (the market challengers) will likely be worse, hence blended industry ROIC in most markets may be lower than suggested by the results in Exhibit 33.
A ROIC consistently below the weighted cost of capital (WACC) indicates that investors can obtain better risk-adjusted returns by placing their capital elsewhere. This is not sustainable in the long run. If there are no reasonable expectations for future earnings in line with the cost of capital, investment in mobile networks will decrease and further market consolidation becomes a necessity.
The sustainability of the industry in its current form hinges on whether 5G will allow industry to buck this downward historical trend and cover the heavy investments that lie ahead.
3.2 5G investment requirements
To cater for the explosive growth in data consumption, operators are continuing to invest large sums in 4G and 5G radio access networks and backhaul infrastructure. The GSMA projects cumulative world-wide investment by mobile operators between 2020 and 2025 to reach $1.1 trillion, almost 80% of which will be in 5G. This would yield an average exceeding 17% of annual mobile revenues during the period.
Exhibit 34: Cumulative capex by region 2020-2025 (in $ millions)
Source: GSMA, The Mobile Economy in 2020
The vast majority of this investment is in the radio access network (RAN), notably cell sites, 4G / 5G radios, and backhaul. Investment in 5G is already under way, even in markets where the launch of 5G will take place a little later. Most 4G RAN investment currently taking place is software upgradable to 5G. Preparing for the launch of 5G, several operators started to deploy Massive MIMO in combination with three-carrier aggregation, delivering Gbit/s speed capabilities.
2019 saw the first launches of standards based 5G. However, the transition to 5G requires further significant infrastructure investment. Deutsche Telekom CEO
Average annual mobile capex between 2020 and 2025 is projected
to exceed 17% of annual mobile revenues.
Mobile Services, Spectrum and Network Evolution to 2025
C:\Users\stefa\Dropbox\Projects\Huawei Spectrum Evolution Jan 2021\Deliverables\Desseminatation\Mobile Spectrum and Network Evolution to 2025 - Coleago - 24 Mar
© copyright Coleago 2021 34
Timotheus Hoettges estimated the cost of providing 5G networks in Europe at € 300-500 billion (US$487.2 - US$811.9 billion), while Sprint’s CEO Marcelo Claure stated at the 2019 Mobile World Congress that US operators will invest US$275 billion in their networks.
In the 5G era, networks are anticipated to have many more small-cell sites, because much of the 5G traffic will be carried on higher frequencies which have a shorter range. According to some estimates, the number of small-cell sites required could be between 3x and 10x the total current outdoor site count, not including indoor coverage solutions30.
The deployment of many thousands of 5G cells, for example on street furniture, requires an unprecedented investment in fibre and will push up network operating costs. A calculation by The Fiber Broadband Association of the US illustrates the size of the required investment: In an urban environment it will take eight miles of fibre cable per square mile to connect small cells. The largest 25 metro areas in the US cover 173,852 square miles which means that to provide 5G coverage will require around 1.4 million miles of fibre cable. Validating this analysis, Verizon stated in a press release in April 2017 that it will purchase from Corning up to 20 million kilometres (12.4 million miles) of optical fibre each year from 2018 through 2020, with a minimum purchase commitment of $1.05 billion.
On top of the huge network capital expenditure, operators need to acquire new spectrum below 1GHz, in the 2GHz-4GHz range and in mmWave bands within the next 5 years. Subject to the public policies pursued in individual markets, total costs of spectrum ownership could represent a significant proportion of overall network investment and opex.
On the positive side, operators will find some savings as they move to virtualised networks and increased infrastructure sharing. However, operating a mobile network with a factor increase in the number of cell sites remains a major network operating-cost challenge.
3.3 Future industry revenue prospects
Heavy investments against a historic backdrop of declining returns would normally make for a challenging business case. The key question is whether 5G will transform the industry’s prospects for revenue generation, in a way that 4G did not.
The GSMA’s own projections suggest moderate nominal growth in global mobile revenues between 2020 and 2025, but a (slower) continuation of the general historical decline in real terms:
Nominal revenues: 1.5% CAGR for developing markets, 1% for developed countries, and 1.2% global ‒ all below inflation, and significantly below GDP growth;
Real global revenue CAGR: -0.4%.
30 For example, Frontier Economics indicates a total need of 300,000 small-cell sites in the UK, roughly 10x the current aggregate site count. See Future Telecoms Infrastructure Review – Published by Department for Culture, Media and Sport (DCMS), July 2018.
Heavy investments against a historic backdrop of declining returns would
normally be harder to justify.

Mobile Services, Spectrum and Network Evolution to 2025
C:\Users\stefa\Dropbox\Projects\Huawei Spectrum Evolution Jan 2021\Deliverables\Desseminatation\Mobile Spectrum and Network Evolution to 2025 - Coleago - 24 Mar
© copyright Coleago 2021 35
Exhibit 35: Global mobile revenue evolution (GSMA projections)
Source: Coleago based on GSMA and IMF data
We would agree that a degree of caution is warranted, and that regulators need to be mindful not to increase the financial burden on operators (see sections 4.4, 7.1 and 7.3). Nevertheless, we believe that there are several areas of potential revenue growth that may offset increases in network costs.
3.3.1 Potential revenue-growth areas
A resumption of real-term growth in the 5G era could potentially be driven by one or more of the following:
Increased adoption and/or consumer willingness to pay for enhanced mobile broadband (eMBB) services;
Future growth in Fixed Wireless broadband Access (FWA);
New IoT revenue streams;
New Enterprise solutions;
Increasing prevalence of Quality of Service-based pricing.
We examine each of these in turn below. Note that we do not consider the sale of content itself as a major potential source of revenue growth, on the basis that mobile consumers can generally purchase digital content directly from content providers. It seems unlikely that mobile operators can generate significant margins from the sale of content, unless they have some form of exclusivity, which would normally be value-destructive31.
31 In the early 3G-era, European operators tried to pursue exclusive content deals, without success ‒ not least because these would be deeply inefficient. From a content-provider’s viewpoint, restricting access to a single operator’s customer base would be singularly unattractive. Operators would need to pay a large premium for any such exclusivity, to make it worthwhile to content providers, while only being able to sell it to a fraction of the market.
92%
94%
96%
98%
100%
102%
104%
106%
108%
110%
2020 2021 2022 2023 2024 2025
Inde
x (2
020
= 1
00%
)
Developed markets, nominal Developing markets, nominalGlobal, nominal Global, real
1.2% nominal growth per yearversus 6.2% nominal GDP growth (IMF)
-0.4% real decline per yearversus 4.1% real GDP growth

Mobile Services, Spectrum and Network Evolution to 2025
C:\Users\stefa\Dropbox\Projects\Huawei Spectrum Evolution Jan 2021\Deliverables\Desseminatation\Mobile Spectrum and Network Evolution to 2025 - Coleago - 24 Mar
© copyright Coleago 2021 36
3.3.2 5G revenue prospects from eMBB
Enhanced mobile broadband use will likely account for the vast majority of mobile data traffic. But will consumers pay more for this? History suggests that increased mobile consumption often correlates with decreasing unit prices, hence does not necessarily drive higher industry revenues. Nevertheless, there are indications of increased willingness to spend for 5G services.
The GSMA Intelligence Consumer Insights Survey 2019 indicates that a majority of early adopters in all regions may be willing to pay a premium for 5G. Globally, 41% of respondents who intended to upgrade would be willing to pay up to 10% more then currently, and a further 14% would be willing to pay up to 20% more.
Notwithstanding this, we would question whether a premium for 5G ‘in-itself’ can be sustained as the technology matures. Operators have an incentive to quickly drive users to the more efficient technology, to allow more rapid re-farming of legacy bands to 5G. Maintaining a premium for mere technology adoption would run counter to this. Furthermore, the GSMA’s own global projections do not appear to reflect any significant upward inflection in the revenue trend.
Indeed, most operators did not gain additional revenue from 4G compared to 3G. For example, when Vodafone India launched 4G, customers with 4G devices and a 4G SIM received 2 GBytes of data for the same price that 3G customers pay for only 1 GByte of data. Vodafone’s revenue did not increase but as a result of Vodafone’s investment in 4G customers see a 50% reduction in the price per GByte of mobile data. Globally, as discussed in section 3.1, median industry revenues fell in real terms between 2010 and 2020, while data traffic grew by an order of magnitude.
A similar trend can be observed for 5G vs. 4G tariff plans. The evidence available so far shows that some operators attempted to launch 5G at premium price, but quickly abandoned this. Prices for 5G packages are not only not higher than for 4G, but also offer larger data volumes and of course high download speeds. In April 2019, mobile operators in Korea announced tariffs for 5G mobile. Depending on the tariff plan, 5G prices were already cheaper in some instances than 4G plans. In early 2019 AT&T in the USA announced a 5G plan at rate of US$ 4.67 per GByte compared to US$ 5 per GByte for 4G.
Exhibit 36: 5G vs. 4G data pricing in Korea, shortly after the launch of 5G
Package Type
5G 4G
Tariff KRW
Data pack
Limit after out of pack
Tariff KRW
Data pack
Limit after out of pack
LGU+ Entrance 55,000 9GB 1Mbps 55,900 6.6GB 3Mbps
Middle 75,000 150GB 5Mbps 74,800 16GB 3Mbps
High 85,000 Unlimited Unlimited 88,000 30GB 3Mbps
Premium 95,000 Unlimited Unlimited 110,000 40GB 3Mbps
SKT Entrance 55,000 8GB 1Mbps 50,000 4GB 5Mbps
Middle 75,000 150GB 5Mbps 69,000 100GB 5Mbps
High 95,000 Unlimited Unlimited 79,000 150GB 5Mbps
Premium 125,000 Unlimited Unlimited 100,000 Unlimit. n/a
KT Entrance 55,000 8GB 1Mbps 49,000 3GB 1Mbps
Middle 80,000 Unlimited Unlimited 69,000 100GB 5Mbps
High 100,000 Unlimited Unlimited 89,900 Unlimit. 5Mbps
Premium 130,000 Unlimited Unlimited n/a n/a n/a
Source: Operator websites
On this basis, there would appear to be little or no revenue upside from enhanced mobile broadband. However, as the market shifts from selling GByte bundles on a best-effort basis to selling data speeds, there may be opportunities to generate
Globally, 41% of early 5G adopters would be willing to pay up to 10%
more, and a further 14% would pay up to 20% more. But we would
question whether a premium for 5G alone can be sustained.
The evidence from 5G tariff plans shows that not only will consumers
not pay more for eMBB, but they will also get larger data buckets and
faster speeds.

Mobile Services, Spectrum and Network Evolution to 2025
C:\Users\stefa\Dropbox\Projects\Huawei Spectrum Evolution Jan 2021\Deliverables\Desseminatation\Mobile Spectrum and Network Evolution to 2025 - Coleago - 24 Mar
© copyright Coleago 2021 37
premiums through Quality-of-Service based pricing. We discuss this further in section 3.3.6.
3.3.3 The opportunity from Fixed Wireless Access
eMBB will likely already drive a high degree of fixed (wired) broadband substitution. However, this may be hard to monetise in an ‘unlimited data’ context.
The incremental FWA opportunity is largely confined to dedicated 5G connections within a given location. Ericsson’s forecasts suggest these may reach less than 3% of unique eMBB users (see section 2.2.1). pointing towards a moderate net contribution from FWA to total revenues.
Where adequate fixed broadband alternatives exist, FWA needs to be priced competitively. On a global average basis, we estimate the limit lying around 2.5x current revenues per unique mobile user.
Even if future FWA penetration is twice as high as projected by Ericsson, FWA would be unlikely to contribute much more than 10% to global mobile revenues. The relative contribution may vary across regions, with higher mobile revenue growth from FWA likely in emerging markets that have a lack of wired broadband infrastructure.
It is also worth noting that while average FWA revenues per connection (ARPU) may only be up to 2.5x the ARPU across all unique users, average FWA usage per connection (AUPU) could be over 10x higher than AUPU across all unique users32. Accordingly, the FWA revenue per GByte will likely be lower than for enhanced Mobile Broadband (eMBB). This suggests higher average network costs per FWA connection, hence lower margin revenues. For this reason, we do not see future income streams from FWA as transformative for total mobile returns.
3.3.4 The IoT opportunity
The 5G technology platform opens opportunities well beyond mobile broadband. These new areas of growth include serving the so called “verticals”, smart cities, autonomous vehicles and robotics. Connectivity is the glue of the 4th industrial revolution. The amount of data generated by millions of sensors and other devices opens up opportunities in the application of AI services.
However, while the market-size of the entire IoT value-chain is projected to grow significantly, the bulk of revenues will accrue to services other than connectivity. These services, which by and large are not provided by mobile operators, include applications, platforms and services such as cloud-data analytics and security, as well as professional services such as systems integration, consulting and managed services.
Many non-critical IoT applications will consume small amounts of data. While the number of devices in the field will be very large, unit revenues from most of these will be very low, resulting in low or moderate contributions to total mobile revenues. However, higher mobile revenues and margins may be expected from future broadband IoT devices, as well as from critical applications requiring ultra-low latency.
Statistics gathered by the French regulator ARCEP show that in 2011, IoT (M2M) SIMs accounted for 4.9% of all SIMs and 0.4% of revenue. By Q1 2020, IoT SIMs had grown to 28% of all SIMs, but IoT revenue remained a tiny 1% of total mobile service revenue. Furthermore, this small revenue slice also has to pay for investment in IoT-optimised networks such as LTE-M and NB-IoT.
32 Based on Ericsson projections.
FWA is unlikely to contribute much more than 10% to global mobile
revenues.
With significantly higher average network costs per FWA connection, FWA is unlikely to be transformative
for total mobile returns.
While the IoT market is promising, connectivity revenue may only add
around 5% to revenue.

Mobile Services, Spectrum and Network Evolution to 2025
C:\Users\stefa\Dropbox\Projects\Huawei Spectrum Evolution Jan 2021\Deliverables\Desseminatation\Mobile Spectrum and Network Evolution to 2025 - Coleago - 24 Mar
© copyright Coleago 2021 38
The GSMA projections suggest that IoT connectivity will contribute around 5% to global mobile revenues by 2025. Based on the projections quoted in section 2.2, this would suggest average revenues per IoT connection around 13% the average revenue per ‘human’ SIM, which seems plausible:
Current IoT ARPU (Average Revenues Per Unit) is less than 4% of ‘human’ SIM ARPU in France today;
However, broadband and critical cellular IoT will likely account for a higher proportion of the IoT mix, driving up the blended IoT ARPU.
Moving up the IoT value chain
While IoT connectivity will likely have a moderate direct impact on mobile market revenues, it may yield opportunities to broaden operators’ total offering.
By 2025, according to the GSMA, the global IoT value-chain will generate around $1.1 trillion (close to current total mobile service revenues). 67% of this ($0.7 trillion) is attributed to applications, platforms and services ‒ well over 10x the estimated value of simple IoT connectivity.
Exhibit 37: GSMA perspective on the global IoT value chain
Source: GSMA, the Mobile Economy 2020
In many jurisdictions, resellers of connectivity are required to register as ‘Electronic Communications Services’ (ECS) providers, placing their wider services within the scope of telecoms regulations. This may prove too onerous for specialised players serving specific verticals. Operators may be better placed to carry the regulatory burden. In addition, operators may be able to build on their existing customer relationships within key public, consumer and industry segments.
We would also urge operators to critically assess the competencies they need to develop or acquire to allow them to participate more widely in the overall IoT value chain. This might involve strategic combinations as well as corporate venturing ‒ nurturing fledgling players developing innovative capabilities and who have a deep understanding of the needs of specific verticals.
Gartner as named Vodafone as a leader in its ‘2019 Magic Quadrant for Managed IoT Connectivity Services, Worldwide’. Key steps pursued by Vodafone include:
Total IoT prospects reach far beyond data conveyance. Significant revenue
growth can be achieved if operators seize existing opportunities to move
up the IoT value chain.

Mobile Services, Spectrum and Network Evolution to 2025
C:\Users\stefa\Dropbox\Projects\Huawei Spectrum Evolution Jan 2021\Deliverables\Desseminatation\Mobile Spectrum and Network Evolution to 2025 - Coleago - 24 Mar
© copyright Coleago 2021 39
Pursuing global coverage, through partnerships with rival operators (including China Mobile and America Movil, allowing Vodafone “to provide customers with IoT connectivity in some of the most complex regulatory markets”); and
A strategic partnership with ARM, which “removes cost and complexity for OEMs developing connected products, and solutions that deliver high-value business outcomes, such as stolen vehicle tracking and assisted living”.
Vodafone is also pursuing an active communications strategy. In January 2021, the operator launched its ‘Let’s talk IoT’ digital and print campaign, seeking to make the benefits of the internet-of-things (IoT) easy to understand.
Exhibit 38: Relative positions within the IoT space
Source: Gartner, Inc
IoT offers an opportunity for operators to drive significant incremental returns. But it will not simply fall in their laps: they will need to seize it.
3.3.5 The wider ‘Enterprise’ opportunity
Mobile ‘Enterprise Solutions’ encompass Enterprise eMBB, industry IoT and dedicated Mobile Private Networks (MPNs).
Enterprise eMBB is not strictly a new revenue stream: it exists already and is subject to the same deflationary pressures as mass-market eMBB. Enterprise, business and consumer eMBB are all reflected together within the eMBB forecasts discussed in section 2.2.1.
Enterprise IoT and MPNs, however, represent new revenue streams for mobile operators ‒ albeit the IoT element is accounted for already in our previous discussion on cellular IoT. This leaves MPNs as a remaining revenue category, and it is potentially very large.
According to Pekka Lundmark, CEO of Nokia, “spending on private 5G will outpace traditional public networks in the next decade, estimating every dollar invested in network and cloud infrastructure provides more than $4 of end-user value creation”33.
33 Quoted by mobilelive.com from Mobile World Congress in Shanghai, 2021.

Mobile Services, Spectrum and Network Evolution to 2025
C:\Users\stefa\Dropbox\Projects\Huawei Spectrum Evolution Jan 2021\Deliverables\Desseminatation\Mobile Spectrum and Network Evolution to 2025 - Coleago - 24 Mar
© copyright Coleago 2021 40
Mobile network slicing offers an opportunity for operators to offer dedicated bandwidth with carrier-grade SLAs to enterprises and key industry verticals. This could allow operators to compete with cloud companies and capture a significant proportion of Enterprise spend on private 5G.
The sale of dedicated network slices is effectively a form of Quality-of-Service based pricing (which we discuss further below).
3.3.6 Quality-of-Service based pricing
Speed-based pricing
Customers currently pay the same effective price per GByte regardless of the speed with which it is delivered. Yet, as discussed in sections 2.1 and 2.4.2 above, high-speed applications drive higher average capacity requirements per GByte and thus higher costs for operators.
Taking an extreme example to illustrate the point, this is akin to charging the same average price for a Ferrari as for a Fiat Panda. Not only would this seem perverse, it would be deeply inefficient. No new Ferraris would be produced, because their cost would exceed their price. The excess demand for Ferraris could not possibly be fulfilled, resulting in unhappy customers being stuck with an overpriced Panda (when they might have been willing to pay the true value of a Ferrari). Meanwhile, demand for Pandas would be depressed due to their excessive price. Total seller revenues and returns would be reduced.
The same is true for mobile consumption: best-effort provision at uniform prices per GByte yields an inferior outcome for all parties. Charging more for high-speed data would allow operators to better align prices both with relative costs of production and customer willingness to pay. This would also address freeriding issues: those customers who are not willing to meet the economic cost of high-speed data would adjust their usage accordingly, such that neither the operators nor fellow customers would bear the extra cost.
In the fixed broadband domain, of course, speed-based price distinctions already exist. Exhibit 39 below shows the average fixed broadband prices across the EU for different broadband speed specifications34.
Exhibit 39: Mean EU fixed broadband prices (€ per month)
Source: Coleago based on European Commission research (prices as of October 2019)
34 Source: ‘Mobile and Fixed Broadband Prices in Europe 2019’, study prepared for the European Commission DG Communications Networks, Content & Technology by Empirica.
1.1x
1.5x
1.8x
0.0x
0.2x
0.4x
0.6x
0.8x
1.0x
1.2x
1.4x
1.6x
1.8x
2.0x
€0
€5
€10
€15
€20
€25
€30
€35
€40
12-30Mbps 30-100Mbps 100-200Mbps >200Mbps
Multiple of 12-30Mbps price
Uniform pricing with best-effort service is deeply inefficient.

Mobile Services, Spectrum and Network Evolution to 2025
C:\Users\stefa\Dropbox\Projects\Huawei Spectrum Evolution Jan 2021\Deliverables\Desseminatation\Mobile Spectrum and Network Evolution to 2025 - Coleago - 24 Mar
© copyright Coleago 2021 41
However, there is one important distinction between mobile and fixed (wired) networks. Wired broadband involves a dedicated link between an aggregation point and the customer premises, so there is no contention at that level. In contrast, mobile bandwidth is shared by all users within a cell. Moreover, fixed broadband lines are static, so the number of customers served by an aggregation point is given ‒ whereas customers can move in or out of a given mobile cell.
This makes wired broadband networks far easier to dimension for capacity. It also makes it easier to provide and communicate firm speed guarantees to fixed broadband subscribers.
Pricing based on prioritized access to network resources
There will likely always be points at which demand for mobile capacity exceeds supply. Certain customers may be willing to pay a premium not just for speed, but also for prioritized access to available network resources. For example, customers could subscribe to ‘gold’, ‘silver’, ‘bronze’ and ‘best-effort’ packages, each with distinct tiered prices. In the event of congestion, ‘gold’ subscribers get first call on network resources, followed by ‘silver’, then ‘bronze’ customers.
An obvious comparable is the airline industry, where overbooking is common in all classes. ‘Gold’ or ‘Platinum’ cardholders are always the last to lose their seats if all ticket-holding passengers do actually turn up. The 3GPP standards for 4G and 5G (release 12 and above) already provide for prioritized access to bandwidth, for example for emergency services and PPDR use ‒ who would of course also be prioritized over private ‘gold’ customers.
Speed and priority-based pricing would allow operators to better meet the specific needs of individual customers, and to generate revenues that are closer to customers’ willingness to pay. The latter could result in significantly increased average revenues (ARPU) across the entire customer base.
We see quality-of-service based pricing as an important opportunity to drive higher industry revenues. There is ample historic evidence in practically every market that a high proportion of customers is willing to pay extra for quality. In the 2G era for example, while incumbent mobile operators maintained a geographic coverage advantage over later entrants, they were able to sustain high market shares while charging a significant price premium over their rivals ‒ even though the bulk of their customers might never or only occasionally spend time outside the footprint of competing networks.
Quality-of-service based pricing represents an important opportunity
for mobile revenue growth.

Mobile Services, Spectrum and Network Evolution to 2025
C:\Users\stefa\Dropbox\Projects\Huawei Spectrum Evolution Jan 2021\Deliverables\Desseminatation\Mobile Spectrum and Network Evolution to 2025 - Coleago - 24 Mar
© copyright Coleago 2021 42
Exhibit 40: QoS-based pricing
Source: Coleago
Pricing based on latency
A further dimension of Quality-of-Service is latency. Operators may charge a premium for lower latencies, which are especially relevant for cloud-gaming applications and critical IoT.
3.3.7 Synthesis: future revenue prospects
Under the current paradigm, which is focused on ‘best effort’ connectivity, we anticipate limited revenue growth in real terms. Fixed Wireless Access and IoT connectivity are unlikely to add much more than 15% to existing global mobile revenues, and likely far less to net returns.
As discussed above, however, we do see two important opportunities for mobile operators to drive higher revenues and returns:
Moving up the IoT value chain (as described in section 3.3.4); and
Offering (virtual) private 5G to Enterprise (described in section 3.3.5); and
Introducing quality-of-service based pricing across all customer segments.
We believe that the industry should target a resumption of revenue-growth that keeps pace with overall GDP evolution. Based on IMF global GDP forecasts, this would entail global mobile industry revenue-growth around 4% in real terms, and 6% nominal ‒ 5 percentage points higher than the annual growth projected by the GSMA between 2020 and 2025. Given the available opportunities and subject to execution, we believe that such an ambition may be achievable before 2025.
Nevertheless, policy-makers should not assume that 5G will automatically deliver returns for operators that exceed their cost of capital. The risk remains high that general price erosion caused by intense competition will dominate, offsetting the gains from IoT and quality-of-service based pricing in particular. Furthermore, major industry disruptions invariably yield ‘winners’ and ‘losers’. Imposing policies that tip market challengers in the ‘losers’ camp could have adverse consequences for future competition.
Price paid today
Low data-speed
user
Low and middle income
High data-speed
user
Willingness to pay
Price paid today
Willingness to pay
Current price
Speed-based pricing(reflecting relative cost of supply)
Price and Value of total consumption
$
Same total consumption in GBytes
Industry should target a resumption of revenue-growth in line with the annual
growth in GDP.
Nevertheless, policy-makers should not assume that 5G will deliver
returns in excess of the industry cost of capital.

Mobile Services, Spectrum and Network Evolution to 2025
C:\Users\stefa\Dropbox\Projects\Huawei Spectrum Evolution Jan 2021\Deliverables\Desseminatation\Mobile Spectrum and Network Evolution to 2025 - Coleago - 24 Mar
© copyright Coleago 2021 43
3.4 Operators need to bring down the cost per bit
To create a positive overall 5G business case, the industry also needs to maintain sustainable profitability margins ‒ especially if real revenue growth fails to materialise. This means that the total costs per bit incurred by operators need to fall at a similar rate as the total revenues per bit.
Exhibit 41: Real-term revenue per bit index
Source: Coleago
By 2025, real-term revenues per bit will be between 8% and 38% of those in 2020. The bottom curve (pessimistic case) is based on the ITU global traffic forecast (our upper bound) and the GSMA’s global revenue projection (taken as our lower bound). The top curve (optimistic case) is based on the GSMA’s global traffic forecast (taken as our lower bound for traffic) and revenues assuming these were to grow in line with real global GDP growth35 (taken as our upper bound for global industry revenues).
This means that by 2025, simply to maintain current industry margins, total annualised costs per bit need to fall to between 8% (pessimistic case) and 38% (optimistic case) of 2020 levels.
Put another way, the total capacity per dollar spent needs to increase dramatically. As discussed briefly in section 2.5, capacity may be expanded by:
Building new radio sites;
Deploying new spectrum; and
By increasing the efficiency with which spectrum is utilized.
These each have different cost drivers and profiles, as described below.
35 As per IMF GDP forecasts.
0%
20%
40%
60%
80%
100%
120%
2020 2021 2022 2023 2024 2025
Inde
x (2
020
= 1
00%
)
Low revenue high traffic High revenue low traffic

Mobile Services, Spectrum and Network Evolution to 2025
C:\Users\stefa\Dropbox\Projects\Huawei Spectrum Evolution Jan 2021\Deliverables\Desseminatation\Mobile Spectrum and Network Evolution to 2025 - Coleago - 24 Mar
© copyright Coleago 2021 44
3.4.1 Key drivers of capacity-related costs
Densifying the network
The total costs of ownership (TCO) of a site are normally dominated by operating costs, including site rental, power, backhaul transmission and maintenance costs. These are more likely to rise with inflation than to reduce over time ‒ albeit transmission costs per bit may decline, as more efficient, high-capacity backhaul solutions are implemented.
Similarly, the costs of site acquisition, planning and civil construction, which constitute a significant portion of total site capex, are unlikely to fall. While the mix of costs (as well as the total costs per bit) may differ between small cells and macro sites, the preceding generally holds true for all site types.
It follows that the main route to reduced site TCO for individual operators is increased sharing of network and/or spectrum assets (discussed in greater depth in section 5.5).
Beyond asset sharing, to further increase the capacity per dollar from site densification, the total capacity delivered per site needs to increase far quicker than site TCO. This relies both on spectrum availability and efficient spectrum deployment, which are discussed next.
Deploying extra spectrum
The total costs of spectrum deployment include spectrum TCO (i.e. licence acquisition costs and any recurring fees) and the costs of equipment (spanning antenna systems and RF/baseband processing equipment).
Of these, spectrum TCO is a key line-item and subject to very large variations across bands, time and markets.
The total capacity per dollar from spectrum deployment also depends on technical implementation, and the available contiguous bandwidth in each individual band. As discussed in sections 5.3.2, 5.3.3, 5.3.4 and 7.6.4, wide-band deployments across fewer bands yield better performance and are far more cost-effective than narrow-band deployments across many bands. The relationship between cost per bid and channel size is dramatic, with costs per bit for a 100MHz contiguous channel being around 25% of those for a 20MHz channel (see Exhibit 59 in section 5.3.4).
Increasing the efficiency of spectrum use
The capacity per MHz can be increased by implementing technology enhancements such as sectorisation and higher-order MIMO (see section 5.3.1). While implementing these enhancements involves significant investment, the capacity per dollar tends to be significantly higher than that for a new site in a more basic configuration.
In the present state of play, the available space on a site is typically constrained, which may limit the extent through which technology enhancements may be deployed. However, the general trend seems to be towards smaller and lighter massive MIMO antenna arrays and systems, which could lead to increased scope for deployment in the future36.
Another important factor is the evolution of relevant equipment unit costs. The historic trend has been towards fast improving performance and capabilities at declining real equipment prices. As discussed further below, future equipment prices depend significantly on the vendor landscape in individual markets.
3.4.2 Bringing down total costs per bit
Assuming optimal deployment strategies, the cost per bit hinges on:
36 Based on views expressed to us by Huawei.
Site TCO for individual operators can be reduced through increased
network and spectrum sharing.
Beyond this, to increase capacity per dollar from site densification, the total
capacity delivered per site needs to increase much faster than site TCO.
The capacity per dollar from new spectrum depends heavily on total
licence fees as well as on the efficiency with which it is deployed.
Technology enhancements on an existing site yield more capacity per
dollar than building a new site in a basic configuration.

Mobile Services, Spectrum and Network Evolution to 2025
C:\Users\stefa\Dropbox\Projects\Huawei Spectrum Evolution Jan 2021\Deliverables\Desseminatation\Mobile Spectrum and Network Evolution to 2025 - Coleago - 24 Mar
© copyright Coleago 2021 45
The total cost of sites;
The availability and packaging of new spectrum;
The cost of new spectrum; and
Network equipment performance and prices
Some of these aspects can be influenced by operators, while others lie mainly in the hands of regulators. Both need to play their part to ensure a sustainable future for the industry.
Increased asset-sharing across the industry represents a key opportunity for operators to contain future costs. However, regulators need to enable this, in ways that do not significantly impair competition. As outlined in section 5.5.2, emerging neutral host models enable very high levels of infrastructure sharing, allowing far greater proportional cost savings than the traditional network deals between just two operators. Moreover, we believe that these models pose little if any real threat to competition.
The policy choices of regulators bear heavily on the availability of new IMT spectrum, the speed with which it is released, how it is packages and how much operators pay for it. Regulators should seek to:
Release as much IMT-designated spectrum as possible, and as fast as possible;
Release spectrum in wider blocks and facilitate spectrum consolidation (see section 5.3.5); and
Seek to keep spectrum prices at moderate levels, to minimise the overall financial burden on operators (see section 7 for an extensive discussion on why this is essential).
These policy choices influence the future sustainability of individual operators, as they grapple with existing financial pressures. These choices also have deep implications for social welfare and economic development. This is discussed in detail in section 4 as well as section 7, which focuses on best international practices.
Improving network equipment performance and prices
Finally, higher network equipment performance and lower unit prices will help drive further reductions in total costs per bit.
Maintaining high levels of competition in vendor supply markets is essential to ensure operators secure the best equipment at the best prices. Denying market access to key international suppliers may hamper innovation and lead to higher unit costs ‒ with negative implications for operators, their customers and society in general.
Network virtualisation and open RAN (see section 5.2.2) offer further opportunities to reduce total network costs, improving returns for operators.
3.5 Individual operator perspective
Unless there is a resumption of real-term mobile revenue growth and increased asset sharing across the industry, overall industry returns are unlikely to improve. However, even if 5G does not drive higher value for operators, this would not mean that individual operators could choose not to invest in 5G and in massive capacity expansion.
If a sole operator within a market chose to make such investments, it would generate substantial competitive advantages over its rivals who didn’t. Conversely, an individual operator who failed to make the investments (while its rivals do upgrade their networks) would have a very limited future.
A similar dynamic has been observed over subsequent spectrum releases. While total industry bandwidth and costs of spectrum ownership have risen over time, returns
The policy choices of regulators have a deep impact on the 5G business case for operators. They also bear
heavily on social welfare and economic development.
Maintaining high competition in equipment-supply markets is essential to drive innovation,
increased performance and lower equipment prices.

Mobile Services, Spectrum and Network Evolution to 2025
C:\Users\stefa\Dropbox\Projects\Huawei Spectrum Evolution Jan 2021\Deliverables\Desseminatation\Mobile Spectrum and Network Evolution to 2025 - Coleago - 24 Mar
© copyright Coleago 2021 46
have fallen in real if not in nominal terms. In other words, spectrum has added value to consumers, but not to the industry itself. Yet, while spectrum might not increase returns, failure by one operator to invest in spectrum would see its net returns fall even further back. In this context, spectrum has defensive value for operators ‒ justifying the business case for individual operators even if the case for industry on aggregate is negative.
Exhibit 42: The mobile “Prisoners’ Dilemma”
‘Nash equilibrium’: optimal strategy for individual operators is the same whatever rivals do ‒ an outcome in which none of the operators invests is unlikely. However, the magnitude of investments depends on expectations of returns.
Source: Coleago
But ‘defensive value’ cannot sustain investments indefinitely: unless returns improve and cover the cost of capital, premature market consolidation becomes more likely. A poor outlook for returns would also reduce investment incentives, leading to consumer harm (see sections 4 and 7).
It may be hoped that 5G will add value to the industry as a whole. But either way, the calculation for individual operators will be different. In a competitive market, failure to invest is simply not an option.
3.6 Managing the transition from 4G to 5G
While most of the global traffic growth between 2020 and 2025 will come from 5G, the total capacity needed to support legacy technologies will be much higher in 2025 than in 2020 (see section 2.2.4 ‒ total global 4G traffic in 2025 will likely be double that in 2020).
We are also hearing reports that 4G networks, especially in South East Asia, are facing severe congestion (as of January 2021), while much of the 5G capacity available today remains idle. This clearly poses a near-term challenge. To address this, operators may need to accelerate re-farming of legacy 2G and 3G bands, initially to 4G rather than straight to 5G ‒ albeit in developing countries, a high residual base of 2G and 3G customers may hamper this.
The experience of 4G customers today will define operator brand perceptions for many years. Hence operators need to take account of legacy 4G capacity needs in their investment plans.
Even if the 5G network is fantastic, an underserved 4G customer may switch to a rival network before (or when) upgrading to 5G. Higher value customers tend to be more
Operator investsWhile its rivals do not
Operator investsAnd so do its rivals
Operator does not investAnd neither do its rivals
Pos
itive
Neg
ativ
e
Value
Operator does not investBut its rivals do
OR
Which is better depends on the potential to drive revenues and/or decrease totalcosts per bit
Many 4G networks are currently overloaded, while 5G resources are
under-utilised. Operators may need to accelerate re-farming of 2G and 3G
bands initially to 4G.
Operators need to include substantial 4G capacity expansion in their
investment plans, and not just focus on 5G roll-out.

Mobile Services, Spectrum and Network Evolution to 2025
C:\Users\stefa\Dropbox\Projects\Huawei Spectrum Evolution Jan 2021\Deliverables\Desseminatation\Mobile Spectrum and Network Evolution to 2025 - Coleago - 24 Mar
© copyright Coleago 2021 47
sensitive to data experience ‒ lack of 4G capacity may have a disproportionate impact on revenues.
Exhibit 43: Typical distribution of customer ARPU across percentiles
Source: Coleago
The challenge for operators, therefore, is to ensure to ensure good 5G availability to encourage faster customer migration to 5G ‒ while significantly increasing 4G capacity until the legacy-traffic peak is reached. By ‘availability’, we mean both good coverage and high capacity.
Allocating low-band resources such as 700MHz to 5G could mean less capacity for 4G (while higher mid-band 5G is under-utilised) ‒ but without low-band 5G resources, 5G would be (relatively) less attractive due to its weaker 5G coverage.
Exhibit 44: Managing the transition to 5G
1 DSS: Dynamic Spectrum Sharing
Source: Coleago
Fortunately, there is a smooth transition from 4G to 5G (through software upgrades), which didn’t exist between 2G, 3G and 4G. One can no longer speak strictly of ‘4G’ versus ‘5G’ investments ‒ with the exception of 3.5GHz deployment, since this is a 5G-
0
50
100
150
200
250
300
350
Top
5%
2nd
5%
3rd
5%
4th
5%
5th
5%
6th
5%
7th
5%
8th
5%
9th
5%
10th
5%
11th
5%
12th
5%
13th
5%
14th
5%
15th
5%
16th
5%
17th
5%
18th
5%
19th
5%
20th
5%
AR
PU
LC
Y
ARPU by 5 percentile
Data Users
All Users
Typical ARPU distribution by 5 percentiles
Customers at risk from a below market average (4G) mobile broadband experience
0%
10%
20%
30%
40%
50%
60%
70%
80%
90%
100%
Top
5%
2nd
5%
3rd
5%
4th
5%
5th
5%
6th
5%
7th
5%
8th
5%
9th
5%
10th
5%
11th
5%
12th
5%
13th
5%
14th
5%
15th
5%
16th
5%
17th
5%
18th
5%
19th
5%
20th
5%
% o
f Rev
enue
Revenue by 5 percentile
Data Users
All Users
Typical revenue distribution by 5 percentiles
Those customers may account for a disproportionate share of total revenues
Projected legacy-traffic peak:
‒ N.America: 2022
‒ W.Europe: 2023
‒ N.E.Asia: 2024
‒ After 2026 in all other regions
2G, 3G
4G
5G5G
C-band (e.g. 3.4-3.8GHz)
Legacy bands
5G under-utilised in near-term
C-band: 60% of total capacity across all technologies
4G currently overloaded
Need 2x more capacity in 2025 than utilised in 2020
Near-term: accelerate re-farming to 4G in chunks of 2x5MHz
Expand capacity (densification and higher-order MIMO)
Long-term: software upgrade to 5G (no need to swap equipment)
Long-term: use DSS1 to allocate bandwidth to residual users of legacy technologies
Sam
e eq
uip
men
t(R
F units, a
ntennas/M
IMO
)
The good news is that 4G investments today will also serve 5G needs tomorrow
With the exception of 3.5GHz deployment, one cannot strictly speak
of ‘4G’ versus ‘5G’ investments.

Mobile Services, Spectrum and Network Evolution to 2025
C:\Users\stefa\Dropbox\Projects\Huawei Spectrum Evolution Jan 2021\Deliverables\Desseminatation\Mobile Spectrum and Network Evolution to 2025 - Coleago - 24 Mar
© copyright Coleago 2021 48
only band in many markets. As discussed briefly in section 2.2.4, modern 5G equipment (RF units as well as MIMO antenna-systems) supports both 5G and legacy technologies, so expanding 4G capacity with 5G-ready infrastructure does not entail deployment of assets with a curtailed economic life. Indeed, massive MIMO “is widely regarded as a key multi-antenna technology update, facilitating 4G evolution and 5G development”37.
Moreover, Dynamic Spectrum Sharing (DSS) provides great flexibility in the allocation of bandwidth between 5G and legacy technologies: it is no longer necessary to re-farm spectrum in chunks of 2x5MHz across the network. Once peak-legacy traffic is reached, DSS can be used to gradually shift capacity in legacy bands from 4G to 5G, allowing operators to closely match demand across each technology as time progresses. For example, an operator who obtains 2x10MHz of 700MHz spectrum might initially use the full 2x10 for 4G and gradually switch the spectrum to 5G. If the 700MHz assignment is delayed, then operators might go straight to 5G. The timing of this decision depends on technology diffusion among the customer base i.e. the market.
Nevertheless, 5G remains more efficient, and operators have an incentive to rapidly migrate customers to 5G to make best use of the available resources. How fast customers will actually upgrade will depend mainly on three aspects:
The speed with which the costs of 5G devices fall;
The strength of consumer demand for improved data experience;
Price differentials between 5G and 4G services.
The rate of decline in 5G devices is itself dependent on the size of the 5G consumer market at any point. The faster 5G networks are rolled-out worldwide, the faster economies of scale can be achieved. Higher volumes push 5G handset prices down, while creating secondary markets for older models and refurbished devices in less affluent countries. Cheaper 5G dongles and routers also represent an important avenue for early 5G adoption ‒ as was the case in the early years of 4G, while 4G smartphone prices remained comparatively high. By converting mobile to WiFi, 5G routers allow legacy 4G devices to benefit directly from 5G connectivity to the Internet. (Also see section 5.7 for a further discussion on the device ecosystem).
Maintaining a clear data-experience differential in favour of 5G may help accelerate migration. But gain, this involves a careful balancing act: if the 4G experience falls too far behind, the operator’s brand will suffer, and customers may upgrade to 5G on a rival’s network instead.
Pricing is also important. Basic connectivity over 5G should not be more expensive than over 4G, as this could hinder upgrades to 5G. (Note: to be clear, we advocate for quality-of-service based premiums, but do not for maintaining 5G-adoption premiums long after 5G launch). In the 4G era for example, Vodafone India introduced a 4G plan at the same price as an existing 3G plan ‒ but with one extra GByte of allowance. Rather than discounting the new technology to drive migration, greater benefits ‘in kind’ may further incentivise customers to switch over to 5G.
2G and 3G sunset timetable
Legacy sunset strategies vary internationally ‒ with either 2G or 3G already or imminently closed in many markets.
In many Asia-Pacific markets, 2G has (or is being) switched off before 3G
In most European markets, 3G is being switched off first (exception: Switzerland), with Vodafone switching off 3G in 2025 in some markets, and TIM closing in 2029 in Italy
37 GSMA report, ‘Network Experience Evolution to 5G’, February 2020.

Mobile Services, Spectrum and Network Evolution to 2025
C:\Users\stefa\Dropbox\Projects\Huawei Spectrum Evolution Jan 2021\Deliverables\Desseminatation\Mobile Spectrum and Network Evolution to 2025 - Coleago - 24 Mar
© copyright Coleago 2021 49
Operators in the US and Taiwan have or are closing both 2G and 3G networks
However, the scope to close either 2G or 3G in developing markets may be more limited due to the lack of VoLTE.
A thin 3G layer could be supported in the longer term through Dynamic Spectrum Sharing, providing a circuit-switched fall-back option.
Exhibit 45: Legacy sunset timetable in different markets
Country 2G switch-off 3G switch-off
Asi
a-P
acifi
c
Australia and New Zealand No 2G as of 2020
Bangladesh 2025 (Grameenphone)
India 2017-2019 (R-JIO, Airtel)
Macau 2015-2019 (CTM, Hutchison, Smartone)
Malaysia After 2020 (Digi) After 2020 (Digi)
Myanmar 2022 (Telenor) 2025-2027 (Telenor)
Pakistan 2023 (Telenor)
Singapore 2018 (M1, Singtel, Starhub)
South Korea 2011 (KT, LG, SK Telecom)
Taiwan 2017 2018
Thailand 2019 (DTAC, AIS, TrueMoveH)
Eur
ope
and
No
rth
Am
eric
a
Austria 2020 (Three)
Denmark 2020 (Three)
Germany 2025 (Vodafone) 2020 (Vodafone)
Ireland 2020 (Three)
Italy 2025 (Vodafone), 2029 (TIM) 2020 (Vodafone, Three), 2020 (TIM)
Netherlands 2022 (KPN)
Norway 2025 (Telenor) 2020 (Telenor), 2021IoT (Telia)
Sweden 2020 (Three, Telenor); 2025 (Tele2)
Switzerland 2020 (Swisscom, Salt), 2021 (Sunrise) 2024 (Sunrise)
United Kingdom 2020 (Three), 2022 (EE)
North America No 2G as of 2020 2020 (Verizon), 2022 (AT&T)
Source: IoT Business News (article by SolentSoft, December 2019), Emnify.com (December 2020 blog), Commsupdate.com (March 2021)
3.7 Key spectrum-acquisition considerations
Shareholder value is created from spectrum acquisition if operators pay less for spectrum than it is worth. It follows that operators need to develop a clear business case for spectrum acquisition. In particular, the prospect of under-utilised 5G resources while 4G demand continues to grow (especially in emerging markets) may discourage some operators from paying high fees for 5G-only spectrum.
However, failure to invest in 5G would mean that customers have no-where to go (outside 4G). Given that 5G is more spectrally efficient, over-emphasising 4G for too long (at the expense of 5G) could mean that operators face an even deeper capacity crunch in the medium term. Early 5G availability allows heavier data users to upgrade, relieving pressure on 4G.
A further consideration is that failure by an operator to acquire C-band spectrum today could also allow rivals to secure all available bandwidth ‒ in which case it would not be available when it is really needed.
From an operator perspective, spectrum acquisition is economically justified if its value exceeds the cost, albeit operators may also be subject to fixed budget constraints.
Operators may justify spectrum acquisition as long as value exceeds
price, albeit social value may ultimately be damaged by higher
industry costs.

Mobile Services, Spectrum and Network Evolution to 2025
C:\Users\stefa\Dropbox\Projects\Huawei Spectrum Evolution Jan 2021\Deliverables\Desseminatation\Mobile Spectrum and Network Evolution to 2025 - Coleago - 24 Mar
© copyright Coleago 2021 50
Exhibit 46: Value creation through spectrum acquisition
Source: Coleago
Value is created as long as acquiring and deploying new spectrum is cheaper per Mbit/s of extra capacity than all alternatives (such as network densification and capacity-enhancements in other bands). If opportunities to secure new sites (macros or small cells) is limited, however, new spectrum may be the only route to increase network capacity to the required levels.
Note that while operators may be able to justify paying up to full value for spectrum, high spectrum prices have an adverse impact on net social value creation, as discussed in sections 4 and 7.
Case study: 700MHz auctions in India
In the 2016 auction in India, 700MHz was left unsold due to excessive reserve prices. The 700MHz band was re-auctioned as part of a multi-band award in March 2021, but was again left unsold ‒ it was still deemed overpriced, despite a 43% reduction in the reserve price from 2016.
Walking away from spectrum is rational if prices exceed value, but everyone loses out as a result:
Network capacity-expansion is less efficient for operators, as these resort to more expensive measures (greater network densification than might otherwise be required);
Scarce national resources are left idle for over 5 years (since 2016);
Substantial consumer benefits from spectrum deployment in a key coverage band are foregone (lost opportunity to improve indoor and wide-area coverage quality);
Negative indirect impact on economic development (see sections 4 and 7).
Net Present Value with
NPV without
Value
Business value with the spectrum
Business value without the
spectrum
Value of the spectrum
Price paid for the spectrum
Value created
Price
$

Mobile Services, Spectrum and Network Evolution to 2025
C:\Users\stefa\Dropbox\Projects\Huawei Spectrum Evolution Jan 2021\Deliverables\Desseminatation\Mobile Spectrum and Network Evolution to 2025 - Coleago - 24 Mar
© copyright Coleago 2021 51
4. Impact on society Information lubricates the wheels of the economy. Mobile voice and messaging boost productivity by allowing ubiquitous communications between private individuals, within businesses and with clients. Mobile data allows individuals to stay informed wherever they are, promoting widespread and instant transfer of information and knowledge. This too, drives efficiency and productivity.
Mobile increases participation in the knowledge economy and helps bridge the ‘digital divide’: for many, mobile represents the sole mode of access to the Internet. It is also a channel for entertainment and fun, and helps keep us safe.
Mobile communications also power the Internet of Things (IoT), with an increasing proportion of devices relying on public mobile networks for data transmission. Mobile IoT applications will have profound implications for industrial productivity and drive unprecedented convenience.
Exhibit 47: Benefits of mobile communications
Source: Coleago; 1 C2C: Consumer to consumer communications; B2B: Business to business; B2C: Business to consumer
There are very few parts of society and of the economy that are not touched by mobile communications. Due to these strong positive externalities, mobile is a critical industry in both emerging and developed markets. In addition, mobile communications generate high levels of consumer welfare (consumer surplus), by delivering increasing levels of value at ever-decreasing unit prices.
These benefits increase with the widespread adoption and consumption of mobile services, for which spectrum is an essential input.
4.1 Contribution to the economy
Total mobile ecosystem
The mobile ecosystem contributed $4.1 trillion of economic value added in 2019 (4.7% of global GDP), according to the GSMA. This is projected to grow by $0.8 billion (5%) to nearly $5 trillion by 2025 (4.9% of global GDP). Around 60% of this anticipated growth is attributed to productivity gains. Further contributions include:
30 million jobs, of which 16 million direct; and
$0.5 trillion in public sector funding, through general taxation.
5G ecosystem
The GSMA anticipates that 5G will contribute $2.2 trillion to the global economy between 2024 and 2034, roughly a third of which attributed to manufacturing and utilities, and another 30% to professional and financial services.
Ubiquitous communications between private citizens, within businesses and with customers
Instant transfer of information and knowledge ‒ drives economic productivity and efficiency
Increased participation in the knowledge economy, bridging the digital divide ‒ for many, mobile is the sole access to the Internet
Entertainment, gaming
Massive source of welfare (Consumer Surplus), convenience and safety
C2C, B2B, B2C1
Key driver of the 4th industrial revolution, yielding massive productivity gains (e.g. smart manufacturing)
Unprecedented convenience (e.g. smart home, smart vehicles)
Increased public and personal health and safety (e.g. smart health, emergency services and public protection)
Energy conservation, reduced waste and pollution (e.g. smart buildings, smart agriculture, smart vehicles)
M2M (IoT)
It is hard, now, to imagine what the world would look like without mobile
communications.
If mobile networks were to disappear, the economy would suffer a heavy
loss in productivity.
By 2025, the mobile ecosystem will contribute nearly $5 trillion in
economic value added (4.9% of global GDP).

Mobile Services, Spectrum and Network Evolution to 2025
C:\Users\stefa\Dropbox\Projects\Huawei Spectrum Evolution Jan 2021\Deliverables\Desseminatation\Mobile Spectrum and Network Evolution to 2025 - Coleago - 24 Mar
© copyright Coleago 2021 52
IHS Markit38 projects that the global 5G value chain will invest an average of $235 billion annually between 2020 and 2035, and that by 2025, 5G will:
Enable $13.2 trillion in annual global economic output (9% of real GDP based on an extrapolation of IMF growth forecasts, and circa $1 trillion more than IHS Markit estimated in its 2017 study);
Generate $3.6 trillion in economic output from the global 5G value chain;
Fuel $2.7 trillion in cumulative real GDP growth (adding 0.2 percentage points to real annual GDP growth); and
Support 22.3 million jobs.
As outlined in the following section, incremental changes in the levels of adoption and use of mobile services also have a large marginal impact on economic development.
4.2 Marginal impact of mobile communications on economic growth
Several econometric studies have sought to quantify the positive effects of higher adoption and consumption of mobile services on GDP growth. In the following, we examine studies covering the 2G and 3G era, as well as more recent analysis, to gauge how estimated GDP-growth multipliers have evolved over time. Significantly, both the older and more recent studies indicate that continuous mobile development has an enduring impact on wider economic growth.
4.2.1 Studies covering the 2G and 3G era
Based on a World Bank study of 120 countries using growth data between 1980 and 2006, Qiang and Rosotto (2009) concluded that a 10 percentage-point increase in mobile penetration is associated with a 0.60 percentage-point increase in GDP growth in high income countries and 0.81 percentage-point increase in low- and middle-income economies39.
Deloitte used regression analysis on data spanning the period 1995-2010 from a panel of 74 countries to quantify the impact of mobile penetration on Total Factor Productivity (TFP). They observed that:
“If [those] countries had 10% higher mobile penetration between 1995 and 2010, they would have experienced on average in the long run a TFP increase of 4.2 percentage points”40
A further study by Deloitte41, based on data from 96 markets between 2008 and 2011, found that a 10 percentage-point increase in 3G penetration was associated with a 0.15 percentage point increase in GDP. To illustrate this, taking Colombia as a specific example, Deloitte concluded that:
“[if, by 2011, Colombia] had 10 more 3G connections per 100 total connections—that is, an increase of 10 percentage points—Colombia would have enjoyed an additional growth rate in GDP per capita of 3 percentage points.”
Deloitte’s study also found a strong relationship between mobile data usage and GDP growth. For a market with average data usage of 1GByte/month per 3G connection,
38 ‘The 5G Economy’, IHS Markit, November 2019. 39 Christine Zhen-Wei Qiang and Carlo Rossotto with Kaoru Kimura, ‘Economic Impacts of
Broadband’, Chapter 5 in ‘2009 Information and Communications for Development’, The World Bank.
40 Deloitte, ‘What is the impact of mobile telephony on economic growth?’, a report for the GSMA, November 2012.
41 Deloitte LLP, ‘The Economic Impact of Next-Generation Mobile Services: How 3G Connections and the Use of Mobile Data Impact GDP Growth’, Chapter 1.6 in ‘The Global Information Technology Report 2013’, World Economic Forum.
Both older and more recent econometric studies show that mobile
continues to have a substantial and enduring impact on economic
development.

Mobile Services, Spectrum and Network Evolution to 2025
C:\Users\stefa\Dropbox\Projects\Huawei Spectrum Evolution Jan 2021\Deliverables\Desseminatation\Mobile Spectrum and Network Evolution to 2025 - Coleago - 24 Mar
© copyright Coleago 2021 53
Deloitte estimate that over 0.6 percentage points of the growth in GDP per capita could be attributed to mobile data consumption, as shown in the graph below.
Exhibit 48: The historical GDP impact of mobile usage per 3G connection
Source: Deloitte, 2013
A doubling of average data usage would correspond with a doubling of the GDP growth attributed to 3G, as shown in the graph above.
Finally, research by Chalmers University of Technology in 2012 suggests a further positive relationship between GDP growth and broadband speeds:
“The study found that the estimated coefficient of broadband speed is statistically significant. Doubling the broadband speed will contribute to 0.3% growth compared with the growth rate in the base year”42.
4.2.2 Studies spanning the 4G era
The following studies assess the economic impact of broadband generally, mobile broadband specifically, and of IoT.
Impact of mobile broadband adoption and 4G
A 2017 study Goodridge, Haskel et al from Imperial College Business School43, using GSMAi data between 2002 and 2014, estimate that a 10% increase in mobile broadband adoption drives increases between 0.6% and 2.8% of GDP.
A 2014 study by Capital Economics, commissioned by operator EE in the UK, estimates that the introduction of 4G would lead to eventual productivity gains between 0.5% and 0.7% of GDP44.
From the preceding, we obtain the comparison of results spanning the 2G and 4G eras shown below.
42 “Does broadband speed really matter for driving economic growth?”, Rohman et al, Division of Technology and Society, Department of Technology Management and Economics Chalmers University of Technology, Gothenburg, Sweden, 2012. The study covered the 34 OECD countries with data from 2008 to 2010.
43 ‘How important are mobile broadband networks for global economic development?’, Edquist, Goodridge, Haskel, Li and Lindquist, Imperial College Business School, Discussion Paper 2017/05, June 2017.
44 ‘Improving connectivity – stimulating the economy’, Capital Economics, November 2014.

Mobile Services, Spectrum and Network Evolution to 2025
C:\Users\stefa\Dropbox\Projects\Huawei Spectrum Evolution Jan 2021\Deliverables\Desseminatation\Mobile Spectrum and Network Evolution to 2025 - Coleago - 24 Mar
© copyright Coleago 2021 54
Exhibit 49: Impact of 2G to 4G mobile on GDP
Source: Coleago based on sources quoted above
There is a surprising consistency in the overall scale of impact identified by these successive studies. Following the 2009 analysis by Qiang and Risotto, one might have expected to see a declining marginal impact of mobile adoption, not least because an increase in SIM penetration from say 10% to 20% must be far more significant than an increase from 80% to 90% (which may due at least partly to growth in multiple SIMs accounted for in the base).
Instead, these successive studies suggest a sustained impact of mobile on GDP growth, but driven by different factors over time. Simple mobile adoption is the driver in the 2/3G era, mobile data adoption and use in the 3G era, and mobile broadband adoption in the 4G era. Each delivers a different boost to economic productivity along its own lifecycle.
In the 5G era, cellular IoT is likely be an increasingly significant factor, underpinning further growth as an enabler of the 4th Industrial Revolution. Estimates of the impact of IoT on economic development are discussed below.
Impact of IoT
Based on data between 2012 and 2015 from 27 EU and OECD countries, Frontier Economics45 estimates that a 10% rise in M2M connections generates annual increases of:
0.7% of GDP;
0.3% in services Gross Value Added (GVA); and
0.9% in industry GVA.
A further 2019 study by Edquist, Goodridge and Haskel, based on GSMAi data between 2010 and 2017 from 82 OECD and non-OECD countries, indicates a strong impact of IoT on Total Factor Productivity (TFP). According to the authors:
45 ‘The Economic Impact of IoT ‒ Putting numbers on a revolutionary technology’, Frontier Economics, March 2018.
0.81
0.15
0.60
10-percentage point increase in
Mobile adoption
Low and middle income
0.60
High income
economy
10-percentage point increase in
3G adoption
10% increase In total
MBB adoption
0.60
Reaching 1GB per SIM of monthly3G usage
Based on2/3G era data
(to 2006)
Based on3G era data (2008-2011)
Based on3/4G era data(2002-2014)
Pe
rce
nta
ge-p
oint
incr
ea
se in
GD
P g
row
th
Lower-bound
estimate
% in
cre
ase
in G
DP
0.50
0.70
4G era(2014 study)
Lower-bound
estimate
Upper-bound
estimate
Eventual impact of
4G
Each new mobile generation introduces new capabilities driving further economic growth. In the 5G
era, cellular IoT is likely to be a significant contributing factor.

Mobile Services, Spectrum and Network Evolution to 2025
C:\Users\stefa\Dropbox\Projects\Huawei Spectrum Evolution Jan 2021\Deliverables\Desseminatation\Mobile Spectrum and Network Evolution to 2025 - Coleago - 24 Mar
© copyright Coleago 2021 55
“Our findings suggest that an increase of 10 percentage points in the growth of IoT connections per inhabitant is associated with a 0.23 percentage points increase in TFP growth. We observe growth in IoT connections per inhabitant of 30% p.a. in our sample, implying a contribution to TFP growth of 0.69% p.a., a large effect. This is equivalent to a contribution of $592 billion based on world GDP in 2017”. 46
As discussed below, much of this value-creation will be powered by cellular networks, and 5G in particular, adding to the overall contribution of mobile already attributable to human adoption and usage.
4.3 Impact of spectrum deployment on economic growth and welfare
The broad range of studies highlighted in the preceding sections provide two clear indications:
The direct and indirect economic contributions of mobile communications are very large in absolute terms; and
Moderate changes in the level of adoption and usage of mobile services have large relative impacts on welfare and economic development.
Since spectrum is a key input to the mobile industry, it follows that spectrum availability heavily influences socio-economic outcomes: spectrum insufficiency would restrict industry supply, directly constraining data consumption. In addition, it may lead to higher average retail prices per unit of consumption, potentially dissuading adoption as well. Both bear directly on economic productivity as well as consumer welfare.
Impact on consumer welfare
Broadly flat total mobile revenues per customer against a backdrop of steeply declining prices per unit of consumption suggests an isoelastic demand curve ‒ that is to say that a halving of unit prices leads to a doubling of consumption volumes per customer.
In these conditions, the increase in Consumer Surplus (CS) per user from a halving of effective prices per GByte is roughly equal to 75% of the customer’s total spend.
Exhibit 50: Impact of halving prices per unit on Consumer Surplus
Source: Coleago
46 ‘The Internet of Things and economic growth in a panel of countries’, Edquist (Ericsson Research), Goodridge and Haskel (Imperial College Business School), 2019.
0.00
0.25
0.50
0.75
1.00
1.25
1.50
1.75
2.00
0.0 5.0 10.0 15.0 20.0 25.0 30.0 35.0 40.0
Pric
e pe
r un
it
Quantity consumed (units)
Increase in Consumer Surplus
Demand curve
Moderate changes in mobile consumer outcomes have a large
socio-economic impact. It follows that spectrum availability bears heavily on welfare and economic development.

Mobile Services, Spectrum and Network Evolution to 2025
C:\Users\stefa\Dropbox\Projects\Huawei Spectrum Evolution Jan 2021\Deliverables\Desseminatation\Mobile Spectrum and Network Evolution to 2025 - Coleago - 24 Mar
© copyright Coleago 2021 56
A tripling of data consumption (as projected by the GSMA for China between 2019 and 2025), corresponding with a reduction in unit prices by 2/3rd, entails an increase in CS of almost 1.2x total consumer spend. Based on current GDP and mobile industry revenues, this suggests that added annual CS from mobile consumption in China amounts to around 1.4% of GDP by 2025. This is on top of the unquestionably high existing CS from mobile consumption.
The relative welfare impact is substantially higher in sub-Saharan Africa, where the GSMA projects an 11-fold increase in consumption between 2019 and 2025. The corresponding increase in CS would be almost 2.6x total consumer spend. For a country like Nigeria, this would entail added CS of $17 billion by 2025, or almost 4% of GDP. Much of this extra welfare would be foregone if insufficient spectrum is made available to operators.
4.4 Ensuring the socio-economic gains materialise
While consumer surplus is continuing to increase dramatically, operator returns have been tightening during the past decade (see section 3.1). In other words, the benefits of additional spectrum in the 4G era accrued to consumers and society rather than to operators.
This is simply the continuation of a by now familiar trend in digital services and products, in which ever improving capabilities are offered at constant or even declining prices. There is a tangible risk that gains for consumers at the expense of producers will persist.
The costs of spectrum ownership have a significant impact on the income and capital requirements of operators ‒ hence on their returns on invested capital (ROIC). While policymakers may not be able to influence all the relevant economic factors, they do have direct control over the conditions on which spectrum is awarded, as well as the annual fees levied on spectrum in use. It is not economically feasible to extract substantial fees for incremental spectrum if these are not offset by increased returns.
If, as a result of excessive spectrum fees, operators are unable to earn their cost of capital in the medium and long term, then fierce competition, sustained investment, high performance and affordable prices are unlikely to endure ‒ jeopardizing the significant social benefits that might otherwise be enjoyed.
Exhibit 51: Impact of large spectrum allocation at low prices (illustrative)
Source: Coleago
0.00
0.25
0.50
0.75
1.00
1.25
1.50
1.75
2.00
0.0 5.0 10.0 15.0 20.0 25.0 30.0 35.0 40.0
Pric
e pe
r un
it
Quantity supplied or consumed (units)
Demand curve
Ability and willingness to supply without extra spectrum
Ability and willingness to supply with extra spectrum at high TCO
Willingness to supply with extra spectrum at low TCO
Current demand-supply
equilibrium
Potential demand-supply
equilibrium
Massive increase in CS plus substantial GDP boost
For a country like Nigeria, additional spectrum releases could fuel $17
billion in increased Consumer Surplus by 2025 ‒ nearly 4% of GDP.
The benefits of additional 4G spectrum accrued to consumers and
society rather than to operators. Substantial fees for incremental
spectrum are not sustainable if low industry returns persist.
Mobile Services, Spectrum and Network Evolution to 2025
C:\Users\stefa\Dropbox\Projects\Huawei Spectrum Evolution Jan 2021\Deliverables\Desseminatation\Mobile Spectrum and Network Evolution to 2025 - Coleago - 24 Mar
© copyright Coleago 2021 57
The trade-off between spectrum fees and socio-economic gains is discussed in greater detail in section 7.3, while section 7.4 examines sustainable spectrum pricing.

Mobile Services, Spectrum and Network Evolution to 2025
C:\Users\stefa\Dropbox\Projects\Huawei Spectrum Evolution Jan 2021\Deliverables\Desseminatation\Mobile Spectrum and Network Evolution to 2025 - Coleago - 24 Mar
© copyright Coleago 2021 58
5. Evolution of mobile networks and technology
5.1 From 4G to 5G
The network evolution from 4G (LTE-A) to 5G (full stand-alone) will require major network changes both in software and Hardware However, this can be completed in stages to ensure a seamless transition, with minimal disruption for customers while additional network costs to operators paid as additional functionality is delivered. The majority of RAN infrastructure base radio units installed since 2018 can be upgraded from 4G to 5G by software alone, assuming that the same antenna configuration is used (MIMO) and the same “band edge mask” will meet regulatory conditions. Within the core network, migration from 4G to 5G will require significant re-configuration as 5G in the early years will operate in the NSA (non stand-alone) mode where the 5G RAN will operate using the existing 4G core. However, to get the benefits of new services and features which the 5G RAN can deliver, it will need to operate with a dedicated 5G core network operating in SA (Stand Alone) mode. This migration between NSA to SA of the 5G core can happen generally over the same time period as the core network evolves from the “Physical domain” to the “Virtual domain”. The process of moving the core network to the virtual domain allows for the various network entities to be defined in software only, running on “virtual machine software” within either a “private cloud” or a standards-based high-reliability data-centre, hardened to deliver similar performance to dedicated hardware running in network operators’ data centres.
In straightforward terms RAN migration from 4G to 5G RF carriers, allows for a more spectrally efficient modulation scheme to be used allowing an increase in data-rate which can be carried over the same RF bandwidth. In turn this allows more user traffic to be carried at greater reliability and availability than was possible with 4G networks. The radio modulation scheme for 4G ‒ Orthogonal Frequency Division Multiplexing (OFDM) with Quadrature Amplitude Modulation (QAM) allowed the best compromise between data rate and spectrum efficiency at the expense of a weakness when the radio link was poor where OFDM encoding would fail particularly at the cell edge. In 5G networks the modulation scheme has been expanded to include Quadrature Phase Shift Keying (QPSK) rising to OFDM with QAM. This allows a higher data rate where the radio path is acceptable and where the radio path is poor the slower QPSK modulation will ensure that some level of service is maintained particularly at the cell edge. There are RF bandwidth differences between the two generations reflecting the historic narrow band nature of spectrum allocation and the expected growth in data rate expected over the next decade. 4G supports RF carrier bandwidths from 1.3 MHz to 20 MHz while 5G supports RF carrier bandwidths form 5 MHz to 100 MHz in varying granularity, depending on whether the spectrum is in Frequency Range 1 (‘FR1’ ‒ up to 6GHz) or FR2 (covering mm Waves).
5.2 RAN architecture evolution 2021 to 2025
5.2.1 Drivers for RAN evolution
Wireless networks typically go through a cyclic three stages of competitive evolution which repeats in slightly different forms continuously. The first stage is often referred to as “Service Area Competition”, where each operator needs to roll-out the radio network to meet the service area objective required by their operating licence and the required depth of service (capacity) to balance the needs of customers with the financial viability of the RAN (radio access network). Within Service Area competition the RAN is obviously the prime driver in terms of cost, performance and competitive advantage. When at least two operators in any location have rolled out the RAN to an acceptable
Most RAN base station units installed since 2018 can be switched to 5G
with a simple software upgrade.
In 5G, the core network evolves from the physical domain to the virtual
domain.
5G is more spectrally efficient than 4G, allowing greater speed
performance as well network capacity per MHz of spectrum.

Mobile Services, Spectrum and Network Evolution to 2025
C:\Users\stefa\Dropbox\Projects\Huawei Spectrum Evolution Jan 2021\Deliverables\Desseminatation\Mobile Spectrum and Network Evolution to 2025 - Coleago - 24 Mar
© copyright Coleago 2021 59
level, typically in excess of 98% of the populated areas, or where all most operators have only small differences in the service area then Service Area competition will cease.
The next phase of RAN competition is generally based on price with operators including a greater number of “call minutes”, text or data for the same price, or at lower prices. In this phase particular operators will aggressively reduce prices or increase call/data bundles for the same retail price to attract new customers and promote incoming “churn” from other operators. This phase is often accompanied by a move to allow virtual operators into the market where licenced spectrum operators will sell wholesale basic capacity to service-based operators (MVNO’s) who only have customer facing infrastructure (Billing and customer care). The net effect of the “price war” phase to spectrum operators is to reduce their financial viability which drives their requirement to look for cost savings in both CAPEX and OPEX.
The final phase of competitive evolution is often called “Service and feature competition”. In this phase all operators will work on the basis that all customers have good access and so competition will move to premium, advanced or “sticky” features to attract high-value customers to a particular operator or network. Examples of this are networks which “Bundle” services such as Netflix and Facebook as a service but which do not count in the customers general data service allowance. These competitive phases are not static and will recur with every iteration of the wireless standards. They can span both geography (urban vs rural) and time. For example, operators could be competing on service area and features in different locations, at the same time. Typical of this process is the development of 5G service where, initially, 5G is only available in certain areas and may be offered at a premium price, or is available only to customers with a premium bundle of services. As 5G becomes ubiquitous so the ability to deliver very high data rates will become less of a competitive advantage and so will become the new base line for mid- and entry-level market customers. Finally, 5G RAN will offer services which need the very high data rates only 5G can deliver and so service area competition will start anew. Then there will be the drive toward 6G due for commercial operation around the year 2030.
The danger here is that operators who could not compete with service area objectives will start an effective “price war” which is generally destructive to the financial viability of all operators.
This section looks at RAN evolution in the landscape of a competitive network operator environment, constrained by spectrum, and the drive toward ubiquitous 5G roll-out. Typically, the cost of deploying a fully developed wide-area RAN will be between 70% and 80% of aggregate total network capex for each operator. Where any operator is using multiple generations of equipment (2G, 3G etc) then historically the RAN equipment cost would need to be duplicated for each generation. Also, where there are a number of network operators licensed for each country/region, the aggregate industry RAN costs are multiplied at the macro level. Without infrastructure sharing, for example, total RAN costs are duplicated 4 times in a 4-operator market.
A process similar to “Moore’s Law” is in operation with vendors where the unit traffic capacity increases and the unit cost of this capacity reduces with each generation. The absolute cost of the RAN continues to increase, but with each generation it can handle more customers and more traffic. Obviously, this high level of RAN infrastructure cost is good for vendors but ultimately it will increase the final cost of the service to customers. Effectively, customers are paying a high price simply for network competition. However, this gross duplication can be avoided, allowing total industry costs to decrease, while retaining a degree of network competition. In the period 2010-2020 significant network consolidation as occurred (operators sharing the same RAN or sites ‒ see section 5.5 for a further discussion), driven in part by price caps brought in by regulators in some jurisdictions and by the commoditisation of the mobile service as less affluent and more sensitive market segments have been targeted. In both developed and developing markets, a high-level of radio site/tower/roof-top sharing is
Typically, full RAN deployment accounts for 70-80% of total
operators network capex.
At the industry level, these costs are multiplied by the number of separate networks, adding to the total cost of
mobile services provision in a market.

Mobile Services, Spectrum and Network Evolution to 2025
C:\Users\stefa\Dropbox\Projects\Huawei Spectrum Evolution Jan 2021\Deliverables\Desseminatation\Mobile Spectrum and Network Evolution to 2025 - Coleago - 24 Mar
© copyright Coleago 2021 60
experienced, with some competing operators sharing RAN infrastructure (NetCo/ServCo model).
The drive to further reduce RAN costs and so further commoditise the physical layer of wireless connection service will need radical steps if higher levels of network competition is to be maintained. 3GPP (GSMA) and O-RAN (Open Ran Alliance) have both released target architecture and interfaces/recommendations for a disaggregated RAN using a high degree of pooled centralisation for Baseband control connected to low-cost remote radio units (cell sites) using IP means rather than dedicated links. The connection path between the Base-band Units (BBU) and the Remote Radio Units (RRU) is generally called “front-haul”, to differentiate this path from the other defined interfaces within 3GPP. This distributed RAN architecture or “Open RAN” is intended to use “Commercial off-the-shelf” (COTS) hardware with open-source software, allowing operators can mix-and-match functionality and hardware according to their required service area, revenue and cost base.
Exhibit 52: Key elements of RAN evolution
Source: Coleago
5.2.2 Open RAN
The concept of “Open RAN” started in 2005 with “Software Defined Radio” (SDR) in traditional vendor-specific equipment. It then progressed into C-RAN in 2009, where the “C” denotes Centralised or Cloud RAN and eventually became Open RAN (O-RAN) in 2018. Where functionality was previously coupled to vendor specific hardware, Open RAN could allow implementations using COTS hardware. This diversification of the supplier base could drive a large reduction in capital expenditure (capex) and the ability to virtualise functionality across disparate hardware platforms, thus also reducing operational costs (opex). Open RAN required new specifications to be developed to allow the provision of interfaces between functions which had previously been embedded into common hardware but were now needed to be exposed, to allow disaggregation between hardware platforms. Currently, these interfaces are being controlled by the O-RAN Alliance and 3GPP release 16 and 17. As of July 2020, there were significant differences between the number and specification of these disparate interfaces, with O-RAN defining a larger number of functionality blocks ‒ hence
Open RAN Security
RAN Slicing
RANVirtualisation
Radio Spectrum Licencing
Commoditising the physical layer to further reduce RAN costs will require radical steps, including virtualisation
and Open RAN implementation.

Mobile Services, Spectrum and Network Evolution to 2025
C:\Users\stefa\Dropbox\Projects\Huawei Spectrum Evolution Jan 2021\Deliverables\Desseminatation\Mobile Spectrum and Network Evolution to 2025 - Coleago - 24 Mar
© copyright Coleago 2021 61
interfaces ‒ than 3GPP. Examples of these interface differences are A1, E2, O1, O2 and “Open Fronthaul”, which are defined under the O-RAN approach but are not required within the 3GPP architecture.
Historically, most manufactures had some element of SDR in-built to their proprietary RAN hardware, such as where the same hardware can be used for 2G, 3G, 4G and 5G, or where only the RF (Radio Frequency) modules are spectrum-band specific. An example of this is a typical 4G high-capacity radio site which would comprise a single Base-band unit (BBU) to provide the interworking function with the Core-Network linking to a number of Remote Radio Units (RRU), which provide the radio channel(s). In a 3-sector multi-band site, an individual RRU would be required for each sector and each spectrum band within a sector. Open RAN is variously described as vendor neutral hardware (COTS) and software-based on standard chipsets, open software (Linux) as well as standardised interfaces between the main units. It is a toolbox or “Lego” type construction, in which any manufacturer’s hardware can interwork with any other manufacturer’s software, with the functionality being completely seamless between the various elements/entities/instances.
The technology is currently nascent, with standards bodies that are not currently harmonised among main vendors or operators. 3GPP is the main standards body which controls recommendations globally for the majority of mobile phone networks (95% global reach). The O-RAN alliance is a trade body comprising a large number of network operators and a number of mainly tier-2 manufacturers. The standards and recommendations produced by the O-RAN alliance are not harmonised with 3GPP releases, and there is a danger that there will be fragmentation of the market caused by these conflicting standards ‒ much as there was in 2G/3G between the GSMA and the CDMA2000 standards group. These competing standards were later harmonised under the auspices of a new standards body 3GPP. 3GPP are producing standards and recommendations to support a high level of functionality within an open RAN environment, but these are not expected until release 16 and 17 are available. 3GPP release 17 was due to be frozen in December 2020, but additional delays are possible, depending on the evolution of the Covid-19 crisis.
Current high-capacity radio sites (pre-Open RAN) generally comprise a single Base-Band Unit (BBU) entity and multiple Remote Radio Units (RRU). The BBU can be made up of multiple hardware units but it remains a single logical entity. There will be a separate RRU for each antenna, and where an antenna can support multiple spectrum bands, each band will require a separate RRU due to the complexity of developing strict RF filters to support the required “Band Edge Mask” (BEM) performance. Generally, each RRU is connected to its local BBU by a Common Public Radio Interface (CPRI) fibre cable, often referred to as a “Front-Haul” connection. For simplicity, the fibre cable is often bundled in the same physical sheath with a copper power cable that provides power to the RRU. The fibre connection is generally one-to-one for each RRU/BBU link. For very high-capacity sites, the BBU will therefore need to support a large number of RRU’s ‒ hence a large number of dedicated CPRI terminations. Standards within the O-RAN alliance provide for a variation of CPRI known as eCPRI, where the link between BBU and RRU adopts an IP type structure and physical connection, rather than a dedicated (serial) fibre/wavelength link. This development will allow a centralised/virtualised form of BBU connected using standard fibre/IP to a very large number of RRU’s. This arrangement will allow radio sites to have a smaller physical footprint, with “massive MIMO” deployments to improve both the service area and the data-rate to customers. Potentially, these centralised BBU arrangements can be based on COTS or cloud-based hardware, with the level of vendor-proprietary equipment being reduced to the RRU or even the simple RF/Antenna part of the radio site equipment. Radio sites can thus be reduced in complexity and size, and would require less power. Multiple RRU’s using carrier aggregation (CA) will increase radio reliability with increased data rates. Spectrum occupancy can also be improved by allowing radio sites/BBU combinations to “rest” certain spectrum bands during periods of low activity.
The recommendations and standards issued by 3GPP and the O-RAN
alliance are not harmonized, leading to potential fragmentation. This could
damage the entire RAN ecosystem.

Mobile Services, Spectrum and Network Evolution to 2025
C:\Users\stefa\Dropbox\Projects\Huawei Spectrum Evolution Jan 2021\Deliverables\Desseminatation\Mobile Spectrum and Network Evolution to 2025 - Coleago - 24 Mar
© copyright Coleago 2021 62
Founded in June 2018, the O-RAN alliance grew from an AT&T initiative to virtualise both the Core and the RAN. While it is heavily involved with other standards bodies such as 3GPP, GSMA and IEEE, it is not directly affiliated with any other organisation. The O-RAN alliance is generally focussed on developing 5G, but recent pre-standards deployments have also included 2G, 3G and LTE-A.
The Telecom Infra Project (TIP) is a trade body which seeks to empower the concepts of infrastructure virtualisation to reduce costs to network operators, who could then pass these saving on to customers. In the case of the radio network, TIP generally seeks to support manufactures in deploying Open RAN systems that comply with standards and recommendations from 3GPP/GSMA, the O-RAN alliance and the IEEE. Founded in 2016, with Facebook as a major supporter, the TIP initially considered virtualising the Core network, transport (backhaul/backbone) network and the services network. This has now been expanded to include the RAN with support from the O-RAN alliance. It now also includes “Front-Haul”. The members of TIP are primarily network operators/spectrum holders and tier-two manufacturers. The stated goal of TIP is to provide internet connectivity to a global population by promoting a vendor-neutral disaggregation of network infrastructure at both the hardware and software levels on general purpose processor-based platforms (COTS). Yago Tenorio is the current Head of Group Architecture at Vodafone and is also the current TIP Chairman. At a TIP conference at the beginning of 2020, he stated that Vodafone was looking to replace all their ageing RAN infrastructure within Europe ‒ comprising some 150,000 radio sites ‒ with new generation equipment. The inference being that this new equipment would be compliant with Open RAN standards. It should be noted that as of October 2020, Nokia is the only mainstream manufacturer represented within the TIP members list.
Various network operators have already committed to deployments of Open RAN infrastructure including MTN, Vodacom, Telefonica, BT, Softbank, DoCoMo and AT&T. Mainstream manufacturers of RAN equipment including Ericsson and Huawei support the 3GPP standards relating to open RAN architecture, as reflected in their product roadmaps. Smaller manufacturers of IT-type of equipment tend to use the O-RAN standards and architecture, and rely on 3rd party manufacturers for the RF modules and equipment. Also, some manufacturers have their own proprietary versions of Open RAN, which could allow standards-based interfaces to be supported on their equipment. This could open the door to some level of common hardware/software. How actual (real world) costs of new generation Open RAN infrastructure will compare with the normal prices of vendor specific RAN equipment is unknown. However, it is likely that while capex might be reduced, greater opex challenges may arise, relating to software updates for an ever-increasing number of disparate hardware platforms and interfaces, within a highly complex services-based environment.
5.2.3 Network Slicing
Network slicing is a radical extension, allowing a greater control of logical network resources by third parties, including virtual operators (MVNO’s), large corporate customers, Vertical players, technology-specific operators (e.g. IoT) as well as special user groups (including PPDR agencies). It is variously defined as a “collection of 5G network functions and specific radio access technology settings that are combined together to support a specific use-case of business model”. Network Slicing applies throughout a 5G network, with the specifications and requirements being built into the standards and recommendations by such organisations as the “Next Generation Mobile Network Alliance” (NGMN). With specific regard to RAN evolution however, we focus on the logical and physical properties of the radio network including the BBU and RRU components.
Network slicing is one of the key features of 5G. 3GPP defined in 3GPP TS 23.501 and TS 28.530 Recently (2019), the GSMA has released a series of documents including the “Generic Network Slice Template (GST)” (V2) and the Network Slice Type (NEST) descriptions which provides worked examples of how the GST can operate. Network slicing is intended to allow business customers greater control of how their mobile/5G
Network slicing is one of the key features of 5G.

Mobile Services, Spectrum and Network Evolution to 2025
C:\Users\stefa\Dropbox\Projects\Huawei Spectrum Evolution Jan 2021\Deliverables\Desseminatation\Mobile Spectrum and Network Evolution to 2025 - Coleago - 24 Mar
© copyright Coleago 2021 63
services are delivered, as well as at what cost, to better match delivery with requirement. Ultimately business customers will be able interact with mobile network operators through some form of API to set-up, change and monitor their network slice service, without recourse to which network operator is serving their UE devices/handsets. Via the API, these business customers will be able to control individual networks in terms of Latency, Reliability, Guaranteed SLA, Coverage, Device management, mobility, data security and Energy efficiency etc. and to manage their end-to-end delivered service in terms of Data Analytics, asset management, Platform security, Charging, Computing (cloud and edge) and partner integration.
Typically network slicing as it applies to RAN infrastructure will deliver a different radio experience to different customer groups (verticals), as if they were on their own dedicated radio network. These differences can include Data Speed, QoS, Latency, Reliability, Security and the level of value-added services. These differences will be seamless to the User Equipment (UE), and customer vertical and individual customer groups will be unaware that all verticals are being carried on the same physical/logical RAN. Dynamic RAN pricing can be deployed for specific customer verticals, allowing graduations of RAN performance to be charged differently, depending on the time of day, the location, and the type of service.
However, the radio resources of any given cell or RAN site are finite. Accordingly, there will be a limit to the number of UE’s which can be serviced with guaranteed levels ‒ or indeed any given performance level ‒ based on the gross traffic load and the available radio resources. Whether or not the RAN network slices are “hard” with fixed guaranteed data rates or network latency, the service slices which require less stringent performance will experience a disproportionate amount of congestion under high traffic conditions, even if the services which have a guaranteed data rate are not fully utilising their allowance. The properties of a “contended” RAN link will manifest themselves in the same way as normal contended links, when the shared resource experiences high traffic or congestion. In these circumstances, the network slices which require only modest RAN performance will face congestion first, followed by the high data-rate service slices. Finally, the guaranteed data-rate services will also start to fail. A significant amount of standards work remains outstanding to govern RAN behaviour under high traffic and congested conditions.
Network slices can be put in place across network operators in the same country, or between Network operators in different countries where individual network operators would simply lease the service either to an anchor customer/operator or to a service aggregator. For example, large transport company which has trucks all over Europe could take a slow-speed network slice from at least one operator in every European country, creating a pan-European slice interworking with devices in all their vehicles. Their data use would be non-real-time-specific, and could relate to such things as low-level telemetry, load information, routing information and driver information. This type of data could be competitively priced to avoid large roaming charges. If any real-time specific event occurs, the relevant data could be carried in the normal way by the serving operator, and thus be charged differently from the network slice data.
RAN network slice verticals include such things as Internet-of-Things (IoT), Automotive/V2x, Manufacturing, Construction, Transport, Health, eGov, Smart-Cities, Education, Tourism, Finance and Agriculture. The list of potential market verticals is continuously evolving. It is likely that by the time 5G is fully deployed, new key verticals will replace what is envisaged in the NGMN white paper of 2020.
Some challenges remain with regard to network slicing within the RAN or within certain cells of a particular RAN. Historically, the RAN was a very expensive common resource used by all customers/Verticals and which only provided limited differences in QoS for each vertical. The size of the RAN footprint was a key source of competitive differentiation for network operators, while its spectrum efficiency was closely monitored by regulating bodies. With RAN network slicing, large changes in how verticals can utilise the RAN are possible, including on-the-fly changes to the sliced parameters by the verticals if permitted by the network operator.

Mobile Services, Spectrum and Network Evolution to 2025
C:\Users\stefa\Dropbox\Projects\Huawei Spectrum Evolution Jan 2021\Deliverables\Desseminatation\Mobile Spectrum and Network Evolution to 2025 - Coleago - 24 Mar
© copyright Coleago 2021 64
5.2.4 Security
LTE was the first generation RAN which did not have a specific spectrum reserved for voice traffic: all radio resources were dedicated to data. Effectively, voice became an application running over the data layer of the now harmonised RAN. As this data network developed, there has been increases centralisation of IP data entities supporting the broad RAN functionality. A key objective is to reduce RAN costs, by allowing implementation within general computer systems, thus reducing the need to rely on bespoke processor platforms. With the increased levels of radio hardware, providing ever-increasing data-rates for customers at an ever-reducing cost per bit/Hz is an imperative in the 5G era.
The push to disaggregate the various functional groups within a common RAN network means that there is an ever-increasing number of interfaces that need to be defined. These must be non vendor-specific and need to be available without licence fees. The O-RAN alliance is leading this drive with currently 5 interfaces defined (A1, E2, O1, O2, and open fronthaul). In comparison, 3GPP have defined 2 main interfaces (E1 and F1-C/F1-U).
Exhibit 53: 3GPP versus O-RAN alliance approach
Source: Coleago
Traditionally, all interfaces between RAN entities and between the RAN and the core network were carried over private dedicated links controlled by the operator. In the case of 4G RAN, this usually meant dedicated CPRI fibres or wavelengths on a common fibre to provide both physical and logical security between the BBU(s) and the attendant RRUs. As all networks move to open interfaces with centralised or cloud-based virtualisation, RAN links are increasing being carried over common (public) IP centric connectivity layers, or layers shared with other resources which are also open to public networks (albeit through V-LAN, firewalls and VPN’s, etc.). These common connectivity layers and interfaces present new security threats and challenges, should a “bad actor” or concerted party plan an attack on the mobile network. Such attacks may range from simple disruption (e.g. DDOS attack) to more harmful attacks involving data breaches (network integrity) and/or information breaches (e.g. the ability to eavesdrop on customer traffic or to locate individual devices with certain cell sites).
Open RAN is the general industry name for expanding the previous manufacturer specific RAN architecture to a more disaggregated architecture, where specific functionality can be provided by a disparate collection of hardware/software modules which can themselves be virtualised. There are two main industry iterations of Open RAN architecture and V-RAN and O-RAN, as there are two different standards bodies controlling the various architectures and interfaces. V-RAN is the 3GPP iteration, starting in release 15 of the standards and updating through release 16 as well as the
The O-RAN alliance approach defines a greater range of functions and
interfaces than the 3GPP approach, which allows greater RAN
disaggregation, but also introduces greater security vulnerabilities.

Mobile Services, Spectrum and Network Evolution to 2025
C:\Users\stefa\Dropbox\Projects\Huawei Spectrum Evolution Jan 2021\Deliverables\Desseminatation\Mobile Spectrum and Network Evolution to 2025 - Coleago - 24 Mar
© copyright Coleago 2021 65
soon to be frozen release 17. The V-RAN concept allows a large amount of virtualisation, particularly in the way that the Central Unit (CU) is deployed with multiple Distributed Units (DU). In general description, the CU is effectively the Baseband Unit which handles control and data traffic between the radio units and the core network. The DU is effectively the “Remote Radio Unit”, which provides the radio resources at the cell site. Release 15 assumes that the connections between the CU and DU’s will be by CPRI or potentially eCPRI. O-RAN is the iteration of the Open RAN Alliance, which has been set-up primarily by network operators with the objectives of providing open/standardised interfaces, high levels of virtualisation using COTS and high levels of interoperability between vendors and manufacturers of the various functional blocks comprising the RAN. Some level of interworking between 3GPP and the O-RAN alliance is in place, but full harmonisation between the various standards and architectures is not currently in evidence.
Any increase in the software component or environment of a network will increase the Threat Surface by simply increasing the potential attack vectors of the various functional blocks and physical interfaces. V-RAN has a more tightly defined architecture and fewer interfaces than O-RAN, and so it will have a smaller Threat Surface. The O-RAN alliance has taken significant steps to improve security by reducing the Threat Surface, but this work is ongoing and will potentially require additional standards or protective interworking functionality. Additionally, the decoupling of software from dedicated hardware and introducing COTS type hardware platforms will potentially further increase the Threat Surface.
Security within the “Open Front Haul” standards of O-RAN (“Lower Layer Split” or “LLS”) relies on a deployment of eCPRI (CPRI Corporation ‒ with CPRI standing for “Common Public Radio Interface”) so that fronthaul can be carried over ethernet technology. The higher layers of the O-RU interface are carried over eCPRI, with a number of different LLS options allowed within the standard. With multiple vendors supplying different hardware/software for the O-CU and O-DU, the management of traffic and control functionality will rest with the O-CU vendor which may raise compatibility issues between software versions of the O-DU vendor(s). It will also increase the Threat Surface northbound beyond the O-DU. The potential for attack includes changing functionality or even disabling the O-DU. It is also possible that the threat vector toward the O-CU could be increased to allowing information breach or data breach (of the network or individual customers data or real-time traffic).
The O-RAN alliance allows the use of “x-Apps” within the RIC (RAN intelligent controller). xApps are a particular construct within the O-RAN interface arrangement between the RAN and the RIC, allowing separate software vendors to provide additional features or enhancements to mobility management, admission control, interference management and advanced service types. The threat surface of xApps and the northbound and southbound interface is significantly increased due to the requirement for the network operator to manage software security ‒ including network updates ‒ more efficiently. There is also the risk that a “bad actor” might attack particular xApps due to some vulnerability in the xApp itself.
With increased virtualisation and cloud-based solutions for the RAN, the vulnerability of attack cases by increased logical and physical separation will grow. This “chain of trust” will be weakened further where artificial intelligence is used to produce a “learning and self-healing” environment, to further uncouple the logical and physical layers. Typically, telecoms networks are required to operate with an “all reasons” reliability and availability of 99.999%. Increases in the Threat Surface under O-RAN also increase the risk of unplanned service outage, due to the virtualisation/cloud-based nature of the supporting hardware as well as potential interworking issues between basic functionality required by RAN and the interaction with xApps within the virtualised environment.
The 3GPP approach has a more tightly defined architecture and is
intrinsically more secure.

Mobile Services, Spectrum and Network Evolution to 2025
C:\Users\stefa\Dropbox\Projects\Huawei Spectrum Evolution Jan 2021\Deliverables\Desseminatation\Mobile Spectrum and Network Evolution to 2025 - Coleago - 24 Mar
© copyright Coleago 2021 66
5.2.5 Synthesis: should industry back O-RAN or the 3GPP approach?
When considering the differences between the various approaches to deploying a more “Open RAN”, infrastructure network operators must consider the potential technology risk versus the potential cost impact. What is certain is that compliance with global standards will always reduce the total cost of infrastructure ownership for network operators in the medium to long term compared with bespoke or “national standard” infrastructure which may only be available for a short period or from a limited number of vendors.
What is certain is that the major global standard body for wide area wireless networks today is the 3GPP organisation, which is itself an evolution from the GSM standards body from the year 1982. As such, the 3GPP organisation can trace its history back 38 years and currently comprises all public network operators and all major infrastructure vendors as well as most minor infrastructure vendors in the world today. 3GPP specified an open RAN recommendation from standards release 15. As of July 2020, there were 92 major network operators using this version of open RAN globally47. Following 3GPP release 15, additional functionality for the disaggregation of various elements of RAN entities has been added to the standardisation process with further functionality and interfaces currently being considered.
The open RAN alliance (O-RAN) in comparison is an organisation designed to provide standards to accelerate the disaggregation of the RAN over and above what is provided by 3GPP, by changing the RAN architecture and allowing additional interfaces. The O-RAN alliance was founded in the year 2018 by a group of major network operators including AT&T, China Mobile, Deutsche Telecom, NTT and Orange and is registered in Germany. Since inception, the O-RAN alliance has increased to 27 major network operators, but the only two major infrastructure vendors have become members (one of which being Nokia). While a large number of middle tier IP type vendors have joined the O-RAN alliance, including software vendors supporting “Open Source” software, O-RAN has less scale than the 3GPP-led Open RAN initiative.
With any new standards organisation, there is a drive to enlist manufactures, vendors and integrators to use these standards and produce the requisite hardware/software. These vendors then need to compete in the normal market-place for customers (network operators) to purchase these products and deploy them into working systems as much lower “total cost of ownership” for network operators. In order to ensure a strong pipeline for new products there needs to be an equally strong volume of market sales for O-RAN software/hardware, which will be in direct competition with 3GPP standards-based software/hardware for open RAN. It is likely that the O-RAN architecture will be in direct competition with the 3GPP open RAN architecture which has a well-established customer base. In the event that O-RAN software/hardware does not achieve sufficient volume of sales, the “economy of scale” paradigm will mean that the 3GPP standards-based software/hardware will become cheaper from a “total cost of ownership” perspective, taking integration costs, software-support as well as function-by-value costs into account.
Furthermore, existing networks universally comply with 3GPP standards and recommendations, so to move to an O-RAN alliance architecture would also require operators to acquire new skill-sets outside of the hardened 3GPP forums and expert groups. To take this risk, network operators would need to experience significant cost saving by deploying O-RAN ‒ say, 50% compared to 3GPP networks. Historically the risk to network operators of using non-global standards-based equipment for multi-year deployments of infrastructure has shown that non-global standards-based equipment tend to become more expensive within 5 years.
Also, the technology risk of non-global standards-based equipment is significant ‒ the so-called “bleeding edge” of technology. In the short term, equipment based on O-RAN standards will need to be integrated with 3GPP entities including the core network,
47 Source: Ericsson report “What policy makers need to know about open RAN”, August 2020.
Our view is that the 3GPP approach may gain greater global acceptance
(hence scale) and offer a better balance between security and
opportunities to reduce RAN total costs of ownership.
Mobile Services, Spectrum and Network Evolution to 2025
C:\Users\stefa\Dropbox\Projects\Huawei Spectrum Evolution Jan 2021\Deliverables\Desseminatation\Mobile Spectrum and Network Evolution to 2025 - Coleago - 24 Mar
© copyright Coleago 2021 67
some elements of the RF entities, as well as some elements of the baseband RAN entities. This integration is unlikely to be trouble-free, and the longer this takes, the less cost-effective O-RAN equipment will become to network operators (as they will be forced to buy 3GPP RAN equipment to cover the traffic growth during any O-RAN delay). Network operators who are looking for a “clean” interface-point for 5G O-RAN, where the new RAN will be an overlay of previous generation equipment, will be forced to deploy this new 5G layer in “stand alone” mode with the existing 4G core network. This will increase the initial capital burden to the business, compared to “non-stand alone” mode of operation where initially the 5G RAN layer will use the 4G core network.
As IP based networks become the dominant “network of networks” and an increasing amount of network logical entities become virtual and “disaggregated” from dedicated hardware or data-centres, the issue of internet security becomes especially significant. Also, the larger the number of exposed interfaces to IP networks, the greater the security risk of these interfaces becoming compromised or controlled by “bad actors” who seek to disrupt, monitor or control both customer communications and the business of the network operators.
Most network operators rely on the vendors/manufacturers of key network entities to advise on security and integration of the equipment supplied by the individual vendors. The vendors, in turn, will provide this “overhead” service as long as they are either:
Making sufficient sales to allow this service to be “free” to the operator; or
They can charge for the service (which would only cover their own equipment).
In the case of the O-RAN alliance, the basis for the disaggregation is always that network operators can “pick and mix” from a large number of independent vendors for various network logical entities and this competition will reduce prices. However, where vendors only support a small number of logical entities in any given network operator’s infrastructure, there potential for conflict when a security breach is discovered and the root-cause of this is uncertain. There could be potentially 10’s of vendors all providing different software running on virtual machines in a disaggregated arrangement, with none having any form of network responsibility.
On balance, our view is that the 3GPP approach provides a better balance between risks and opportunities to drive extra reductions in total RAN costs of ownership.
5.3 Increasing the efficiency of spectrum use
Spectrum being a scarce resource, it is incumbent on licence-holders to use it efficiently. There are two key criteria by which efficiency can be assessed in this context. The first relates to network performance, as experienced by mobile users. The second relates to cost-effectiveness of network deployments. For example, efficiency of spectrum use may be deemed to have increased if:
Throughputs in Mbit/s per MHz per site are higher; and/or
Total spectrum-related costs per Mbit/s are lower.
5G already improves on the capacity and performance per MHz achievable with 4G, for a given configuration. There are three main areas in which further efficiency gains may be pursued:
The first incudes technology enhancements, such as sectorisation and higher-order MIMO deployments;
The second consists in the deployment of wider logical channels, which improves performance and capacity per MHz by increasing trunking efficiency and reducing total signalling overheads;

Mobile Services, Spectrum and Network Evolution to 2025
C:\Users\stefa\Dropbox\Projects\Huawei Spectrum Evolution Jan 2021\Deliverables\Desseminatation\Mobile Spectrum and Network Evolution to 2025 - Coleago - 24 Mar
© copyright Coleago 2021 68
The third, finally, would involve the reorganisation of paired spectrum bands to enable transmission in TDD mode.
Measures that increase throughputs per MHz tend also to be cost effective. For example, implementing MIMO enhancements tends to deliver more capacity per dollar than rolling out new sites (see section 3.4.1). While wide-band deployments already improve performance, they are also extremely cost effective (see section 5.3.4 below, and Exhibit 59 in particular).
5.3.1 Sectorisation and MIMO enhancements
Site capacity can be extended by increasing the number of sectors, and/or deploying higher-order MIMO antennas and beam-forming systems.
Adding a 4th sector to a 3-sector site may extend the effective site capacity from a given band by around 40%48. This result (in excess of the one-third increase in the number of sectors) is due to the uneven distribution of traffic across the site.
Sectorisation and higher-order MIMO both support 4G and 5G. Accordingly, massive MIMO will help address the growing demand for 4G capacity in the near term, while providing future 5G air-interface functions that can be activated through software upgrades.
A conservative rule of thumb is that each doubling of the MIMO order above 4x4 MIMO (i.e. doubling of the transmit and receive antennas on each sector) increases capacity by a factor of around 1.3x. For example, 64x64 order MIMO (‘massive MIMO’) can generate over 3.3x more capacity per MHz than a 2x2 MIMO configuration (the base for 4G and 5G)49. Some operators and vendors are more optimistic about the MIMO uplift. For example, Huawei anticipate that 32x32 MIMO in FDD bands would yield 5x the downlink throughput of 2x2 MIMO, and that 64x64 MIMO in TDD bands yields 3.7x the throughput of 8x8 MIMO.
Given that lower band antennas are larger and due to space limitations on sites, increased sectorisation is easier to implement in mid- and high bands. The same is true for higher MIMO orders, albeit 4x4 is now feasible in sub1GHz bands, as outlined below.
Higher order MIMO in sub1GHz
Cell-edge users, especially indoors, impose a disproportionate burden on mobile networks. Because they often cannot be reached with the higher bands, they tend to cause low-band congestion and reduced overall quality. Even though smartphones can only support two low-band antennas (due to size constraints), deploying 4x4 MIMO technology in sub-1GHz spectrum allows MNOs to dramatically increase cell-edge capacity and performance.
When low- plus mid-band spectrum is co-deployed, as is common in urban areas, the proportion of low-band resources absorbed by cell-edge users is typically higher. This is because users that are closer to the centre of the cell mostly camp on mid-band, which has higher camping priority than low band. Tests performed on commercial 900 MHz plus 1800 MHz LTE networks suggest that in this scenario, low-band 4x4 MIMO can produce a net gain of 62% in 900 MHz average capacity relative to 2x2 MIMO.
48 Source: Coleago discussions with operators. 49 We assume a downlink throughput of 1.8 bit/s/Hz for 2x2 MIMO and 2.2 bit/s/Hz for 4x4
MIMO. 64 represents a 4-fold doubling of 4. The capacity per Hz for 64x64 MIMO is calculated as 1.3×1.3×1.3×1.3×2.2 =6.0 bit/s//Hz which is 3.3x that for 2x2 MIMO. The 1.3x multiplier reflects a view expressed to us by the GSMA.
4x4 order MIMO is now viable in sub1GHz spectrum, significantly increasing low-band capacity per
MHz and improving cell-edge performance.

Mobile Services, Spectrum and Network Evolution to 2025
C:\Users\stefa\Dropbox\Projects\Huawei Spectrum Evolution Jan 2021\Deliverables\Desseminatation\Mobile Spectrum and Network Evolution to 2025 - Coleago - 24 Mar
© copyright Coleago 2021 69
Exhibit 54: Commercial LTE 900 MHz: 4x4 MIMO versus 2x2 MIMO
Source: Huawei
Such gains are important, given that low-band spectrum is the most scarce, and because low-band resources typically carry a disproportionate amount of traffic per unit of deployed capacity. Crowdsourced network data published by Tutela suggests that low bands carry around a third of all 4G traffic50.
It is anticipated that up to 8x8 MIMO will become available for sub-1GHz FDD bands between 2020 and 2025, which would deliver yet further gains.
Massive MIMO in higher bands
In practice, Massive MIMO (e.g. 32x32 or 64x64) can only be deployed in mid and high bands. In higher TDD bands in particular, the capacity gains are immense.
TDD already delivers higher spectral efficiency compared to FDD because it allows a better balance of network resources reflecting the dominance of downlink traffic compared to uplink. In FDD mode spectrum is split equally between downlink and uplink which assumes that traffic will also be split equally. However, downlink traffic is typically between 4 times and 8 times greater than uplink traffic which makes the uplink spectrum heavily under capacity. In TDD mode, the traffic split between downlink and uplink can be set under software control to reflect customer behaviour. Typically, TDD systems are split 4:1 in favour of the downlink.
In this mode of operation, and allowing for a ‘guard period’ between downlink and uplink transmission, the downlink receives 3/5th of network resources, whereas under FDD, the downlink receives 50% of resources. Thus, 5G TDD would allow 20% more downlink traffic to be carried per Hz than 4G FDD with the same MIMO order51.
With 64x64MIMO, the potential capacity from 400 MHz TDD in the 3.4-3.8GHz range could be 1.5x that from all the other bands between 700 MHz and 2.6GHz in the ITU Region 1 band-plan52. Hence while the 3.5GHz band accounts for around a third of the bandwidth in MHz, it could account for 60% of capacity on a macro site.
50 Based on data published by Tutela covering the US, UK, Germany, Switzerland and Austria. The arithmetic mean proportion of 4G traffic carried by sub-1GHz spectrum in each of these markets ranged between 21% and 45%, with a sample mean of 32% and median of 34%. See https://www.tutela.com/blog.
51 60% available for downlink is 20% more than 50% available for downlink under FDD. 52 For this analysis, we assume 5G deployment across all bands and that MIMO 64x64 is
deployed in the TDD bands, MIMO 4x4 in the mid FDD bands, and MIMO 2x2 in sub-1GHz
The 3.5GHz band accounts for around a third of current bandwidth,
but with massive MIMO, it could deliver over 60% of capacity between
700 MHz and 3.8GHz

Mobile Services, Spectrum and Network Evolution to 2025
C:\Users\stefa\Dropbox\Projects\Huawei Spectrum Evolution Jan 2021\Deliverables\Desseminatation\Mobile Spectrum and Network Evolution to 2025 - Coleago - 24 Mar
© copyright Coleago 2021 70
Exhibit 55: Relative bandwidth and capacity by band
Source: Coleago
With massive MIMO, it is also possible to trade off higher data throughputs for improved coverage in metropolitan areas. This allows 3.4-3.8GHz spectrum to emulate the propagation characteristics of mid-band spectrum such as 1800 MHz and 2100 MHz within multi-path RF environments. (Outside metropolitan areas, the coverage gains are limited because there is less scope for MIMO to exploit multi-path conditions.)
MIMO evolution 2020-2025
While the illustration provided above assumes 64x64 as the highest MIMO order, 128x128 order MIMO is anticipated by 2025, with 256x256 order as a further development step beyond this horizon. The latter will help address growth in demand for capacity beyond 2025.
bands. 700MHz SDL is excluded from our calculations. The downlink throughputs assumed for each band are as per Exhibit 77 in section 6.3.1.
35.9%
60.0%
0%
10%
20%
30%
40%
50%
60%
70%
80%
90%
100%
% MHz % Capacity
% o
f tot
al
3500MHz 2600MHz 2300MHz 2100MHz 1800MHz
1500MHz 900MHz 800MHz 700MHz
Massive MIMO allows the trading-off of some of the extra capacity for
significantly improved coverage in metropolitan areas.

Mobile Services, Spectrum and Network Evolution to 2025
C:\Users\stefa\Dropbox\Projects\Huawei Spectrum Evolution Jan 2021\Deliverables\Desseminatation\Mobile Spectrum and Network Evolution to 2025 - Coleago - 24 Mar
© copyright Coleago 2021 71
Exhibit 56: Huawei MIMO evolution roadmap
Source: Huawei
5.3.2 Creating wider logical channels through Carrier Aggregation
Carrier Aggregation (CA) was first developed as an add-on for LTE but is a now a fundamental part of 5G development including infrastructure, handsets and devices. CA differs from traditional cellular techniques such as a layered cell hierarchy in that the RF channels can be combined within the data paradigm to appear as a single logical channel rather than individual channels where the handset needs to switch between the different frequencies. In this way handsets and devices can access all of the bandwidth across a CA group rather than have to switch between narrow channels which happen to radiate from the same cell site. From 3GPP release 12 CA has been standardised for both FDD and TDD within the same channel group prior to this CA was only available for RF carriers in the same Sync domain either FDD or TDD.
What is certain is that spectrum allocation within the various bands becomes more efficient is operators are allocated contiguous spectrum. In the case for sub 1Ghz spectrum for example in the 900 MHz band an operators having 2 “slots” of 5 MHz FDD each will have significant capacity limitations compared to an operator having a single slot of 10 MHz FDD. In this example the operator with 2 slots will need to deploy RF band edge filters to 4 band edges (two edges to each spectrum slot). The operator with a single slot would only need to deploy RF filters to two band edges. Each band edge filter will reduce the RF channel performance and so reduce its data carrying capacity and so the delivered data rate of the operator with two slots could be reduced by over 10% (permissive band edge mask) compared to the operator with a single slot.
CA capability needs to be in both the cell site and the customer handset/device to obtain the increased data carrying capabilities. Typically, handsets/devices can support up to 5 spectrum bands (component carriers) within the same CA group but older handsets may only be able to accept up to 3 component carriers in any group,
The benefits of CA remain the same, independently of the handset capability. Each component carrier in the CA group can provide a data carrying capability based on its bandwidth and propagation characteristics of the radio link. Each component carrier will therefore be additive to the overall data rate experienced by the handset/device for
Carrier Aggregation is purely about boosting data speed performance ‒ it
does not improve overall network capacity or coverage.

Mobile Services, Spectrum and Network Evolution to 2025
C:\Users\stefa\Dropbox\Projects\Huawei Spectrum Evolution Jan 2021\Deliverables\Desseminatation\Mobile Spectrum and Network Evolution to 2025 - Coleago - 24 Mar
© copyright Coleago 2021 72
the particular radio performance experienced by the handset. By way of example, consider a handset able to use a three-component carrier group:
Exhibit 57: Carrier aggregation example
Frequency Total bandwidth Max downlink data rate53
Delivered data rate (RF path)
900 MHz 2x10 MHz 100Mbit/s 90Mbit/s
1800 MHz 2x20 MHz 200Mbit/s 170Mbit/s
3500 MHz 50 MHz 300Mbit/s 300Mbit/s
Total delivered data rate to the handset/device 560Mbit/s
Source: Coleago
The delivered data rate to the device is less than the maximum for FDD spectrum, due to propagation changes across the cell. For TDD, the delivered rate is the same as the maximum, because TDD either works perfectly or not at all. In the worked example above, the CA group is able to deliver a downlink customer experience of 560Mbit/s. Without carrier aggregation, the maximum downlink customer experience would be 300Mbit/s, if the handset was “camped” on the 3500 MHz component carrier, or only 90Mbit/s if the handset was camped on the 900 MHz component carrier.
The resulting performance benefits require no additional to RAN infrastructure, albeit there is an incremental cost of CA software within each cell-site or baseband site.
5.3.3 Wide-band deployment versus Carrier Aggregation
Notwithstanding the benefits of CA, it is still better to deploy wider RF channels across larger chunks of contiguous spectrum in fewer bands. Combining a higher number of narrow RF channels (yielding the same total bandwidth), thus relying more heavily on CA, is less efficient.
Exhibit 58: Comparison 100 MHz contiguous vs two 50 MHz blocks
100 MHz 50 + 50 MHz
Complexity Single carrier Needs intra-band CA
Channel utilisation 98.3% 95.8%
Physical layer signalling 6.3% overhead Approx. 12% overhead
Physical layer configuration
A single 100 MHz carrier offers more flexibility than 2x50 MHz carriers to configure sub-bands within the carrier
Carrier activation / deactivation delay
2ms 10ms
BS implementation Requires one radio unit only
May need two radio units
Spectrum management Guard bands may be required if networks are unsynchronised
Two additional guard bands if networks are unsynchronised
UL support No CA required in the UL Uplink CA may not be supported by all UEs
UE consumption 30mA additional power consumption for the second CC (50-90% RF power increase over the non-CA case)
53 Assuming a gross throughput of 10bps per Hz. For TDD, we assume a DDDSU sequencing (where D is a downlink timeslot, U an uplink slot, and S stands for ‘Special’ or ‘Signal’) ‒i.e. there are 3 downlink (DL) slots for every uplink (UL) slot.
It is more efficient spectrally and more cost-effective to rely on consolidated
spectrum holdings, where possible, than on Carrier Aggregation.

Mobile Services, Spectrum and Network Evolution to 2025
C:\Users\stefa\Dropbox\Projects\Huawei Spectrum Evolution Jan 2021\Deliverables\Desseminatation\Mobile Spectrum and Network Evolution to 2025 - Coleago - 24 Mar
© copyright Coleago 2021 73
Source: ECC Report 287, Guidance on defragmentation of the frequency band 3400-3800 MHz, October 2018, page 44
For example, aggregating separate blocks (narrow channels) of spectrum in the same band would lead to a loss of around 15-20% in total capacity per MHz54. This is due to an aggregate data-rate loss of approx. 6.5% due to additional signalling overheads and between 15% and 20% due to the effects of having four Band-Edge-Mask (BEM) filter restrictions (two for each carrier) as opposed to just two for a single wide band channel. Implementing CA in a given band also adds to overall capex and opex. Accordingly, deploying a single channel across contiguous bandwidth leads to a lower BEM loss (of between 3 and 5%), a higher spectral efficiency, as well as higher cost efficiency.
Note that total costs for operators also matter, as outlined in section 3: the investment case for operators can be precarious, and a sustainable industry is needed to maximise the socio-economic benefits from mobile communications now and in the future. For these reasons, both spectral and cost efficiency need to be considered.
5.3.4 Impact of wide-band deployment on network costs
Economic benefit of 100 MHz channel bandwidth
From a network cost perspective, the wider the channel that is deployed in a single radio, the lower the cost per MHz deployed, and therefore implicitly the cost per bit. Deploying technology enhancements such as sectorisation and higher-order MIMO is also much more cost effective over wider allocations ‒ as the cost of these enhancements is broadly the same, whether the channel is narrow or wide.
Exhibit 59 below illustrates the cost per bit depending on the amount of spectrum deployed in a single radio. We have made the following assumptions with regards to the total cost of ownership (TCO) of deploying a 3.5 GHz radio on an existing cell site. If 100 MHz is deployed in a single radio, the cost per MHz deployed can be up to 70% lower compared to, for example, a typical deployment in a 20 MHz wide channel. Deploying upper mid-bands spectrum with massive MIMO in a 100 MHz wide channel maximises spectral efficiency which is a key objective for operators and regulators.
Exhibit 59: Cost per bit depending on channel bandwidth
Source: Coleago Consulting
54 Source: Coleago discussions with operators and equipment vendors.
0
20
40
60
80
100
120
0
10
20
30
40
50
60
70
80
90
100
20MHz
30MHz
40MHz
50MHz
60MHz
70MHz
80MHz
90MHz
100MHz
TC
O index
Cos
t per
bit
Inde
x 20
MH
z =
100
Cost Index Cost per bit
Wide-band deployments are far more cost-effective, especially when
massive MIMO is implemented.

Mobile Services, Spectrum and Network Evolution to 2025
C:\Users\stefa\Dropbox\Projects\Huawei Spectrum Evolution Jan 2021\Deliverables\Desseminatation\Mobile Spectrum and Network Evolution to 2025 - Coleago - 24 Mar
© copyright Coleago 2021 74
Beyond contiguous allocations of 100MHz (2025-2030)
Equipment suppliers strive to allow their 5G radios ‒ including those implementing massive MIMO and beamforming ‒ to operate with the widest possible channel bandwidth (“instantaneous bandwidth”) and also to make these “tunable” in the widest possible frequency range (“operating bandwidth”).
5G radios that are now deployed in 3400-3800 MHz band are starting to operate at an “instantaneous bandwidth” of 100 MHz within a 400 MHz “operating bandwidth”.
The ongoing research (e.g. for filters and power amplifiers) will allow larger instantaneous and operating bandwidths by 2025-2030.This means that future radios will aim at larger instantaneous bandwidths (e.g. 200 to 400 MHz)55 and at operating bandwidths that will be larger than 400MHz. Operators will therefore be able to operate significantly larger instantaneous channel bandwidths (contiguous or non-contiguous) within the same mid-bands.
If 300 MHz is deployed in a single radio, the cost per MHz deployed is 43% lower compared to a deployment in only 100MHz. Therefore the allocation of 200 to 300 MHz of contiguous spectrum per operator would result in significant economic benefits.
Exhibit 60: Cost per bit with per operator allocation of over 100 MHz
Source: Coleago Consulting
5.3.5 Enabling wide-band deployment through spectrum consolidation
Historically, multiple operators have each been assigned relatively small amounts of spectrum in multiple bands. These legacy holdings could be consolidated through multilateral spectrum trading between operators, or by pooling and sharing usage rights (as discussed in section 5.5). This would allow each to improve overall channel performance while avoiding the cost of maintaining antennas and equipment for more bands than necessary.
In a four-player market, for example, the total of 120 MHz (uplink plus downlink) available at 700 MHz plus 800 MHz in ITU Region 1 could be split into two allocations of 40 MHz each at 700 MHz to two operators, with 40 MHz each at 800 MHz to the
55 Note that at the moment 3GPP specifications only support 100MHz channel bandwidth. Multiple 100MHz carriers can be aggregated (5G carrier aggregation of up to four 100MHz carriers is possible today). If such carriers are contiguous, carrier aggregation can be performed within the same single radio, cost-effectively.
0
20
40
60
80
100
120
140
160
180
0
10
20
30
40
50
60
70
80
90
100
100 MHz 200 MHz 300 MHz
Total cost of ow
nership index
Cos
t per
bit
Inde
x 20
MH
z =
100
Cost Index Cost per bit

Mobile Services, Spectrum and Network Evolution to 2025
C:\Users\stefa\Dropbox\Projects\Huawei Spectrum Evolution Jan 2021\Deliverables\Desseminatation\Mobile Spectrum and Network Evolution to 2025 - Coleago - 24 Mar
© copyright Coleago 2021 75
other two. This would allow each of the operators to deploy efficient 40 MHz channels in a single band (avoiding inefficient deployments across both bands).
In a three-player market, partial consolidation could result in two operators each holding 40 MHz in either 700 MHz or 800 MHz, with the third operator maintaining 40 MHz split equally across both bands. This would leave the third operator at a comparative disadvantage (albeit this might be redressed in other bands or through other means). However, if we include equal initial holdings of 23.2 MHz each at 900 MHz, again in line with the ITU Region 1 band-plan, a higher degree of consolidation is possible, as illustrated below.
Exhibit 61: Low-band consolidation in a 3-player market (illustration)
Source: Coleago, assuming an ITU Region 1 band-plan
In this example, full low-band consolidation could be realised both efficiently and equitably by sharing a residual block of 9.6 MHz at 900 MHz. This could be used to support legacy 2G and/or 3G handsets and M2M devices deployed in the field.
Spectrum consolidation would also be highly desirable in lower mid-bands such as 1800MHz, 2100MHz and 2600MHz, where operators often hold 20MHz or less in each.
Future fragmentation may be avoided by packaging spectrum in larger, contiguous chunks when awarding new usage rights. In an auction for 3.4-3.8GHz spectrum, for example, allocations of less than 40 MHz could be excluded from any winning configuration ‒ to ensure all available resources in this band can be used efficiently. Allowing the pooling and sharing of incremental usage rights is a further option.
Note that spectrum consolidation does not necessarily exclude CA: there could still be room to improve performance by aggregating holdings across bands that contain less than 100 MHz. Baring lower mid-band consolidation, CA is likely to be required across the 1800MHz, 2100MHz and 2600MHz bands, to boost the customer speed experience ‒ albeit spectrum consolidation would be more efficient.
20MHz at 700MHz 20MHz at 800MHz 23.2 MHz at 900MHz
20MHz at 700MHz 20MHz at 800MHz 23.2 MHz at 900MHz
20MHz at 700MHz 20MHz at 800MHz 23.2 MHz at 900MHz
40MHz at 700MHz 23.2 MHz at 900MHz
40MHz at 800MHz 23.2 MHz at 900MHz
20MHz at 700MHz 20MHz at 800MHz 23.2 MHz at 900MHz
60MHz at 700MHz
60MHz at 800MHz
60MHz at 900MHz
Shared9.6 MHz
at 900MHz
Operator A
Operator B
Operator C
Operator A
Operator B
Operator C
Operator A
Operator B
Operator C
+
Initial assignments (fragmented)
Partial low-band consolidation
Full low-band consolidation
Spectrum consolidation would be highly desirable in lower mid-bands
too, where operators often hold small amounts across 1800MHz, 2100MHz
and 2600MHz.
Barring widespread spectrum consolidation, Carrier Aggregation is likely still to be required across some
spectrum holdings to boost speed performance.

Mobile Services, Spectrum and Network Evolution to 2025
C:\Users\stefa\Dropbox\Projects\Huawei Spectrum Evolution Jan 2021\Deliverables\Desseminatation\Mobile Spectrum and Network Evolution to 2025 - Coleago - 24 Mar
© copyright Coleago 2021 76
5.3.6 Reorganising paired spectrum into TDD bands
Reorganising paired spectrum into TDD bands could deliver a significant boost in overall capacity. As outlined in section 5.3.1, downlink throughput per MHz in TDD mode may be 20% higher than maximum downlink throughput in FDD mode, for a given MIMO order. Furthermore, the general MIMO configuration for higher mid-band TDD spectrum will be 128x128 by 2025, versus 32x32 for equivalent FDD spectrum (see Exhibit 56).
Improved efficiency could be realised by converting mid as well as low FDD bands to TDD, albeit the case is strongest in the 2600 MHz band. In ITU Region 1, this band is split between 2x70 MHz of paired spectrum and 50 MHz of TDD spectrum. Deploying MIMO enhancements of a given order across both FDD and TDD portions generates less of a performance and capacity uplift, and is less cost-effective, than deploying the same MIMO order over wider allocations in TDD only. In addition, converting the full band to TDD would remove the need for a 5MHz guard-band between the FDD and TDD portions.
5.4 Network densification: macro sites versus small cells
Securing additional spectrum and implementing technology enhancements to raise efficiency will help increase network capacity. In all likelihood however, significant network densification will also be required.
Densification may be achieved by rolling out additional macro sites, small cells, or a combination of the two. The unit cost per small cell is typically far lower than that for a macro site, but far more small cells are required to deliver capacity across a given area. One FCC commissioner recently estimated that the US needs 800,000 small cells to make 5G a reality, while the International Data Corporation (IDC) expects over two million by 202156.
A tale of two networks
Exhibit 62 provides a real-life example of a small-cell versus macro-site focused network strategy. The screenshot is taken from a residential area within Vancouver, where Telus is rolling out a dense network of small cells, typically mounted on utility poles along the street (see the inset picture). The majority of these operate a single band (2100MHz), with a number dual-band (1900MHz and 2100MHz).
Rogers’ network, in contrast, consists in a far smaller number of macro sites, mostly with a 5-band configuration.
56 Source: https://techhq.com/2020/01/why-a-5g-powered-future-needs-a-small-cell-revolution/.
Converting the paired (FDD) spectrum to TDD could lead to significantly improved spectral
efficiency and would allow higher order MIMO deployments.
Reassigning the full 2600MHz band to TDD would yield the added
benefits of more cost-effective MIMO deployment, and would remove the
need for a 5MHz guard-band.
Between 800,000 and 2 million small cells may be required to make 5G a
reality in the US.

Mobile Services, Spectrum and Network Evolution to 2025
C:\Users\stefa\Dropbox\Projects\Huawei Spectrum Evolution Jan 2021\Deliverables\Desseminatation\Mobile Spectrum and Network Evolution to 2025 - Coleago - 24 Mar
© copyright Coleago 2021 77
Exhibit 62: Telus versus Rogers networks (Vancouver snapshot)
Sources: Coleago, ertyu.org (as of 6 January 2021); inset image from Google streetview
Small cells planning constraints: North America versus Europe
While small cells are central to the strategies of some operators in North America, they only form part of a tiny proportion of the total site count in Europe. A key issue in most European countries is that as with macro sites, gaining planning approval for a small site remains a lengthy and costly process. This reduces the net relative benefit of small cells.
In 2018, the US ‘5G Fast Plan’ was introduced to further ease planning and permitting issues. Key provisions include:
Reducing State and local government response periods to 60 days to review a proposed collocation on an existing structure, and 90 days to review an application to erect a new structure;
Exclusion of small cells from the Environmental Policy Act and the Preservation Act; and
Restrictions on the fees charged by local government for access to public assets.
In the UK, regulations limiting the real-estate rents landlords can charge for mobile network sites had already been introduced in 2017, intended to reducing network operating costs and thus allow operators to redirect funds towards wider network expansion57. While this ‘code’ was initially aimed at macro sites, it remains relevant in the small-cells domain. More recently, the Department of Culture, Media and Sports (DCMS) launched a ‘5G Barrier-busting Taskforce’, to promote best practices across local government. Unlike in the US however, the UK government is not seeking to impose changes to local planning regulations.
In June 2020, the EU Commission adopted a new Implementing Regulation on small-area wireless access points, or small antennas, which “are crucial for the timely deployment of 5G networks that are delivering high-capacity and increased coverage as well as advanced connection speeds. The Regulation specifies the physical and technical characteristics of small cells for 5G networks. It aims to help simplify and accelerate 5G network installations, which should be facilitated through a permit-exempt deployment regime, while ensuring that national authorities keep oversight”58.
57 See https://www.batchellermonkhouse.com/telecoms-code/. 58 See https://ec.europa.eu/digital-single-market/en/news/commission-adopts-implementing-
regulation-pave-way-high-capacity-5g-network-infrastructure.

Mobile Services, Spectrum and Network Evolution to 2025
C:\Users\stefa\Dropbox\Projects\Huawei Spectrum Evolution Jan 2021\Deliverables\Desseminatation\Mobile Spectrum and Network Evolution to 2025 - Coleago - 24 Mar
© copyright Coleago 2021 78
If the planning cycle for small cells can indeed be accelerated and if site-rental costs for small cells can be kept to a minimum, small cells should feature more prominently in the 5G strategies of European operators too.
The future: tiny cells?
Given the rapid pace with which technologies are currently evolving, one might imagine self-configuring, low-power ‘tiny cells’ making their appearance within the next 5-10 years. Mass production of these would result in very low unit costs. Their mass deployment would provide high levels of redundancy, with tiny cells adjusting their emission patterns as modules appear or disappear within their neighbourhood. These might rely on microwave both at the air-interface and for in-band backhaul, via other tiny-cells, to fibre-connected master sites.
Given that they would not depend on traditional fibre or fixed microwave links, they would be easy and cheap to install by non-specialists. Because they would cost so little, maintenance would be confined to replacement (rather than repair) in the event of breakdown.
The industry has already witnessed many astonishing developments over very short timeframes. It remains our expectation that further surprises lie ahead.
5.5 Evolution of mobile asset sharing
Pooling assets and sharing network costs generates savings while reducing total capital employed, leading to higher returns on invested capital (ROIC). This makes it more likely that operators will earn their cost of capital (the required reward for placing capital at risk).
Conversely, sharing a single network in non-commercially viable remote areas may enable network coverage expansion which would otherwise be prohibitively expensive. This is the logic behind the recent Shared Rural Network (SRN) initiative in the UK, which is intended to address coverage blackspots primarily in rural areas. The GSMA has also actively advocated for policy measures (including allowing extensive rural sharing of mobile assets) to promote mobile coverage expansion in emerging markets, to help address the digital divide59.
There are numerous forms of mobile asset and cost sharing, each trading off different levels of operational and strategic flexibility against financial savings. Emerging neutral host models, discussed further below, represent a potentially important development in this field.
5.5.1 Traditional forms of network and spectrum sharing
The most basic form of asset sharing is simple co-location, either on a rival’s site or on a mast owned by an independent tower company. Co-location can be agreed on an ad hoc site-by-site basis, with minimal impact on an individual operator’s strategic and operational flexibility. Savings may include:
Reduced total site acquisition and construction capex;
Reduced site rental opex per operator (even though landlords may increase total rental fees when they host additional equipment), and shared site security expenses.
While mutual interests can drive voluntary commercial agreements between operators, site co-location provisions have sometimes been imposed by regulators to:
59 See for example ‘Enabling rural coverage: regulatory and policy recommendations to foster mobile broadband coverage in developing countries’, 2018, available at https://www.gsma.com/mobilefordevelopment/resources/enabling-rural-coverage-report/.
Mobile asset sharing increases the likelihood that operators earn their
costs of capital.
It may also enable the extension of mobile coverage into remote areas
that would otherwise be uneconomic.

Mobile Services, Spectrum and Network Evolution to 2025
C:\Users\stefa\Dropbox\Projects\Huawei Spectrum Evolution Jan 2021\Deliverables\Desseminatation\Mobile Spectrum and Network Evolution to 2025 - Coleago - 24 Mar
© copyright Coleago 2021 79
Improve cost-efficiency across the market;
Help reduce the total number of distinct radio sites in the market, to limit the environmental impact; and/or
To facilitate network deployment by later market entrants, who might otherwise struggle to identify suitable site locations in more saturated markets.
Passive sharing may also extend to power provision, backhaul transmission, and passive antenna systems.
Active RAN sharing
More extensive forms of RAN sharing include sharing active equipment and antenna systems. These may be limited to a given technology (e.g. the original RAN sharing agreement between EE and H3G in the UK only covered 3G) or may be limited to certain spectrum bands. Added savings may include:
Equipment capex; and
Maintenance opex.
However, active RAN sharing is more intrusive, can involve competition issues, and often involves the creation of a joint venture (JV) into which the two sharing operators may transfer existing assets. Vendor swaps and rationalisation may be pursued with a view to maximise savings, leading to a smaller number of vendors covering deployment and maintenance in different regions.
Active RAN sharing agreements may be also be limited to certain geo-types. For example, the deal agreed between SFR and Bouygues in France in 2014 covered 57% of the population and excluded metropolitan centres. The opposite (i.e. urban-only sharing) is also conceivable.
Active RAN JVs are hard to negotiate, and difficult as well as costly to exit if the relationship between the sharing partners sours. The operational and strategic constraints placed on each operator by the terms of the JV may easily become unduly onerous as the market, regulatory, spectrum and technology landscape evolves.
Spectrum sharing
Deploying the equipment and antenna systems to support a spectrum band is expensive, but deploying more (contiguous) MHz in the same band adds little to the costs. Accordingly, pooling individual allocations in each band on shared equipment can generate significant cost savings for all involved operators.
Pooling spectrum can also drive improved network performance, by allowing wider channels to be deployed in a given band. Indeed, as discussed in section 5.3.5, spectrum pooling is a form of spectrum consolidation that avoids the actual transfer of licences between operators.
The deal announced in 2009 between Tele2 and Telenor in Sweden is an early example of spectrum pooling. Under the deal, both operators agreed to build a fully shared 4G network. Historically, regulators in other jurisdictions have been more reluctant to allow spectrum sharing, on the grounds that this might leave other operators at a competitive disadvantage. However, the scope to share spectrum on a localised basis across multiple operators may allay regulatory concerns in the future. Emerging neutral-host networks may facilitate this, as discussed below.
5.5.2 Emerging neutral host networks
Independent tower companies that offer access to their civil infrastructure to all operators are effectively ‘passive neutral hosts’, and they have been around for a long time. More recently, we have started seeing the emergence of active neutral-host networks, providing coverage and capacity solutions both indoors and outdoors.
Pooling spectrum can drive significant additional cost savings and improve
overall network performance.
Active neutral hosts could pave the way for more extensive asset sharing, while avoiding the deep constraints of
bilateral network JVs.

Mobile Services, Spectrum and Network Evolution to 2025
C:\Users\stefa\Dropbox\Projects\Huawei Spectrum Evolution Jan 2021\Deliverables\Desseminatation\Mobile Spectrum and Network Evolution to 2025 - Coleago - 24 Mar
© copyright Coleago 2021 80
In particular, active neutral hosts may play a significant role in the small-cells domain, a key area of future network expansion. Neutral hosting offer a simple route to asset sharing across multiple operators on a site-by-site basis. Crucially, this may deliver substantial net cost savings while avoiding the complexities and onerous constrains of formal asset-sharing JVs.
The higher the number of tenants on an individual neutral-host asset, the greater the total savings, and the lower the charge to each operator. Active neutral hosting provides an efficient ‘back-door’ to more extensive asset sharing ‒ potentially including all existing operators on certain assets, rather than at most two in bilateral network JVs.
Towards neutral spectrum hosting
Further cost savings can be achieved under neutral spectrum hosting, under which the total number of band deployments on a site could be reduced.
Airspan subsidiary Dense Air, for example, has secured 3.5GHz spectrum rights in Ireland, Portugal and Australia, as well as 2.6GHz spectrum in Belgium and New Zealand. This allows it to offer coverage and capacity solutions to operators using its own spectrum.
However, active neutral hosts need not necessarily have their own spectrum holdings to provide a shared spectrum solution. Small cells have small coverage footprints, which could allow operators to pool spectrum locally. Provided the traffic load on an individual small cell is not too high, a single operator might conceivably make its own spectrum available to others on neutrally hosted equipment, for a fee.
There are multiple ways locally shared bandwidth could be allocated between multiple operators. A localised roaming approach is one technical possibility, albeit this may lead to cell-handover complications, albeit this is less of an issue for nomadic hot-spot users. A further option would be to partition shared bandwidth through RAN network slices, implemented at the level of individual sites.
Exhibit 63: Traditional network sharing versus Neutral Hosting
Source: Coleago
In the above illustration, adopting a Neutral Host-based infrastructure sharing model reduces the total number of sites from 6 to 4.

Mobile Services, Spectrum and Network Evolution to 2025
C:\Users\stefa\Dropbox\Projects\Huawei Spectrum Evolution Jan 2021\Deliverables\Desseminatation\Mobile Spectrum and Network Evolution to 2025 - Coleago - 24 Mar
© copyright Coleago 2021 81
5.6 Heterogeneous networks
Heterogeneous networks (hetnets) in wireless networks are a method of combining multiple frequency bands within the same cell (sector) to provide very high levels of network capacity to small geographical areas. In this configuration hetnets require full carrier aggregation between spectrum bands in the hetnet group together with enhanced handover arrangements between hetnet groups covering adjacent areas. Typical areas where hetnets may be deployed include city centres road/rail stations, airports, industrial complexes, large shopping malls, football stadia etc. Anywhere that people and connected devices can operate in small geographic areas. In these environments the wireless traffic requirement can approach 0.5Gbit/s per m2 or more for short periods. This level of data traffic taken over a moderate area of say 10m2 will require a cell capacity approaching 100Gbit/s, a large multiple of that currently available in high density cellular systems today.
Exhibit 64: A mix of bands will be needed for coverage and capacity
Source: Coleago
Hetnets will be required to deliver this increased level of customer traffic driven primarily by an increase in the number of connected devices (device proliferation) including smart-phones, pocket-hubs, tablets, IoT, M2M, smart-cities, autonomous road traffic and FWA substitution. The availability of devices at appropriate cost to the customer is critical to the uptake in data traffic. These devices will be able to access applications such as video-streaming, video-calling as well as multi-player gaming, business applications, cloud computing and increases in urban automation. It is estimated that in 2020 there were 350 billion App downloads up from 147 billion in the year 2016 (source Diligence Technology monthly report). By the year 2025 Coleago estimates as a conservative estimate that there will be 1,968 billion App downloads albeit with most downloads being used only once.
While the forecasts of data growths my differ between the various agencies, there is consensus that the customer requirements for data traffic in high customer-density environments will rise dramatically. This increase in data traffic can only be satisfied by using some form of hetnet technology. The properties of a hetnet differ from the traditional layered “hierarchical cell structure” in that a hetnet appears to the device/handset as a single connectivity channel. Layered cell structures would appear to the handset as separate logical traffic groups as opposed to a single group entity. In

Mobile Services, Spectrum and Network Evolution to 2025
C:\Users\stefa\Dropbox\Projects\Huawei Spectrum Evolution Jan 2021\Deliverables\Desseminatation\Mobile Spectrum and Network Evolution to 2025 - Coleago - 24 Mar
© copyright Coleago 2021 82
a layered structure the handset had to “handover” between these logical groups even though they were located at the same cell site. In a hetnet the different RF channels appear to the handset as a single logical connectivity group with a combined capacity rather than separate channels with a different physical capacity for each channel.
Typically hetnets will use a minimum of 3 spectrum bands of say 900 MHz, 1800 MHz and 3500 MHz, although increasingly carrier aggregation groups of 5 or more are becoming standardised. Considering the bandwidth of each spectrum band in the aggregation group there could be say, 2x10 MHz FDD in the 900 MHz band, 2x20 MHz FDD in the 1800 MHz band and 2x50 MHz TDD in the 3500 MHz band. In this configuration handsets/devices would have access to capacity across an effective 80 MHz bandwidth connectivity channel when the handset was in a strong signal area. As the handset/device moves away from the strong signal area so the effective capacity of the connectivity channel will gracefully reduce until only the 900 MHz spectrum band remains. Where two or more hetnet cells cover adjacent or near adjacent physical space using the high frequency spectrum bands then handover can occur due to dynamic traffic balancing or handset/device channel performance monitoring to ensure that the optimum connectivity channel is being used for the required performance of the handset/device.
Hetnet areas can be very specialised and demanding of specific types of application or traffic type. A typical example is this type of requirement is a large sports stadium or large entertainment venue/concert. In these areas there will be a very high density of handsets and tablet type devices with each device using multiple applications some of which will be local to the event being staged. The typical use-case in the football type event is where large numbers of people attend the event for the experience of “being there” but few will be able to see the live action except on the large screen provided by the stadium. The live action is being shown in real time using multiple cameras and this video can be live streamed to people in the stadium to enable them to observe the action as it happens. At certain times, say when a goal is scored, this can be stream-replayed to large numbers of people in the stadium from the digital “replay store” run by the stadium website/app. The live stream action can be broadcast to stadium customers using a form of eMBMS (enhanced multimedia broadcast/multicast system) as specified by 3GPP release 14 or using some form of combined SDL (supplementary downlink) arrangement to reduce the downlink requirement of the hetnet. In eMBMS mode, the downlink is transmitted to all handsets devices able to receive this using a single logical channel running at about 4Mbit/s for a 1080p video stream. However, where individual customers require either separate camera angles or replay events, this will require separate 4Mbit/s logical channels for each handset ‒ which could be 10’s of thousands of handsets in a very small area. Customers may also wish to upload video’s of their time at the football match or use interactive video communications with others within the stadium. All this will load the overall hetnet cell with multiple high-definition video channels simultaneously, and this is for a single real-time video event. While all this is going on at the theoretical football match other applications are required to be served by the same hetnet cell from other applications separate from the live action stream such as Electronic News Gathering (ENG), simple email (with attachments), social media including video calling, financial transactions (real time), multi-player gaming, security video cameras, PPDR (public protection and disaster recovery) the list of other applications requiring access may go into the thousands all required to be served by the same hetnet cell with differing levels of RTT (Round-trip time) performance requirements.
5.7 Device ecosystem
While the number of available frequency bands has increased significantly with each successive generation of mobile technology, band-support within individual devices is fast becoming a non-issue.
Band-support within individual devices is fast becoming a non-issue.

Mobile Services, Spectrum and Network Evolution to 2025
C:\Users\stefa\Dropbox\Projects\Huawei Spectrum Evolution Jan 2021\Deliverables\Desseminatation\Mobile Spectrum and Network Evolution to 2025 - Coleago - 24 Mar
© copyright Coleago 2021 83
In the 2G and 3G eras, devices tended to support bands for specific ITU regions, leading to high fragmentation of the global device market. 2G technologies in particular were split between the GSM, TDMA, CDMA and PDC (Japan) standards. At the time, handsets providing access to mobile services across all ITU Regions were a big deal.
The 3G era saw a convergence of standards to 3GPP, driving substantial global economies of scale. Since then, while different band-plans persist across different ITU Regions (as well as across individual markets), the number of bands supported within individual chipsets has grown much faster than the number of bands deployed by operators across the globe.
Exhibit 65 below shows the number of bands supported by a sample of 5G smartphones introduced in 2020.
Exhibit 65: Band support in a sample of 5G smartphones
Smartphone model Launch Nr of 4G bands No of 5G bands
iPhone 12 A2403 (RoW) Q4 2020 27 17
Samsung Galaxy Z Fold2 5G Q4 2020 21 10
Huawei P40 Pro 5G (ELS-N04) Q2 2020 22 9
Nokia 8.3 5G Q4 2020 18 13
Google Pixel 5 Q4 2020 29 13
Source: GSA
Crucially, the above models support most of the key 5G upper-mid bands such as n77 and n78 (in the 3.3-4.2GHz range) and low-bands such as n28 and n12 (700MHz) as well as n8, n5 and n20 (800-900MHz). Most available lower-mid bands are also supported. The common exception as of today is the 5G L-band (1500MHz). However, based on current trends, we may reasonably expect that all key 5G bands below 6GHz will be supported in the near-to-medium term, with widely available high-band support by 2025. Of the 198 5G smartphones listed by the GSA in January 2021, 28% explicitly support MIMO 4x4 and over half explicitly support VoLTE (Voice over LTE).
The bigger question for operators is how fast 5G-enabled devices will diffuse within their customer base. As outlined in section 2.2.1, Ericsson projects that it will take 2.5 years from 5G launch to pass the 500m adoption mark ‒ twice as fast as for 4G.
Exhibit 66: 5G versus 4G subscriptions in the first years of deployment
Source: Ericsson Mobility Report, November 2020

Mobile Services, Spectrum and Network Evolution to 2025
C:\Users\stefa\Dropbox\Projects\Huawei Spectrum Evolution Jan 2021\Deliverables\Desseminatation\Mobile Spectrum and Network Evolution to 2025 - Coleago - 24 Mar
© copyright Coleago 2021 84
The price of compatible devices is invariably an important factor influencing the rate of adoption of new mobile technologies.
Exhibit 67: Price evolution for a sample of Smartphones
Source: Coleago based on data from pricespy.co.uk
While current prices are comparatively high for 5G smartphones (e.g. $1,350 for an iPhone 12 Pro Max with 128GB memory60), several important factors should be held in mind:
The prices of new devices tend to drop rapidly after launch (see Exhibit 67 above), with the high-end devices of today quickly joining the mid-range devices of tomorrow;
Secondary markets for refurbished devices offer cheaper entry-points for consumers;
5G dongles and routers are typically cheaper than smartphones and the form-factor of routers makes it easier to include antennas supporting higher-order MIMO;
– 5G dongles and routers provide an important 5G access route for Fixed Wireless Access (FWA) customers (who are typically heavy data users) during the early stages in the technology lifecycle (as was the case in the 4G era);
Early technology adopters with the ability and willingness to pay an early premium for 5G devices and services typically consume a disproportionate amount of data (well over 3x following the launch of 5G in Korea, as discussed in section 2.2.4);
– This is likely to hold in both developed and emerging economies, albeit the proportion of consumers for whom 5G is immediately affordable will be lower in less affluent countries.
Taken together, we feel that these aspects support projections of 5G usage approaching or exceeding half of all global data traffic by 2025 (see section 2.2.3).
60 As of January 2021. Source: https://smartphonesrevealed.com/the-best-smartphones/.
£0
£200
£400
£600
£800
£1,000
£1,200
£1,400
Nov 2016 Apr 2018 Aug 2019 Jan 2021
Dev
ice
pric
e
iPhone11 64GB
iPhone8 64GB
iPhone7 32GB
Samsung Galaxy S20 Ultra 5G
Samsung Galaxy Note 20 Ultra 5G 245GB
Samsung Galaxy S8 64GB
Mobile Services, Spectrum and Network Evolution to 2025
C:\Users\stefa\Dropbox\Projects\Huawei Spectrum Evolution Jan 2021\Deliverables\Desseminatation\Mobile Spectrum and Network Evolution to 2025 - Coleago - 24 Mar
© copyright Coleago 2021 85
5.8 Laying the foundations for 6G
Developments in technology are always ongoing and wireless networks in particular are going through an increasing rate of change which will likely continue for at least the next decade before potentially becoming a steady-state change variation. Network operators are at the forefront of these developments as they are required by regulators to provide minimum levels of service in order to satisfy the requirements of their spectrum licences. What is certain is that the pace of change within the various standards bodies is quickening as is the need for infrastructure to be able to adapt to changes in standards without having to go through large replacement of hardware.
Within this paradigm is the need for the adoption of global standards to provide the economies of scale across many markets. In the 2G era there were at least three competing Global Standards GSMa TDMA, IS-95 CDMA and PDC (Japan) TDMA. These standards were promoted by different global areas roughly according to the ITU regions with Region 1 supporting GSM, Region 2 supporting IS-95 and Region 3 supporting PDC. This seriously fragmented the market and caused frequency harmonisation issues between the various regional regulators. With the adoption of 3G networks this standardisation became more fragmented as there were now four competing standards GSM SCDMA, GSM WCDMA, cdma2000 and IEEE-802.16 (WiMAX). This level of standards competition became unsustainable and so with the development of 4G networks LTE became the dominant standard controlled by the 3GPP organisation. The IEEE 802.16m standard continues but this has quickly been overtaken by the near global adoption of infrastructure based on 3GPP standards.
The 3GPP organisation has a clear roadmap to 6G standards and its scheduled release program. According to forecasts 6G functionality will be defined in the standards program starting with release 17 due for sign-off at the end of 2022. This will be followed by a number of test/development programs in industry before becoming part of the main development program by major vendors with a planned start date of 2027/2028. Large scale national deployment of infrastructure software/hardware will likely start in the year 2030 with software upgrades onto existing 5G hardware with new hardware required for the integration of such things as satellite communications and deployment of spectrum upto 95Ghz.
As network infrastructure moves to become all SDR (software defined radio) including the final RF band-edge-filters so individual carriers (hardware) can be configured to support more than one generation of radio channel. This is already possible between 4G and 5G using Dynamic Spectrum Sharing (DSS) as defined by 3GPP in release 16. In this way both 4G (LTE-a) and 5G handsets and devices can be supported on the same physical radio channel by the additional of appropriate software in the cell site. It is likely that when the 3GPP recommendations are ratified, the same technique can be used for 5G and 6G and possibly 4G, 5G and 6G depending on the sunset period for 4G. If this is prior to the year 2030 when most 6G networks should be commercially rolled out, then it will not be necessary to include the 4G layer within a DSS channel.
Moving from 5G to 6G in the core network is likely to be more straightforward. By the year 2024 5G will be fully rolled out in the majority of networks worldwide including configuring the 5G core networks in “Stand Alone” (SA) mode. In 5G the SA mode of working does not need an “anchor” 4G core network which allows all logical entities within the core to be fully abstracted in software potentially in a fully “virtual” or cloud type environment. This being the case network operators can deploy 6G core network entities by simply enabling either additional “virtual machines” or changing existing software to include the new functionality. It is likely within the subsequent 3GPP recommendations that 6G core network functionality will be fully backwards compatible with 5G and potentially 4G core network functionality to ensure that the coe network remains fully stable during transitions between generations of the standards.
What is also likely with 6G developments within the core network is that applications and additional service features could be provided by 3rd parties within the “walled garden” of an operator’s core network to ensure security and reliability. If so, the logical scope of the core network will expand and will enable 3rd parties to deploy new

Mobile Services, Spectrum and Network Evolution to 2025
C:\Users\stefa\Dropbox\Projects\Huawei Spectrum Evolution Jan 2021\Deliverables\Desseminatation\Mobile Spectrum and Network Evolution to 2025 - Coleago - 24 Mar
© copyright Coleago 2021 86
services, features and applications practically “one the fly” and certainly within days of the service being designed. This will speed up the design, deployment and sunset of services and features provided at part of the network operators portfolio.

Mobile Services, Spectrum and Network Evolution to 2025
C:\Users\stefa\Dropbox\Projects\Huawei Spectrum Evolution Jan 2021\Deliverables\Desseminatation\Mobile Spectrum and Network Evolution to 2025 - Coleago - 24 Mar
© copyright Coleago 2021 87
6. Spectrum demand 2020-2025
6.1 IMT requirements
A mix of spectrum spanning low to high bands are needed to meet the IMT 2020 requirements specified by the ITU, as illustrated in Exhibit 68 below.
Low frequency bands generally provide both wide-area and deep indoor coverage, and support mobility when users travel at higher speeds ‒ while the higher bands provide extra capacity where demand is more densely concentrated.
Exhibit 68: Spectrum mix and the IMT 2020 requirements
Source: Coleago Consulting
5G can also deliver performance matching fibre broadband, subject to the availability of wide-band spectrum allocations. More stringent requirements need to be met to allow like-for-like mobile substitution of fibre, as discussed below.
Requirements for Fixed Wireless Access (FWA)
European policy makers have set broadband connectivity targets for Europe, and both wired, notably fibre, and wireless technologies play a role in delivering the target.
Exhibit 69: European broadband policy
The Commission’s strategy on Connectivity for a European Gigabit Society, adopted in September 2016, sets a vision of Europe where availability and take-up of very high capacity networks enables the widespread use of products, services, and applications in the Digital Single Market.
This vision relies on three main strategic objectives for 2025:
Gigabit connectivity for all of the main socio-economic drivers,
uninterrupted 5G coverage for all urban areas and major terrestrial transport paths, and
access to connectivity offering at least 100 Mbit/s for all European households.
It confirms and builds upon the previous broadband objectives for 2020, to supply every European with access to at least 30 Mbit/s connectivity, and to provide half of European households with connectivity rates of 100 Mbit/s.
Source: https://ec.europa.eu/digital-single-market/en/broadband-europe

Mobile Services, Spectrum and Network Evolution to 2025
C:\Users\stefa\Dropbox\Projects\Huawei Spectrum Evolution Jan 2021\Deliverables\Desseminatation\Mobile Spectrum and Network Evolution to 2025 - Coleago - 24 Mar
© copyright Coleago 2021 88
The European Commission’s strategy on Connectivity for a European Gigabit Society sets a target of 100 Mbit/s connectivity available to 100% of households (see Exhibit 69). Fibre is playing a major role in reaching this target and FWA is recognised as one of the solutions. The European Electronic Communications Code (EECC) lists FWA as a technology to deliver Very High Capacity Networks (VHCN), thus making FWA eligible for public subsidies.
The Body of European Regulators of Electronic Communications (BEREC) Guidelines on Very High Capacity Networks (1 October 2020) sets out criteria for wired and wireless networks with a downlink data rate of 150 Mbit/s and uplink data rate of 50 Mbit/s under peak time conditions (see Exhibit 70). This will be revised upwards in 2023, taking into account for a better understanding of 5G networks capabilities, as indicated in paragraph 24 of the Guidelines.
Exhibit 70: BEREC Very High Capacity Networks Criterion 4
Any network providing a wireless connection which is capable of delivering, under usual peak-time conditions, services to end-users with the following quality of service (performance thresholds 2).
a. Downlink data rate ≥ 150 Mbps
b. Uplink data rate ≥ 50 Mbps
c. IP packet error ratio (Y.1540) ≤ 0.01%
d. IP packet loss ratio (Y.1540) ≤ 0.005%
e. Round-trip IP packet delay (RFC 2681) ≤ 25 ms
f. IP packet delay variation (RFC 3393) ≤ 6 ms
g. IP service availability (Y.1540) ≥ 99.81% per year
Source: BEREC Guidelines on Very High Capacity Networks, 1 October 2020
6.2 Current spectrum landscape and roadmap
Spectrum in the range of 450MHz to above 24GHz is used for IMT and band plans exist in many frequency ranges. Depending on the frequency range and the amount of spectrum in the range, different frequency bands serve different purposes. The large number of frequency bands can be categorised into four groups: sub-1GHz, lower mid-bands, upper mid-bands, and high bands.
Exhibit 71: Low, mid and high frequency bands for 5G
Category Frequency Comment
Low-bands < 1 GHz Coverage layer (eMBB, indoor, massive IoT)
Original GSM bands, 1st & 2nd digital dividend
700MHz / 600MHz first 5G coverage layer
Suitable for use cases requiring wide area coverage, deep indoor & mobility, IoT
Low throughput / capacity due to narrow bandwidth, <20 MHz DL per operator
NR to provide shorter latency than in LTE-A
Mid-bands 1.8 GHz to 6 GHz
Urban coverage layer (eMBB, indoor, massive IoT)
Existing mobile bands used 2G, 3G, 4G
Suitable for use cases requiring indoor coverage and mobility, massive IoT
2600MHz TDD (n41) consists of 190MHz and a 100MHz wide channel can be deployed
C-Band 3.3-4.2GHz is the key capacity band for 5G
Flexible for many use cases with higher throughput, wider spectrum
Target 100MHz wide per operator assignments, 100MHz wide channel

Mobile Services, Spectrum and Network Evolution to 2025
C:\Users\stefa\Dropbox\Projects\Huawei Spectrum Evolution Jan 2021\Deliverables\Desseminatation\Mobile Spectrum and Network Evolution to 2025 - Coleago - 24 Mar
© copyright Coleago 2021 89
Category Frequency Comment
Latency: <3ms RTT at 3.5GHz
High bands > 24 GHz Extreme capacity layer (eMBB, FWA, URLLC, backhaul)
Potential large band availability, highest throughput, target 800MHz wide per operator assignment, 400MHz wide channel
Limited coverage, but compensated with Massive MIMO
Latency <1ms RTT at 26GHz
Source: Coleago
In order to deliver 5G, mobile operators must have access to all three categories of spectrum - low, mid and high band - because each category has particular characteristics as shown in Exhibit 71 above. Regulators must adopt policies which make it possible for mobile operators to acquire new spectrum at a price which does not destroy the business case for 5G. In other words, spectrum pricing must be sustainable in the context of the reality of the market.
Low band spectrum (e.g. 600, 700, 800, 900 MHz)
These are effective at addressing very wide area coverage and deep indoor coverage given their good propagation characteristics. However, there is very little spectrum available and hence the channel bandwidth does not provide much capacity. Moreover, they do not allow high order MIMO implementations (see section 5.3.1).
700MHz has been labelled a 5G candidate band in the sense that in ITU Region 1 (Europe and Africa) it is likely to be used as the first 5G coverage layer. However, 700MHz (3GPP band 28) is already widely deployed in Asia, Australia, New Zealand, and Latin America as a 4G (LTE) coverage layer. In time, the 700MHz band will be refarmed to 5G. In the US and Canada the 600MHz band is the equivalent to 700MHz in Region 1.
Several countries in South East Asia and Latin America have yet to assign the 700MHz spectrum to mobile operators. Once it is assigned in these countries, the mobile operators there will install the latest technology. The most recent radios are multi-mode and allow for Dynamic Spectrum Sharing, i.e., they support 4G and 5G. For example, an operator who obtains 2x10MHz of 700MHz spectrum might initially use the full 2x10 for 4G and gradually switch the spectrum to 5G. If the 700MHz assignment is delayed, then operators might go straight to 5G. The timing of this decision depends on technology diffusion among the customer base i.e. the market.
Lower mid-bands (e.g. AWS, 1800, 1900, 2100, 2300, 2600 MHz)
Historically, 1800MHz was used for 2G, and AWS and 2100MHz for 3G. Where available, 2300MHz and 2600MHz were early 4G bands, in addition to 1800MHz spectrum refarmed from 2G to 4G. These were the main 4G-era capacity bands.
2600MHz and 2300MHz have emerged as 5G candidate bands in some countries. The 2600MHz band has been assigned in several markets as FDD (Band 7) and separately the centre gap as TDD (Band 38). In China, the entire 2600 MHz band is used in TDD mode ‒ the world’s biggest 5G deployment.
Regulators are now looking at licencing the 2600 MHz band as TDD (Band n41) because it would provide a 190MHz wide band and 3GPP 5G-NR specification include a 100MHz wide channel, which matches that of Band n77 (3300 – 4200 MHz). In addition to China, the USA, Philippines and Saudi Arabia have committed to this and regulators in Thailand, Myanmar, Sri Lanka, India, Nepal are looking at this option. The use of this band for 5G will certainly grow over time.
2300MHz TDD (Band n40) is 100MHz and the 3GPP specification includes an 80MHz wide channel.
In order to deliver 5G, mobile operators must have access to all
three categories of spectrum - low, mid and high band - because each
category has particular characteristics.

Mobile Services, Spectrum and Network Evolution to 2025
C:\Users\stefa\Dropbox\Projects\Huawei Spectrum Evolution Jan 2021\Deliverables\Desseminatation\Mobile Spectrum and Network Evolution to 2025 - Coleago - 24 Mar
© copyright Coleago 2021 90
Over time, the AWS, 1800, 1900 and 2100 MHz bands will also migrate to 5G, with current equipment and antenna systems allowing a smooth transition (as outlined in section 3.6).
Upper mid-bands (e.g. 3.3-4.2, 4.5-4.99, 6 GHz)
These are newer to IMT and offer a much wider bandwidth. This is a key 5G capacity resource. There are already 3GPP standardised radios and terminals available supporting the C-Band (band n77, 3.3-4.2GHz). Band N77 is specified as a TDD band and covers 3.3 to 4.2 GHz and N78 covers 3.3 to 3.8GHz. The width of the band (400 MHz in Europe) means that this is the first mid-band in which a channel width of 100MHz can be used – a 5G innovation. The importance of the 3.4-3.8 GHz band for 5G is recognised by the European Commission (Commission Implementing Decision (EU) 2019/235 of 24 January 2019). Rolling out 5G in the C-Band is an overriding policy objective. As of mid-2020, upper mid-bands spectrum used in most countries is in 3.4-3.8GHz.
Lower mid-bands have better propagation characteristics but have limitations in regard to available bandwidth. In contrast, upper mid-bands offer a good combination of propagation and capacity for cities. While 3GPP standards currently provide for up to 100 MHz wide channels, they allow a maximum bandwidth of 400 MHz in carrier aggregation mode.
High bands (e.g. 26, 28, 39 GHz, also referred to as mmWaves)
One of the benefits of 5G is that the 3GPP standards extend into much higher frequency ranges i.e. the mm wave range, including 26GHz, 28GHz and 39GHz with a channel bandwidth of up to 400MHz. There are no 4G standards for these bands and therefore default mobile deployment will be 5G. Adding mm wave spectrum will increase the spectrum used by mobile operators by up to 6000MHz, i.e. dwarfing the amount of spectrum deployed by mobile operators as of 2019.
66GHz is not as yet harmonised as an international IMT band, however it is being discussed as a potential further 5G candidate band.
High bands are effective at addressing areas with very high traffic density and with extreme peak data rates. However, high bands are not suitable for contiguous wide area coverage given the large number of sites this would require.
Spectrum allocations and roadmap in different regions
Exhibit 72: Typical low and mid-band spectrum allocated to mobile in Asia
Source: Coleago
220
340
480 480
620
9701070
0
200
400
600
800
1000
1200
1400
1600
2005 2010 2015 2019 2020 2021 2024
MH
z
850/900 1800 2100 2600 2600 TDD 700 2300 3.4-3.7
Upper mid-bands (e.g. 3.3-4.2 GHz, 4.5-4.99 GHz, 6 GHz) are newer to
IMT and offer a much wider bandwidth. This is a key 5G capacity resource. The upper mid-bands offer
a good combination of propagation and capacity for cities.

Mobile Services, Spectrum and Network Evolution to 2025
C:\Users\stefa\Dropbox\Projects\Huawei Spectrum Evolution Jan 2021\Deliverables\Desseminatation\Mobile Spectrum and Network Evolution to 2025 - Coleago - 24 Mar
© copyright Coleago 2021 91
Exhibit 72 above provides indicative ’averages’ of current and projected allocations within the low to upper-mid bands in ITU Region 3 (Asia Pacific), taking account of the fact that certain identified IMT bands have yet to be allocated in some markets.
In some of these markets, up to 525MHz of spectrum has already been released to operators. By 2021, once spectrum in the C-band, in 2300 MHz and 2600 MHz is assigned, the spectrum used by mobile operators in those markets will have increased to 1,155MHz i.e. more than double the amount used in 2019.
In the EU, on aggregate, mobile operators will typically hold 190 MHz of low-bands spectrum, 460 MHz in lower mid-bands plus 400 MHz in upper mid-bands by the end of 2023, with some variation between countries.
Exhibit 73: Typical spectrum used by mobile in Europe by 2023
Source: Coleago Consulting
The United States is currently a global leader on high-band awards for IMT. We anticipate that Canada will close the gap by 2024, with the release of almost 2GHz in the 26GHz band around 2023, and a further 3GHz at 38GHz a year later.
Exhibit 74: Spectrum roadmap in Canada
Source: Coleago
Upper mid-bands
3.5GHz 400 MHz
Low bands
700MHz 2x30 MHz800MHz 2x30 MHz900MHz 2x35 MHz
Total 190 MHz FDD
Lower mid-bands
1800MHz 2x75 MHz2100MHz 2x60 MHz2600MHz 2x70 MHz2600MHz 50MHz
Total 410 MHz FDD, 50 MHz TDD
High bands
26GHz 1000 to 3000 MHz TDD
Legacy bands New “5G” bands
Based on typical situation in Europe in 2021
Area traffic capacity of 10 Mbit/s/m2
User experienced data rate 100 Mbit/s
Next 4 Years
35 Years
0
1000
2000
3000
4000
5000
6000
1985198619871988198919901991199219931994199519961997199819992000200120022003200420052006200720082009201020112012201320142015201620172018201920202021202220232024
Spt
rum
for
Mob
ile M
Hz
850MHz 1900MHz AWS 700MHz 2600MHz
600MHz 3500MHz 3800MHz 26GHz 38GHz39GHz
With new spectrum for 5G, the amount of spectrum used by mobile
operators to satisfy the growth in mobile data will double between 2020
and 2025.

Mobile Services, Spectrum and Network Evolution to 2025
C:\Users\stefa\Dropbox\Projects\Huawei Spectrum Evolution Jan 2021\Deliverables\Desseminatation\Mobile Spectrum and Network Evolution to 2025 - Coleago - 24 Mar
© copyright Coleago 2021 92
Order of spectrum award and deployment priorities
Deployment priorities need to take account of the need to address 4G demand while driving migration to 5G. The strength of the device and equipment ecosystem for given bands also influences timing.
Exhibit 75: Order of spectrum award and deployment priorities
1 SDL: Supplementary downlink. 2 700MHz can be used for extra 4G capacity but this would weaken 5G coverage making it (relatively) less attractive. 3 700MHz SDL: 20MHz in FDD centre gap awarded in some European markets ‒ low-band capacity and cheap to deploy for existing 700MHz users.
Source: Coleago
Providing a good coverage layer is essential both for the 4G and 5G experience. 700MHz can be used for either or both in the near term.
In ‘Phase II’, the C-band and 5G candidate low bands should ideally be awarded at the same time. The urgency is generally slightly greater for 700MHz, because this can immediately be used to expand 4G capacity and improves indoor coverage and cell-edge performance.
In ‘Phase III’, 700MHz SDL might be deemed slightly more urgent than High Band, because it is relatively cheap for existing 700MHz holders to deploy, and it helps relieve low-band congestion. But High Band will be important too, to serve very high traffic density areas and FWA.
6.3 Quantifying spectrum demand
In section 2, we examined the global growth in mobile data consumption and its impact network capacity requirements assuming ‘best effort’ service provision. In sections 2.4.2 and 2.4.3, we considered the added impact of data speed targets (such as the 100Mbit/s specified in the ITU IMT 2020 Requirements) on future capacity deployments across the network.
However, while increased network-wide demand for capacity generally entails higher demand for spectrum, the relationship between the two is not necessarily linear. As discussed in section 5.3, capacity can in principle also be expanded through site densification and/or by deploying technological enhancements such as higher order MIMO ‒ albeit there are practical constraints on site density and on the amount of equipment that can be installed on individual sites.
Absolute spectrum demand or ‘need’ (as opposed to spectrum value or relative demand) can best be assessed by focusing on the busiest parts of the network at the point where alternative routes to capacity expansion become impractical and/or prohibitively expensive.
Legacy Low bande.g. 800, 900MHz
Legacy lower mid bande.g. 1800, 2100, 2300, 2600 MHz
C-band (#1 for capacity)
e.g. 3.4-3.8GHz
High band (mmWaves)
> 6GHz
Low-band (#1 for coverage)e.g. 600, 700MHz2
Additional Upper mid band
e.g. 3.3-4.2, 4.5-4.99, 6 GHz
Basic coverage layer
Basic capacity layer
Super capacity layer
Enhanced capacity layer
Phase IShould be complete, else accelerate (need for 4G)
Phase IIShould be complete or near
completion ‒ if not, accelerate
Phase IIIBy 2025
1
2
4
3
8
7
4G (5G over time) 4G (except C-band) or 5G 5G
L-band1400/1500MHz FDD,TDD and SDL1
5
Supplemental Low-bande.g. 700MHz SDL3
6
Spectrum ‘need’ (as opposed to ‘value’) can best be assessed by
focusing on the busiest parts of the network at the point where
alternatives to spectrum deployment become impractical.

Mobile Services, Spectrum and Network Evolution to 2025
C:\Users\stefa\Dropbox\Projects\Huawei Spectrum Evolution Jan 2021\Deliverables\Desseminatation\Mobile Spectrum and Network Evolution to 2025 - Coleago - 24 Mar
© copyright Coleago 2021 93
Drawing on our recent work61, we use the following approach to quantify the total amount of spectrum that needs to be released to meet consumer demand at levels of performance specified by the ITU.
6.3.1 Methodology and key assumptions
The need for spectrum is driven by traffic density. To examine future spectrum needs for IMT, we need to analyse traffic demand in areas with high population densities, i.e. cities. With this in mind, we have developed a concise and easily verifiable model to examine the impact of mid-bands spectrum in a city to deliver the ITU-R requirement for IMT-2020 (or 5G) of a 100 Mbit/s user experienced data rate in the downlink.
“Traditional usage” models employ individual user consumption figures coupled with various factors to derive overall capacity needed. Instead, our model examines the capacity needed over a wide area in a city consistent with the ITU-R IMT-2020 capacity focussed requirements, notably the requirement to deliver a user experienced DL data rate of 100 Mbit/s.
There is a high degree of uncertainty over how much simultaneous capacity will be required by different users within any given area. Our approach is to use population density in cities as a proxy for traffic density, to estimate the minimum or floor capacity requirement. While traffic generated by connected vehicles, 5G video cameras and video-based sensors could be a multiple of traffic generated by human users in certain areas, total traffic intensity is likely to remain highest where people are most concentrated.
The advantage of this approach is that the model is easy to validate because it relies on a small number of key assumptions around typical cell sizes and average spectral efficiencies that are representative of future 5G deployments.
Exhibit 76 below illustrates the workflow used within our model to estimate the spectrum needed to meet the 100 Mbit/s requirement. We use the same model to gauge additional spectrum required to meet the 50 Mbit/s uplink requirement. An analogous approach is used to quantify the extra spectrum holdings needed to meet the 10 Mbit/s/m2 specified in the ITU’s IMT 2020 Requirements.
61 See Coleago Consulting report ‘IMT spectrum demand ‒ Estimating the mid-bands spectrum needs in the 2025-2030 timeframe’, 14 December 2020; available at: https://www.gsma.com/gsmaeurope/resources/imt-spectrum-demand/.
We have developed a concise and easily verifiable model to examine the
need for mid-bands spectrum in an urban environment to deliver the ITU-R requirement for IMT-2020 of a 100 Mbit/s user experienced data rate in
downlink.
The advantage of focusing on the 5G requirements for a minimum data rate
is that the model is easy to validate because it relies on a small number of
key assumptions.

Mobile Services, Spectrum and Network Evolution to 2025
C:\Users\stefa\Dropbox\Projects\Huawei Spectrum Evolution Jan 2021\Deliverables\Desseminatation\Mobile Spectrum and Network Evolution to 2025 - Coleago - 24 Mar
© copyright Coleago 2021 94
Exhibit 76: Traffic demand and capacity supply model
Source: Coleago Consulting
Demand-side assumptions
With regards to the demand for capacity in a city with a particular population density, the four drivers in our model are listed below and described in the following paragraphs:
the IMT-2020 requirement for a DL user experienced data rate of 100 Mbit/s and a 50 Mbit/s uplink data rate;
the population density;
an assumption of concurrent demand from human users and new use cases (the activity factor);
an assumption of how much of the traffic demand would be satisfied by high bands (24GHz and above) sites; and
an estimate of the percentage of traffic offloaded to indoor upper mid-bands small cells.
These assumptions are applied to population densities. The objective is to compare the traffic demanded in a city with the capacity delivered, depending on the amount of spectrum deployed.
100 Mbit/s user experienced data rate in the downlinkk
The ITU-R requirement is that IMT-2020 must deliver a DL user experienced data rate of 100 Mbit/s. This is the starting point for the demand analysis. This requirement was developed some time ago in 2013 and may therefore increase. 5G is an IMT-2020 technology and thus is expected to deliver such speed.
Capacity supply per km2 (Gbit/s/km2)
Population Density
Concurrent demand from human users
Concurrent demand from new use cases
Offload to indoor small cells and
mmWave sites (%)Activity factor (%)
Traffic demand per km2 (Gbit/s/km2)
ITU RequirementUser experienced
data rate 100 Mbit/s
Macro site inter-site distance meters
Number of outdoor small cells relative to
macro sites
Macro site sectorisation
Small cell sectorisation
MHz of spectrum on macro site
MHz of spectrum on outdoor small cell
Spectral efficiency bit/s/Hz macro site
Spectral efficiency bit/s/Hz small cell
The ITU-R requirement is that 5G must deliver a DL user experienced
data rate of 100 Mbit/s. This is the starting point for the demand
analysis.

Mobile Services, Spectrum and Network Evolution to 2025
C:\Users\stefa\Dropbox\Projects\Huawei Spectrum Evolution Jan 2021\Deliverables\Desseminatation\Mobile Spectrum and Network Evolution to 2025 - Coleago - 24 Mar
© copyright Coleago 2021 95
The user experienced data rate of 100 Mbit/s needs to be delivered across an entire city, i.e. anytime anywhere high speed experience. Thus, mobile operators must cater for “speed coverage” across the entire city area. This implies that the traffic per square kilometre over an entire city area is a function of the population density in that city. This results in an average traffic demand per square kilometre (Mbit/s/km2).
Citing an average implicitly assumes that traffic demand is evenly distributed across the city area. In reality, traffic is not evenly distributed across a city area, but for our approach to demand modelling, the simplified assumption that traffic which would be carried by low bands and lower / upper mid-bands can be treated as relatively evenly distributed is reasonable, considering the following:
As explained below, data usage and the duration of usage is increasing and hence high bandwidth demand extends over longer periods of time.
Today’s traffic distribution relates largely to traffic demand from smartphones. In a mid-term future traffic demand by new use cases and new applications will occur in locations within a city where previously there may not have been a need for much capacity, for example on urban transport routes. This tends towards a more even demand for capacity across a city area.
There are always areas with a very high area traffic capacity requirement. Our model takes account of this by assuming that high bands will provide capacity in those areas. This will effectively take care of localised peaks in area traffic demand thus leaving traffic demand in the remaining area more evenly distributed. In other words, localised traffic demand peaks are offloaded to high band sites.
Population density
As outlined above, our approach is to use population density in cities as a proxy for traffic density to estimate the minimum or floor capacity requirement.
From a network dimensioning perspective, administrative city boundaries are irrelevant and what matters are areas with a high population density. Population density should be looked at over a reasonably large urban area which may or may not be within the administrative boundaries of a city or encompass the whole city. Given that population density is an average over an area, one must define the level of analysis and it is appropriate to look at population density clusters rather than dividing a city’s population by the area within its administrative boundary. The area considered needs to be reasonably large, i.e. not just a 1 km2 hotspot, for the issue to be material. From a materiality perspective, Coleago considers that the minimum size is 25 km2 in a single area or several such areas within an urban area.
Demand for area traffic capacity is of course only a problem in areas with a high population density. In our analysis (based on publicly available data62) of specific cities we focus on areas within a city with a population density of at least 9,000 people per km2. In principle, the higher the density, the greater the demand per km2.
Concurrent demand for capacity - the activity factor
As stated above, the key driver to determine the traffic demand per km2 within a city area is population density. However, not all users would require 100 Mbit/s at the same time. We need an assumption with regards to the concurrent or simultaneous demand for capacity during the busy period. In our model this is captured in the form of an “activity factor” to represent concurrent use in a cell from human users with smartphones and other devices, and new use cases such as connected cars, sensors, and cameras.
It is reasonable to use population density as a proxy for demand from human users with smartphones and other devices as well as new use cases, because many new use cases occur where people are. Traffic from new use cases occurs in addition to traffic generated by human users. In other words, it adds to the human activity factor.
62 https://sedac.ciesin.columbia.edu/data/set/grump-v1-urban-extents
Our approach is to use population density in cities as a proxy for traffic density to estimate the minimum or
floor capacity requirement.

Mobile Services, Spectrum and Network Evolution to 2025
C:\Users\stefa\Dropbox\Projects\Huawei Spectrum Evolution Jan 2021\Deliverables\Desseminatation\Mobile Spectrum and Network Evolution to 2025 - Coleago - 24 Mar
© copyright Coleago 2021 96
As an illustration, let’s consider the case of 5G enabled cameras. Most cameras are where people are. The higher the population density, the higher the density of cameras is likely to be.
As regards the activity factor for human users in urban environments, this is likely to be in the range of 5 to 10% today. This estimate is based on Coleago’s work with mobile operators in the context of spectrum auctions world-wide. In other words, in the busy period for a particular cell up to 10% of the population present in a cell may be using their devices simultaneously in that cell and hence their demand for capacity is additive.
The higher the usage, the more concurrent use there will be. This is evident from FTTH, xDSL, and cable broadband which have a busy period lasting several hours rather than the peaky traffic pattern associated with today’s mobile use. The high concurrent usage for FTTH, xDSL and cable is in no small part due to the fact that unlimited use plans are common. Unlimited data plans are becoming common for 5G mobile. This translates into a higher activity factor for human users, i.e. more people use their devices at the same time in the same cell.
Because there is considerable uncertainty over how much of the demand for the new use cases in a given area will be simultaneous, we assess the need for additional mid-bands spectrum for a range of activity factors. This range represents how the activity factor will grow over time. In high-income markets, for example, an activity factor of 5% to 10% might be representative of the mobile bandwidth demand in 2020, but could reach 25% between 2025 and 2030 ‒ taking account of both of human users as well as other uses such as connected vehicles, smart city, cameras, and network slices.
In low-income countries, heavy data users likely account for a far smaller proportion of the customer base. This would justify lower activity factors than those assumed in high-income countries.
Traffic offloading factor
This factor represents the combined proportion of traffic assumed to be carried by high bands (mm waves) and/or indoor small cells.
In some locations upper mind-bands small cells are expected to be installed indoors to provide speed coverage.
As of December 2020, high bands are not yet deployed in Europe. However, it is expected that they will be by the time additional spectrum in mid-bands is made available. The role of high bands discussed in more detail within the next section as well as in 6.3.6.
High bands will not provide continuous coverage in a city but will be deployed to serve indoor and outdoor locations with an extremely high traffic density. While the number of high bands sites will vary substantially from city to city and thus coverage and traffic captured will differ.
In the analysis below we use a combined traffic offload factor of 0%, 30%, and 50% respectively.
Supply-side assumptions
The variables in the city capacity supply per km2 availability model are:
the number of macro cell sites per km2, driven by the inter-site distance;
the role of mid-bands small cells;
base station design margin;
the site sectorisation;
the spectral efficiency; and
Not only is average usage per smartphone increasing rapidly, but
traffic demand from non-human usage is just at the beginning of the
growth curve.

Mobile Services, Spectrum and Network Evolution to 2025
C:\Users\stefa\Dropbox\Projects\Huawei Spectrum Evolution Jan 2021\Deliverables\Desseminatation\Mobile Spectrum and Network Evolution to 2025 - Coleago - 24 Mar
© copyright Coleago 2021 97
the amount of existing spectrum and additional spectrum required.
Number of macro cell sites
A key assumption is the number of macro base station sites per km2 across a city at which the spectrum is used. For this we have not made operator specific assumptions, but for the sake of simplicity we model this as if all operators share the same sites. Since not all physical sites are multi-tenant, the real number of physical sites would be higher but not all spectrum would be used at each site. The capacity calculation does not depend on this issue because total capacity is the number of sites multiplied by the amount of spectrum on each site. Our simplified approach is therefore representative.
In a typical city, sub-1 GHz and lower mid-bands are deployed mostly on macro sites, while upper mid-bands are deployed on macro sites and small cells. The typical inter-site distance for macro sites is ca. 400m.
In cities, the inter-site distance is driven by the need to provide capacity rather than range. We validated this assumption by comparing the number of macro sites predicted by the model with the number of actual sites.
The role of mid-bands small cells
We need to take account of future site build with 2025-2030 in mind. 5G will rely on small cell deployment to ensure speed coverage and hence the number of cell sites is expected to increase substantially.
Small cells would not provide contiguous coverage but would be deployed to fill in “speed coverage holes”. These speed coverage holes are locations where, for example due to blockage by buildings, upper mid-bands used at macro sites do not provide coverage. In other words, outdoor small cells provide consistency of area traffic capacity by in-filling any speed coverage holes at the macro layer.
The precise number of outdoor small cells required to fill in speed coverage holes depends on the topology of a particular city. Based on Coleago’s work with operators63, in a typical urban area, the future number of outdoor small cells for upper mid-band deployment would be three times the number of marco sites. In our model, we conservatively assume that the number of upper mid-band outdoor small cells in cities would grow to be three times the number of macro sites.
For example, the macro site raster in Paris consists of 616 macro sites (assuming 100% co-location by all operators) and we assume that 1,848 (616 x 3) outdoor small cells will be added. This assumes 100% co-location by all operators but in practice there are likely to be many more small cells sites because not all sites will have 100% colocation. Whether small cells are colocated or not does not matter from the area traffic capacity modelling perspective.
In theory mobile operators could build many more small cells. However there are two constraints, economic and environmental. It is significantly more cost effective to add spectrum to an existing site because this reduces capital expenditure and operational expenditure. In a competitive market this translates into lower retail prices, i.e. a consumer surplus. Secondly, local authorities are keen to limit mobile sites to the number necessary to provide a good 5G service because a very large number of sites is not desirable from an environmental perspective.
Design margins
In practice in the busy period a base station site capacity cannot be fully utilised. In order to manage interference a design margin of at least 15% is required. In other words, in practice 15% of the nominal capacity cannot be used. The assessment of the spectrum needs in this report is based on the busy period when Base Stations are heavily loaded. This approach allows not to overestimate the need for additional
63 Source: Coleago Consulting work with several operators in Europe and North America.
A key assumption is the number of macro base station sites per km2
across a city at which the spectrum is used. For this we have not made
operator specific assumptions, but for the sake of simplicity we model this
as if all operators share the same sites.

Mobile Services, Spectrum and Network Evolution to 2025
C:\Users\stefa\Dropbox\Projects\Huawei Spectrum Evolution Jan 2021\Deliverables\Desseminatation\Mobile Spectrum and Network Evolution to 2025 - Coleago - 24 Mar
© copyright Coleago 2021 98
spectrum. Overestimation may occur if a higher design margin is considered, which is equivalent to less loaded Base Stations.
Site sectorisation
A typical urban macro-cell deployment uses three sector sites which increase the capacity per site. However, small cells will have predominantly only one sector. Our model is consistent with these assumptions.
Spectral efficiency
We have used appropriate assumptions with regards to the downlink and uplink spectral efficiency for the different types of spectrum in an urban environment. While currently 2G, 3G and 4G are deployed in low bands and lower mid-bands, in time these will all be refarmed to 5G. Therefore, we used the higher spectral efficiency for 5G with an appropriate MIMO configuration as shown in Exhibit 77.
The spectral efficiency values used are based on values typically used by many mobile operators for whom Coleago has carried out long-term network dimensioning work as well as simulations carried out by vendors. In some cases, the values are lower than those published by the ITU-R.
The ITU-R spectral efficiency values are achievable under ideal conditions in a dense urban environment, but here we are modelling a real-world deployment and consider average spectral efficiency not only over a cell area but over an entire city. The high population density areas include both dense urban and urban environments. For example, the ITU-R target for dense urban eMBB is 7.8 bit/s/Hz and could be achieved by using 64-element MIMO at the base stations. However, across a city in upper mid-bands a mix of MIMO configurations will be used and hence we used a blended average spectral efficiency. For other environments we used vendor simulation results because M.2410 either does not cover these or does not cover these with the same assumptions as we used.
Spectrum use
We assume that all available low-bands, lower mid-bands, and upper mid-bands will be deployed on all macro sites. As regards small cells, we assume that upper mid-bands spectrum will be used on all small cells. In addition, we also assume that high bands (mmWaves) will be deployed in the city and thus part of the traffic will be absorbed by the mmWave sites (i.e. offload to high bands).
We have modelled how much spectrum would be required to deliver the experienced data rate of 100 Mbit/s in the downlink in an urban environment, where the variable which drives spectrum demand is the population density in the urban environment. We also similarly modelled the requirement to deliver a 50 Mbit/s uplink user experienced data rate.
Finally, we assume that 600MHz in low and mid-bands will be FDD spectrum, with all other spectrum resources used in TDD mode.
We assume that all available low-bands, lower mid-bands, and upper
mid-bands will be deployed on all macro sites. As regards small cells,
we assume that upper mid-bands spectrum will be used on all small
cells.

Mobile Services, Spectrum and Network Evolution to 2025
C:\Users\stefa\Dropbox\Projects\Huawei Spectrum Evolution Jan 2021\Deliverables\Desseminatation\Mobile Spectrum and Network Evolution to 2025 - Coleago - 24 Mar
© copyright Coleago 2021 99
Exhibit 77: Key 5G modelling assumptions for future urban environment
Band Category Average inter-site
distance (m)
Number of sectors
Average DL/UL
spectral efficiency (bit/s/Hz)
700, 800, 900 MHz Macro site;
Low bands
400 3 1.8 / 1.8
1800, 2100, 2600 MHz Macro site;
Lower mid-bands
400 3 2.2 / 2.5
3.5 GHz Macro site;
Upper mid-bands
400 3 6.0 / 4.1
Additional mid-bands Macro site;
Mid-bands
400 3 6.0 / 4.1
3.5 GHz Small cell;
Upper mid-bands
n/a* 1 3.7 / 2.6
Additional mid-bands Small cell;
Mid-bands
n/a* 1 3.7 / 2.6
* For small cells this does not assume contiguous coverage because small cells are deployed to fill in speed coverage holes rather than providing contiguous coverage. Hence the inter-site distance is irrelevant.
Source: Coleago Consulting
6.3.2 Spectrum to meet the 100 Mbit/s downlink requirement
Without practical examples, the population density figures can be somewhat academic. We have therefore used nine city examples, spanning high and low-income countries to illustrate the impact.
This sample includes Paris, Berlin, Madrid, Rome and the Amsterdam – The Hague urban region for high-income countries, and central Karachi, central Aman, central Rabat and Khartoum for low-income countries. These are the most densely populated centres within their respective countries. Urban extents and population densities are sourced from SEDAC64 65.
As explained in the preceding section, when looking at population density it is appropriate to look at population density clusters rather than dividing a city’s population by the area within its administrative boundary. In each city, we have identified a similar reasonably sized high-density area as shown in Exhibit 78.
64 Center for International Earth Science Information Network - CIESIN - Columbia University, International Food Policy Research Institute - IFPRI, The World Bank, and Centro Internacional de Agricultura Tropical - CIAT. 2011. Global Rural-Urban Mapping Project, Version 1 (GRUMPv1): Urban Extents Grid. Palisades, NY: NASA Socioeconomic Data and Applications Center (SEDAC). https://doi.org/10.7927/H4GH9FVG. Accessed May 2020 YEAR
65 Center for International Earth Science Information Network - CIESIN - Columbia University. 2018. Gridded Population of the World, Version 4 (GPWv4): Population Density, Revision 11. Palisades, NY: NASA Socioeconomic Data and Applications Center (SEDAC). https://doi.org/10.7927/H49C6VHW. Accessed May 2020 and January 2021.
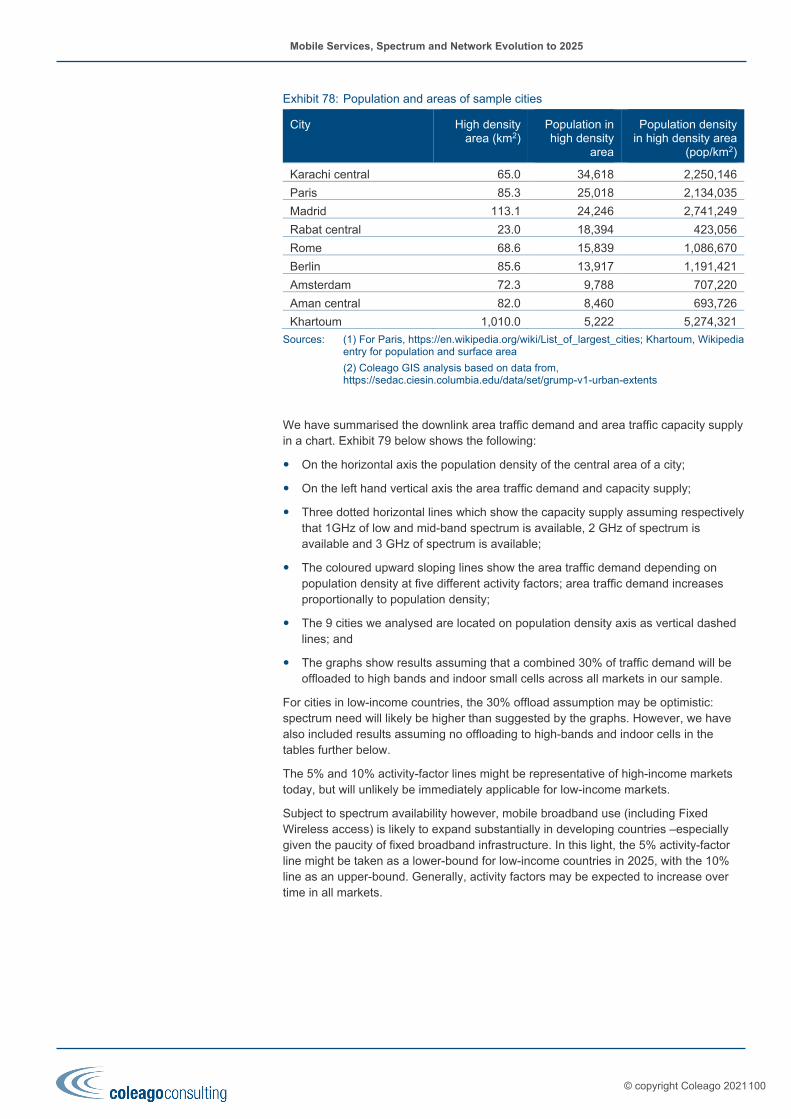
Mobile Services, Spectrum and Network Evolution to 2025
C:\Users\stefa\Dropbox\Projects\Huawei Spectrum Evolution Jan 2021\Deliverables\Desseminatation\Mobile Spectrum and Network Evolution to 2025 - Coleago - 24 Mar
© copyright Coleago 2021100
Exhibit 78: Population and areas of sample cities
City High density area (km2)
Population in high density
area
Population density in high density area
(pop/km2)
Karachi central 65.0 34,618 2,250,146
Paris 85.3 25,018 2,134,035
Madrid 113.1 24,246 2,741,249
Rabat central 23.0 18,394 423,056
Rome 68.6 15,839 1,086,670
Berlin 85.6 13,917 1,191,421
Amsterdam 72.3 9,788 707,220
Aman central 82.0 8,460 693,726
Khartoum 1,010.0 5,222 5,274,321
Sources: (1) For Paris, https://en.wikipedia.org/wiki/List_of_largest_cities; Khartoum, Wikipedia entry for population and surface area
(2) Coleago GIS analysis based on data from, https://sedac.ciesin.columbia.edu/data/set/grump-v1-urban-extents
We have summarised the downlink area traffic demand and area traffic capacity supply in a chart. Exhibit 79 below shows the following:
On the horizontal axis the population density of the central area of a city;
On the left hand vertical axis the area traffic demand and capacity supply;
Three dotted horizontal lines which show the capacity supply assuming respectively that 1GHz of low and mid-band spectrum is available, 2 GHz of spectrum is available and 3 GHz of spectrum is available;
The coloured upward sloping lines show the area traffic demand depending on population density at five different activity factors; area traffic demand increases proportionally to population density;
The 9 cities we analysed are located on population density axis as vertical dashed lines; and
The graphs show results assuming that a combined 30% of traffic demand will be offloaded to high bands and indoor small cells across all markets in our sample.
For cities in low-income countries, the 30% offload assumption may be optimistic: spectrum need will likely be higher than suggested by the graphs. However, we have also included results assuming no offloading to high-bands and indoor cells in the tables further below.
The 5% and 10% activity-factor lines might be representative of high-income markets today, but will unlikely be immediately applicable for low-income markets.
Subject to spectrum availability however, mobile broadband use (including Fixed Wireless access) is likely to expand substantially in developing countries ‒especially given the paucity of fixed broadband infrastructure. In this light, the 5% activity-factor line might be taken as a lower-bound for low-income countries in 2025, with the 10% line as an upper-bound. Generally, activity factors may be expected to increase over time in all markets.

Mobile Services, Spectrum and Network Evolution to 2025
C:\Users\stefa\Dropbox\Projects\Huawei Spectrum Evolution Jan 2021\Deliverables\Desseminatation\Mobile Spectrum and Network Evolution to 2025 - Coleago - 24 Mar
© copyright Coleago 2021101
Exhibit 79: DL area traffic demand and spectrum needs
Source: Coleago Consulting
Looking at high density areas in the Amsterdam – The Hague region, which has the 3rd lowest population density of the 9 cities, we can examine whether the upward sloping demand lines are below or above the base spectrum supply line. The chart shows that with an activity factor of 10%, demand can be met with the baseline spectrum, but for higher activity factors additional mid-bands spectrum is required. For example, for an activity factor of 25% circa 600 MHz of additional mid-bands spectrum is required.
Paris, which has the second highest population density among the sample cities, requires additional spectrum if the activity factor is greater than 5%. For an activity factor of 20%, around 2 GHz of additional mid-bands spectrum is required.
Depending on the city, in areas with a population density greater than 9,000 per km2, additional mid-bands spectrum is required to deliver the IMT 2020 requirements in terms of the 5G user experience in downlink. The higher the population density the greater the need for additional mid-band spectrum.
In areas with a population density below 9,000 per km2, additional mid-bands spectrum would still deliver benefits. The benefit would either be a lower site density or a higher experienced data rate. A lower site density translates into a lower cost per bit which will in turn translate into lower retail prices.
Exhibit 80 shows the additional mid-bands spectrum needs in the 9 cities depending on the percentage of traffic offloaded to high bands and the activity factor. Our analysis leads to the following conclusions that the use of additional mid-bands spectrum would enable the 5G-NR experienced data rate of 100 Mbit/s to be delivered in an economically feasible manner in the cities we examined, anytime, anywhere, citywide.
1GHz neededlow and mid-band
2GHz neededlow and mid-band
3GHz neededlow and mid-band
Kar
achi
cen
tral
(65
km²)
Par
is (
85km
²)
Mad
rid (
113k
m²)
Rab
at c
entr
al (
23km
²)
Rom
e (6
8km
²)
Ber
lin (
85km
²)
Am
ster
dam
(72k
m²)
Am
an c
entr
al (
82km
²)
Kha
rtou
m (
1010
km²)
0
100
200
300
400
500
600
5000
6000
7000
8000
9000
1000
011
000
1200
013
000
1400
015
000
1600
017
000
1800
019
000
2000
021
000
2200
023
000
2400
025
000
2600
027
000
2800
029
000
3000
031
000
3200
033
000
3400
035
000
Cap
acity
/ T
raff
ic (
Gbi
t/s/
km2 )
Population Density (pop/km2)
Traffic demand 5% activity factor Traffic demand 10% activity factor Traffic demand 15% activity factor
Traffic demand 20% activity factor Traffic demand 25% activity factor
Depending on the city, in areas with a population density greater than 9,000
per km2, additional mid-bands spectrum is required to deliver the
IMT 2020 requirements.
In areas with a population density below 9,000 per km2, additional mid-
bands spectrum would reduce site density.
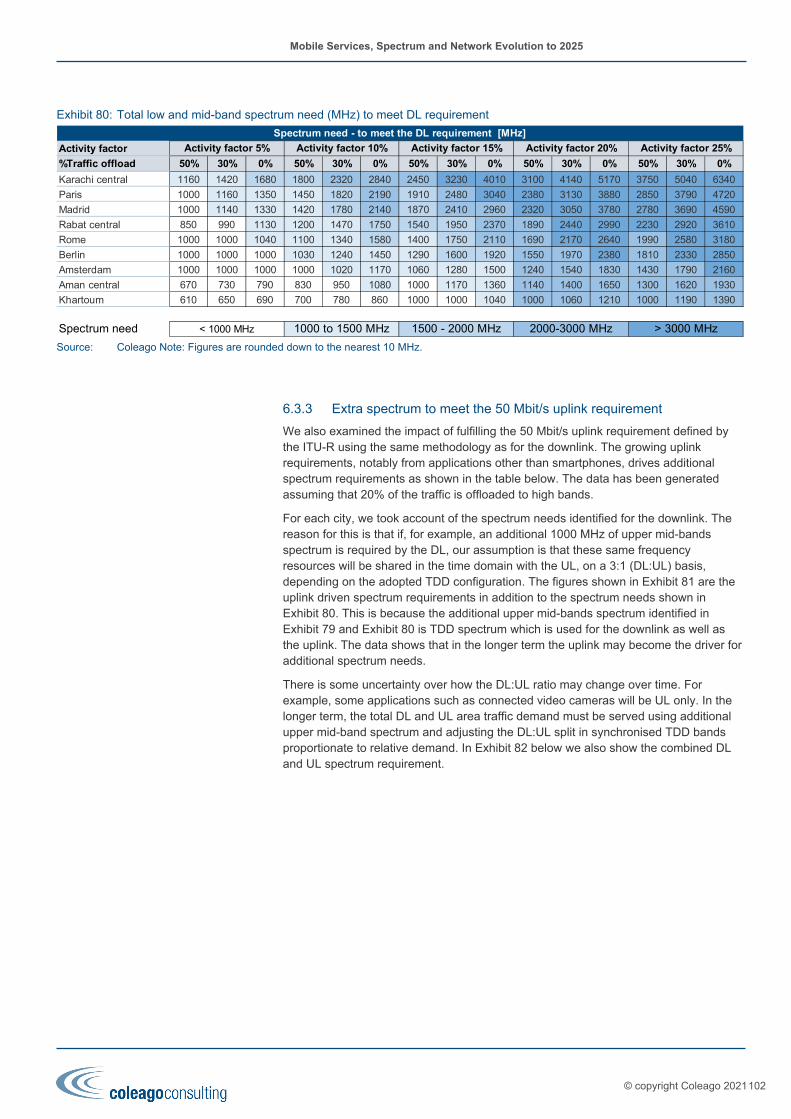
Mobile Services, Spectrum and Network Evolution to 2025
C:\Users\stefa\Dropbox\Projects\Huawei Spectrum Evolution Jan 2021\Deliverables\Desseminatation\Mobile Spectrum and Network Evolution to 2025 - Coleago - 24 Mar
© copyright Coleago 2021102
Exhibit 80: Total low and mid-band spectrum need (MHz) to meet DL requirement
Source: Coleago Note: Figures are rounded down to the nearest 10 MHz.
6.3.3 Extra spectrum to meet the 50 Mbit/s uplink requirement
We also examined the impact of fulfilling the 50 Mbit/s uplink requirement defined by the ITU-R using the same methodology as for the downlink. The growing uplink requirements, notably from applications other than smartphones, drives additional spectrum requirements as shown in the table below. The data has been generated assuming that 20% of the traffic is offloaded to high bands.
For each city, we took account of the spectrum needs identified for the downlink. The reason for this is that if, for example, an additional 1000 MHz of upper mid-bands spectrum is required by the DL, our assumption is that these same frequency resources will be shared in the time domain with the UL, on a 3:1 (DL:UL) basis, depending on the adopted TDD configuration. The figures shown in Exhibit 81 are the uplink driven spectrum requirements in addition to the spectrum needs shown in Exhibit 80. This is because the additional upper mid-bands spectrum identified in Exhibit 79 and Exhibit 80 is TDD spectrum which is used for the downlink as well as the uplink. The data shows that in the longer term the uplink may become the driver for additional spectrum needs.
There is some uncertainty over how the DL:UL ratio may change over time. For example, some applications such as connected video cameras will be UL only. In the longer term, the total DL and UL area traffic demand must be served using additional upper mid-band spectrum and adjusting the DL:UL split in synchronised TDD bands proportionate to relative demand. In Exhibit 82 below we also show the combined DL and UL spectrum requirement.
Activity factor
%Traffic offload 50% 30% 0% 50% 30% 0% 50% 30% 0% 50% 30% 0% 50% 30% 0%
Karachi central 1160 1420 1680 1800 2320 2840 2450 3230 4010 3100 4140 5170 3750 5040 6340
Paris 1000 1160 1350 1450 1820 2190 1910 2480 3040 2380 3130 3880 2850 3790 4720
Madrid 1000 1140 1330 1420 1780 2140 1870 2410 2960 2320 3050 3780 2780 3690 4590
Rabat central 850 990 1130 1200 1470 1750 1540 1950 2370 1890 2440 2990 2230 2920 3610
Rome 1000 1000 1040 1100 1340 1580 1400 1750 2110 1690 2170 2640 1990 2580 3180
Berlin 1000 1000 1000 1030 1240 1450 1290 1600 1920 1550 1970 2380 1810 2330 2850
Amsterdam 1000 1000 1000 1000 1020 1170 1060 1280 1500 1240 1540 1830 1430 1790 2160
Aman central 670 730 790 830 950 1080 1000 1170 1360 1140 1400 1650 1300 1620 1930
Khartoum 610 650 690 700 780 860 1000 1000 1040 1000 1060 1210 1000 1190 1390
Spectrum need
Activity factor 25%
< 1000 MHz 1000 to 1500 MHz 1500 - 2000 MHz 2000-3000 MHz > 3000 MHz
Spectrum need - to meet the DL requirement [MHz]
Activity factor 5% Activity factor 10% Activity factor 15% Activity factor 20%

Mobile Services, Spectrum and Network Evolution to 2025
C:\Users\stefa\Dropbox\Projects\Huawei Spectrum Evolution Jan 2021\Deliverables\Desseminatation\Mobile Spectrum and Network Evolution to 2025 - Coleago - 24 Mar
© copyright Coleago 2021103
Exhibit 81: Additional mid-bands spectrum needs (MHz) to meet UL requirement
Source: Coleago
Exhibit 82: Low and mid-band spectrum needs (MHz) to meet both the DL and UL requirements
Source: Coleago
Where the estimated low and mid-band spectrum demand exceed the available supply of IMT frequencies up to 6GHz, the shortfall would entail either:
A failure to meet the IMT-2020 Requirements in exceptionally concentrated population areas; or
Costly measures to overcome the shortfall, including higher than assumed network densification and/or deployment of technology enhancements that deliver significantly higher spectral efficiency gains than projected; and/or
An even greater reliance on traffic offloading to high frequencies and/or indoor cells.
As outlined in section 4.3, bandwidth shortfalls caused by a failure to release sufficient IMT-designated spectrum could result in substantial socio-economic harm.
Further details and analysis on spectrum demand in a sample of EU countries is available in our full ‘IMT spectrum demand’ report66.
66 Coleago, 14 December 2020, ibid. (https://www.gsma.com/gsmaeurope/resources/imt-spectrum-demand/).
Activity factor
%Traffic offload 50% 30% 0% 50% 30% 0% 50% 30% 0% 50% 30% 0% 50% 30% 0%
Karachi central 100 170 310 290 420 700 460 670 1080 630 910 1480 800 1160 1860
Paris 50 110 210 180 280 490 310 460 760 440 640 1050 560 810 1330
Madrid 40 110 200 170 270 470 300 450 740 430 620 1010 540 780 1280
Rabat central 20 50 130 110 190 330 210 330 540 300 450 750 400 580 950
Rome 0 20 110 90 150 280 170 270 460 260 380 640 330 500 810
Berlin 0 0 80 70 130 240 140 230 390 210 320 550 280 430 710
Amsterdam 0 0 0 0 70 150 80 140 260 130 200 360 170 280 470
Aman central 0 0 20 0 40 110 50 110 220 100 170 310 140 230 410
Khartoum 0 0 0 0 0 40 0 20 100 0 70 170 60 120 220
Extra need < 1000 MHz 1000 to 1500 MHz 1500 - 2000 MHz 2000-3000 MHz > 3000 MHz
UL additional spectrum need - addressed with UL-only spectrum MHz]
Activity factor 5% Activity factor 10% Activity factor 15% Activity factor 20% Activity factor 25%
Activity factor
%Traffic offload 50% 30% 0% 50% 30% 0% 50% 30% 0% 50% 30% 0% 50% 30% 0%
Karachi central 1260 1590 1990 2090 2740 3540 2910 3900 5090 3730 5050 6650 4550 6200 8200
Paris 1050 1270 1560 1630 2100 2680 2220 2940 3800 2820 3770 4930 3410 4600 6050
Madrid 1040 1250 1530 1590 2050 2610 2170 2860 3700 2750 3670 4790 3320 4470 5870
Rabat central 870 1040 1260 1310 1660 2080 1750 2280 2910 2190 2890 3740 2630 3500 4560
Rome 1000 1020 1150 1190 1490 1860 1570 2020 2570 1950 2550 3280 2320 3080 3990
Berlin 1000 1000 1080 1100 1370 1690 1430 1830 2310 1760 2290 2930 2090 2760 3560
Amsterdam 1000 1000 1000 1000 1090 1320 1140 1420 1760 1370 1740 2190 1600 2070 2630
Aman central 670 730 810 830 990 1190 1050 1280 1580 1240 1570 1960 1440 1850 2340
Khartoum 610 650 690 700 780 900 1000 1020 1140 1000 1130 1380 1060 1310 1610
Spectrum need < 1000 MHz 1000 to 1500 MHz 1500 - 2000 MHz 2000-3000 MHz > 3000 MHz
Total spectrum need - to meet both DL and UL requirements [MHz]
Activity factor 5% Activity factor 10% Activity factor 15% Activity factor 20% Activity factor 25%
= plausible lower-bound of spectrum need in 2025

Mobile Services, Spectrum and Network Evolution to 2025
C:\Users\stefa\Dropbox\Projects\Huawei Spectrum Evolution Jan 2021\Deliverables\Desseminatation\Mobile Spectrum and Network Evolution to 2025 - Coleago - 24 Mar
© copyright Coleago 2021104
6.3.4 High bands in the context of dense-urban capacity needs
Due to the more challenging propagation characteristics of high bands, it is not economically feasible to build consistent speed coverage across a city to satisfy the IMT-2020 user experienced data rate requirements with high band spectrum instead of additional upper mid-band spectrum and thus, in the context of consistent citywide speed coverage, high bands are not a substitute for upper mid-bands.
At the same time, it is not technologically possible to achieve the IMT-2020 area traffic capacity without the high bands. This therefore also means the upper mid-bands are not a substitute for high bands. High bands sites will be deployed indoors and outdoors and will absorb some of the area traffic demand in cities. This has been considered when analysing area traffic capacity requirement in cities in the form of a percentage of traffic that is offloaded to high bands.
High density traffic locations exist in urban, sub-urban and rural areas. Examples include shopping centres, transport hubs, office parks, and industrial sites. Therefore, for mobile operators to provide a consistent user experience they will require high bands spectrum nationwide.
6.3.5 Relationship between spectrum and the rural FWA opportunity
The FWA business case is highly dependent on the number of connections that can be supported per cell tower. In turn, this is a function of the data rate that must be delivered and, crucially, the amount of spectrum used at a cell tower.
The assumptions used for “fibre-like speed” 5G FWA are slightly different from those used for 5G eMBB.
Outdoor customer premises equipment (CPE) may be used which results in an uplift to spectral efficiency. However, in a rural environment with a low building height 16-element MIMO would be deployed for FWA compared to 64-element MIMO for eMBB in a dense urban environment, and furthermore the cell radius for rural FWA would be larger compared to a dense urban environment. Hence, we assume a lower spectral efficiency of 5 bit/s/Hz.
We assume a higher activity factor of 50% compared to 10-25% for mobile because fixed broadband monthly data usage is assumed to remain higher than mobile broadband usage:
– In Q3 2019, average monthly broadband usage per household was 264.4 Gbytes / month67. For subscribers with a 100 Mbit/s+ connection usage was 333 Gbytes/month in Europe and 398 Gbytes in the US.
– A further reference point is the service definition in the Connect America Fund Phase II Auction (Auction 903) rural broadband funding programme. The 100 Mbit/s broadband service must include a 2 Terabyte monthly usage allowance.
– Fixed broadband is used over longer continuous periods thus pushing up concurrent use.
The radio propagation in the range of 3.5 to 7GHz is not a limiting factor when assessing number of households which could be covered with a 100 Mbit/s service. Even with a cell radius of only 2 km, the area covered by a site would be 12.6 km2. Even if we assume a household density of only 50 per km2, the area covered by a single site would include 628 households which is consistent with the number of households that would be served by a single site as shown in Exhibit 84 below. However, the calculation demonstrates that FWA is effective even to cover isolated households such as farms.
67 Broadband Industry Report (OVBI) 3Q 2019, OpenVault
Due to the challenging propagation characteristics of high bands, it is not
economically feasible to build consistent speed coverage across a
city to satisfy the 5G requirement of a 100 Mbit/s user experienced data
rate, anytime, anywhere without mid-band spectrum

Mobile Services, Spectrum and Network Evolution to 2025
C:\Users\stefa\Dropbox\Projects\Huawei Spectrum Evolution Jan 2021\Deliverables\Desseminatation\Mobile Spectrum and Network Evolution to 2025 - Coleago - 24 Mar
© copyright Coleago 2021105
Exhibit 83: FWA covered homes per site model
Source: Coleago Consulting
To examine the impact of additional mid-bands spectrum on the economics of rural FWA, we compared three scenarios examining 5G FWA delivering a household experienced DL data rate of 100 Mbit/s:
In scenario 1, only the baseline spectrum of 1,050 MHz (see Exhibit 73) is available but 650 MHz is required to cater for mobile bandwidth demand in rural areas so that only 400 MHz can serve FWA bandwidth needs.
In scenario 2, in addition to the baseline spectrum an additional 1,000 MHz of upper mid-bands spectrum is available.
In scenario 3, in addition to the baseline spectrum an additional 2,000 MHz of upper mid-bands spectrum is available.
The number of supported households per 5G FWA cell tower for each scenario is shown in Exhibit 84. These are based on a spectral efficiency of 5 bit/s/Hz, three sectors per cell tower, and a DL:UL TDD ratio of 3:1.
Scenario 1 can support 90 households per site in rural areas, scenario 2 can support 315 households, and scenario 3 can support 540 households. The more households can be served per site, the lower the cost per home served with a 100 Mbit/s speed. This therefore demonstrates that using more mid-bands spectrum for rural FWA would significantly improve the business case for operators and will reduce or may even eliminate the need for subsidies.
Relevance of FWA for speeds above 100 Mbit/s
The definition of broadband keeps changing. The European Commission target is 100 Mbit/s. BEREC Guidelines on Very High Capacity Networks aim at a requirement of 150 Mbit/s in the downlink and 50 Mbit/s in the uplink. 100 or 150 Mbit/s may be considered sufficient now, but we are moving to what is now defined as ultra-fast broadband. BEREC’s VHCN Criterion 4 will be reviewed in 2023 (see section 6.1). Ofcom, the telecoms regulator of the United Kingdom, defines ultrafast broadband as broadband with download speeds of greater than 300 Mbit/s68.
We examined the sustainability of FWA in upper mid-bands against a background of an increase in speed requirements for broadband. Using the same assumptions as above, we modelled the number of households that can be served assuming a 150 Mbit/s, 300 Mbit/s, and 1 Gbit/s downlink speed requirement.
With an additional 2,000 MHz of upper mid-bands spectrum, one site can provide a data rate of 100 Mbit/s for 540 households. If the speed requirement is increased to 300 Mbit/s this drops to 180 households and a 1 Gbit/s service could be provided to 54 households from a single site.
68 UK Home Broadband Performance, Technical Report, paragraph 5.10, page 20, Ofcom, 13
May 2020
Supported number of connections per cell
tower
Required data rate per FWA connection
Amount of spectrum deployed on cell tower
Concurrent use (activity factor)
100 Mbit/s150 Mbit/s300 Mbit/s
1 Gbit/s
Base line+ 1,000 MHz+ 2,000 MHz
50%
Adding several 100 MHz of upper mid-bands spectrum to the baseline
spectrum improves the economics of FWA and means that FWA can be a
long-term solution for rural broadband connectivity.

Mobile Services, Spectrum and Network Evolution to 2025
C:\Users\stefa\Dropbox\Projects\Huawei Spectrum Evolution Jan 2021\Deliverables\Desseminatation\Mobile Spectrum and Network Evolution to 2025 - Coleago - 24 Mar
© copyright Coleago 2021106
This demonstrates that using additional mid-bands spectrum for 5G FWA ensures that FWA is a long-term solution for rural broadband connectivity if 2,000 MHz of additional mid-bands spectrum become available. It is also important to note that the higher the capacity required, the more important it becomes to ensure that mmWave spectrum is available in addition to upper mid-bands spectrum.
Exhibit 84: FWA households supported depending on speed and spectrum
Households supported per 5G FWA cell tower
100 Mbit/s
150 Mbit/s
300 Mbit/s
1Gbit/s
Baseline (400 MHz) 90 60 30 9
Baseline + 1GHz additional 315 210 105 32
Baseline + 2GHz additional 540 360 180 54
Source: Coleago Consulting
Note: The baseline is only 400 MHz of upper mid-bands spectrum because we assume that low-bands and lower mid-bands are required for mobile capacity, i.e. not available for FWA.
Further details and a discussion on the economics of rural FWA versus fibre broadband is available in our full ‘IMT spectrum demand’ report69.
6.3.6 Spectrum to meet the 10 Mbit/s/m2 requirement
Section 6.3.2 above examined how the 5G user experienced data rate of 100 Mbit/s could be delivered using additional upper mid-bands spectrum. However, there are locations within cities and also outside cities, where there is very high traffic density. The IMT 2020 requirement to provide an area traffic capacity of 10 Mbit/s/m2 addresses this situation.
Exhibit 85 shows the area traffic capacity that can be delivered incrementally by low and mid-bands on a dense site network (100 metre site radius) and high bands on a pico-site network (20 metre cell radius). Upper mid-bands are not sufficient to deliver the 10 Mbit/s/m2 area traffic capacity requirement. Only with the addition of high bands is it possible to deliver the 5G area traffic capacity of 10 Mbit/s/m2.
Exhibit 85: Spectrum and area traffic capacity
Source: Coleago Consulting
69 Coleago, 14 December 2020, ibid. (https://www.gsma.com/gsmaeurope/resources/imt-spectrum-demand/).
0.61.3
2.0
13.0
0
2
4
6
8
10
12
14
Baseline Plus 1 GHz ofupper mid-bands
Plus 2 GHz ofupper mid-bands
Plus 2 GHz ofupper mid-bandsplus 3GHz of 26
GHz
Are
a tr
affic
cpa
city
Mbi
t/s/
m2
High bands are required to deliver the required 5G area traffic capacity of 10
Mbit/s/m2 in very high traffic density areas.

Mobile Services, Spectrum and Network Evolution to 2025
C:\Users\stefa\Dropbox\Projects\Huawei Spectrum Evolution Jan 2021\Deliverables\Desseminatation\Mobile Spectrum and Network Evolution to 2025 - Coleago - 24 Mar
© copyright Coleago 2021107
6.4 Regulatory considerations
We would observe, finally, that the 100 Mbit/s date rate requirement is not the same as a guaranteed data rate. The economics of mobile networks are driven by the fact that radio access network resources are shared between users. This is the key reason why per Gbyte retail prices for mobile data services have declined substantially and, with the introduction of 5G, continue to decline at a fast rate.
In a shared network, the user experienced data rate is dependent on the probability of simultaneous demand from multiple users in a given cell. Providing a guaranteed data rate for all users would not be feasible from an economic perspective. The area traffic capacity supply is derived from an average spectral efficiency which cannot guarantee that the user experienced data rate is delivered consistently at all times.
Therefore, it would be inappropriate to turn the ITU-R IMT 2020 requirement for a 100 Mbit/s user experienced rate into a regulatory obligation. One of the features of 5G is network slicing. This enables mobile operators to deliver a guaranteed data rate, but at a higher price.
It would be inappropriate to turn the ITU-R IMT 2020 requirement for a
100 Mbit/s user experienced rate into a regulatory obligation.
What is important is that consumers are able to be well informed about performance differences between
operators to support purchasing decisions.

Mobile Services, Spectrum and Network Evolution to 2025
C:\Users\stefa\Dropbox\Projects\Huawei Spectrum Evolution Jan 2021\Deliverables\Desseminatation\Mobile Spectrum and Network Evolution to 2025 - Coleago - 24 Mar
© copyright Coleago 2021108
7. Spectrum management and pricing
7.1 Public policy objectives
The overarching aim of public policy must be to promote superior social outcomes, both in the near- and long term. In the context of spectrum management, this would entail:
High welfare (consumer surplus) generated by high adoption and use of mobile communications services, at sustainably low or moderate prices;
Increased digital participation;
A strong positive contribution from mobile to economic growth, employment and productivity.
Direct transfers from the industry to the state in the form of licence fees might also seem desirable to policy makers, but this should never be achieved at the expense of welfare and economic development.
Spectrum management can be used to advance the key social objectives by:
1. Driving efficient use of spectrum
2. Fostering sustainable and efficient competition
3. Promoting innovation and investment in networks and services
Exhibit 86: Spectrum policy objectives
Source: Coleago
Driving efficient use of spectrum
To maximise output from this scarce national resource, regulators need to promote efficient technical use of spectrum. Operators already have strong incentives to ‘squeeze’ the most out of their usage rights, by deploying technical enhancements to maximise throughputs per Hz.
Regulators can play their part by awarding spectrum on a technology-neutral basis, allowing operators, driven by competition, to pursue the most efficient strategies. In addition, regulators can promote technical efficiency by:
Packaging spectrum in wide, contiguous blocks (see sections 5.3 and 7.6.4); and
Public policy objectives
1. Efficient use of spectrum
2. Sustainable competition
3. Investment and innovation
a) Welfare generation (Consumer Surplus)
b) Higher digital participation
c) Drive growth in productivity, employment and GDP
d) Drive transfers from the industry to the state?
1.1 Efficient packaging of
spectrum
2.1 Avoid excessive concentration of
spectrum
3.1 Regulatory certainty
1.2 Efficient allocation of spectrum
2.2. Reduce financial burden on operators
3.2 Opportunity for industry to earn ROIC
aligned to WACC
1.3 Interference coordination & coexistence
Wider access to mobile
Higher adoption of services
Higher use of mobile
Wider mobile coverage
Higher network capacity
Lower retail prices
Higher digital participation
Higher consumer welfare (CS)
Higher GDP, employment= =
Sustainably better social outcomes should be the overriding object of
public policy.

Mobile Services, Spectrum and Network Evolution to 2025
C:\Users\stefa\Dropbox\Projects\Huawei Spectrum Evolution Jan 2021\Deliverables\Desseminatation\Mobile Spectrum and Network Evolution to 2025 - Coleago - 24 Mar
© copyright Coleago 2021109
Pursuing effective policies related to interference-coordination and coexistence between spectrum users across the industry (see section 7.5.).
Efficient use of spectrum also entails that it is in the hands of those who will generate the greatest benefits for society from it. We refer to this as ‘allocative efficiency’. This is often taken to mean that subject to competition safeguards, spectrum should be directed to those who value it the highest and might thus be expected to put it to the most productive use.
However, there may be significant differences between what yields the highest private value to individual operators versus what deliver the highest value to society. Ignoring competition safeguards, for example, one would find that allocating all spectrum to a single party would generate huge monopoly value but a very poor outcome for consumers. Spectrum allocation mechanisms are is discussed further in section 7.2.
Fostering sustainable and efficient competition
That competitive rivalry between mobile operators drives superior outcomes for consumers and businesses is uncontroversial. However, network competition also involves parallel infrastructures and organisation, hence higher supply costs on aggregate. In a four-player market, much of a single operator’s costs are duplicated twice.
A balance needs to be struck between the level of competition and the degree of cost duplication, to generate the best outcome. Too many operators would also generate insufficient profits, collectively, to be sustainable.
Whether the optimum is 3, 4 or even 5 network operators in a specific market, regulators have a key role to play in ensuring the sustainability of the industry and of competition. In particular:
Avoiding excessive concentration of spectrum usage rights by a minority of existing operators; and
Pursuing policies that reduce rather than increase the total financial burden on operators.
Promoting increased sharing of infrastructure between operators is one measure that would help alleviate total costs. In addition, regulators should avoid overcharging for spectrum inputs, as discussed at length in section 7.3.
Promoting innovation and investment in mobile networks and services
Innovation and investment are driven primarily by incentives: adequate prospects for returns-generation. Competition plays a part too: if money is too easily made, there may be less of a drive to improve infrastructure and services. An adequate reward does not entail super-normal profits in perpetuity, but rather the expectation of returns meeting the risk-adjusted cost of capital invested in a project.
Aspects that dissuade investment include:
Regulatory uncertainty (hence risk);
Doubts about the future sustainability of a venture; and
Excessive financial and operational leverage, which increase risk.
Uncertainty about future spectrum costs is a highly relevant factor in the mobile industry, which is why policies that focus on driving higher spectrum fees threaten investment.
Excessive spectrum concentration and excessive spectrum prices
threaten the sustainability of competition in mobile markets.

Mobile Services, Spectrum and Network Evolution to 2025
C:\Users\stefa\Dropbox\Projects\Huawei Spectrum Evolution Jan 2021\Deliverables\Desseminatation\Mobile Spectrum and Network Evolution to 2025 - Coleago - 24 Mar
© copyright Coleago 2021110
7.2 Spectrum award mechanisms
Spectrum licences can be awarded (or renewed) on an administered basis, such as through a ‘beauty contest’, or through an auction.
Beauty contests were common for the issue of 2nd and 3rd mobile licences in the 2G era. The problem is that “beauty lies in the eye of the beholder” ‒ making such a process vulnerable to political criticism and/or litigation.
Auctions for the award of spectrum have become the norm, precisely because they yield an objective allocation criterion, which is deemed fair to all candidates. A perceived additional benefit is that competitive bidding may drive up spectrum revenue for the state ‒ albeit as discussed in section 7.3, this may not actually maximise social utility.
The main problem with auctions is that private valuations may not correspond with social value: operators may ascribe high values to spectrum for the wrong reasons. For example, spectrum becomes highly valuable if acquiring it forecloses or diminishes competition. Furthermore, the main spectrum auction formats each have their own vulnerabilities.
Exhibit 87: Overview of main spectrum award mechanisms
Source: Coleago
Simultaneous Multi-Round Ascending Auction (SMRA)
In the simultaneous multi-round ascending auction format (SMRA), winners pay the amounts of their final winning bids (‘first price rule’). This incentivises collective demand reduction: the quicker all operators agree on an allocation, the less everyone pays.
This may actually lead to efficient allocations. In a three-player market, it may indeed be efficient for each operator to secure a third of the resources on offer. However, when an obvious division of the spectrum (‘focal point’) does exist, demand moderation by one party could lead to spectrum being secured by less efficient users.
Combinatorial Clock Auction (CCA)
In combinatorial clock auctions (CCA), participants bid on spectrum packages rather than individual spectrum lots. Bidders either win an entire package in their bid list, or nothing at all. This avoids the risk of securing an unwanted subset of a target package at a price that makes it unprofitable. In addition, a generalised ‘second-price rule’ is

Mobile Services, Spectrum and Network Evolution to 2025
C:\Users\stefa\Dropbox\Projects\Huawei Spectrum Evolution Jan 2021\Deliverables\Desseminatation\Mobile Spectrum and Network Evolution to 2025 - Coleago - 24 Mar
© copyright Coleago 2021111
applied, under which the winners pay the lowest amount needed to justify their allocation while avoiding ‘unhappy losers’70.
The second price rule ostensibly incentivises truthful bidding, which would increase the chances of allocating resources to those who value it the most71.
There are two main problems with this:
Under the second price rule, actual price exposure is often hard to gauge, making it very difficult for participants with fixed budget constraints to develop bid strategies that would lead to an efficient allocation; and
There is a risk of significant adverse price differentials: a financially constrained bidder may win an inferior package yet pay a total amount than a rival (as occurred in the Swiss multiband auction in 2012).
Adverse price differentials are embarrassing and difficult to explain to stakeholders. Moreover, participants in a spectrum auction may be more concerned about price differentials than necessarily the total amount paid. It is easier to explain a high price, when all rivals pay similar amounts, than a higher relative price.
In a CCA, prices paid are determined by the losing bids of rivals. The higher the bids (for larger packages that actually secures), the more rivals end up paying. Spiteful bidding, either to cause financial harm to rivals or to minimise the risk of adverse differentials, is a big problem. If all participants engage in spiteful bidding, they may end up overpaying collectively.
The 2012 Netherlands multiband auction, for example, lead to a distribution of usage rights that seemed entirely consistent with the relative market positions of the main operators. Such an outcome could easily have resulted from demand moderation in an SMRA. However, the total price paid was in the order of a third of aggregate Enterprise Value. Such massive transfers from the industry to the state can have a deeply negative impact on investment and consumer outcomes, as discussed further in section 7.3 below.
Administered allocations
There are situations in which an obviously desirable outcome exists. For example, in a market with four roughly equivalent operators and no prospect for new market entry, an allocation of 100MHz in the 3.4-3.8GHz band to each player is bound to be highly efficient. Each would enjoy the highest possible channel performance, and equal allocations would avoid competitive distortions.
It is of course possible that a different allocation would be even more efficient, however this is unknowable. No auction format can be guaranteed to produce the absolute optimum. Indeed, auctions can deliver palpably undesirable outcomes, due to strategic bid behaviour.
In our four-player example, an equal administrative allocation to each operator (perhaps after gauging demand from prospective entrants) would guarantee a high degree of efficiency. Our view is that this would reflect better policy than launching an auction, in such circumstances. This would also provide certainty over prices paid, thus avoiding the risk of crippling overpayments.
70 A loser is deemed ‘happy’ if given her bids, she was not willing to pay a higher price for the package than actually paid by the winner.
71 Since one only pays the minimum needed to win, there is no penalty for reflecting high actual valuations in the bids.
Spectrum auctions are risky, both for regulators and participants. They may
also deliver undesirable outcomes, due to strategic bid behaviours.

Mobile Services, Spectrum and Network Evolution to 2025
C:\Users\stefa\Dropbox\Projects\Huawei Spectrum Evolution Jan 2021\Deliverables\Desseminatation\Mobile Spectrum and Network Evolution to 2025 - Coleago - 24 Mar
© copyright Coleago 2021112
A third way
An efficient allocation of spectrum between candidates may not always be in evidence. For example, it may not be practicable to divide 400MHz in three equal blocks between three operators, sue to channel-size restrictions.
In the three-player market case, one might consider an administered allocation of 100MHz to each of the three operators and auction the remaining 100MHz. Under this approach, each operator has a viable starting point which they do not need to fight over.
This would guarantee a minimum level of efficiency, since an outcome in which one operator secured less than 100MHz would likely be undesirable. It also reduces the potential adverse impact of strategic bidding, because this problem would be confined to residual spectrum rather than the entire block on offer.
A recent precedent for such an approach is the 3.5GHz award in in France. ARCEP chose to allocate 50MHz to each of the four operators, and to auction the rest (110MHz ‒ note that 90MHz in the 3.40-3.49GHz range remains unavailable until 202672). This ensured that each operator had a reasonable starting allocation, while giving an opportunity to one or two operators to assemble a 100MHz package.
We feel that this innovative hybrid approach combines the best aspects of administrative and a market-based award mechanisms: it reduces auction risk, without interfering too deeply with the final allocations. Allowing operators to determine the allocation over the portion of spectrum for which an efficient distribution is less clear makes eminent sense.
7.3 The trade-off between licence fees and socio-economic outcomes
7.3.1 Policies relating to licence-fee generation
Licence fees paid by operators differ widely between countries, due largely to government policy. Some governments focus on “revenue extraction”. These seek to extract a significant amount of up-front cash from spectrum licences. This may be achieved, for example, by setting high reserve prices (opening bids) at spectrum auctions, by creating artificial spectrum scarcity, or by implementing auction designs that drive competing participants to bid and pay in excess of natural spectrum market clearing prices.
In contrast, other countries prioritize telecoms or digital development objectives. Governments in these countries seek to maximise the value of spectrum to society by making spectrum available to operators as cheaply as possible so that operators have sufficient cash available to invest in their mobile networks. As a result, consumers benefit from denser networks, wider coverage, faster mobile speeds, and more affordable services.
7.3.2 International examples
Recent 5G related spectrum auctions in Europe demonstrate the effect of government policy on spectrum auction reserve prices and final prices paid. In the European Union, Finland and Italy are complete opposites with regards to spectrum pricing policy. Finland seeks to make spectrum available to operators as cheaply as possible. Italy seeks to generate substantial revenue from the sale of spectrum licences. Reserve prices and prices actually paid for 5G spectrum in the 700 MHz band were respectively
72 The delay in allocation of the final 90MHz creates a different kind of problem (band-fragmentation), as discussed in section 7.6.4. However, this unfortunate aspect does not diminish our positive assessment of ARCEP’s choice of allocation mechanism.
In the recent 3.5GHz award in France, ARCEP allocated 50MHz on
an administered basis to each operator, while auctioning the
remainder.
ARCEP’s hybrid administered plus auction approach provides the best of
all worlds: risk reduction without necessarily interfering too deeply with
the final allocation.
Differences in prices paid for licences between countries are to a large
extent due to differences in policy objectives.

Mobile Services, Spectrum and Network Evolution to 2025
C:\Users\stefa\Dropbox\Projects\Huawei Spectrum Evolution Jan 2021\Deliverables\Desseminatation\Mobile Spectrum and Network Evolution to 2025 - Coleago - 24 Mar
© copyright Coleago 2021113
2.6x and 3.0x times higher in Italy than in Finland. As outlined in Section7.3.4, Finland significantly outperforms its peers in terms of telecoms infrastructure and services. This success can largely be ascribed to the specific policy choices pursued in Finland.
France provides a good illustration of how a change in government policy leads to very different prices being paid for spectrum before and after the change in policy. Previously, France pursued a policy of revenue-extraction from the award of spectrum licences. In the 700 MHz auction in November 2015, the reserve price was more than 3x higher than that in Finland. In 2018 however, when the regulator renewed spectrum licences in 900 MHz, 1800 MHz and 2100 MHz (that were expiring between 2021 and 2024), the Government decided not to auction the spectrum nor to charge a renewal fee. Instead, the Government asked mobile operators to invest more in rural mobile broadband coverage. This change in policy was clearly articulated by the regulator, AECEP, as shown in Exhibit 88.
Exhibit 88: Change in Government spectrum pricing policy in France
Implementing 4 new principles to generalize a good quality mobile coverage for all
1. Change of paradigm for the State For the first time in a frequency allocation, the digital coverage of the territory takes precedence
2. Operators’ commitments for a gradual improvement of mobile coverage in the daily life of the people
Generalization of 4G coverage, coverage of major roads, indoor coverage, no more obligation of coverage in terms of a % of the population
3. A solution for challenge areas Operators will use their own funds where the authorities have identified coverage needs
4. Acceleration of digital coverage throughout the country
The Government will implement measures to simplify deployments under the Housing Bill; other regulatory measures will follow.
Source: ARCEP perspective on spectrum issues73
In contrast, operators in Germany paid a collective €3.751 billion in 2015 to renew expiring licence in 900 MHz and 1800 MHz. In 2019, they paid a further €2.374 billion to renew 2100MH licences, leading to a combined total of €6.125 billion, versus zero in France.
In Latin America, the 700 MHz spectrum assignment in February 2014 in Chile provides a further example of policy objectives driving spectrum prices. The 700 MHz spectrum award process focussed on connectivity objectives, such as covering rural towns, and on ensuring that all three large mobile operators obtain spectrum, rather than extracting money from the mobile industry. Operators paid only 0.017 US$/ MHz/capita for their 15-year 700 MHz spectrum licences, whereas in other countries which focussed more on extracting revenue from the allocation of spectrum, operators paid in excess of 0.50 US$/ MHz/capita.
Further examples in which regulators focused on coverage obligations rather than direct spectrum auction fee generation include Sweden, the UK, Germany (800 MHz), Ghana, Denmark, Colombia, and Nepal. Such policies explicitly recognise the high socio-economic value of digital participation.
73 “Spectrum 5.0: New Directions in Spectrum Award for 5G”, page 11, Pierre-Jean Benghozi, ARCEP, Paris, 5th of October 2018
Mobile Services, Spectrum and Network Evolution to 2025
C:\Users\stefa\Dropbox\Projects\Huawei Spectrum Evolution Jan 2021\Deliverables\Desseminatation\Mobile Spectrum and Network Evolution to 2025 - Coleago - 24 Mar
© copyright Coleago 2021114
Clearly, the differences in licence fees paid across different markets are largely a matter of policy choice. For the reasons outlined in the rest of this report, we firmly believe that the public interest is best served by policies that prioritise telecoms investment and retail market outcomes over direct licence fee income. Mobile licence and spectrum policy should not be used as an instrument to finance the State: the focus should be on welfare generation and the promotion of economic growth. Policies that maximise socio-economic outcomes on aggregate must per definition reflect best international practice.
7.3.3 The ‘Sunk Costs’ myth
It is sometimes argued that lump-sum fees charged for operator-licences do not bear on subsequent management decisions, because these fees effectively become Sunk Costs. According to the theory, a corporation seeks only to maximise its future returns, and costs incurred in the past do not alter its optimal, forward-looking strategy.
If this Sunk Cost hypothesis were true, then short of bankrupting the industry, regulators could charge as much as they wished to renew licences, with little or no effect on retail market outcomes. From a policy perspective, this would represent a ‘free lunch’, in which the state could extract maximum licence payments from the industry while maintaining all of the welfare benefits generated by the industry’s activities. Yet this hypothesis is amply refuted by both experimental and empirical evidence.
Consider, first, the experimental evidence (empirical evidence against the Sunk Costs hypothesis is presented in Section 7.3.4 below). Laboratory research carried out by Offerman and Potters in 2006 examined whether subjects’ pricing decisions in competitive games where influenced by prior auction or fixed licence payments74. Their report concludes:
“Both in the Fixed Cost and the Auction treatment players charged significantly higher prices than in the Baseline treatment. In the long term, when the entry licences had been re-allocated a couple of times, the difference in average price levels between the treatments tended to become smaller. Nevertheless, even in the longer term, we found a significant positive correlation between entry fees and prices.” 75
These results clearly indicate that rational individuals take historical payments into account in their strategies, and with good reason: sunk costs are not simply forgotten.
Licence costs are carried forward for many years in the balance sheet. If these are funded through debt, the increased leverage may result in reduced credit quality, leading to higher costs of capital. Net income is reduced by increased interest expenses and by the licence amortisation costs. A larger capital base and reduced income reduces Returns on Invested capital (ROIC).
Even if the management teams of all the operators in the market were populated with perfect amnesiacs (who took no account of the past), one would still have to contend with Principal-Agent relationships. Against a backdrop of reduced industry earnings and ROIC, collective shareholder appetite for price wars and/or large capital expenditure programmes is likely to be significantly diminished.
Because large upfront licence fee payments increase the operators’ capital at risk, both willingness and ability to take risk tends to drop. More conservative strategies across
74 ‘Does Auctioning of Entry Licences Induce Collusion? An Experimental Study’, T. Offermann and J.Potters, 2006, Review of Economic Studies, 73(3), 769- 791. The experiment involved a total of 166 students (presumably, drawn largely from the Tilburg University School of Economics and Management). These subjects were likely in a position to make rational decisions affecting their own payoff, which averaged €19.8 per participant (a significant sum for students at the time, for the limited time involved).
75 The ‘Baseline treatment’ alluded to in this report relates to instances of the game in which participants do not pay an upfront fee to trade.
The public interest is best served by policies that prioritise investment and
favourable telecoms market outcomes over direct licence fee
receipts.
The State cannot extract vast amounts of capital from critical
industries without diminishing the welfare benefits that these industries
generate for society.
The Sunk Costs hypothesis is amply refuted by experimental as well as
empirical evidence.

Mobile Services, Spectrum and Network Evolution to 2025
C:\Users\stefa\Dropbox\Projects\Huawei Spectrum Evolution Jan 2021\Deliverables\Desseminatation\Mobile Spectrum and Network Evolution to 2025 - Coleago - 24 Mar
© copyright Coleago 2021115
operators are logical responses to heightened investor risk-aversion. These may result in higher retail prices and/or reduced investment. Operators might not respond to increased costs by increasing tariffs. Instead, more expensive price plans arise due to a slowing down of general price erosion ‒ while reduced investment could lead to curtailment or delays in network expansion as well as 4G and 5G deployment.
7.3.4 Historical evidence on the welfare impact of licence fees
International research by NERA Economic Consulting for the GSMA indicates an empirical link between licence costs and retail prices, and an inverse relationship between licence costs and mobile industry output76. NERA observe that:
“…where governments adopt policies that extract excessive financial value from the mobile sector in the form of high fees for spectrum, a significant share of this burden is passed onto customers through higher prices for mobile and lower quality data services.”
NERA’s quantitative findings are discussed further in Section 7.3.5. We find support for its conclusions from several credible sources, as discussed below. In the following, we focus first on direct evidence from a range of markets.
European Commission views
In the aftermath of the 2012 Netherlands multiband auction, Neelie Kroes, Vice President European Commission and Digital Agenda Commissioner at the time, exclaimed:
“Was nothing learned from previous auctions for UMTS [3G] frequencies, when the share price of KPN dropped substantially and the ecosystem of small supply companies in the telecom sector was severely damaged? … Telecom companies paid high prices. KPN saw a further decline in its credit rating. Prices for attracting money for infrastructure investments are expected to rise. The rollout of high-speed internet will slow down and the suppliers will be put out of business. This ‘Christmas gift’ could be a huge burden for the sector, and for all other businesses, entrepreneurs and citizens who need super-fast mobile internet”.77
More recent statements by the European Commission further underscore NERA’s concerns about the impact of fees on investment in the context of 4G:
“…there is […] evidence that high [licence] prices can be associated with lower 4G availability.”78
A lack of 4G availability is a symptom of underinvestment, and what is true for 4G must undoubtedly hold for other mobile technologies as well.
Evidence from Finland
Finland provides clear empirical evidence that low spectrum fees result in better digital communications infrastructure. Finland has consistently pursued a policy of low spectrum fees in to allow operators to invest more in their networks. From our separate analysis of the Finnish market, we find that the annualised cost of spectrum amounts to a mere 1.4% of mobile industry revenue. As a result, mobile operators in Finland have built very high-density mobile networks, which deliver excellent availability and high download speeds.
76 See NERA, 2017: ‘Effective Spectrum Pricing: Supporting better quality and more affordable mobile services’, R,Marsden, B.Soria and H-M.Ihle.
77 Neelie Kroes’ blog, 11th January 2013; available at: http://ec.europa.eu/commission_2010-2014/kroes/en/blog/.
78 European Commission News Article, 23 October 2017 (ibid).
The conclusion that high licence fees lead to inferior mobile market
outcomes is supported by credible sources and by empirical evidence
from a broad range of markets.

Mobile Services, Spectrum and Network Evolution to 2025
C:\Users\stefa\Dropbox\Projects\Huawei Spectrum Evolution Jan 2021\Deliverables\Desseminatation\Mobile Spectrum and Network Evolution to 2025 - Coleago - 24 Mar
© copyright Coleago 2021116
Finland has the densest LTE cell-site grids, but below average number of spectrum bands deployed per LTE site. It outperforms most European countries in key LTE performance metrics –even in the most loaded hours of the day– despite having 8x the European average and 17x the German traffic load, normalised for population79. Tellingly, prices for prime 4G spectrum in the 800 MHz band was almost 2x higher in Germany than in was in Finland.
The average monthly mobile data usage per SIM in Finland already exceeded 20 GBytes in mid-2020, and this includes IoT SIMs (the majority of which use very little data). This is the highest in the world80. In 2018, three of the top four best performing mobile broadband networks are in Finland as shown in Exhibit 89 below.
Exhibit 89: Finland leads in mobile broadband
Source: Elisa Capital Markets Day presentation, 2018
Further historical evidence from EU countries
Offermann and Potters offer further historical evidence of a positive relation between licence fees paid by mobile operators and mobile retail prices, based on 1999 price data from the European Union81:
“Within the European Union the highest licence fees (more than 200 million Euro for the most valuable licences) have been paid in Austria, Belgium, the Netherlands, and Ireland, and the lowest fees (less than 5 million Euro) in Denmark, Finland, Luxembourg, and Portugal. Annual tariffs for a representative basket of services average about 750 Euro in the former four countries, but only 550 Euro in the latter four countries.”82
Differences in levels of competition may blur comparisons. However:
“Ireland and Luxembourg are two countries with only two mobile operators. The most expensive licence in Ireland was 216 million Euro and average annual tariffs are about 1300 Euro. Luxembourg had licence fees less than 4 million Euro and annual tariffs of about 700 Euro.”83
In this specific example, the price of the mobile consumption basket in the high licence-fee market was almost twice as high as that in the country with the lower licence fee. Such a high differential cannot be ascribed to differences in population density. For example, the population density in Belgium (a high tariff country at the time) is almost
79 Rewheel-Tutela public research study, 18th February 2019. 80 Source: tefficient.com. 81 T. Offermann and J.Potters, 2006, ibid. 82 Offermann and Potters quote the following original source: European Commission, ‘Fees for
Licensing Telecommunications Services and Networks’, Second Interim Report, European Telecommunications Office (ETO), July 1999.
83 Offermann and Potters quote the following original source: European Commission, ‘Fifth Report on the Implementation of the Telecommunications Regulatory Package’, COM(1999)537-final (Luxembourg: Office for Official Publications of the European Communities).
In Finland, the annualised cost of spectrum amounts to a mere 1.4% of mobile industry revenue. As a result,
mobile operators in Finland have built a very high-density mobile network which delivers excellent availability
and high download speeds.

Mobile Services, Spectrum and Network Evolution to 2025
C:\Users\stefa\Dropbox\Projects\Huawei Spectrum Evolution Jan 2021\Deliverables\Desseminatation\Mobile Spectrum and Network Evolution to 2025 - Coleago - 24 Mar
© copyright Coleago 2021117
70x higher than that in Finland (a low tariff country). It is also worth noting that Belgium had three mobile network operators in 1999, while Finland’s third operator only launched in 2000.
Evidence from the United States
We maintain that public policy towards the mobile sector should be focused on maximising social efficiency rather than on financing the state. This view is shared by Professors Thomas W. Hazlett and Roberto Munoz in particular, who argue that:
“…to maximise consumer welfare, [telecoms policy] should avoid being distracted by side issues like government licence revenues.”84
Their main point is that the wider economic value (in terms of Consumer Surplus85) generated by the mobile industry far outstrips direct spectrum proceeds, and that measures that jeopardise the former in favour of the latter tend therefore to be “penny wise and pound foolish”. According to their analysis:
“…the ratio of social gains [is of] the order of 240-to-1 in favour of services over licence revenues.”86
On this basis, they conclude:
“A policy that has an enormous impact in increasing license revenues need impose only tiny proportional costs in output markets to undermine its social utility. So, for example, a new auction design that (heroically) doubled auction revenues would, if it reduced consumer surplus by just one-half of one percent, produce costs in excess of benefits”.
7.3.5 Quantitative cross-country research
Based on their econometric demand modelling, NERA show that reductions in licence fees would be more than offset by increases in Consumer Surplus (CS)87. The ratio of increases in welfare (in CS terms) to decreases in licence fees for 15 markets in their dataset is shown in Exhibit 90 below. These were markets in which licence fees exceeded the global median on a population and purchasing power parity (PPP) adjusted basis, and the calculations assume that licence fees are reduced to the global median.
On aggregate, NERA find that the governments in these markets could have generated incremental value for society with a purchasing power of US$250 billion, had they surrendered as little US$98 billion in direct licence-fee receipts (on a PPP-adjusted basis)88.
84 Thomas W Hazlett, Roberto E. Muñoz, “What really matters in spectrum allocation design”, Northwestern Journal of Technology and Intellectual Property, Winter 2012. Professor Hazlett served as Chief Economist of the US Federal Communications Commission. While their study was directed at spectrum allocation policy, their findings relate directly to licence fees.
85 Consumer Surplus is the difference between the price consumers would be willing to pay for certain goods or services and the price actually paid. It is a key measure of economic welfare.
86 Using market data in the United States between 1991 and 2008, Hazlett et al obtained a lower-bound estimate for the 2009 Consumer Surplus in the order of $200 billion per year, or $4,000 billion in present-value terms (using a 5% discount rate). This is 80x greater than the roughly $50 billion raised by the FCC on a cumulative basis through spectrum auctions by 2008. They argue further that in order to compare efficiency gains, the social savings implied by auction receipts need to be considered rather than the pure transfers. In other words, the avoided deadweight losses that would have been incurred by using alternative means of revenue-generation should be taken as a basis. Assuming deadweight losses of 33%, the $50 billion raised /by the FCC corresponds with social savings of around $17 billion. This yields a ratio of about 240x in favour of retail market efficiencies.
87 NERA, 2017 ibid. 88 The average ratio of gains to foregone licence fees is 2.6x. The US$250 billion gain quoted by
NERA thus corresponds with a reduction of 250/2.6 =US$98 billion.
As of 2009, the ratio of social gains was around 240-to-1 in favour of
mobile services over licence revenues in the US.
Increases in welfare exceed foregone mobile licence fee receipts by an
average of 2.5-to-1.

Mobile Services, Spectrum and Network Evolution to 2025
C:\Users\stefa\Dropbox\Projects\Huawei Spectrum Evolution Jan 2021\Deliverables\Desseminatation\Mobile Spectrum and Network Evolution to 2025 - Coleago - 24 Mar
© copyright Coleago 2021118
While the weighted average ratio of gains to foregone licence fees in this sample was 2.5-to-1, the median was 3.4-to-1 and the lowest (India) was 1.5-to-1, implying gains at least 50% higher than the foregone direct fee income for the State.
Exhibit 90: Ratio of increases in welfare to reductions in licence fees
Source: NERA, 2017
By extension, we may conclude that the net (absolute) welfare gains would have been even higher across the sample if licence payments were kept below global median prices. If costs are passed on to consumers, competition would normally ensure that savings are passed on too. In competitive markets, we would typically expect long-term industry returns to converge towards the industry’s cost of capital.
Finally, if reducing licence fees boosts welfare, then it follows that increasing them will diminish it. It may reasonably be assumed that over time, the ratio of welfare losses to increases in licence fees will be similar to the ratio of welfare gains to decreases in licence fees.
7.3.6 Further impact of licence fees on the national interests
In addition to the consumer welfare impact, mobile communications have a strong indirect influence on overall productivity and GDP growth.
From the evidence presented in Section 7.3.4, we can conclude that higher mobile licence fees result in higher retail prices and/or reduced investment in mobile infrastructure and services. Both of these would have a negative impact on the adoption of mobile and mobile data, as well as on data consumption per data user. This, in turn, would reduce GDP growth, leading to unrecoverable GDP losses.
A lower GDP would also have a negative impact on the fiscal balance. For example, suppose that tax receipts in a given country amount to 15% of GDP. This would mean that for every $100 in foregone GDP (due to excessive spectrum costs), the state would stand to lose $15 in direct tax revenue. Any assessment of the impact of mobile licence pricing on the fiscal balance should also take this indirect effect into account.
Finally, as a general rule, policy makers should consider the impact of their policy choices on the sustainability of competition in the sector. Mobile competition is only sustainable if all operators are able to earn their cost of capital in the long term.
In the shorter term, excessive licence fees could lead to financial distress for later entrants and market challengers, driving premature or unwanted market consolidation ‒ which could introduce further threats to consumer interests. Policy-makers should
In addition to the direct impact of licence fees on consumer welfare,
policy makers need to take account of the indirect impact on productivity,
GDP growth and tax revenues.
Mobile Services, Spectrum and Network Evolution to 2025
C:\Users\stefa\Dropbox\Projects\Huawei Spectrum Evolution Jan 2021\Deliverables\Desseminatation\Mobile Spectrum and Network Evolution to 2025 - Coleago - 24 Mar
© copyright Coleago 2021119
bear in mind that spectrum fees are fixed costs, which have a deeper proportional financial impact on operators with lower market shares. Excessive prices can lead to undue spectrum concentration by market leaders, as discussed in the next section, or even to unsold spectrum as was recently the case in India (see section 3.7).
7.4 Sustainable spectrum pricing
Given the above, one might ask ‒ at what point do spectrum prices threaten the sustainability of the mobile industry in its existing form, or materially alter the outcomes for consumers? We do not believe there is a fixed cut-off point ‒ this is, rather, a matter of degree.
For the reasons outlined in the preceding sections, we believe that provided the market is sufficiently competitive, higher spectrum prices are invariably worse for all stakeholders than lower prices. The more abundant and cheaper the spectrum, the better.
Nevertheless, as a rule of thumb applied at the industry level within any given market, we would affirm that if the aggregate annualised costs of all spectrum holdings exceed 10% of combined revenues, substantial damage to public interests may ensue ‒ while aggregate costs below 5% of revenues are less likely to cause significant harm.
Calculating total costs of spectrum ownership
Depending on the country, the calculation of the annualised cost of spectrum can include one or two elements:
An up-front spectrum licence fee for a 15 or 20-year licence which tends to be substantial and is usually the result of a spectrum auction. Fees paid for spectrum in the past need to be financed by loans or by shareholders. Interest has to be paid on loans, i.e. this is a cost. Over the term of the licence, for example 20 years, the cost of the spectrum licence which sits on the operators’ balance sheet is amortised, i.e. each year 1/20th is passed as a cost though the income statement.
Some countries charge an annual spectrum licence fee instead of an up-front fee. For example, in the UK after the expiry of the initial licence term operators pay an annual fee set by the regulator. In the recent spectrum auction in Indonesia operators bid an annual fee instead of an up-front fee. In Mexico an annual spectrum fee is set by law with and an additional up-front fee is determined through an auction process.
To calculate the annualised total cost of ownership (TCO), upfront lump-sums need to be converted into an annual equivalent using an annuity formula. The information required is readily available to regulators:
Prices paid for spectrum in past auctions in the country;
The licence durations in years;
The cost of capital to operators, a metric obtained from the operators in the market or investment banks; and
The total mobile market revenue in the current and the trend for the next 5 years.
Annual spectrum licence fees, if any, need to be added to the annualised cost of upfront spectrum fees to obtain the total annual cost of spectrum. The total annual cost of spectrum can then be compared with the annual industry revenue.
The annualised cost of spectrum methodology provides a single metric which allows regulators to compare the price of spectrum relative to the size of the mobile industry in their country. The key advantage of this approach is that it is forward looking rather than using benchmarks from past auctions. Using the annualised cost of spectrum methodology, regulators can look at their spectrum assignment roadmap and assess
Regulators can assess the sustainability of spectrum pricing in
their market by looking at the annualised cost of spectrum as a
percentage of mobile operator revenue.
The up-front fee paid for spectrum can be used in a standard annuity
formula which translates the up-front fee into an equivalent annual cost of spectrum, i.e. the annualised cost of
spectrum.

Mobile Services, Spectrum and Network Evolution to 2025
C:\Users\stefa\Dropbox\Projects\Huawei Spectrum Evolution Jan 2021\Deliverables\Desseminatation\Mobile Spectrum and Network Evolution to 2025 - Coleago - 24 Mar
© copyright Coleago 2021120
what level of spectrum pricing would be sustainable in the context of the mobile industry in their market. The “annualised cost of spectrum as % of revenue” metric makes it easy to identify excessive spectrum fees and communicate this to a non-expert audience, such as the ministry of finance or politicians.
Exhibit 91: Gauging the sustainability of fees for new spectrum
Source: Coleago
Exhibit 92: Annuity calculation formula
The annuity calculation formula to convert up-front spectrum fees into an annualised cost of spectrum
Annualised cost =
Up-front spectrum fee x cost of capital / (1 - (1 / (1 + cost of capital)) ^ years of licence term)
Note: The cost of capital is the weighted average cost of capital (WACC), a figure also used for regulatory cost accounting and hence available to regulators
Source: Coleago
Implications of the broadly flat evolution of industry revenues
There appears to be a widespread expectation among policy-makers that the value per MHz of incremental spectrum should be the same as that under historical awards ‒ and that the average price in $/MHz/capita should therefore be similar (or higher) in the future than it was in the past.
Exhibit 93: Mobile industry revenue per MHz of spectrum deployed
Source: Coleago
Up-front fees paid for spectrum in the past and years of licence
duration
Convert up-front fees paid in the past into an annualised
cost of spectrum
Add existing annual spectrum fees, if any
Proposed spectrum fee for new spectrum
Up to 5% likely to be sustainable
5-10% may be sustainable
Over 10% may not be sustainable
Industry revenueIndustry annual cost of
spectrum as a percentage of industry annual revenue
0
10
20
30
40
50
60
70
80
90
100
110
120
2007 2008 2009 2010 2011 2012 2013 2014 2015 2016 2017 2018 2019
Re
venu
e p
er
MH
z In
de
x 2
00
7 -
=1
00
Canada France Germany Singapore
Revenues per MHz are falling, so prices per MHz need to fall too in
order to remain sustainable.

Mobile Services, Spectrum and Network Evolution to 2025
C:\Users\stefa\Dropbox\Projects\Huawei Spectrum Evolution Jan 2021\Deliverables\Desseminatation\Mobile Spectrum and Network Evolution to 2025 - Coleago - 24 Mar
© copyright Coleago 2021121
However, if revenues do not increase, it follows that revenues per MHz decline as holdings increase. This is indeed what has been observed in most markets, where revenues have stagnated or declined during the last 10 years (see section 3.1).
If, in addition, average spectrum TCO per MHz remains constant, then it follows that the financial burden on the mobile industry increases every time new spectrum is released. Broadly flat industry revenues coupled with increasing total spectrum costs quickly become unsustainable.
In Mexico, for example, the Finance Ministry (SHCP) proposed to increase 800MHz and other spectrum fees in in 202089. AT&T responded by returning 800MHz spectrum usage rights to the government90. Telefonica had already announced that it would return spectrum in 800MHz and 1.9GHz, citing excessive prices (circa 15% of revenues, versus around 4% in its other 17 markets)91.
The result, clearly, is increased concentration of spectrum by market leaders, and a threat to sustained competition.
To avoid spectrum costs becoming an undue burden on industry, average TCO per MHz needs to decline substantially as total holdings increase. To bring down the average, marginal spectrum prices ($/MHz/capita) need to be much lower than average prices before the incremental spectrum release.
Exhibit 94: Cost per MHz to maintain spectrum TCO at 5% of revenues
Source: Coleago
Spectrum TCO in a sample of countries
Coleago has calculated the annualised cost of spectrum in a sample of countries as shown in Exhibit 95. Based on mobile industry service revenue the annualised cost of spectrum in Finland was 1.2%, in Germany 9.7% of revenue, in Singapore 6.8%, in the UK 8.4%, and in India 14.8%.
89 Source: BNAmericas, 14 September 2020; https://www.bnamericas.com/en/analysis/mexico-plans-spectrum-fees-upgrade-new-ones-for-5g.
90 Source: Commsupdate.com, 28 October 2020; https://www.commsupdate.com/articles/2020/10/28/att-returns-mexican-800mhz-spectrum-due-to-high-price/.
91 Source: Telecom Paper, 3 January 2020; https://www.telecompaper.com/news/telefonica-to-return-mexico-spectrum-assets--1321613.
0.000%
0.005%
0.010%
0.015%
0.020%
0.025%
0.030%
0 500 1000 1500 2000
Pric
e pe
r M
Hz
as %
rev
enue
s
Industry holdings in MHz

Mobile Services, Spectrum and Network Evolution to 2025
C:\Users\stefa\Dropbox\Projects\Huawei Spectrum Evolution Jan 2021\Deliverables\Desseminatation\Mobile Spectrum and Network Evolution to 2025 - Coleago - 24 Mar
© copyright Coleago 2021122
A cost of spectrum of up to 5% is less likely to slow down investment in mobile broadband and 5G. The evidence from Finland indicates that a lower percentage is likely to deliver better outcomes for 5G deployment (see section 7.3.4, and the commentary around Exhibit 89 in particular).
In many well developed 4G mobile broadband markets the annualised cost of spectrum is 5-9% of mobile operator service revenue as illustrated by the example from Singapore, Germany and the UK. This indicates that below 10% the annualised cost need not materially impact network deployment.
When the cost of spectrum amounts to 10% of mobile operator service revenue, mobile operators may hit budget constraints, i.e. investment in mobile broadband and 5G is likely to be slower than it otherwise would be. A cost of spectrum above 10% of revenue presents a threat to the development of 5G.
Spectrum TCO may also be viewed in the context of annual capital expenditures. As outlined in section 3.2, average global capex between 2020 and 2025 is projected to reach 17% of revenues. At 10% of revenues, the spectrum TCO would stand at 60% of capex ‒ a large proportion of the total global investment budget. Clearly the more capital is transferred from the industry to the state for spectrum usage rights, the less remains available to invest in actual networks.
Exhibit 95: Annualised cost of spectrum % of revenue, selected countries
Source: Coleago
Case study: India
Estimated 2020 industry capex in India was 23.4% of total service revenues92 ‒ significantly higher than the global average projected between 2020 and 2025. If we add the India spectrum TCO of 18.5%, we obtain a total investment burden of around 42% of revenues, which is exceptionally high.
Prior to the October 2016 auction for 700, 850, 900, 1800, 2100, 2300 and 2500MHz spectrum the annualised cost of spectrum based on 2016 revenue stood at 12.1%. This is a high figure, particularly given other high taxes on the mobile industry in India.
At the end of 2016 spectrum auction, the figure had risen to 14.8% based on 2016 mobile industry revenue. Mobile operators started to struggle. Rcom become insolvent while Vodafone and Airtel sought to reduce costs by merging their businesses.
Due to excessive reserve prices in the 2016 spectrum auction, much of the spectrum remained unsold including all of the 700MHz spectrum. Had all the
92 Based on Bank of America Merrill Lynch 2020 estimates (ibid).
18.5%
8.4%
6.8%
9.7%
1.4%
0.0% 5.0% 10.0% 15.0% 20.0%
India
UK
Singapore
Germany
Finland
Annualised Cost of Spectrum % of Revenue
When the cost of spectrum amounts to 10% of mobile operator service revenue, mobile operators may hit
budget constraints, i.e. investment in mobile broadband and 5G is likely to be slower than it otherwise would be.

Mobile Services, Spectrum and Network Evolution to 2025
C:\Users\stefa\Dropbox\Projects\Huawei Spectrum Evolution Jan 2021\Deliverables\Desseminatation\Mobile Spectrum and Network Evolution to 2025 - Coleago - 24 Mar
© copyright Coleago 2021123
spectrum been sold at the reserve price, the annualised cost of spectrum would have increased to 34.6% of 2016 revenue, a figure which is clearly not sustainable.
Since 2016, mobile industry revenue in India has declined sharply, so that by 2018 the annualised cost of spectrum stood at 18.5% of revenue. This is well above a level that sustains investment in the industry. India is now gearing up to sell C-Band and 700MHz spectrum.
The 700MHz spectrum would have been useful to bring much needed mobile broadband connectivity, especially in rural areas but instead it lies fallow. Not only did the DoT generated a mere 11.6% of the revenue they aimed to raise but they also damaged India’s digital development by preventing Indian mobile users from benefiting from the use of 700MHz spectrum. The situation is particularly regrettable, because following the announcement of the reserve price of the auction, in 2016 the GSMA sponsored Coleago to give a detailed presentation to the Department of Telecommunication (DoT) advising them that at the proposed reserve price none of the 700MHz would be sold.
Spectrum Price Index (SPI): an alternative metric
The ‘Spectrum Price Index’ (SPI) is another, related metric favoured by some regulators (e.g. ICASA in South Africa and Anatel in Brazil) to gauge the sustainability of spectrum pricing93. SPI is calculated as the upfront spectrum cost divided my monthly revenues (either at a market or operator level).
Exhibit 96: Spectrum Price Index
Source: Industry data
The three charts above show the SPI for 3G, 4G and 5G for some countries and some conclusions can be drawn:
The auctions for 3G related spectrum, chiefly 2100MHz, coincided with the dotcom boom and led to very high prices. Countries with an SPI above 6 experienced difficulties, including write down of licence fees, mergers which led to a lessening of competition, licences handed back without deployment and slower than expected 3G roll-out.
The SPI related to deploying 4G is lower in most cases. At the time of 4G related spectrum auctions, it had become clear that there were no material incremental revenues to be had. The big outliers in terms of 4G related spectrum pricing are India and Thailand. However, high prices led to much of the spectrum intended for 4G being unsold and the auction processes in Thailand do not deliver good outcomes for the much-needed development of mobile broadband in Thailand.
The SPI related to spectrum to support the deployment of 5G, notably the C-Band, is lower in most countries. An SPI above 2 may lead to slower than expected deployment or even unsold spectrum. Italy is a clear outlier. The C-Band auction in
93 Source: discussion with Huawei.
10.1
27.6
0.4 0.3
3.3
0.5
5.1
0.5
4.4
14.3
0
5
10
15
20
25
30
Fra
nce
Ge
rma
ny
Sp
ain
Au
stra
lia
Th
aila
nd
Me
xico
Ukr
ain
e
Nor
wa
y
Ita
ly
UK
p
2.63.8
1.5 1.6
13.5
4.42.5
1.0
5.6
1.1
26.2
0
5
10
15
20
25
30
Fra
nce
Ge
rma
ny
Sp
ain
Au
stra
lia
Th
aila
nd
Me
xico
Ukr
ain
e
Nor
wa
y
Ita
ly
UK
Ind
ia
Sp
ect
rum
Pri
ce In
de
x
0.3
5.9
0.40.8
1.8
0.30.6
1.0
0
1
2
3
4
5
6
Sp
ain
Ita
ly
Fin
lan
d
Ire
lan
d
S.K
ore
a
Cze
ch R
.
Au
stra
lia UK
3G SPI 4G SPI 5G SPI

Mobile Services, Spectrum and Network Evolution to 2025
C:\Users\stefa\Dropbox\Projects\Huawei Spectrum Evolution Jan 2021\Deliverables\Desseminatation\Mobile Spectrum and Network Evolution to 2025 - Coleago - 24 Mar
© copyright Coleago 2021124
Italy was designed to maximise prices paid by withholding spectrum and packaging the spectrum in a manner designed to create auction distortion. Italy suffers from a very high budget deficit which motivated the revenue extraction policy. Consumers and business will pay the price from reduced competition in 5G services.
There is a correlation between a high SPI and failed spectrum auctions. Hence the SPI provides an additional check as to what level of spectrum pricing may be sustainable. We recommend using the SPI in addition to the annualised cost of spectrum methodology.
7.5 Interference coordination, coexistence, TDD synchronisation
Radio interference becomes critical where multiple operators need to use adjacent or near adjacent spectrum (RF frequencies) and especially where multiple operators using multiple radio channels share the same physical cell site (site sharing). To enable multiple operators to coexist while using similar radio channels within the same spectrum bands requires careful management and enforcement by regulators particularly within dense metro environments where radio (RF) interference can extend to multiple cell sites in very short physical distance from each other (small cells).
Typically, the majority of potential interference is produced by multiple RF transmitters being close to (near field) multiple receivers. This can happen in the cell site and where customer handsets and devices are being used very close to each other, but the dominate cause of potential interference to the greatest number of customers comes from the cell site and antenna system. FDD is more tolerant of potential cell site interference than TDD as the in FDD the transmitters use a different frequency than TDD. There are a number of significant mechanisms which can produce RF interference but assuming the networks are configured correctly the two critical issues are RF (radio frequency) interference which effects both FDD and TDD systems and synchronisation interference which effects mainly TDD systems.
RF interference is caused by having a number (more than two) transmitters radiating within the near field of each other. Within this type of interference there are also two main contributing factors which are generally referred to as “adjacent-channel” interference and “Passive intermodulation” interference. The most destructive is adjacent channel-interference as it has the greatest effect on the capacity of the radio channels themselves and it is constant. Adjacent-channel interference can be controlled to a certain extend by installing RF filters to ensure that each transmitter only radiates within its allotted bandwidth. The filter characteristics are often called the “Band Edge Mask” (BEM) and are generally defined by the national regulator to ensure that all operators can be allocated all RF channels in the spectrum band without having to deploy “guard bands” to prevent adjacent-channel interference. Generally, regulators will define two types of BEM referred to as the “permissive mask” and the restrictive mask. All BEM filters will cause the RF carrier to be attenuated at the band edges and this attenuation will have the effect of reducing the capacity of the carrier compared to an unfiltered transmission. The permissive mask is the most straightforward and is a compromise between ensuring the minimum amount of RF power is radiated outside of the permitted bandwidth verses allowing the maximum amount of power is radiated upto the band-edge of the wanted channel. Typically a permissive mask BEM in TDD networks will reduce the gross capacity of the RF carrier by approx. 8% (20 MHz bandwidth channel) compared to an unfiltered channel. FDD systems are generally allowed to use a permissive BEM or even a spectrum band filter as adjacent receivers will be out-of-band from the transmissions. The restrictive mask requires a large reduction in RF power radiated within the adjacent channels and so this will have a knock-on effect of restricting RF power within the wanted bandwidth. Typically, the restrictive mask in TDD networks will reduce gross capacity of the RF channel by approx. 20% (20 MHz bandwidth channel) compared to an unfiltered channel. Generally, regulators only apply the restrictive mask to TDD systems where the operators cannot agree on a common synchronisation structure (Frame sync).
FDD is less affected by cell site interference than TDD as with FDD the site transmitters use a different
frequency than the site receivers.
Having adequate RF filters on the base transmitters can reduce or
illuminate adjacent channel interference at the cell site.

Mobile Services, Spectrum and Network Evolution to 2025
C:\Users\stefa\Dropbox\Projects\Huawei Spectrum Evolution Jan 2021\Deliverables\Desseminatation\Mobile Spectrum and Network Evolution to 2025 - Coleago - 24 Mar
© copyright Coleago 2021125
Passive Intermodulation (PIM) interference is caused by the action of two or more high power RF transmitters radiating in close physical proximity and where there is some form of non-linear passive (physical) devices in the near field. These passive devices can be almost anything from poorly tightened antenna mounting hardware to corroded steel-work or dissimilar metals bolted together. This is why this type of interference is referred to as “rust bolt effect”. When this happens, the devices will radiate RF energy as a by-product of the primary transmission, these products will be at a different frequency from the primary transmissions and will conform to strict multiples of the primary transmission frequencies. Generally the level of these PIM products will be much lower than the wanted transmission which caused them typically they will be greater than 90dB below the level of the wanted transmissions. However, in some cases, usually where large number of radio transmitters have been added over time in an uncontrolled manner, these by-products can be sufficiently large to cause interference to handset receivers close to the cell site. In these conditions the only solution is to investigate what is causing these passive products to be produced or to move some of the transmitters onto either different locations on the same site or adjacent sites.
Synchronisation issues and the resultant interference have the greatest impact within TDD networks as these use the same frequency to transmit and to receive the so called “TDD ratio”.It is essential that operators using the same cell site agree to a common TDD ratio and synchronisation schema.
As frequencies get higher and data-rates increase exponentially with bandwidth, so the need for accurate synchronisation becomes critical. This type of synchronisation requires an accurate time source typically a “stratum 1 clock” (time server) with all network elements linked to this source directly. Often cell sites have used GPS as their time source as this is linked to non-network based stratum 0 (zero) time source. There is significant debate regarding the accuracy of GPS in providing a suitable time server particularly in TDD networks using very high data rates.
A second type of synchronisation is “frame synchronisation” where the frame structure of the 5G packets is based on the available bandwidth and data rate of the physical RF channel. FDD networks use a different frequency to transmit than they do to receive they are generally accepted to have a DL/UL ratio of 1:1 (assuming a common modulation index). However, TDD networks will transmit for part of the time (downlink base-to-handset) and receive for the remainder of the time (uplink handset-to-base). Generally, the downlink will receive the majority of the time resource. This reflects the behaviour of the large numbers of internet entities which send and receive “packets” in the time domain (download then upload). Typically, the traffic on the internet is heavily biased in the download direction by a factor of between 8:1 and 4:1. With 5G networks operating in TDD mode a typical ratio for a balanced network is 3:1 where for every 5 timeslots 1 will be used as a “special slot”, 3 will be in the downlink direction and 1 will be in the uplink direction (DDDSU). However, network operators can elect to use different TDD ratio’s within the 3GPP standard, they can be downlink heavy (12:1), downlink only (SDL) or uplink heavy (1:12). In special cases such as eMBB there are options for the TDD ratio to be 27:1 biased to the downlink.
Taken together time standard synchronisation and frame synchronisation can cause interference at the cell site where different RF channels radiate their timeslots at different times or at different frame synch (DL/UL ratio). The dominant cause of synchronisation interference is where different channels or network operators on the same site decide to use different frame synchronisation ratio’s on RF channels in the same spectrum band. Where this happens in adjacent RF carriers then there will be near total destruction of the data carrying capability of each attected RF channel. The main protection against this type of frame synchronisation interference is selection of the appropriate RF filter (band edge mask). Where network operators cannot agree on a suitable synchronisation clock and a suitable frame synchronisation method then they are compelled to use a restrictive band edge mask (BEM). This type of filter protects the adjacent RF channels from harmful interference but it is very “lossy” even within the wanted channel bandwidth. Using the restrictive BEM will reduce the channel
Routine site maintenance and corrective measures are essential to
illuminate “rusty bolt” passive intermodulation interference.
Operators using different TDD ratio’s and synchronisation schema at the
same cell site have the greatest level of potential adjacent channel
interference unless restrictive BEM’s are deployed.
Strong regulation is required to stop synchronisation issues from causing
excessive adjacent channel interference. Where operators can
agree on a common synch plan then the permissive BEM can be used.
Where operators cannot agree on a common synch plan or where an
operator elects to use SDL then the restrictive BEM must be deployed on
all shared sites.

Mobile Services, Spectrum and Network Evolution to 2025
C:\Users\stefa\Dropbox\Projects\Huawei Spectrum Evolution Jan 2021\Deliverables\Desseminatation\Mobile Spectrum and Network Evolution to 2025 - Coleago - 24 Mar
© copyright Coleago 2021126
carrying capacity of the RF channel by over 20% and potentially over 25% for channel bandwidths below 20 MHz wide. Where network operators can agree on suitable time clocks and frame synchronisation then a permissive BEM can be used. However, regular checks and interference monitoring will need to be carried out of high-capacity sites to ensure adherence to the various synchronisation plans and to monitor if any PIM becomes significant.
7.6 International best practices
International best practices are those that focus on efficiency and improving telecoms market outcomes for consumers and businesses. Policy development should be evidence-led. The following provides a summary of key aspects, some of which have already been discussed above.
7.6.1 The importance of regulatory certainty
Promoting investment in telecommunications infrastructure and services is a key objective of public policy. A stable operating and regulatory environment reduces risk, leading to a lower cost of capital, which in turn stimulates investment.
The European Commission (EC), in particular, notes that:
“In whichever sector they operate, investors need long-term certainty. This means a stable regulatory environment”.94
The EC views long licence durations as one of the means of promoting certainty. In this context, the EC observes that:
“…there is a tendency for higher investment levels in countries that have awarded longer licences”.95
From this, it may be inferred that regulatory certainty as a whole promotes investment. This is echoed by the World Bank, which emphasises the importance of regulatory certainty in a wider mobile licencing context, in its Telecommunications Regulatory Handbook issued in 2000 with support from the ITU:
“By clearly defining the rights and obligations of the operator and the regulator, a licence can significantly increase confidence in the regulatory regime. Regulatory certainty is a critical element of the licencing process where the aim is to attract […] investment.”96
A greater perceived risk of arbitrary regulatory actions could also diminish wider investor confidence, which may also have a negative impact in sectors beyond telecommunications. This could reduce a country’s general appeal as a destination for both domestic and international capital.
94 European Commission Press Release, State of the Union 2016: Commission paves the way for more and better internet connectivity for all citizens and businesses, Strasbourg, 14 September 2016; available at http://europa.eu/rapid/press-release_IP-16-3008_en.htm
95 European Commission News article, ‘Commission publishes new study to support 5G roll-out’, 23 October 2017; our added emphasis. This document is available at https://ec.europa.eu/digital-single-market/en/news/commission-publishes-new-study-support-5g-roll-out
96 World Bank, Telecommunications Regulatory Handbook, Module 2, edited by Hank Intven and McCarthy Tétrault, infoDev, Section 2.1.3; available at https://www.itu.int/ITU-D/treg/Documentation/Infodev_handbook/2_Licensing.pdf
Best practices imply evidence-based policies designed to improve mobile
market outcomes for consumers and businesses.

Mobile Services, Spectrum and Network Evolution to 2025
C:\Users\stefa\Dropbox\Projects\Huawei Spectrum Evolution Jan 2021\Deliverables\Desseminatation\Mobile Spectrum and Network Evolution to 2025 - Coleago - 24 Mar
© copyright Coleago 2021127
7.6.2 Moderating the total costs of licences
As outlined in Section 7.3, high costs of licence ownership are likely to lead to significant consumer harm and may hold up economic development. In addition, they may threaten the sustainability of competition if, as a result of the licence costs, market challengers are deprived of reasonable opportunities to earn their cost of capital.
With respect to licence fees, the European Commission advises that:
“Reliance on auctions should not lead to an excessive transfer to the public budget or for other purposes to the detriment of low tariffs for the users.”97
A report on International Best Practices for the World Bank states further:
“Applicable spectrum fees may be set by the government only through public consultation and generally should be limited to the amounts necessary to support government management and enforcement actions.”98
Policy is better directed at driving mobile coverage expansion, for example by extracting coverage commitments in exchange for lower spectrum fees (as per the examples cited in section 7.3.2).
7.6.3 Technology neutrality
Technology neutral licences are now the norm in advanced economies. Competition incentivises operators to pursue efficient technology strategies. For regulators to impose technologies or constrain options for operators would reflect very poor practice.
Lack of technology neutrality may also dissuade investment and innovation, leading to significant consumer harm.
7.6.4 Spectrum packaging
As outlined in section 5.3, wider channels in a given band make more efficient technical use of spectrum and are more cost effective. Packaging of spectrum licences in awards should therefore favour operators securing wider blocks in fewer bands, rather than small amounts in many bands.
India yields is a particularly bad example, where resources have been distributed very thinly across operators, and with wide disparities in operator-holdings across numerous regions. In 2014, prior to market consolidation, several operators held less than 2MHz in certain bands within certain regions.
Regulators should also seek to minimise the fragmentation of spectrum within a band. Split assignments reduce total network performance and introduce additional network costs linked to the aggregation of the separate blocks.
In the UK, for example, all operators already have spectrum 3.40-3.68GHz range, with Hutchison 3G (‘Three’) holding a total of 140MHz split in two non-contiguous blocks. Following the imminent award of additional spectrum in the 3.68-3.80GHz range, most if not all UK operators will end up with split assignments.
Defragmenting the 3.4-3.8GHz may prove difficult in the face of existing deployments. Swapping assignments to secure contiguity may lead to the write-off of existing antenna systems, if these do not already cover the entire frequency range.
A similar situation is unfolding in France. While all four operators hold spectrum in the 3.4-3.8GHz range, a further 90MHz at the bottom of the band is yet to be allocated to
97 Proposition I.11, ‘Green Paper on a Common Approach in the Field of Mobile and Personal Communications in the European Union’, 2004, COM(93)145-final (Luxembourg: Office for Official Publications of the European Communities).
98 ‘International Best Practices Report on Telecommunications Regulations’, May 22, 2013, Telecommunications Management Group, Inc. (TMG), on behalf of the World Bank. The report was supported by The World Bank’s Public Private Infrastructure Advisory Facility.
High costs of licence ownership may lead to significant consumer harm
and may hold up economic development.
Regulators should favour larger, contiguous holdings across fewer
bands rather than smaller holdings across many bands.
Regulators should avoid split assignments within any given band.
These are inefficient from both a performance and cost perspective,
and future defragmentation may lead to equipment write-offs.

Mobile Services, Spectrum and Network Evolution to 2025
C:\Users\stefa\Dropbox\Projects\Huawei Spectrum Evolution Jan 2021\Deliverables\Desseminatation\Mobile Spectrum and Network Evolution to 2025 - Coleago - 24 Mar
© copyright Coleago 2021128
mobile. If two or more of the operators secure additional spectrum when this last block is awarded (likely in 2026, after legacy user-licences expire), at least one operator will have an inefficient, split assignment. Defragmenting the band will likely be even more difficult than it is in the UK, as existing 3.4-3.8GHz spectrum will be far more widely deployed by 2026.
When designing new awards, regulators should also be mindful to avoid excessive concentration of spectrum on aggregate, as this may unduly impair competition. Caps on total spectrum holdings, possibly split by categories of low, mid and high bands, is generally a better competition safeguard than tight caps in individual bands.
Italy, a market with four network operators, provides an example of spectrum packaging that was designed to maximise auction returns, but that was hamful to competition. In October 2018, the C-Band spectrum was auctioned in two blocks of 80MHz and two blocks of 20MHz. The only possible outcome is that the two operators who obtain the 20MHz block are put at competitive disadvantage because deploying the C-Band in only 20MHz is not cost effective and does not deliver the highest access speed claim. As bidders tried not be left in a competitively disadvantaged position, the price per MHz per pop for C-Band spectrum Italy ended up being 5 to 10 times higher than the price paid in other European countries. Designing an auction to engineer a competitive imbalance will result in high prices, which is harmful to the industry as well as to competition. To consider an extreme case, the highest price spectrum would be achieved by selling all spectrum to the highest bidder, which would kill competition.
7.6.5 Timing of awards
Regulators should seek to accelerate the clearing of mobile-designated spectrum from legacy users and release the usage-rights to operators as quickly as possible.
Delays in spectrum awards constrain supply and consumption, leading to foregone social gains (as outlined in section 4.3).
This urgency applies equally to low band spectrum (below 1GHz) as to mid and high- band spectrum. Mid and high-band spectrum is needed to boost overall network capacity, but given their weaker propagation characteristics, higher bands do not deliver extra bandwidth everywhere it is needed. Additional low-band spectrum allows operators to improve cell-edge performance, improving the experience of consumers deep indoors and in areas that are covered by fewer sites.
7.6.6 Spectrum trading
Finally, regulators should promote spectrum trading, to the extent this does not clash with key competition objectives.
While an operator may be an efficient spectrum user at a given point in time, circumstances are bound to evolve. At a later point, a rival may be in a position to make better use than a given user. If this rival is willing to pay more than the resource is worth to the existing holder, a trade creates value on aggregate.
Trading may also be necessary to consolidate spectrum holdings, which would drive technical efficiency, as discussed in section 5.3.5.
Examples of spectrum trades (as opposed the acquisition of spectrum licence holders) include:
UK: sale of 2.6GHz TDD spectrum by BT/EE to its rival Telefonica in 2020;
India: sale to Bharti Cellular of 2.3GHz spectrum by Videocon and of 1800MHz by Airtel in 2016 (following the change in regulations on spectrum trading)99;
99 GSMA, ‘Best practice in mobile spectrum licensing’, 2016.

Mobile Services, Spectrum and Network Evolution to 2025
C:\Users\stefa\Dropbox\Projects\Huawei Spectrum Evolution Jan 2021\Deliverables\Desseminatation\Mobile Spectrum and Network Evolution to 2025 - Coleago - 24 Mar
© copyright Coleago 2021129
UK: the sale of 1800MHz spectrum by BT EE to Hutchison 3G in the UK, mandated as a merger remedy (following the merger of Orange and T-Mobile UK in 2010 to create EE).
Nevertheless, secondary markets for mobile spectrum usage-rights remain limited. One reason may be that engaging with rivals on spectrum is often a delicate affair. There may also be concerns about revealing confidential views on spectrum that could interfere with future awards.
It is also possible that spectrum trading would be more common if it could involve multilateral spectrum swaps, however engaging with rivals on a multilateral basis is even more difficult than bilaterally.
For this reason, regulators might consider setting up periodic ‘spectrum fairs’, with multilateral trading processes in which parties can enter spectrum swap bids (asks and offers). This would provide an opportunity to gauge the efficiency of existing allocations. If allocations are inefficient, this approach would help identify whether trades are feasible, while avoiding some of the difficulties associated with direct engagement between operators.

Mobile Services, Spectrum and Network Evolution to 2025
C:\Users\stefa\Dropbox\Projects\Huawei Spectrum Evolution Jan 2021\Deliverables\Desseminatation\Mobile Spectrum and Network Evolution to 2025 - Coleago - 24 Mar
© copyright Coleago 2021130
8. Concluding remarks During the next five years, the industry will experience major upheavals driven by a continued explosion in consumption, the introduction and expansion of 5G, and shifting commercial models. Major disruptions invariably create winners and losers ‒ but the opportunity to succeed exists for all.
Operators need to work with each other and with regulators to create the foundations for a sustainable future for the industry.
Call to action: operators
We would call on operators to embrace 5G and to compete intelligently by:
Pursuing increased asset sharing across the industry, whether through bespoke infrastructure sharing arrangements or by exploiting the opportunities offered by emerging neutral host models;
Working with rivals to bring about spectrum consolidation, whether through spectrum trading or through spectrum sharing ‒ to enable more efficient and cost-effective wide-band deployments;
Targeting opportunities in the cellular IoT space beyond simple connectivity ‒ which may entail working with rivals to create joint capabilities across the IoT value chain;
Introducing distinct quality-of-service based offerings, to better align value with willingness to pay and to improve outcomes across the customer base.
Call to action: regulators
It is tempting to look at the mobile industry as a source of public funding, especially in times of crisis. In low-income countries, in particular, mobile operators are often major contributors to the exchequer. However, spectrum policy should not be used as an instrument to fund the state.
Capital extraction from the industry may have disproportionate indirect consequences for welfare and economic development. We would therefore urge regulators to tread carefully, and to hold these aspects closely in mind when setting policy.
Finally, we would call on regulators to:
Release as much spectrum as possible, as fast as possible, and at sustainable prices;
Facilitate wide-band deployments on a technology neutral basis, through spectrum allocation policy as well as by fostering spectrum trading and sharing;
Provide regulatory certainty through stable, evidence-based policy development directed at maintaining a sustainable mobile telecoms landscape;
Pursue policies that reduce the financial burden on the industry, to foster future sustainability, promote investment and give room for further retail price erosion; these will benefit consumers and society, and drive further economic development.
Acknowledgments
Finally, we would like to thank Huawei for making this report possible. We are also grateful to the authors of the external materials quoted in this report for their research and insights.

Mobile Services, Spectrum and Network Evolution to 2025
C:\Users\stefa\Dropbox\Projects\Huawei Spectrum Evolution Jan 2021\Deliverables\Desseminatation\Mobile Spectrum and Network Evolution to 2025 - Coleago - 24 Mar
© copyright Coleago 2021131
Appendix Overview of IMT bands Exhibit 97 below provides an overview of IMT bands and general allocations planned or completed in ITU Regions 1,2 and 3 (respectively R1, R2, R3 in the table below). Note that differences in band-plans and spectrum use exist within each ITU region. Digital Terrestrial TV, for example, occupies different parts of the sub-1GHz range in different markets within the same ITU Region, and the degree of analogue to digital switchover in emerging markets, in particular, may lag those in more advanced economies. Accordingly, the following should be taken as a general guide on available IMT spectrum across the globe.
Exhibit 97: Overview of IMT bands
Source: Coleago (from a range of sources)
Band Name Duplex FDD UL(MHz)
FDD DL(MHz)
TDD(MHz)
BW(MHz)
ITU R1(MHz)
ITU R2(MHz)
ITU R3(MHz)
Comments
31 450MHz FDD 1072 450MHz FDD 1073 450MHz FDD 10n71 600 US DD FDD 663-698 617-652 70 70 in some 70 in some 5G low-band in ITU R2 and R3; used for Digital Terrestrial TV
broadcast in ITU R1, potential future low-band IMT resource
n29 700 SDL SDL 717-728 10 somen12 700 lower FDD 699-716 729-746 30 30 in somen14 700 upper FDD 788-798 758-768 20 20 in somen28 APT 700 FDD 703-748 758-803 90 60 90 Originally 4G band in ITU R2 and R3; quasi-global
harmonisation; 5G candidate band ITU R1; quasi global harmonisation, can be used for 4G and 5G; 20MHz centra gap auctioned as SDL in some European countries, growing operator interest
n20 800 FDD 832-862 791-821 60 60 60 Original ITU R1 DD band for 4Gn18 lower 800 Japan FDD 815-830 860-875 30n5 850 FDD 824-849 869-894 50 50 some Original 2G in ITU R2 and R3n8 900 FDD 880-925 925-960 70 70 some 70 Original 2G in ITU R1, partially used for 3G; refarming to 5Gn51 L-Band extension TDD 1427-1432 5n76 Ext. L-Band EU SDL 1427-1432 5 somen50 L-Band TDD 1432-1517 85 85 Good propagation and growing ecosystemn75 L-Band EU SDL 1432-1517 85 85 85n74 1500 lower L-Band FDD 1427-1470 1475-1518 80n3 1800 FDD 1710-1785 1805-1880 150 150 150 Prime international 4G resource, ITU R1 and R3n39 1900 gap TDD 1880-1920 40 40n2 PCS FDD 1850-1910 1930-1990 120 120 in somen25 Extended PCS FDD 1850-1915 1930-1995 130 130 in somen70 AWS 4 FDD 1695-1710 1995-2020 40 40 in somen34 2100 TDD TDD 2010-2025 15 Limited bandwidth and ecosystem; no 5G roadmapn1 IMT FDD 1920-1980 2110-2170 120 120 120 120 Original 3G band; refarming to 4G and 5Gn65 Extended IMT FDD 1920-2010 2110-2200 180n66 Extended AWS FDD 1710-1780 2110-2200 160 140n40 S-band TDD 2300-2400 100 40 100 90 Good ecosystem, but more limited bandwidth in ITU R1n30 2300 FDD 2305-2315 2350-2360 20n41 / n90 2600 TDD TDD 2496-2690 190 190 in some 190 in some 190 in somen90 2500 BRS TDD 2496-2690 190n38 2600 TDD TDD 2570-2620 50 40 others 40 others 40 othersn7 2600 FDD FDD 2500-2570 2620-2690 140 140 others 140 others 140 othersn77 C-Band TDD 3300-4200 900 400 400 400 3400-3800MHz main 5G capacity band, excellent ecosystem
supportn48 CBRS TDD 3550-3700 150n79 C-Band TDD 4400-5000 600 some some some Some existing allocations (e.g. 200MHz in China, 190MHz in
Russia)n96 6 GHz TDD 5925-7125 1200n81 900 SUL SUL 880-915 35n82 800 SUL SUL 832-862 30n83 APT 700 SUL SUL 703-748 45n80 1800 SUL SUL 1710-1785 75n84 2100 SUL SUL 1920-1980 60n86 Ext AWS SUL SUL 1710-1780 70n95 2100 SUL SUL 2010-2025 15n257 28GHz TDD 26500-29500 3000n258 26GHz TDD 24250-27500 3250 2000 3200 3250 Being considered in ITU R2 and R3 in particular, with
assignments in some countries completed or plannedn260 39GHz TDD 37000-40000 3000n261 28GHz TDD 27500-28350 850 850
Most ITU R1 splits 2600MHz in TDD and FDD; unified in e.g. China, some other APT countries, African countries (see main report for extra commentary)
5G candidate band ITU R1; quasi global harmonisation, can be used for 4G and 5G
Very good propagation but limited bandwidth, weak ecosystem and requires large antennas. Specifications defined for 4G only. Some potential for wide-area IoT (e.g.

Mobile Services, Spectrum and Network Evolution to 2025
C:\Users\stefa\Dropbox\Projects\Huawei Spectrum Evolution Jan 2021\Deliverables\Desseminatation\Mobile Spectrum and Network Evolution to 2025 - Coleago - 24 Mar
© copyright Coleago 2021132
Glossary 3GPP 3rd Generation Partnership Project.
AI Artificial Intelligence (machine learning).
API Application Protocol Interface.
APT Asia Pacific Telecommunity.
AR Augmented reality. Also see VR.
ARPU Average Revenue per Unit.
AUPU Average Usage per Unit or per User.
BBU Baseband Unit.
BEM Band Edge Mask.
CA Carrier Aggregation.
CAGR Compound Annual Growth rate.
Capex Capital Expenditures (investments).
COTS Commercial off-the-shelf.
CPRI Common Public Radio Interface.
CU Central Unit.
DL Downlink.
DSS Dynamic Spectrum Sharing (allows bandwidth in a given to be allocated between different technologies such as 4G and 5G).
DU Distributed Unit(s).
EB Exabyte (also see ZB).
EBITDA Earnings Before Interest, Tax, Depreciation and Amortisation.
eMBB Enhanced Mobile Broadband.
eMTC Enhanced Machine Type Communications.
FDD Frequency Division Duplex. In FDD mode, half of the bandwidth is allocated to uplink, half to downlink. Hence the notation 2x20 MHz for a 20 MHz ‘paired’ channel. Also see TDD.
FR1, FR2 Frequency Range 1 (bands below 6GHz) and Frequency Range 2 (mm waves).
FWA Fixed Wireless Access.
IMT International Mobile Telecommunications.
IP Internet Protocol.
IoT Internet of Things: machine-to-machine or “machine-type” communications via the Internet, mediated by fixed and/or wireless networks.
ITU International Telecommunications Union.
JV Joint Venture.
LLS Lower Layer Split (in context of open RAN).
M2M Machine-to-machine (see IoT).
Mbps or Mbit/s Megabits per second (a measure of network throughput).

Mobile Services, Spectrum and Network Evolution to 2025
C:\Users\stefa\Dropbox\Projects\Huawei Spectrum Evolution Jan 2021\Deliverables\Desseminatation\Mobile Spectrum and Network Evolution to 2025 - Coleago - 24 Mar
© copyright Coleago 2021133
MIMO Multiple Input / Multiple Output antenna system; e.g. 2T2R (meaning two transmit and 2 receiver antennas on the site), which is the base MIMO configuration for 4G and 5G, also referred to as “order 2” or “2x2” MIMO.
mMIMO Massive MIMO (typically 32x32 or 64x64 order MIMO).
MNO Mobile Network Operator.
NGMN Next Generation Mobile Alliance.
NSA Non Stand-Alone.
OFDM Orthogonal Frequency Division Multiplexing.
Opex Operating Expenditures (recurring or ‘running’ costs).
O-RAN Open RAN Alliance (not to be confused with “Open RAN”)
PB Petabyte (also see ZB).
PIM Passive Inter-Modulation (PIM products degrade air-interface performance).
PPDR Public Protection and Disaster Relief.
QAM Quadrature Amplitude Modulation.
QPSK Quadrature Phase Shift Keying.
RAN Radio Access Network. Includes radio sites and backhaul transmission (but not the core network).
RF Radio Frequency (e.g. RF unit).
RIC RAN Intelligent Controller.
ROIC Return on Invested capital.
RRU Remote Radio Unit.
SA Stand-Alone.
SD Standard Definition video.
SDR Software Defined Radio.
SLA Service Level Agreement.
SMO Service Management & Orchestration.
TB Terabyte (also see ZB).
TDD Time Division Duplex. Also see FDD. Spectrum in TDD mode allows for asymmetric allocation of uplink and downlink resources, yielding greater overall spectral efficiency.
TIP Telecom Infra Project.
UE User Equipment.
UHD Ultra High Definition video.
UL Uplink.
uRLLC Ultra Reliable Low Latency Communications.
UP User Plane (in context of network slicing).
VR Virtual Reality. Also see AR.
WACC Weighted Average Cost of Capital.
ZB Zettabyte, equivalent to 1000 EB (Exabytes), 1 million PB (Petabytes), 1 billion TB (Terabytes) and 1 trillion GBytes.