mobile web stress: understanding the neurological impact of poor performance
TRANSCRIPT

Mobile Web Stress Understanding the neurological impact of poor performance
Tammy Everts
Velocity Europe – November 2013

Why neuroscientific mobile testing?
Slide 2

Slide 3
• 2010 EEG study of desktop
users
• Throttled connection from 5MB
to 2MB
• Found that participants had to
concentrate up to 50% harder
• Afterward, participants reported
negative brand associations

Slide 4

Slide 5

It’s a mobile-first world.

Slide 7
55% of all time spent on retail sites takes place on a mobile device.
Shop.org / comScore, October 2013

Slide 8

Slide 9
Stuart McMillan, Schuh’s Journey to RWD (Conversion Conference 2013)

Three all-too-common
mobile assumptions

Assumption #1
Mobile users expect pages to be slow.
Slide 11

Keynote, 2012 Mobile User Survey
Slide 12

Radware, 2013 State of the Union: Mobile Ecommerce Performance
Slide 13

Radware, 2013 State of the Union: Mobile Ecommerce Performance
Slide 14

Slide 15
Assumption #2
Mobile users want to browse, not buy.

Slide 16
By 2017, retail mcommerce is expected to hit $113 billion – 26% of total ecommerce sales.
eMarketer, September 2013

Mobile shopping cart abandonment rate is 39% greater than desktop rate.
2013 Google I/O
Slide 17

Slide 18
Assumption #3
Users will stick around, even if pages
are slow, if they really want to buy.

Skava/Harris Interactive, 2013
Slide 19

What is emotional
engagement research?

“95% of the consumer’s
decisions are made at the
subconscious level.”
Dr. Gerald Zaltman, Harvard UniversityExecutive Committee of Harvard University’s
Mind, Brain and Behavior Interfaculty Initiative
Slide 21

Slide 22

Slide 23

Slide 24

Patients with damage to emotional parts of the brain cannot make decisions, despite having no change in IQ.
Antonio Damasio, Descartes’ Error
Slide 25

The problem with surveys…
Traditional research relies on eliciting post-cognitive responses.
But thinking and talking about emotions changes and distorts
them.
Slide 26

Five benefits of neuro-scientific testing
1 Evaluates think/feel (not say)
2 Quantified data, at deeper-than-Qual levels
3 Moment-by-moment interaction
4 Cause-and-effect triggers
5 Fresh, deeper insights
Slide 27

Simplified cognitive timeline
Slide 28

EEG Emotional Engagement Study

Our research team
• Seren – leaders in customer experience & service design
• Neurosense – global leader in implicit methodologies
• NeuroStrata – expert consultants in blending neuromarketing
applications
Slide 30
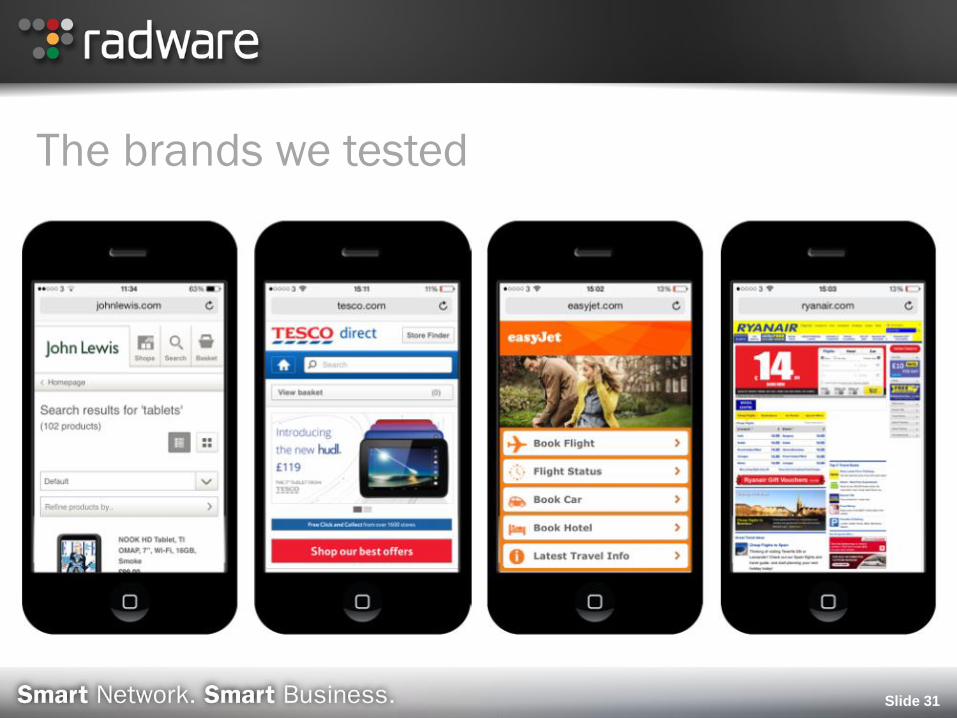
The brands we tested
Slide 31

Our testers
• 20 testers (male and female)
• Pre-screened to ensure normal cognitive functioning
• Mobile device users
• Did not know they were part of a performance study
Slide 32

Jakob Nielsen, Why You Only Need to Test with 5 Users, 2000
Slide 33
Methodology
• Standardized set of shopping tasks (browsing and checkout)
• Testers served sites over one of two speeds:
– normal Wifi
– artificial 500ms delay
• Using EEG headset and eyetracker, measured moment-by-
moment responses
Slide 34

Slide 35

Slide 36
Why test a 500ms delay?
Case study: The impact of HTML delay on mobile business metrics
Slide 37
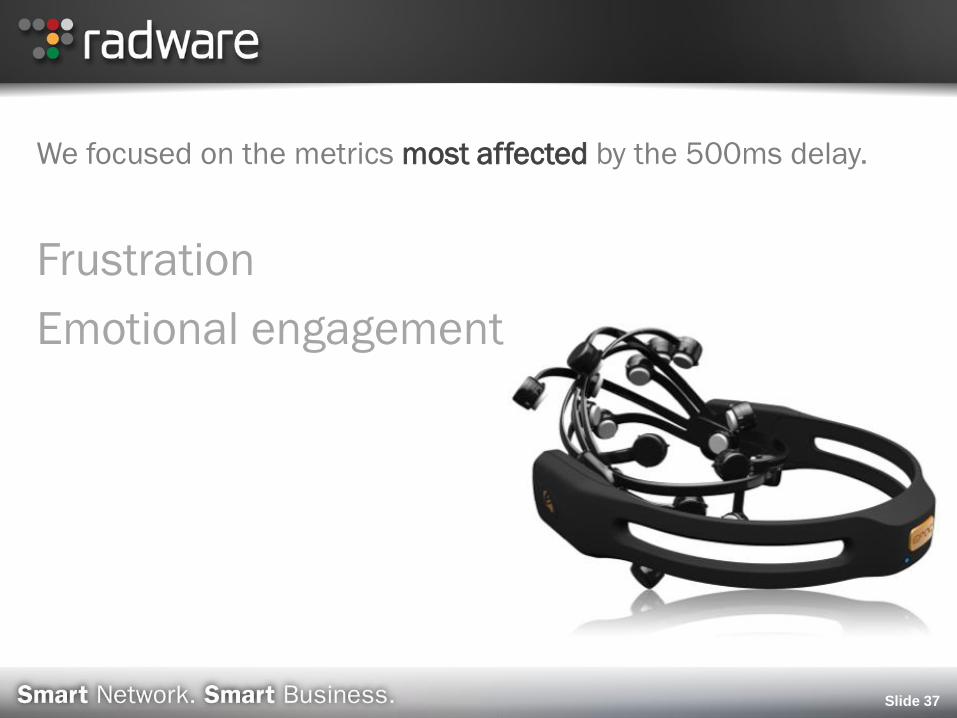
We focused on the metrics most affected by the 500ms delay.
Frustration
Emotional engagement

Slide 38
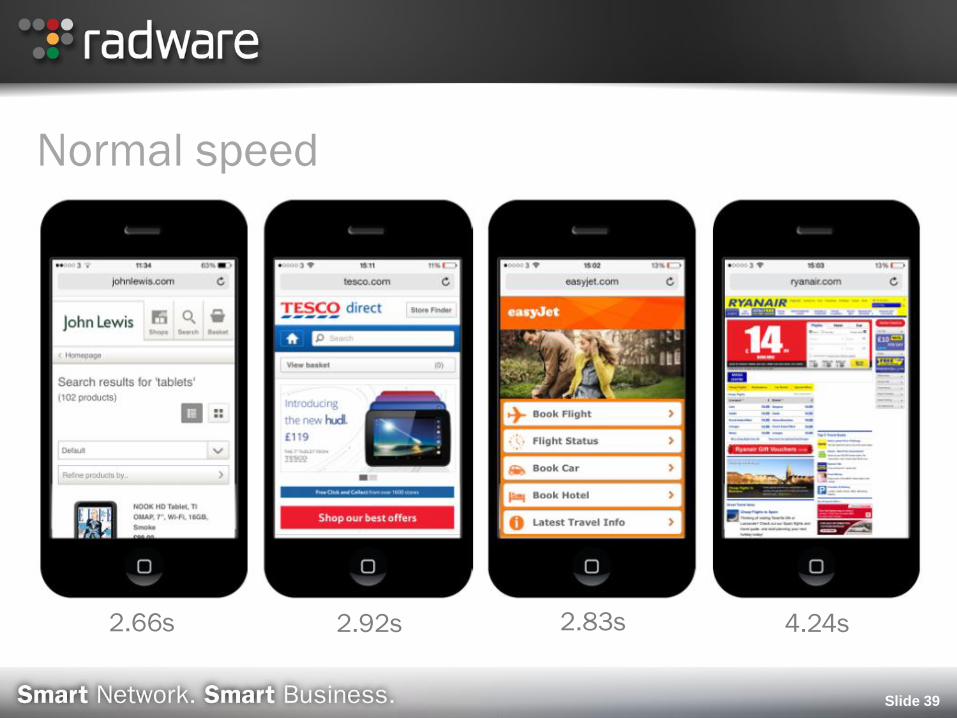
Normal speed
Slide 39
2.66s 2.92s 2.83s 4.24s

Frustration levels across sites (normal speed)
Slide 40

Engagement levels across sites (normal speed)
Slide 41

500ms delay: Peak frustration results
Slide 42

500ms delay: Average engagement results
Slide 43

Impact of site speed on post-test brand association
Slide 44

EEG summary
• A mere 500ms delay results in significant increase in
frustration levels.
• Faster pages result in higher levels of engagement.
• Different sites trigger emotional shifts at different phases of
the experience (browsing vs. checkout).
• Important: These tests happened under ideal browsing
conditions.
Slide 45

Slide 46

Slide 47
Erin Kissane, November 2013

Bonus Study: Implicit Response Test The effect of loading speed
on brand perception

We react faster to congruent stimuli
than incongruent stimuli.
Slide 49

Slide 50
https://www.projectimplicit.net/index.html

Slide 51
Methodology: Pre-test
Two brands – Easyjet and
Ryanair – were measured
against 24 attributes.

Slide 52

Slide 53

Slide 54

Implicit pre-test: Brand mapping
Slide 55

Implicit pre-test: Purchase intent
Slide 56

Methodology: Test
1 Participants then viewed one of two videos depicting a flight
selection/booking process:
• Normal
• Slow (500ms delay per page)
2 Each brand is measured again against the same 24
attributes.
3 Difference between normal and slow indicates effect of speed
on brand perception.
Slide 57

EasyJet: Impact of 500ms slowdown on each dimension
Slide 58

EasyJet: Impact of 500ms slowdown on each attribute
Slide 59

Ryanair: Impact of 500ms slowdown on each dimension
Slide 60

Ryanair: Impact of 500ms slowdown on each attribute
Slide 61

Brand perception summary
• Overall, EasyJet enjoys a more positive brand perception.
• 500ms delay triggers downward shift in perception for both companies.
• Impact on EasyJet was greater than on Ryanair.
• Impact varies across attributes for each brand:
– Slow EasyJet site suffers more in Purchase Intent and Functional attributes.
– Ryanair suffers more in Warmth/Friendliness dimensions.
Slide 62
Slide 63

Takeaways

1 Mobile users are significantly affected by slow performance: up to 26% increase in peak frustration and up to 8% decrease in engagement.
2 Slow sites can seriously undermine overall brand health – across both desktop and mobile platforms.
3 The nature and scale of impact varies, depending on a number of factors (e.g. inherent strength/weakness of brand).
4 Brands with already-fragile consumer affinity are at higher risk.
5 Greatest risk is to purchase intent.
6 Great opportunities exist to strengthen overall brand by investing in performance optimization.
Slide 65

Slide 66

Sources
Web Stress: A Wake-Up Call for European Business (Foviance, 2010)
http://www.ca.com/us/~/media/files/supportingpieces/final_webstress_survey_report_229296.aspx
2013 Social & Mobile Commerce Consumer Report (Shop.org / comScore)
http://shop.org/research/original/2013-social-mobile-commerce-consumer-report
2012 Mobile User Survey (Keynote)
http://www.keynote.com/docs/reports/Keynote-2012-Mobile-User-Survey.pdf
2013 State of the Union: Mobile Ecommerce Performance (Radware)
http://www.radware.com/mobile-sotu2013/
The Danger of a Poor Mobile Shopping Experience [INFOGRAPHIC]
http://www.getelastic.com/the-danger-of-a-poor-mobile-shopping-experience-infographic/
Case study: The impact of HTML delay on mobile business metrics (Web Performance Today, November 2011)
http://www.webperformancetoday.com/2011/11/23/case-study-slow-page-load-mobile-business-metrics/
I was a mobile-only user for six weeks (Erin Kissane)
http://the-pastry-box-project.net/erin-kissane/2013-november-12/
Slide 67

Velocity Office Hour – Today @ 16:15
webperformancetoday.com
twitter.com/tameverts
linkedin.com/in/tammyeverts
plus.google.com/+TammyEverts/
Slide 68
Questions?