mobility, economic opportunity and wealth accumulation ... · and real estate for winnipeg where...
TRANSCRIPT

Mobility, Economic Opportunity and Wealth Accumulation
during the Wheat Boom Era: 1870 to 1930
Livio Di Matteo (Lakehead University) and Herb Emery (University of Calgary)
Paper Prepared for the 50th Anniversary Meetings of the Canadian Network for Economic
History, Kingston, October 16-18, 2015.

Introduction

Summary n Migration to Canada’s west during the “Wheat Boom” period
1896-1911 provided opportunities for income and wealth accumulation not available in Canada by the 1890s as evidenced by the sustained net emigration after Confederation.
n Wealth holdings in the resource-producing west increased rapidly during the Wheat Boom period compared to those of central Canadians but nearly all of the increase was through real estate holdings.
n The evidence suggests that the effects of the wheat boom were transitory with the boom expanding the overall stock of wealth – real estate wealth in particular – but not the real per capita amounts.
n Real estate was a volatile asset in contrast to the financial wealth accumulation of central Canadians, which was the key reason for the lack of sustained impact of resource exports on the standard of living.

Wheat Boom as an Engine of mobility
n Seemingly at odds with some of the historical and more recent scholarly literatures positing natural resource exports do little to increase per capita incomes (Chambers and Gordon 1966) and may even reduce per capita incomes over the long run as per the “Resource Curse” (Sachs and Warner 2001).

What is missing
n The discussion of wealth accumulation that occurs due to the increase in prices of the fixed factor (land) and through the transitory scarcity, increased rents to factors in the short run.
n As McCallum (1979) and Sachs and Rodriguez (1999) have argued, sustained benefits of resource booms are apparent in the capturing of lateral linkages to resource exports such as a financial sector or manufacturing or investment of short term resource rents into financial assets external to the resource sector if not the resource economy
Moreover…
n Substantial urban population growth marks the development of western Canadian cities during the wheat boom era.
n Urban land values were not part of Chambers and Gordon’s calculations
0
10
20
30
40
50
60
70
1871 1881 1891 1901 1911 1921 1931
Per
cent
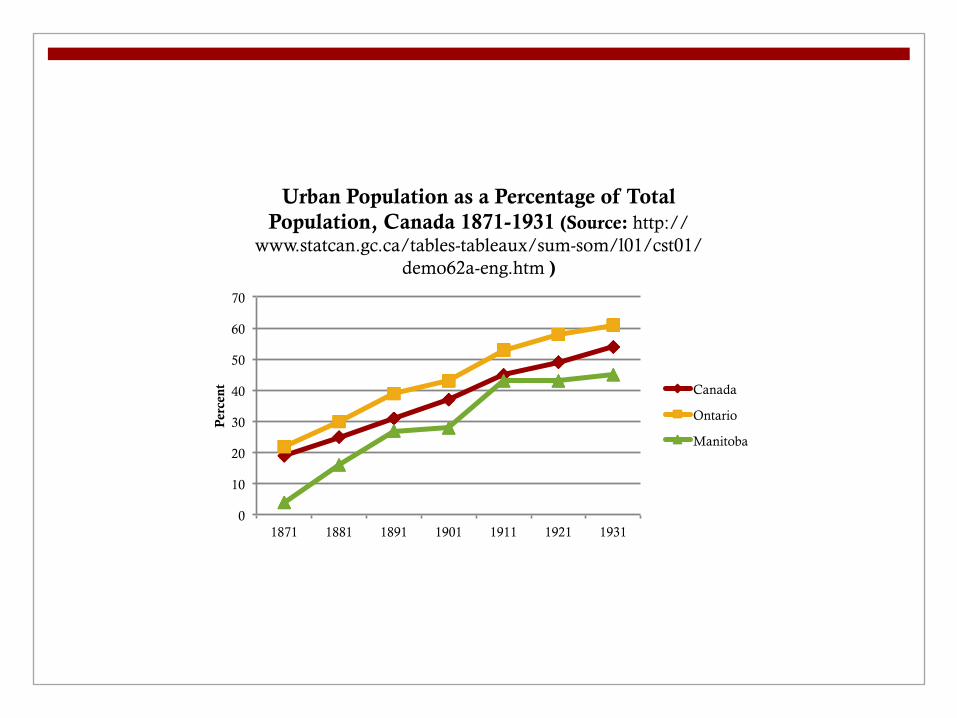
Urban Population as a Percentage of Total Population, Canada 1871-1931 (Source: http://
www.statcan.gc.ca/tables-tableaux/sum-som/l01/cst01/demo62a-eng.htm )
Canada
Ontario
Manitoba

Data
Data Source
n The data for these urban areas represent subsets of probate records taken from three regions in Canada: Wentworth County, Ontario, 1872-1927 (2516 estates), Thunder Bay District, Ontario, 1885-1931 (2338 estates) and Manitoba, 1874-1927 (826 estates).

Wentworth County
n Hamilton, Ontario (1777 estates for the period 1872 to 1927)

Manitoba & Thunder Bay District
n Winnipeg, Manitoba (377 estates for the period 1874-1927)
n The Lakehead (Fort William & Port Arthur), Ontario (1646 estates for the period 1885 to 1931).
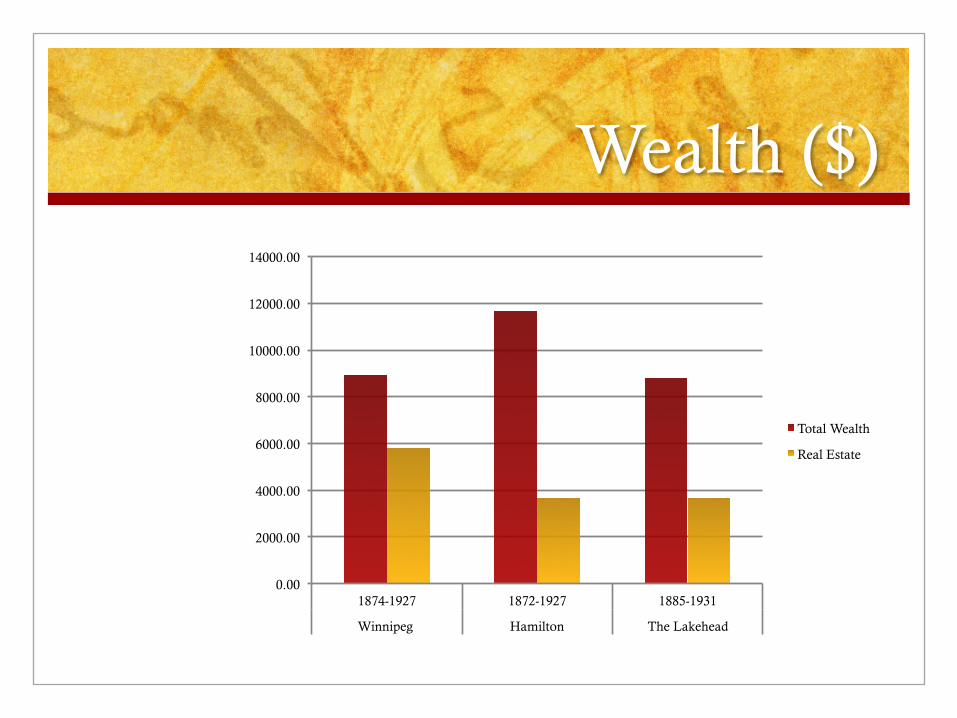
Wealth ($)
0.00
2000.00
4000.00
6000.00
8000.00
10000.00
12000.00
14000.00
1874-1927 1872-1927 1885-1931
Winnipeg Hamilton The Lakehead
Total Wealth
Real Estate

Analysis

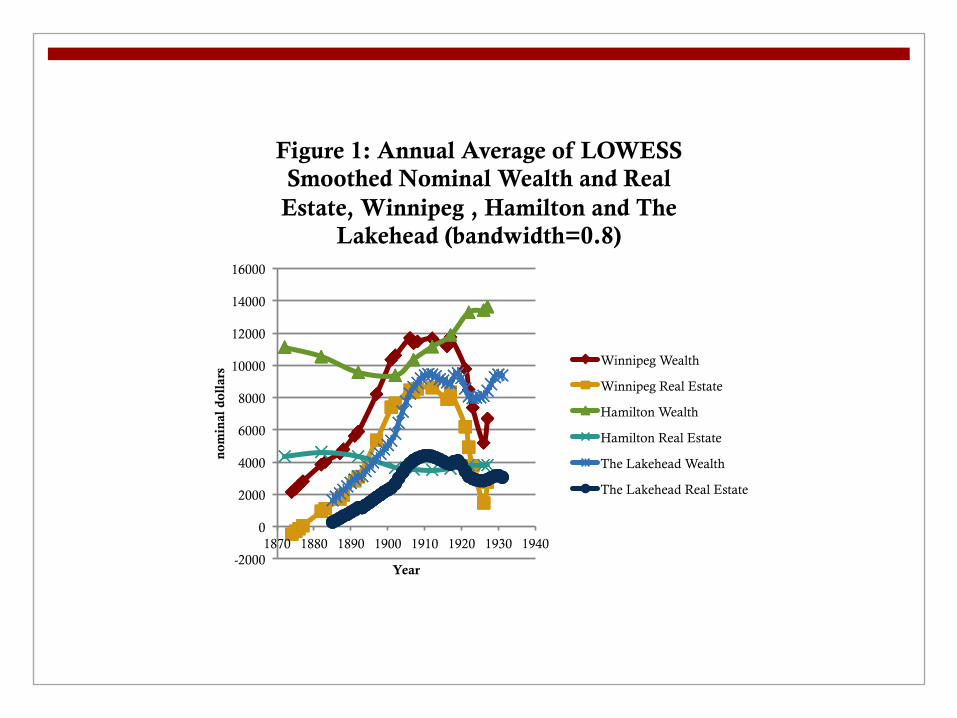
n Booms in real estate and wealth in both Winnipeg and The Lakehead with peaks during the period between 1910 and 1914 followed by declines.
n During the boom period in Winnipeg and The Lakehead, the real estate share of wealth rises dramatically while that of financial assets stays flat.
n During the same period, Hamilton’s real estate share actually declines somewhat while the financial asset share rises steadily. Financial asset shares in Winnipeg and at The Lakehead begin to rise after the boom ends.
-2000
0
2000
4000
6000
8000
10000
12000
14000
16000
1870 1880 1890 1900 1910 1920 1930 1940
nom
inal
dol
lars
Year
Figure 1: Annual Average of LOWESS Smoothed Nominal Wealth and Real Estate, Winnipeg , Hamilton and The
Lakehead (bandwidth=0.8)
Winnipeg Wealth
Winnipeg Real Estate
Hamilton Wealth
Hamilton Real Estate
The Lakehead Wealth
The Lakehead Real Estate

-2000
0
2000
4000
6000
8000
10000
12000
1860 1870 1880 1890 1900 1910 1920 1930 1940
1900
dol
lars
Year
Figure 2: Annual Average of LOWESS Smoothed (Bandwidth-0.8) Real Wealth
and Real Real Estate (1900 dollars: Urquhart Green Implicit Price Index)
Winnipeg Wealth
Winnipeg Real Estate
Hamilton Wealth
Hamilton Real Estate
The Lakehead Wealth
The Lakehead Real Estate

-2000
0
2000
4000
6000
8000
10000
12000
14000
16000
18000
1870 1880 1890 1900 1910 1920 1930
Tor
onto
191
3=10
0 do
llar
s
Figure 3: Annual Average of LOWESS Smoothed (Bandwidth=0.8) Real Wealth and Real Real Estate (Toronto 1913=100
dollars: Emery-Levitt Index)
Winnipeg Wealth
Winnipeg Real Estate
Hamilton Wealth
Hamilton Real Estate
Differences
n The boom and bust is most pronounced in the wealth and real estate for Winnipeg where wealth and real estate levels in real terms by 1927 were where they had been in the 1890s – just prior to the boom.
n The Lakehead also saw a boom in wealth and real estate but the bust period was more subdued than Winnipeg’s.
n Meanwhile, Hamilton Ontario saw declining average wealth and real estate levels over the entire period.

Some Additional Corroborating
Evidence
0
20
40
60
80
100
120
140
160
180
1895 1900 1905 1910 1915 1920 1925 1930 1935 1940
Tor
onto
191
3 re
nt =
100
Year
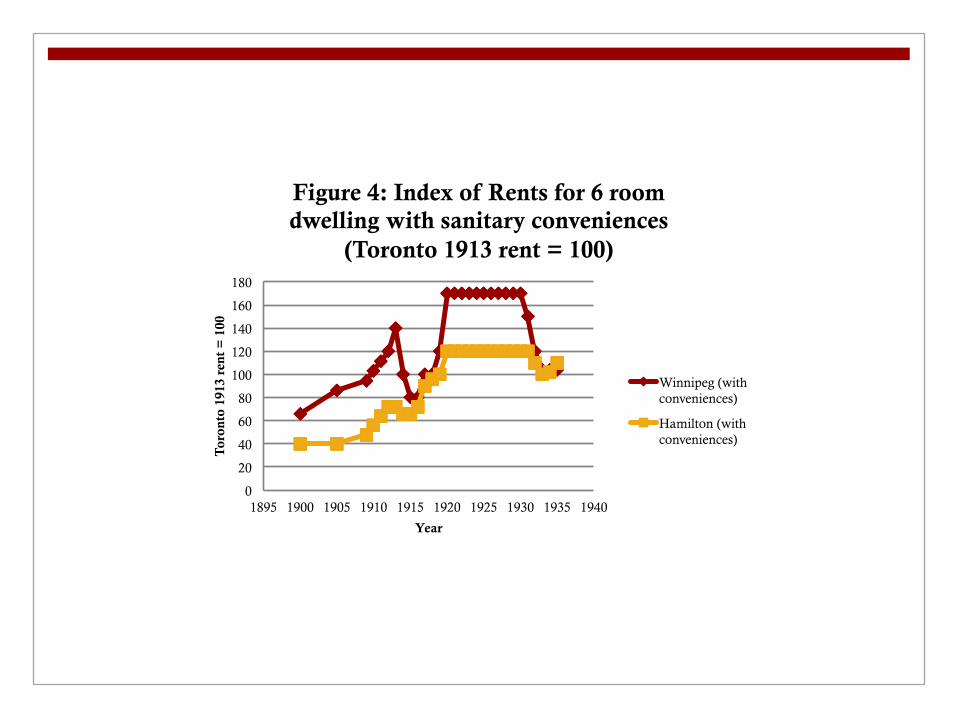
Figure 4: Index of Rents for 6 room dwelling with sanitary conveniences
(Toronto 1913 rent = 100)
Winnipeg (with conveniences)
Hamilton (with conveniences)


Interpretation n Figure 4: Land scarcity in Winnipeg led to higher
monthly rents than in Hamilton and TBD with the period from 1900 to 1913 showing a big increase in monthly rents in Winnipeg, and less of an increase than Hamilton. This is eventually followed by a fall in rents.
n Figure 5: Figure 5 takes the current dollar value of rents per month in Hamilton and Winnipeg and divides by the hourly wage rate of carpenters in the city to estimate the hours of work per month needed to pay for rent. The results here suggest some real wage growth in Winnipeg, from lower real wages, than Hamilton and much more steady real wages in Hamilton.

The process of wealth accumulation
n First, the wheat boom itself in keeping with the analysis of Chambers and Gordon appears to have been a largely extensive growth experience. While overall wealth and income grew, wealth and income per capita at the end of the boom period was not any greater than at the start.
n Second, in Winnipeg and The Lakehead, the chief beneficiaries of western expansion, the rise in wealth was largely driven by an increase in property and real estate values. Once the boom ended and property prices collapsed, wealth levels reverted to their pre-boom levels. The wealth gains of the boom were entirely short-term and of most benefit to those best able to time their entry and exit from the real estate market.

-1000
-500
0
500
1000
1500
2000
1870 1880 1890 1900 1910 1920 1930
nom
inal
dol
lars
Figure 6: Annual Average of LOWESS Smoothed Nominal Mortgages,
Winnipeg , Hamilton and The Lakehead (bandwidth=0.8)
Winnipeg
Hamilton
The Lakehead

-0.1
0
0.1
0.2
0.3
0.4
0.5
0.6
1870 1880 1890 1900 1910 1920 1930
Figure 7: Annual Average of LOWESS Smoothed Portfolio shares: Real Estate
(rw) and Financial Assets (fw)
Winnipeg(rw)
Lakehead(rw)
Hamilton(rw)
Winnipeg(fw)
Lakehead(fw)
Hamilton(fw)

Timing the Boom
n While the boom period is traditionally seen to have ended in 1913 with the upturn in world interest rates and the onset of World War I in 1914, wealth and real estate holdings per capita in Winnipeg peaked well before that period when values are adjusted with more regionally based price indexes.
n If one wishes to time the boom by the peak of real estate as a share of wealth, then that peaks in Winnipeg at about 1908 and at The Lakehead in 1910.

Conclusions

The Wheat Boom Era n Canada’s western region was settled and provided
opportunities for income and wealth accumulation that were considered to no longer be available in Canada’s established regions.
n Indeed, until the opening of the Canadian west, there was net emigration until the 1890s – largely to the United States.
n Western Canadian labour markets paid lower real wages than central Canada’s during the Wheat Boom era but longer hours of work over the year allowed for convergence of annual labour earnings across the labour markets over time.
n Thus one interpretation would be that the emergence of the western Canadian economy allowed geographic mobility to translate into earnings and economic mobility.

However…
n Migration to the resource frontier offered higher incomes and opportunities to purchase real estate, but higher wealth came with higher risk than the alternative waged labour opportunities with slower wealth accumulation in the industrial heartland.
n The evidence also suggests that the effects of the wheat boom were indeed transitory with the boom expanding the overall stock of wealth – real estate wealth in particular – but not the real per capita amounts.