mobility in cities database - uitp.org data_0.pdf · mobility in cities database ... territory of...
TRANSCRIPT

MOBILITY IN CITIES DATABASE
Thank you for your interest in the Mobility in Cities Database. This sample dataset provides the following information, for the metropolitan areas analysed.
The reference year is 2012.
Description of the metropolitan area, including the official name, and/or the list of municipalities considered to be part of the metropolitan area.
Total resident population in the metropolitan area
Passenger cars per thousand inhabitants
Total public transport vehicle kilometres per inhabitant
Total public transport passenger kilometres per inhabitant
Daily trips per inhabitant
Full database (pdf + excel embedded):
UITP Members: 300 Euro
Non Members: 600 Euro
To order, send an E-mail to [email protected] with complete name and address for the invoicing. Delivery on receipt of payment.
UITP (Union Internationale des Transports Publics)
Rue Sainte-Marie 6
1080 Brussels, Belgium
www.uitp.org

City name Unit Abu Dhabi Addis Ababa Amsterdam Ankara Athens Barcelona
Description of metropolitan areaAbu Dhabi
Metropolitan areaAddis Ababa
Amsterdam
metropolitan area
(Stadsregio Amsterdam
16 municipalities)
Ankara Metropolitan
Area (Gölbaşi, Çubuk,
Sincan, Elmadağ,
Kazan, Çankaya,
Akyurt, Mamak,
Etimesgut,
Yenimahalle, Altindağ,
Keçiören, Pursaklar)
Attika region
Barcelona
Metropolitan Area
(Area Metropolitana
de Barcelona 36
municipalities)
Total resident population in the
metropolitan areapersons 913,100 3,384,569 1,450,668 4,606,168 3,828,000 3,220,476
Passenger cars per thousand
inhabitantsvehicles/1000 persons 528 35 371 195 718 383
Total public transport vehicle
kilometres per inhabitantVKM/inhabitant 43.8 37.2 n/a 114.5 37.8 93.7
Total public transport passenger
kilometres per inhabitantPKM/inhabitant 128 n/a n/a 2,502 n/a 2,196
Daily trips per inhabitant trips/inhabitant 2.06 1.11 n/a n/a n/a 3.22
© UITP all rights reserved
No part of this publication may be reproduced or transmitted
without the written permission of the International Association of Public Transport Page 2

City name
Description of metropolitan area
Total resident population in the
metropolitan area
Passenger cars per thousand
inhabitants
Total public transport vehicle
kilometres per inhabitant
Total public transport passenger
kilometres per inhabitant
Daily trips per inhabitant
Beijing Berlin Birmingham Brisbane Brussels Budapest Casablanca
City of BeijingState of Berlin (Lander
Berlin)
West Midlands
Metropolitan Area
Brisbane Statistical
division + Gold Coast +
South Coast
Brussels Capital region
Municipality of
Budapest
(Fopolgarmesteri
Hivatal Budapest)
Wilaya of Great
Casablanca
20,693,000 3,375,222 2,762,700 2,880,547 1,160,000 1,727,495 4,055,807
209 339 450 624 441 327 369
65.4 130.3 55.4 49.7 86.4 101.9 12.3
n/a 1,968 1,084 721 2,046 3,008 n/a
n/a 3.00 2.38 3.00 2.77 2.13 2.71
© UITP all rights reserved
No part of this publication may be reproduced or transmitted
without the written permission of the International Association of Public Transport Page 3

City name
Description of metropolitan area
Total resident population in the
metropolitan area
Passenger cars per thousand
inhabitants
Total public transport vehicle
kilometres per inhabitant
Total public transport passenger
kilometres per inhabitant
Daily trips per inhabitant
Chicago Copenhagen Delhi Dubai Dublin Geneva Glasgow
State of Illinois Counties
of Cook + DuPage +
Kane + Lake +
McHenry + Will
Copenhagen Capital
region
National Capital
Territory of DelhiEmirate of Dubai Greater Dublin Area
Republic and Canton
of Geneva
Strathclyde Partnership
for Transport
8,290,000 1,691,261 16,753,235 2,003,170 1,804,156 470,512 2,162,740
391 360 147 461 396 467 440
42.8 143.6 30.2 53.2 51 58.3 66.1
802 2,246 n/a 789 730 1,017 n/a
3.11 n/a 1.43 1.81 2.00 3.40 2.80
© UITP all rights reserved
No part of this publication may be reproduced or transmitted
without the written permission of the International Association of Public Transport Page 4

City name
Description of metropolitan area
Total resident population in the
metropolitan area
Passenger cars per thousand
inhabitants
Total public transport vehicle
kilometres per inhabitant
Total public transport passenger
kilometres per inhabitant
Daily trips per inhabitant
Gothenburg Hamburg Helsinki Hong Kong Izmir Jerusalem Johannesburg
Gothenburg
metropolitan area
(Vastra Gotalands Lan)
Hamburg Transport
Association HVV
Helsinki Region
Transport
(municipalities of
Helsinki, Espoo,
Kauniainen, Kerava,
Kirkkonummi, Sipoo)
Hong Kong Special
Administrative RegionIzmir Metropolitan Area
Jerusalem
Metropolitan AreaCity of Johannesburg
1,600,447 3,327,869 1,165,811 7,071,576 3,739,353 1,130,000 4,434,827
453 452 391 70 195 190 171
89.2 97.9 108.6 177.4 68.5 56.7 30.6
1,536 2,196 1,909 4,606 n/a n/a n/a
2.74 2.87 2.95 2.39 n/a 2.49 1.10
© UITP all rights reserved
No part of this publication may be reproduced or transmitted
without the written permission of the International Association of Public Transport Page 5

City name
Description of metropolitan area
Total resident population in the
metropolitan area
Passenger cars per thousand
inhabitants
Total public transport vehicle
kilometres per inhabitant
Total public transport passenger
kilometres per inhabitant
Daily trips per inhabitant
Kocaeli Lagos Lisbon London Madrid Mashhad Melbourne
Kocaeli Metropolitan
Area ( districts of
Basiskele, Cayirova,
Darica, Derince,
Dilovasi, Gebze,
Golcuk, Izmit, Kartepe,
Korfez)
Lagos
Lisbon Metropolitan
Area (Area
Metropolitana de
Lisboa 18
municipalities)
Greater London Area
Community of Madrid
(Comunidad de
Madrid)
Mashhad Greater Melbourne
1,573,454 20,621,119 2,800,000 8,310,000 6,498,560 2,857,205 4,194,484
100 75 433 307 506 246 593
n/a 1.6 50.8 168.2 95.7 n/a 64
n/a 168 1,414 2,841 n/a n/a n/a
1.48 1.07 n/a 3.13 2.45 n/a 2.85
© UITP all rights reserved
No part of this publication may be reproduced or transmitted
without the written permission of the International Association of Public Transport Page 6

City name
Description of metropolitan area
Total resident population in the
metropolitan area
Passenger cars per thousand
inhabitants
Total public transport vehicle
kilometres per inhabitant
Total public transport passenger
kilometres per inhabitant
Daily trips per inhabitant
Milan Montreal Moscow Mumbai Munich Nairobi Niigata
Milan Metropolitan
area (Commune of
Milan + periferal
communes)
Greater Montreal
(Communaute
metropolitaine de
Montreal)
Moscow regionMumbai Metropolitan
RegionCity of Munich Nairobi City Niigata
2,123,920 3,772,853 12,197,596 20,748,395 1,439,474 4,500,000 811,901
570 573 319 28 452 72 554
138.4 50.2 259 n/a 106.3 4.1 n/a
n/a 1,140 4,867 n/a 2,825 n/a n/a
2.47 2.32 n/a 1.66 3.40 1.32 2.50
© UITP all rights reserved
No part of this publication may be reproduced or transmitted
without the written permission of the International Association of Public Transport Page 7

City name
Description of metropolitan area
Total resident population in the
metropolitan area
Passenger cars per thousand
inhabitants
Total public transport vehicle
kilometres per inhabitant
Total public transport passenger
kilometres per inhabitant
Daily trips per inhabitant
Oslo Paris Phoenix AZ Portland OR Prague Rome Seoul
Oslo and Akershus
CountyParis Ile-de-France
Maricopa Country
Metropolitan Planning
Organization
Portland Metro
Metropolitan Planning
Organization 3-county
area (Oregon state
counties of
Multnomah,
Clackamas and
Washington)
City of Prague (Mesto
Praha)Commune of Rome
Seoul Metropolitan
area (Seoul Special
City + Incheon +
Gyeonggi-do)
1,169,539 11,978,000 4,087,191 1,489,796 1,246,780 2,913,000 24,734,263
450 414 584 840 538 641 271
98.5 83.9 16.2 37.1 138.7 67.4 n/a
2,091 2,497 139 514 4,827 2,856 n/a
2.76 3.40 3.76 3.70 2.95 1.97 2.37
© UITP all rights reserved
No part of this publication may be reproduced or transmitted
without the written permission of the International Association of Public Transport Page 8

City name
Description of metropolitan area
Total resident population in the
metropolitan area
Passenger cars per thousand
inhabitants
Total public transport vehicle
kilometres per inhabitant
Total public transport passenger
kilometres per inhabitant
Daily trips per inhabitant
Shizuoka Singapore Stockholm Strasbourg Sydney Taipei Tallinn
Shizuoka Republic of Singapore Stockholm Lan
Strasbourg
Metropolitan area
(Communaute Urbaine
de Strasbourg)
Sydney Greater
Capital City Statistical
Area
Taipei City City of Tallinn
1,101,873 5,312,000 2,127,006 473,375 4,676,118 2,673,226 416,144
560 116 389 545 500 283 378
n/a 84.1 144 40.3 49.9 126.8 73.1
1,303 2,659 2,482 n/a 1,155 3,772 1,118
2.51 2.45 2.53 3.82 3.48 2.67 n/a
© UITP all rights reserved
No part of this publication may be reproduced or transmitted
without the written permission of the International Association of Public Transport Page 9

City name
Description of metropolitan area
Total resident population in the
metropolitan area
Passenger cars per thousand
inhabitants
Total public transport vehicle
kilometres per inhabitant
Total public transport passenger
kilometres per inhabitant
Daily trips per inhabitant
Tehran Tokyo Tshwane Turin Vancouver Vienna Warsaw
Tehran Bozorg
Tokyo Metropolitan
Area (including Tokyo
Metropolitan,
Kanagawa Prefecture,
Saitama Prefecture,
Chiba Prefecture and
the southern Part of of
Ibaraki Prefecture)
City of Tshwane Turin Metropolitan AreaMetro Vancouver (24
municipalities)
City of Vienna (Stadt
Wien)City of Warsaw
8,400,000 37,239,767 2,880,255 1,515,786 2,410,126 1,741,246 1,715,517
370 329 156 661 439 390 575
40.6 105.6 n/a 47.1 51.7 98.6 124.6
1,648 5,684 n/a 1,221 1,222 1,733 n/a
2.76 2.45 0.80 2.44 2.52 2.66 n/a
© UITP all rights reserved
No part of this publication may be reproduced or transmitted
without the written permission of the International Association of Public Transport Page 10
City name
Description of metropolitan area
Total resident population in the
metropolitan area
Passenger cars per thousand
inhabitants
Total public transport vehicle
kilometres per inhabitant
Total public transport passenger
kilometres per inhabitant
Daily trips per inhabitant
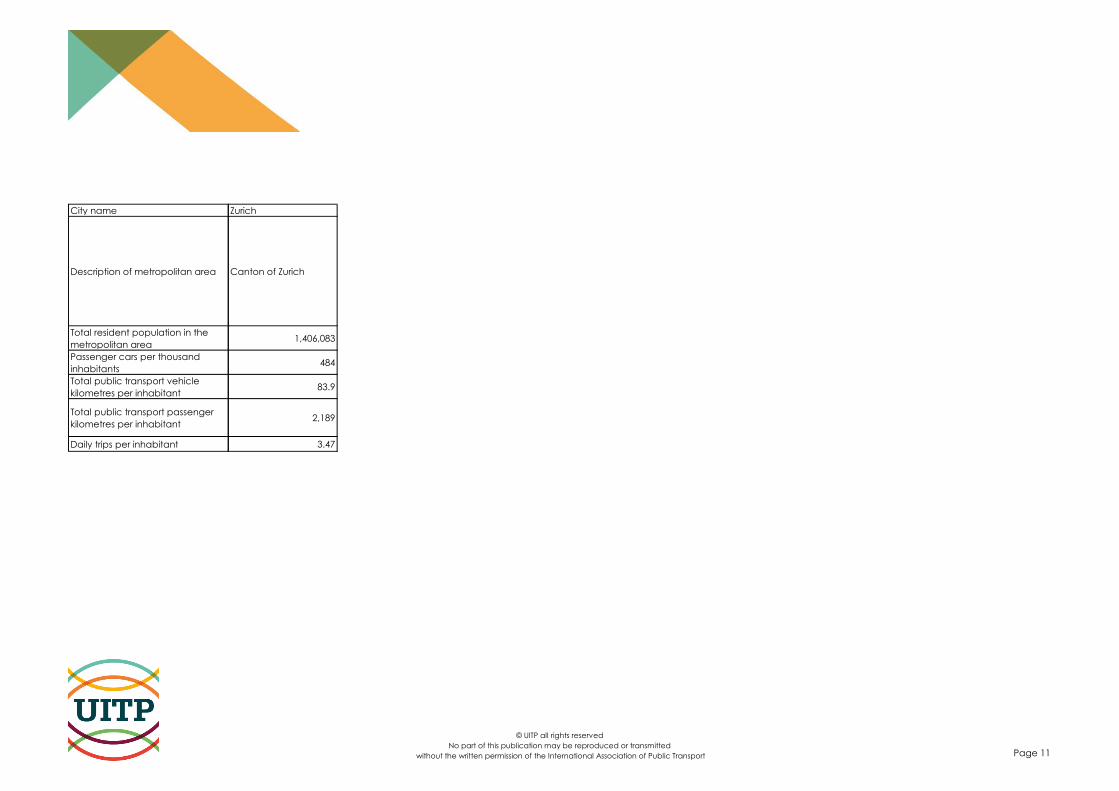
Zurich
Canton of Zurich
1,406,083
484
83.9
2,189
3.47
© UITP all rights reserved
No part of this publication may be reproduced or transmitted
without the written permission of the International Association of Public Transport Page 11