mobilt trådlöst bredband hspa och lte - internetdagarna · mobilt trådlöst bredband hspa och...
TRANSCRIPT

1
Mobilt Trådlöst Bredband HSPA och LTE
Jan FärjhVice President
Head of Ericsson Research

2
Major trends - today

3
Broadband services to a screen of your choice
Full Service Broadband

4
Global cellular subscriptions By system standard
Source: Internal Ericsson
Reported subscription forecast by standard
0
1000
2000
3000
4000
5000
6000
2005 2006 2007 2008 2009 2010 2011 2012
Rep
orte
d Su
bscr
iptio
ns (M
illio
ns)
Analogue & Other TDMA CDMAMobile WiMAX GSM/GPRS/EDGE WCDMA/HSPALTE

5
0
1 000 000
2 000 000
3 000 000
4 000 000
5 000 000
2004 2005 2006 2007 2008 2009 2010 2011 2012
Tera
byte
Tera
byte
Mobile access traffic
0
50 000 000
100 000 000
150 000 000
200 000 000
250 000 000
300 000 000
350 000 000
2005 2006 2007 2008 2009 2010 2011 2012
IPTV
InternetVoice
Fixed access traffic
TV/video
Internet
Voice
Network traffic growth Strong outlook
Traffic growth driven by TV, video and internetSource: Ericsson and market estimate
6
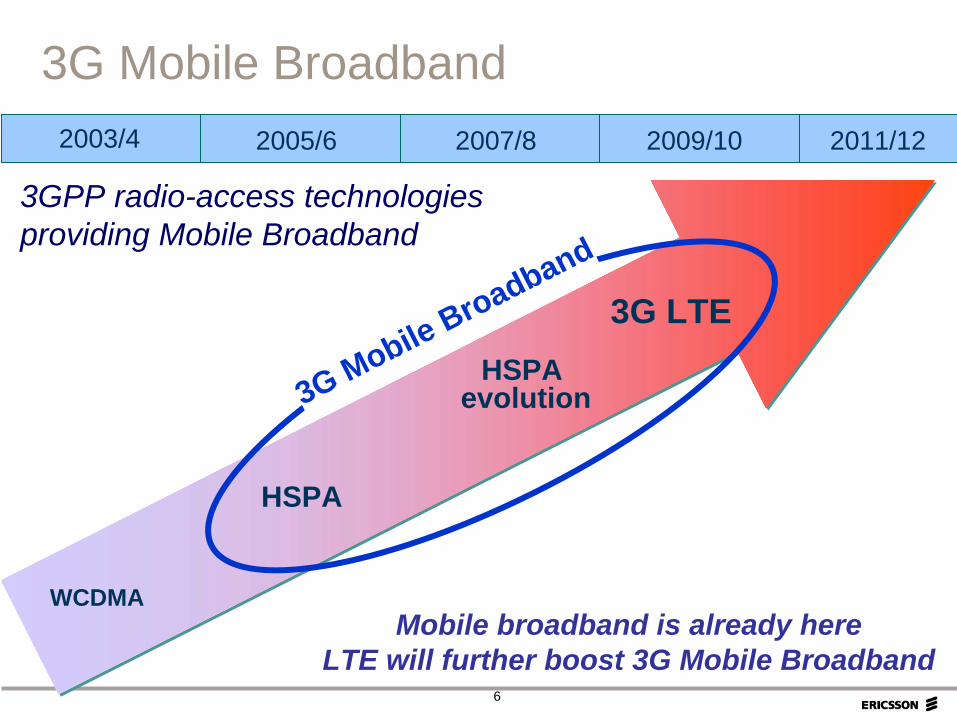
WCDMA
HSPA
2005/6 2009/102003/4 2007/8 2011/12
3G LTEHSPA
evolution3G Mobile Broadband
Mobile broadband is already hereLTE will further boost 3G Mobile Broadband
3GPP radio-access technologies providing Mobile Broadband
3G Mobile Broadband

7
WCDMA
2005/6 2009/102003/4 2007/8 2011/12
3G LTE
HSDPA and Enhanced Uplink
HSPA
HSPA evolution
Downlink: 3.6 Mbps 7.2 Mbps 14 MbpsUplink: Up to 5.8 Mbps
In commercial use since 2005!
HSPA – High Speed Packet Access
8
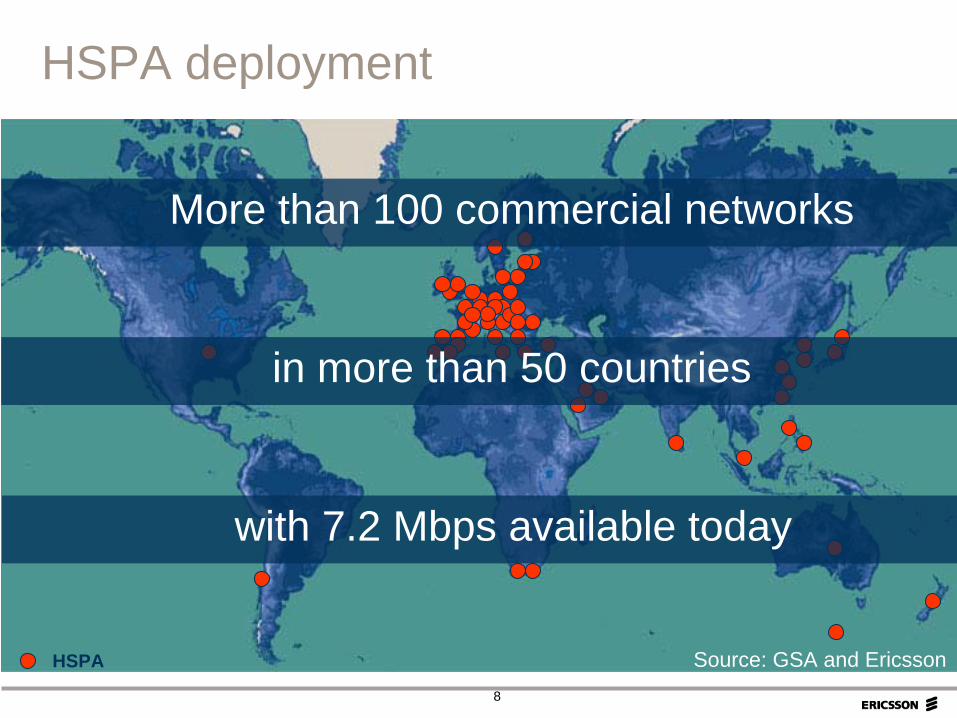
HSPA
HSPA deployment
Source: GSA and Ericsson
in more than 50 countries
More than 100 commercial networks
with 7.2 Mbps available today

9
Over 300 HSPA enabled devices*
137 mobile phones51 PC with HSPA embedded87 PC cards and USB modems32 wireless routers3 Media players and 1 camera
*Commercially launched as of June 2007 (GSA)
Most popular device: HSPA USB module (Sweden, June 2007)

10
Examples:USD 25/month 250 MB includedUSD 53/month 1GB included
Vodafone Mobile Connect Card 3GExamples: 1Gb = USD 53/month4Gb = USD 79/month
CingularFirst in the worldExamples: Unlimited USD 59,99
HSPA offerings on market Some examples
ExamplesUSD 12/month - 25MB/day 3 Sweden example:
Unlimited 3.6 Mbps = USD 29/monthMaxis Malaysia offering fixed ’replacement’Example: For RM 98/month = USD 30/month
Optimus, Portugal Examples:2GB/month USD 406GB/month USD 53
Projection: 50% of all sold Laptops/ Notebooks to have HSPA by 2011
Formerly
11
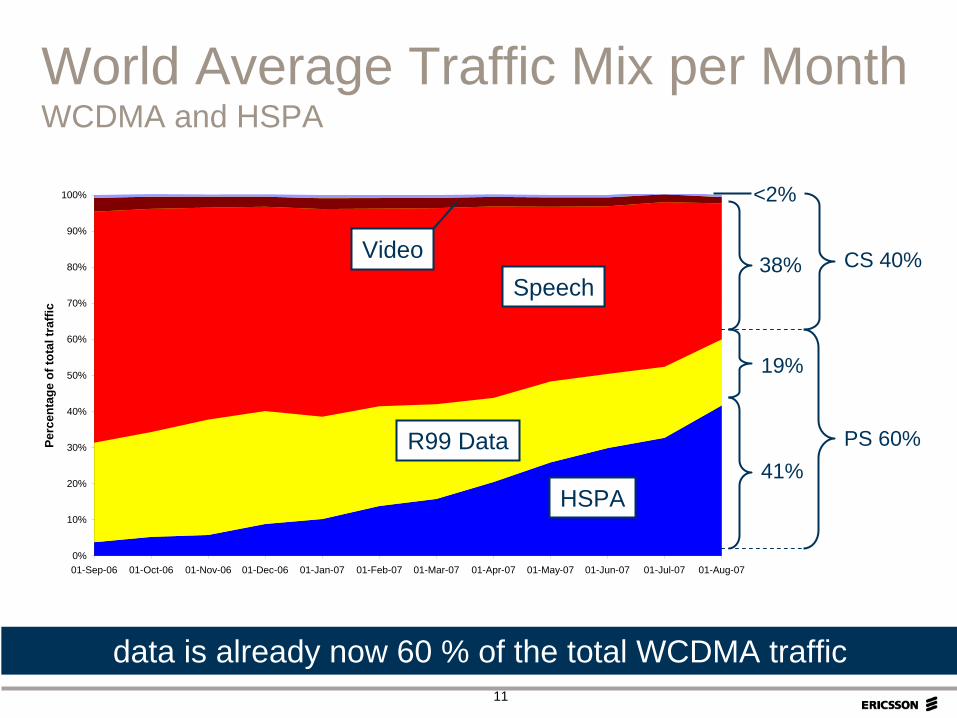
World Average Traffic Mix per Month WCDMA and HSPA
0%
10%
20%
30%
40%
50%
60%
70%
80%
90%
100%
01-Sep-06 01-Oct-06 01-Nov-06 01-Dec-06 01-Jan-07 01-Feb-07 01-Mar-07 01-Apr-07 01-May-07 01-Jun-07 01-Jul-07 01-Aug-07
Perc
enta
ge o
f tot
al tr
affic
Sum of %PS_HS Sum of %PS_DCH Sum of %Speech Sum of %CS64 Sum of %OthersCtrl + Shift+ O
HSPA
R99 Data
SpeechVideo
38%
19%
41%
<2%
PS 60%
CS 40%
data is already now 60 % of the total WCDMA traffic
12
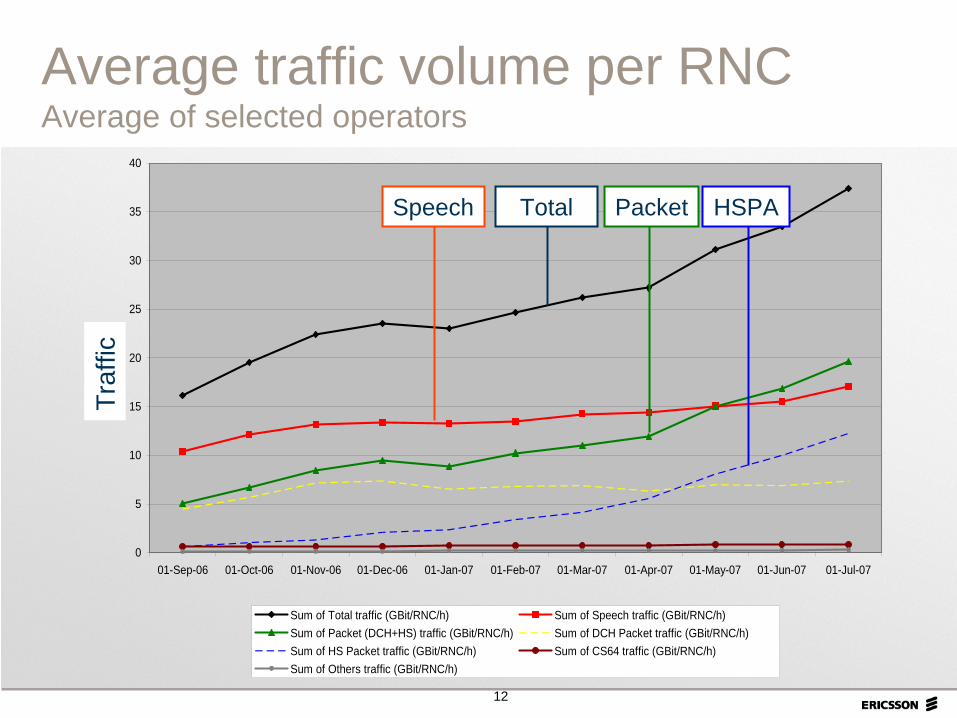
Average traffic volume per RNC Average of selected operators
0
5
10
15
20
25
30
35
40
01-Sep-06 01-Oct-06 01-Nov-06 01-Dec-06 01-Jan-07 01-Feb-07 01-Mar-07 01-Apr-07 01-May-07 01-Jun-07 01-Jul-07
Gbi
t/RN
C/h
Sum of Total traffic (GBit/RNC/h) Sum of Speech traffic (GBit/RNC/h)Sum of Packet (DCH+HS) traffic (GBit/RNC/h) Sum of DCH Packet traffic (GBit/RNC/h)Sum of HS Packet traffic (GBit/RNC/h) Sum of CS64 traffic (GBit/RNC/h)Sum of Others traffic (GBit/RNC/h)
Speech Total Packet HSPA
Traf
fic

13
Average traffic volume per RNC Aggressive operator
0
10
20
30
40
50
60
70
01-Oct-06 01-Nov-06 01-Dec-06 01-Jan-07 01-Feb-07 01-Mar-07 01-Apr-07 01-May-07 01-Jun-07 01-Jul-07
Gbi
t/RN
C/h
Sum of Total traffic (GBit/RNC/h) Sum of Speech traffic (GBit/RNC/h)Sum of Packet (DCH+HS) traffic (GBit/RNC/h) Sum of DCH Packet traffic (GBit/RNC/h)Sum of HS Packet traffic (GBit/RNC/h) Sum of CS64 traffic (GBit/RNC/h)Sum of Others traffic (GBit/RNC/h)
Speech Total Packet
HSPATraf
fic

14
HSDPA 7.2 Mbps performanceLive WCDMA R99 + HSDPA, One carrier
High field performance in downlink
Good Coverage
Median bitrate3.8 Mbps
Mobile
Median bitrate1.9 Mbps
Median bitrate1.8 Mbps
Bad Coverage

15
Enhanced Uplink 1.4 Mbps mobilityLive WCDMA R99 + HSDPA, One carrier
High field performance in uplink
0 70 140
210
280
350
420
490
560
630
700
770
840
910
980
1050
1120
1190
1260
1330
1400
0
10
20
30
40
50
60
70
80
90
100Mobile
Median bitrate1.0 Mbps
Average bitrate
0
200
400
600
800
1000
1200
no soft softer soft 3w soft soft-softer
3w softer
Mobile

16
WCDMA
2005/6 2009/102003/4 2007/8 2011/12
3G LTE
HSPA
HSPA evolution
• Downlink: 14 Mbps 42 Mbps • Uplink: Close to 12 Mbps• Improved user experience
To ensure long-term HSPA competitiveness
HSPA evolution

17
Enhanced system performance and end user experience
• Higher-order modulationDownlink – 64QAM Uplink - 16QAM
• MIMO, 2x2 downlink
• "Continuous Packet Connectivity”
• Enhanced Broadcast/Multicast
• Higher-order modulationDownlink – 64QAM Uplink - 16QAM
• MIMO, 2x2 downlink
• "Continuous Packet Connectivity”
• Enhanced Broadcast/Multicast
HSPA evolution
• Higher data rates• Higher capacity• Reduced user-experience latency / faster access
Specifications finalized
18
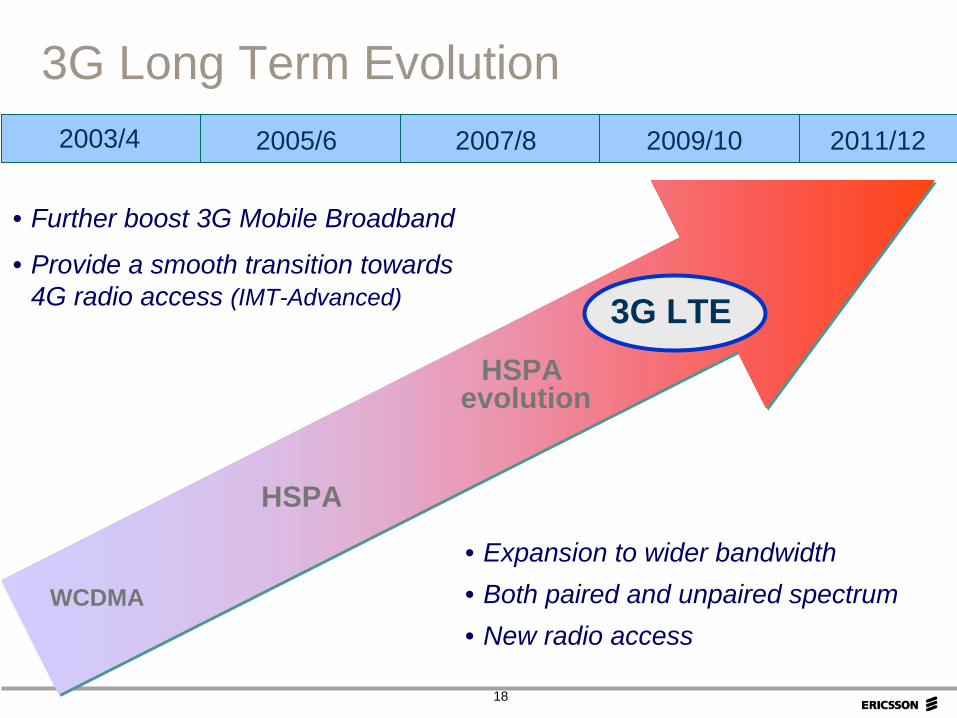
WCDMA
2005/6 2009/102003/4 2007/8 2011/12
HSPA
HSPA evolution
• Further boost 3G Mobile Broadband
• Provide a smooth transition towards 4G radio access (IMT-Advanced)
3G Long Term Evolution
3G LTE
• Expansion to wider bandwidth• Both paired and unpaired spectrum• New radio access

19
3G
HSPA
HSPA Evolved
3G LTE
GPRS
1998 2002 2005 2008 2009Ericsson
40 kbps 384 kbps 3.6 Mbps 28/42 Mbps >100 MbpsPeak rate
1000 x Higher Peak Rate in 10 years
GSM and 3G data evolution 1000 x Higher Peak Rate in 10 years
20
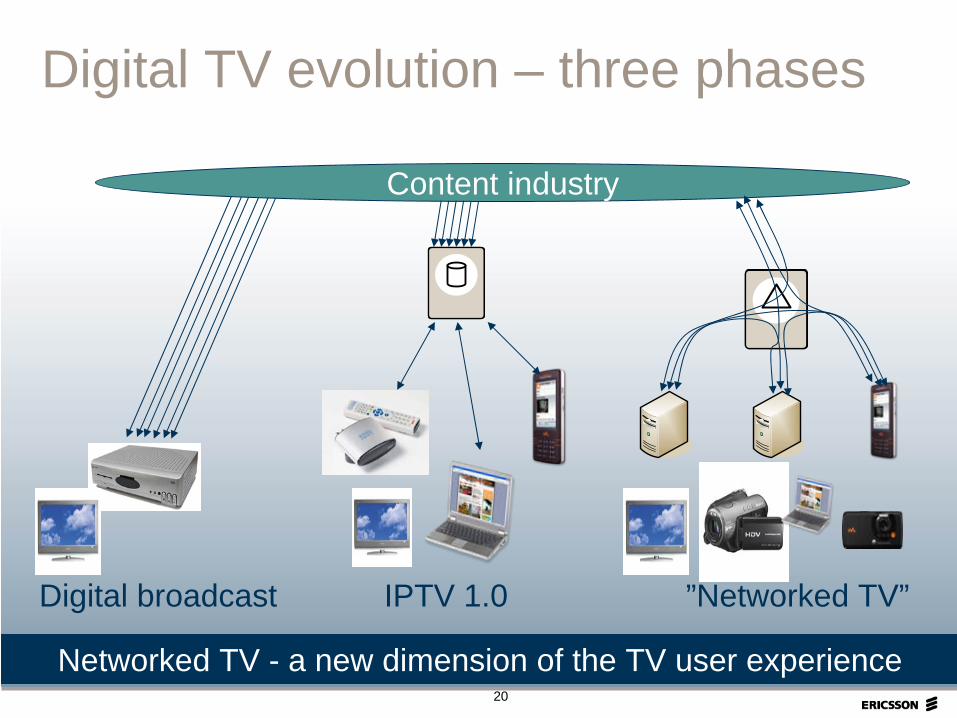
Digital TV evolution – three phases
Digital broadcast IPTV 1.0 ”Networked TV”
Networked TV - a new dimension of the TV user experience
Content industry

21
Making Web 2.0 mobile
Address book
Location
Presence
Camera
mp3 player
Mobile Phone
Network
Web 2.0 services
Broker/exchange
Make the phone the main source of User Generated Content
22
Summary
• Mobile broadband is here with good performance
• Data traffic has surpassed voice traffic
• Performance will increase even further
• Excellent oppurtunity to introduce new services

23