model averaging to combine simulations of future global vegetation carbon stocks
TRANSCRIPT
ENVIRONMETRICSEnvironmetrics 2009; 20: 791–811Published online 13 October 2008 in Wiley InterScience(www.interscience.wiley.com) DOI: 10.1002/env.953
Model averaging to combine simulations of future global vegetationcarbon stocks
Adam Butler1∗,†, Ruth M. Doherty2 and Glenn Marion1
1Biomathematics & Statistics Scotland, Edinburgh, U.K.2University of Edinburgh, U.K.
SUMMARY
We quantify the impact of climate model uncertainty upon predictions of future vegetation carbon stocks, for theperiod up to 2100, generated by a dynamic global vegetation model (DGVM) under a particular emissions scenario(SRES A2). Deterministic simulations are generated from the Lund-Potsdam-Jena (LPJ) model using climaticinputs derived from nine general circulation models (GCMs). Simulated changes between 1961–1990 and 2070–2099 range from +26 to +133 gtC, and are in broadly good agreement with those obtained in a recent previous studyusing the LPJ model. Simulated values for the 20th century are also obtained by running LPJ with observed climatedata, and this provides a baseline against which the other runs can be compared. Time series regression models areused to analyse the discrepancies between each of the GCM-based simulations and the baseline simulation, anda novel form of model averaging—in which we average not only across GCM-based simulations but also acrossmodels for each discrepancy—is then used to combine these into a single probabilistic projection for global stocksof vegetation carbon. Weights for the regression models are estimated in a simple post hoc way using the Bayesianinformation criterion (BIC), and the weights for the GCMs are either estimated in the same way or else fixed tobe equal. Estimating the GCM weights leads the predictions to be dominated by a single climate model and henceproduces narrow predictive distributions. If GCMs are weighted equally then the predictive distributions are muchmore diffuse and span the full range of simulated values. Copyright © 2009 John Wiley & Sons, Ltd.
key words: vegetation carbon; dynamic global vegetation model; general circulation model; Bayesianinformation criterion; extrapolation; climate change
1. INTRODUCTION
Policy makers and scientists are becoming increasingly interested in assessing the potential impacts ofclimate change upon physical, biological and socio-economic systems, and in using statistical methodsto quantify these impacts in a probabilistic way. Probabilistic climate impact predictions enable usersto account for scientific uncertainty and natural variability when making decisions about mitigationor adaptation strategies, and form a natural basis for risk assessment. They enable us, for example,to directly quantify the probability that a particular threshold of change will be exceeded, and, when
∗Correspondence to: A. Butler, Biomathematics & Statistics Scotland, James Clerk Maxwell Building, The King’s Building,Edinburgh EH9 3JZ, United Kingdom.†E-mail: [email protected]
Received 5 March 2008Copyright © 2009 John Wiley & Sons, Ltd. Accepted 7 August 2008

792 A. BUTLER, R. M. DOHERTY AND G. MARION
Figure 1. LPJ simulations of global annual vegetation carbon stocks for the 20th and 21st centuries. Carbon stocks are measuredin gigatonnes of carbon (gtC), and are reported as anomalies relative to the mean value for a 30 year reference period (1961–1990).Climate inputs to the baseline simulation run are based on the CRU-TS-2.1 gridded observational climate dataset, with inputsto the remaining 18 runs provided by outputs from nine different General Circulation Models. For GCMs with more than oneensemble run these are shown as dotted lines. This figure is available in colour online at www.interscience.wiley.com/journal/env
combined with an appropriate loss function, can provide a formal quantitative basis for decision makingin the face of uncertainty (Raisanen and Palmer, 2001).
Vegetation plays a key role in the global carbon cycle, but the relationship between climate andvegetation carbon is complicated: vegetation carbon stocks are influenced by net primary production,heterotrophic respiration and plant mortality (Schaphoff et al., 2006; Doherty et al., 2008), which are,in turn, influenced by temperature, water stress and ambient CO2 concentrations. In this paper we use adynamic global vegetation model (DGVM) to assess the effect of climate uncertainty upon predictionsof future global vegetation carbon stocks. Multiple simulations of past (20th century) and future (21stcentury) annual vegetation stocks are generated from the DGVM—these simulations are shown inFigure 1. Eighteen of the runs are generated using climate inputs derived from a set of nine differentstate-of-the-art general circulation models (GCMs) under a common emissions scenario (SRES A2).Note that the number of runs is larger than the number of GCMs because multiple runs are availablefor three of the GCMs (Table 1); the multiple runs (‘ensembles’) are obtained using different initialvalues or parameter values, and their inclusion is design to allow—albeit in a very limited way—forthe presence of intra-GCM uncertainty. The final, ‘baseline’, simulation is generated using griddedobservational climate data (the CRU-TS-2.1 dataset; Mitchell and Jones, 2005; Climatic Research Unit,2006), and hence only covers the 20th century.
Statistical interest lies in combining the disparate deterministic predictions of future vegetation carboninto a single probabilistic prediction. We know that GCMs provide a biased and noisy representationof the real climate, and so we begin our analysis by analysing the dynamic statistical properties of thebias associated with each of the GCM-based simulations. We do this by assuming—in the absence ofobservational data at appropriate temporal and spatial scales—that the baseline simulation provides thebest available description of true vegetation carbon stocks for the 20th century, and using time seriesregression models to analyse the discrepancy between this run and each of the GCM-based simulations.The assumption that the baseline simulation provides an accurate description of 20th century vegetationcarbon stocks depends upon (a) the accuracy of observational data for climate, soil type and atmospheric
Copyright © 2009 John Wiley & Sons, Ltd. Environmetrics 2009; 20: 791–811DOI: 10.1002/env

MODEL AVERAGING OF GLOBAL VEGETATION STOCKS 793
Table 1. Description of the nine GCMs which are used to provide climate inputs to the LPJ model
Model name Institution Spatial resolution No. of runs
NCAR-CCSM3 National Centre for Atmospheric Research, USA 1.4065◦ × 1.4065◦ 5CCCMA-CGCM3.1 Canadian Centre for Climate Modelling and Analysis, 3.7500◦ × 3.7500◦ 4
CanadaCNRM-CM3 Centre National de Recherches Meteorologiques, France 2.8125◦ × 2.8125◦ 1CSIRO-MK3.0 CSIRO Atmospheric research, Australia 1.8750◦ × 1.8750◦ 1ECHAM5 Max Planck Institute for Meteorology, Germany 1.8750◦ × 1.8750◦ 3GFDL-CM2.1 Geophysical Fluid Dynamics Laboratory, USA 2.5000◦ × 2.0000◦ 1HadCM3 Hadley Centre for Climate Prediction and Research, UK 3.7500◦ × 2.5000◦ 1HadGEM1 Hadley Centre for Climate Prediction and Research, UK 1.8750◦ × 1.2410◦ 1MRI-CGCM2 3 Meteorological Research Institute, Japan 2.8125◦ × 2.8125◦ 1
concentrations of carbon dioxide during the 20th century and (b) the ability of the Lund-Potsdam-Jena(LPJ) model to accurately encapsulate the processes that determine levels of global vegetation carbon;both of these issues have been extensively considered by previous authors, and in Section 2 we brieflyreview these studies.
For future years, throughout the 21st century, we do not know
(a) which GCM to use as a basis for prediction; or(b) which regression model to use in describing the relationship between this GCM-based simulation
and reality,
and both of these choices impact upon the predicted changes in vegetation carbon stocks. In Section3 we therefore use a relatively simple post hoc form of likelihood-based model averaging (Bucklandet al., 1997) to deal with these two sources of uncertainty. General statistical methodology for modelaveraging is well developed (Hoeting et al., 1999), and recent papers (Raftery et al., 2005; Berrocalet al., 2007; Sloughter et al., 2007) have shown that it can be used to provide a rigorous probabilisticframework for combining the predictions associated with a set of distinct deterministic models. Theidea of averaging across both deterministic and statistical models appears to be novel, however, andthrough this development we are able to simultaneously quantify two important elements of predictiveuncertainty.
The same methodological approach could also potentially be used in other environmental andecological applications—to combine predictions of climate variables generated directly by GCMs,for example, or to assess the impact of climate uncertainty upon the output from a rainfall-runoff model.Estimating weights post hoc can be less efficient than estimating parameters and weights simultaneously(as in, for example, Raftery et al., 2005), but has the substantial practical advantage that it extends easilyto more complicated situations—making it, for example, straightforward to deal with spatial, spatio-temporal or multivariate data, and making it trivial to incorporate additional deterministic simulationsinto the analysis.
2. SIMULATIONS OF VEGETATION CARBON
We use a DGVM to simulate values of global annual vegetation carbon throughout the 21st century.We focus upon a specific socio-economic scenario, SRES A2 (Nakicenovic and Swart, 2000), in which
Copyright © 2009 John Wiley & Sons, Ltd. Environmetrics 2009; 20: 791–811DOI: 10.1002/env

794 A. BUTLER, R. M. DOHERTY AND G. MARION
slow technological change, high population growth and regionally orientated economic growth resultin a large increase in anthropogenic CO2 emissions.
Stocks of vegetation carbon—the amount of above ground carbon, excluding litter—reflect theannual assimilation of net primary productivity (NPP) by different plant types. Levels of NPP are,in turn, influenced by atmospheric CO2 concentrations and temperature, with rising temperatures andCO2 concentrations promoting plant growth. Rising temperatures also increase evapotranspiration andreduce soil water availability, however, and can thereby induce plant water stress (excessive atmosphericdemand and/or low soil water availability). Plant uptake of CO2 and loss of water are regulated throughthe leaf stomata, and in times of water stress plants will act to prevent water loss by reducing stomatalopening, thereby reducing rates of photosynthesis and (hence) plant growth. Changes in assimilatedvegetation carbon in response to climate change are therefore potentially complicated, since they dependupon the combined effects of temperature change, precipitation change and baseline climate.
2.1. The LPJ model: description and validation
The LPJ dynamic global vegetation model (Sitch et al., 2003; Gerten et al., 2004) is a process-basedbiogeography-biogeochemistry model which simulates the spatio-temporal dynamics of terrestrialvegetation, together with land-atmosphere carbon and water exchanges. We use Version 1.2 of LPJ,which simulates potential natural vegetation and does not account for agricultural use.
The LPJ model inevitably provides a simplified and imperfect representation of the global ecosystem(in particular it is known to have difficulties in describing the roles of disturbance and nitrogendeposition; Magnani et al., 2007). This version of the LPJ model has, however, already been extensivelyvalidated for terrestrial carbon and hydrological exchanges and vegetation distribution (e.g. Sitchet al., 2003; Gerten et al., 2004; Zaehle et al., 2005; Hickler et al., 2006; Schaphoff et al., 2006),and the effects of structural uncertainty (Cramer et al., 2001; Smith et al., 2001) and parameteruncertainty (Zaehle et al., 2005) have also been explored. Comparisons of net ecosystem exchangeagainst observational data from EUROFLUX sites have been found to give reasonable agreement(Sitch et al., 2003; Zaehle et al., 2005). Hickler et al. (2006) found that modelled variation inNPP across a large number of sites—spanning several biomes—showed a strong correlation withestimates obtained from field measurements, although LPJ tended to simulate higher NPP than givenin the EUROFLUX EMDI dataset for grasslands. Crucially, LPJ was found to realistically simulatethe dominant plant functional types in most regions (Sitch et al., 2003; Schaphoff et al., 2006),and simulations of total vegetation carbon are therefore based on a realistic global distribution ofvegetation types. Historical data on global vegetation carbon stocks simply do not exist—the onlyavailable data are of limited temporal and spatial extent—so it is not possible to directly assessthe ability of LPJ to accurately reproduce real trends in vegetation carbon stocks at the globallevel.
2.2. Generation of simulated runs
The LPJ model requires input data on atmospheric CO2 concentrations and soil texture, together withclimatological data on temperature, precipitation and fractional cloud cover. In this paper we use themodel to generate nineteen sets of simulations; each of these runs is generated using a different set ofclimate inputs, but the same CO2 and soil texture data are used in all cases. Annual CO2 concentrationsare based on the Mauna Loa observational records up to the year 1990 (as in Schaphoff et al., 2006)and on predictions generated by the Bern-CC global carbon model under scenario SRES A2 for the
Copyright © 2009 John Wiley & Sons, Ltd. Environmetrics 2009; 20: 791–811DOI: 10.1002/env

MODEL AVERAGING OF GLOBAL VEGETATION STOCKS 795
Table 2. Comparison of daily mean global surface temperature and precipitation values generated by differentGCMs for 1961–1990 and 2070–2099, together with % change between these two periods. Observational climatedata (CRU) are shown for the period 1961–1990. Corresponding results are also shown for simulations of globalvegetation carbon stocks from the LPJ model. For NCAR-CCSM3, CCCMA-CGCM3.1 and ECHAM5 values areobtained by averaging across the available ensembles (but with ensemble 5 for NCAR-CCSM3 excluded, since
this run terminates in 2089)
GCM Surface temperature Precipitation LPJ vegetation carbon(daily mean, ◦C) (daily, mm) (annual, gtC)
1961– 2070– Change 1961– 2070– Change 1961– 2070– Change1990 2099 (%) 1990 2099 (%) 1990 2099 (%)
CRU data 13.5 • • 2.14 • • 790 • •NCAR-CCSM3 12.9 17.4 +35 2.25 2.55 +13.3 780 913 +17.1CCCMA-CGCM3.1 11.5 15.8 +38 2.04 2.21 +8.1 681 789 +15.8CNRM-CM3 11.8 16.3 +39 2.57 2.71 +5.3 763 821 +7.6CSIRO-MK3.0 12.1 15.6 +29 2.01 2.02 +0.6 618 725 +17.3ECHAM5 13.2 18.1 +37 2.00 2.15 +7.4 692 781 +13.0GFDL-CM2.1 12.2 16.5 +35 2.26 2.24 −0.6 580 649 +12.0HadCM3 12.4 17.3 +39 2.27 2.31 +1.5 798 827 +3.7HadGEM1 11.4 16.4 +44 2.40 2.40 −0.4 798 824 +3.3MRI-CGCM2 3 12.4 15.6 +26 2.08 2.17 +4.1 886 1013 +14.3
period 1990–2100 (Houghton et al., 2001, Appendix II). Soil texture data are grouped into eight discreteclasses, as in Gerten et al. (2004).
Eighteen of the runs are generated using nine different state-of-the-art GCMs (Table 1). GCMs arebased on a fundamental set of physical equations, and represent current best understanding of the physicalbehaviour of the coupled atmosphere-ocean system. The simulations which we use were created as partof the Fourth Assessment Report of the Intergovernmental Panel on Climate Change (IPCC, 2007)and are available through the Program for Climate Model Diagnosis and Intercomparison (PCMDI,2006). We consider only simulations generated under scenario SRES A2‡; under this scenario CO2concentrations are 836 ppmv in 2100 and mean global annual temperatures for the period 2070–2099are equal to 16.2◦C (based on averaging across the nine GCMs; Table 2). Multiple runs are availablefor some of the GCMs: each of these so-called ensemble runs is based on a different set of initialconditions and/or parameter values, and the use of ensembles is designed to quantify the effects ofintra-model uncertainty (which is often called ‘natural variability’ or ‘internal model variability’ in theclimate literature). The number of available ensemble runs is small, however, so we are only able to dothis in a very limited way. Soil and CO2 data are interpolated to the appropriate spatial resolution foreach GCM, and LPJ simulations are thereby generated at the native spatial scale associated with thatclimate model.
The remaining (‘baseline’) run from the LPJ model is generated, for the period 1900–2001 only,using observational climate data interpolated from individual weather stations onto a 0.5◦ × 0.5◦ grid.These gridded data come from the CRU-TS-2.1 dataset (produced by the Climatic Research Unit; New
‡Note that GCM simulations of future climate are contingent on a particular scenario for future emissions of greenhouse gasesand are, consequently, referred to as ‘projections’ rather than ‘predictions’ in the applied literature. We use the term ‘prediction’throughout this paper, in keeping with the standard statistical terminology, but stress the importance of appreciating that thesepredictions are conditional upon a particular set of socio-economic assumptions.
Copyright © 2009 John Wiley & Sons, Ltd. Environmetrics 2009; 20: 791–811DOI: 10.1002/env

796 A. BUTLER, R. M. DOHERTY AND G. MARION
et al., 2001; Mitchell and Jones, 2005; Climatic Research Unit, 2006); previous versions of the samedataset were used by previous authors in assessing the validity of simulations generated by LPJ (Sitchet al., 2003; Zaehle et al., 2005; Hickler et al., 2006; Schaphoff et al., 2006). A number of studies havebeen concerned with quantifying the accuracy of gridded climate data, but this is not a straightforwardtask because coverage varies substantially and irregularly across both space and time (e.g. Jones et al.,1997; Folland et al., 2001).
For each run of the LPJ model, a spin-up period of 1000 years is used to ensure that the initialvalues are in equilibrium; climatic inputs for this spin-up period are based on repeated use of climatedata/simulations for the period 1850–1880. The LPJ model is run on a daily basis: vegetation carbonstocks represent the accumulated sum of daily NPP, and the modelled values therefore need to accuratelyreflect day-to-day and month-to-month variations in productivity—the ability to capture these variationswill be important even when, as here, interest is solely in aggregated annual values. Daily values of theclimate variables are generated from monthly values via linear interpolation; alternative, more realisticapproaches, to temporal disaggregation could also be used (e.g. Gerten et al., 2004; Fowler et al., 2007).
2.3. Key features of the simulations
The 19 simulations of global annual vegetation carbon stocks are shown in Figure 1. The globalmean values are calculated by averaging across space, using weights proportional to the cosine ofthe latitude of each grid cell, after restricting attention only to those cells that contain at least 50% land.Table 2 summarises Figure 1 by comparing mean vegetation carbon stocks between the present day(as represented by a 30 year period from 1961–1990) and the end of the 21st century (2070–2099) foreach GCM, and comparing these changes against corresponding changes in mean temperature and dailyprecipitation.
Using the gridded CRU climate data we simulate the mean level of global vegetation carbon to be789.9 gtC over the 30 year period 1961–1990 (Table 2). This is in agreement with the value (779 gtC)obtained by Schaphoff et al. (2006) for 1971–2000 using the same climate data, although both of thesevalues are higher than those suggested by earlier studies: 466–654 gtC (Houghton et al., 2001) and640 gtC (Cao and Woodward, 1998). The true global value is not very well known (Benjamin Smith,Personal Communication, 2008).
It can clearly be seen (Figure 1) that predicted future trends in vegetation carbon stocks differ inboth direction and magnitude between the GCMs. All of the simulation runs exhibit increases in theperiod up to 2050, but two of the GCMs (HadCM3 and HadGEM1) show subsequent decreases duringthe second half of the 21st century whilst simulated values from another (CNRM-CM3) are relativelystable from around 2080 onwards. Simulated changes in global mean vegetation carbon stocks from1961–1990 to 2070–2099 range between +26 and +133 gtC.
In a previous study, Schaphoff et al. (2006) generated simulations from LPJ using five GCMs. Allsimulations were generated under the Is92a emissions scenario, in which ambient CO2 concentrationsreach 703 ppmv in 2100 (Houghton et al., 2001) and the average global annual mean temperature in2071–2100 is equal to 17.9◦C (based on averaging across the five GCMs that they consider). Schaphoffet al. (2006) ran a similar version of LPJ to that used in this paper, and four of the same GCMswere used in both studies (although Schaphoff et al., 2006 generally used earlier versions of thesemodels). They reported changes in global mean vegetation carbon stocks from 1971–2000 to 2071–2100 that ranged between −8 and +151 gtC. Of the GCMs that were common to both studies Schaphoffet al. (2006) reported changes of +151 gtC (CSIRO), +51 gtC (ECHAM5), +5 gtC (HadCM3) and−8 gtC (CGCM1), whilst we have identified changes of +108 gtC (CGCM3), +107 gtC (CSIRO),
Copyright © 2009 John Wiley & Sons, Ltd. Environmetrics 2009; 20: 791–811DOI: 10.1002/env
MODEL AVERAGING OF GLOBAL VEGETATION STOCKS 797
+89 gtC (ECHAM5) and +29 gtC (HadCM3). Previous studies using different DGVMs have suggestedvegetation increases of 150–340 gtC between the present day and 2100 (White et al., 1999; Cramer et al.,2001). Finally, mean vegetation carbon totals for the period 1961–90 are rather lower that the 1971–2000values given by Schaphoff et al. (2006).
3. MODEL AVERAGING
Let the vector y = (yO, yP ) denote the baseline simulation of annual global vegetation carbon. Thevalues, yO, for the period of observation (1900–2001) are known (non-missing), whilst the valuesyP for the period of prediction (2002–2100) are unknown (missing). Let Y denote the correspondingmultivariate random variable, from which y is assumed to be a realisation.
The aim of our analysis will be to draw inferences about the predictive distribution of YP |(YO = yO).It is important to note that we are therefore concerned with predicting the level of vegetation carbon thatthe LPJ model will simulate given future climate (or, to be more precise, given imperfect observationsof future climate), rather than with predicting the actual level of vegetation carbon. It is only possibleto draw inferences about the latter quantity if we are prepared to make the additional assumption thatthe LPJ model provides an accurate representation of the processes that determine levels of globalvegetation carbon.
3.1. Methodology
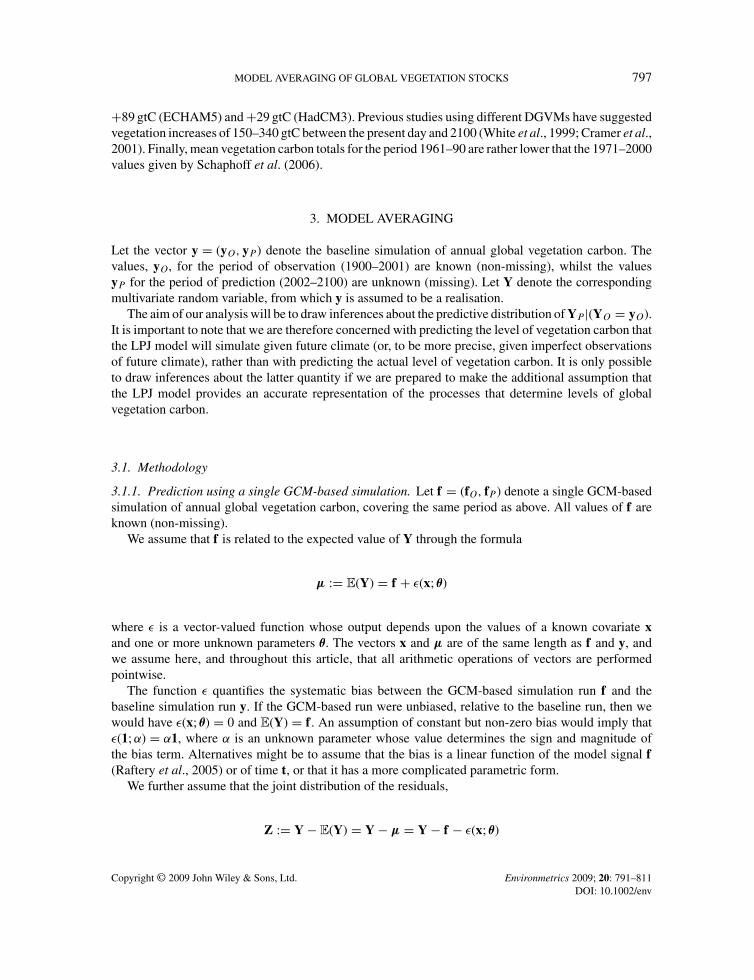
3.1.1. Prediction using a single GCM-based simulation. Let f = (fO, fP ) denote a single GCM-basedsimulation of annual global vegetation carbon, covering the same period as above. All values of f areknown (non-missing).
We assume that f is related to the expected value of Y through the formula
µ := E(Y) = f + ε(x; θ)
where ε is a vector-valued function whose output depends upon the values of a known covariate xand one or more unknown parameters θ. The vectors x and µ are of the same length as f and y, andwe assume here, and throughout this article, that all arithmetic operations of vectors are performedpointwise.
The function ε quantifies the systematic bias between the GCM-based simulation run f and thebaseline simulation run y. If the GCM-based run were unbiased, relative to the baseline run, then wewould have ε(x; θ) = 0 and E(Y) = f . An assumption of constant but non-zero bias would imply thatε(1; α) = α1, where α is an unknown parameter whose value determines the sign and magnitude ofthe bias term. Alternatives might be to assume that the bias is a linear function of the model signal f(Raftery et al., 2005) or of time t, or that it has a more complicated parametric form.
We further assume that the joint distribution of the residuals,
Z := Y − E(Y) = Y − µ = Y − f − ε(x; θ)
Copyright © 2009 John Wiley & Sons, Ltd. Environmetrics 2009; 20: 791–811DOI: 10.1002/env

798 A. BUTLER, R. M. DOHERTY AND G. MARION
can be described by a probability density function g whose form depend upon the values of one or moreunknown parameters ψ, so that
Z ∼ g(•; ψ)
and E(Z) = 0. Under this model, the predictive distribution for YP |(YO = yO) is equal to
P(YP = yP |YO = yO) = P(ZP + µP = yP |ZO + µO = yO)
= P(ZP = yP − µP |ZO = yO − µO)
= gP |O (yP − fP − ε(xP ; θ)| yO − fO − ε(xO; θ))
where gP |O denotes the relevant conditional distribution of g.In many situations it will be appropriate to assume that the residuals Z have a multivariate normal
distribution
Z ∼ MVN(0, �)
whose covariance matrix
� =[
�OO �OP
�PO �PP
]
depends upon the values of unknown parameters ψ. In this case, standard Gaussian theory tells us that
YP |(YO = yo) ∼ MVN(µP + �PO�−1OO(yO − µO), �PP − �PO�−1
OO�OP )
The simplest special case occurs if the components of Z are independent and normally distributedwith common variance σ2, so that � = σ2I. Often, however, we might expect the residuals to exhibittemporal dependence; for an autoregressive time series model of order one—an AR(1) model—thecovariance matrix will have elements of the form �kl = σ2ρ|k−l| and depend upon the values of twounknown parameters ψ = (σ2, ρ).
Overall, the selection of an appropriate statistical model for the discrepancy term Y − f consistsof choosing a parametric form for ε and a joint distribution for Z. The discrepancy term is driven byall processes that are not contained in the simulation run f—that is, by the climatic processes that arenot included within the GCM used to create f . As such, there will typically be little prior informationregarding the properties that this term should have, and so we suggest selecting an appropriate modelusing statistical rather than mechanistic criteria. Statistical model selection can proceed along standardlines by, for example, selecting the model with the lowest value of the BIC (Schwarz, 1978) or Akaikeinformation criterion (AIC; Akaike, 1973). Both criteria are defined to be equal to the deviance minus apenalty term: the penalty for BIC is equal to the product of the number of unknown parameters and thelog of the number of datapoints, whereas for AIC it is equal to twice the number of unknown parameters.
3.1.2. Model averaging across simulation runs. Recall that in our application there are 18 GCM-basedsimulation runs, taken from nine different GCMs. It is not clear which of the simulation runs should
Copyright © 2009 John Wiley & Sons, Ltd. Environmetrics 2009; 20: 791–811DOI: 10.1002/env

MODEL AVERAGING OF GLOBAL VEGETATION STOCKS 799
be used as a basis for prediction; model averaging provides a formal statistical mechanism to accountfor this uncertainty. This approach is also able to deal in a balanced way with the fact that some GCMshave ensemble runs whilst other do not, if the prior weights are chosen in such a way that each of theGCMs is given equal weight a priori (1/9, in our case).
Let fi denote the LPJ simulation of vegetation carbon that was generated using the ith GCM run,where i ∈ � and where � denotes the set of all GCM runs that have been used. For each i ∈ � weassume, as above, that
Zi := Y − µi = Y − fi − ε(xi, θi) ∼ g(•; ψi)
where µi := E(Y) = fi + ε(xi, θi) (and hence E(Zi) = 0).Any of the simulation runs i ∈ � could, potentially, be used as a basis for drawing inferences about
the missing (future) values of Y, and each would lead to a different predictive distribution. Assumethat one of these runs, I ∈ �, leads to the best predictive distribution for Y, but that the value of I isunknown. It follows (Raftery et al., 2005) that
P(Y = y) =∑i∈�
P(I = i)P(Y = y|I = i) =∑i∈�
P(I = i)P(Zi = y − µi|I = i)
=∑i∈�
wig(y − µi; ψi) =∑i∈�
wig(y − fi − ε (xi, θi) ; ψi
)
where wi := P(I = i) denotes the probability that simulation run i provides the best basis for prediction.The expected value of Y is equal to a weighted sum of the bias-corrected simulation runs,
E(Y) =∑i∈�
wiµi =∑i∈�
wi{fi + ε(xi, θi)}
This highlights the fact that the interpretation of wi is subtle; the value of wi is not directly relatedto the distance between the GCM-based simulation fi and the baseline simulation y, but rather to thedistance between the bias-corrected GCM-based simulation fi + ε(xi, θi) and y. As such, the relativeweights w1, . . . , w|�| that are allocated to different GCMs are contingent upon the parametric form thatis used to describe the bias term ε.
3.1.3. Model averaging across parametric forms for the bias term. In many situations, including ourapplication to vegetation carbon simulations generated by LPJ, it will unclear which parametric formshould be used to describe the bias term ε(x, θ). We therefore propose using model averaging to accountfor the uncertainty associated with this choice, as well as the choice of simulation run; this appears tobe a novel methodological development.
Let εj denote the jth possible parametric form for the bias term, where j ∈ B and where B denotesthe set of all parametric forms that are under consideration (in our application there will be four suchforms: constant, linear, quadratic and sinusoidal). Also let
Zij := Y − fi − εj(xi, θi) = Y − µij
and assume that Zij ∼ g(•; ψij) and E(Zij) = 0.
Copyright © 2009 John Wiley & Sons, Ltd. Environmetrics 2009; 20: 791–811DOI: 10.1002/env

800 A. BUTLER, R. M. DOHERTY AND G. MARION
It follows that
P(Y = y) =∑i∈�
∑j∈B
P(I = i, J = j)P(Y = y|I = i, J = j)
=∑i∈�
∑j∈B
wijg(y − µij; ψij
) =∑i∈�
∑j∈B
wijg(y − fi − εj
(xij, θij
); ψij
)
where wij := P(I = i, J = j). If we let wi := P(I = i) = ∑j∈B wij denote the marginal probability
that simulation run I provides the best basis for prediction, then
E(Y) =∑i∈�
∑j∈B
wijµij =∑i∈�
∑j∈B
wij{fi + εj(xij; θij)}
=∑i∈�
wi
(fi +
∑j∈B wijεj(xij; θij)∑
j∈B wij
)
3.1.4. Estimation of parameters and weights. For each choice of simulation run i ∈ � and biasmodel j ∈ B, we (simultaneously) estimate the parameters (θij, ψij) by numerical maximum likelihood
estimation; let (θij, ψij) denote the resulting estimators. The variance of (θij, ψij) is approximately equalto the inverse of the observed information matrix (which is, in turn, equal to the negative of the hessianof the log-likelihood function evaluated at the maximum likelihood estimate), and an approximation tovar(µij) can then easily be computed via the delta method.
We consider the effects of increasing the variance of g from var(Zij) to var(Zij) + var(µij), as anapproximate (conservative) means of assessing the degree of uncertainty associated with the estimationof µij when drawing predictive inferences. Note, however, that this does not account for the uncertainty
associated with estimating ψij .The relative performance of different simulation runs and bias models is assessed using either BIC
or AIC; let �ij denote the BIC (or AIC) values associated with simulation run i ∈ � and bias modelj ∈ B. We can use these to obtain approximate estimates for the weight wij , through Equation (18) ofBuckland et al. (1997):
wij = φij exp(−�ij/2)∑l∈B
∑k∈� φkl exp(−�kl/2)
(1)
φij denotes the prior weight associated with fitting bias model j ∈ B to simulation run i ∈ �. Note thatthe basic weighting scheme is also similar to that used by Murphy et al. (2004) in averaging acrossclimate predictions, except that they use a statistic known as the ‘climate prediction index’ (CPI) inplace of BIC.
Equation (1) allocates weight to simulation run i ∈ � based on the performance of that run duringthe 20th century, but this approach is open to criticism on the grounds that the past performance ofclimate models does not necessarily provide a reliable basis for determining their predictive ability (seeSection 4). An alternative approach is to keep the weights associated with simulations i ∈ � fixed at
Copyright © 2009 John Wiley & Sons, Ltd. Environmetrics 2009; 20: 791–811DOI: 10.1002/env

MODEL AVERAGING OF GLOBAL VEGETATION STOCKS 801
their prior values, so that∑
j∈B wij = ∑j∈B φij . This leads to the formula
wij = φij exp(−�ij/2)∑l∈B exp(−�il/2)(
∑k∈� φkl)
(2)
in which the BIC/AIC values are only used to determine the weights associated with potential modelsj ∈ B for the bias within the context of a particular deterministic simulation run i.
3.2. Application to LPJ simulations of vegetation carbon
Explanatory analyses motivated us to consider four possible models for the bias term,
ε(1; α) = α1;
ε(t; (α, β)) = α1 + βt;
ε(t; (α, β, γ)) = α1 + βt + γt2; and
ε(t; (α, β, a, b)) = α1 + β sin(a1 + bt)
which correspond, respectively, to constant, linear, quadratic and sinusoidal trends over time.All unknown parameters are estimated via numerical maximum likelihood, and multiple sets of
overdispersed initial values are used to ensure that the optimisation algorithm has converged to a globalmaximum.
For each of these choices of ε, and for each simulation run i ∈ �, there is strong evidence (interms of BIC/AIC) against the use of uncorrelated errors Zij and in favour of models that includeautocorrelation. Different time series models for the correlation structure—AR(1), AR(2), AR(3) andARMA(1,1) models—had broadly similar performance, with the AR(1) generally having similar orbetter (lower) BIC values than those associated with the other three models. We therefore proceededunder the assumption that the errors were described by an AR(1) model with unknown variance andcorrelation.
The BIC values associated with the different simulation runs and choice of bias model ε are shown inTable 3; note that low values of BIC indicate good performance. The overall differences in performancebetween deterministic models (GCMs) are markedly greater than those between models for the biasterm, but the relative performances of the four bias models still vary substantially: the no trend modelhas lowest BIC for eight of the GCM-based simulations, the linear model has lowest BIC for six, andthe sinusoidal model has lowest BIC for four.
We also explored the performance of a wider set of models for ε, before deciding upon the setof four that we have shown here. Models which included higher order polynomial trends in µij , orwhich included the model signal fi as a covariate rather than an offset, generally did perform better, interms of AIC/BIC, than any of the models that we have used. We chose to exclude these models fromour analyses on the grounds that they seem to provide a particularly unreliable basis for long-rangeextrapolation—levels of estimation uncertainty associated with the parameters of cubic or higher orderpolynomial models appeared to be extremely high, whilst LPJ simulations of vegetation carbon for the20th century (expressed as anomalies relative to the reference period 1961–1990) cover a very narrowrange of values relative to those that are simulated for the 21st century. Note that the decision of whichstatistical models to include in the set B is fairly subjective, and can have a substantial impact upon the
Copyright © 2009 John Wiley & Sons, Ltd. Environmetrics 2009; 20: 791–811DOI: 10.1002/env

802 A. BUTLER, R. M. DOHERTY AND G. MARION
Table 3. Relative BIC values associated with each combination of GCM-based simulations fi and statisticalmodels for the bias term εj , based on model fit during the period 1900–2001. Values are relative to those of thecombination with lowest BIC. For each GCM we also list the associated bias model εj with best fit (lowest BIC)
Simulation run, fi Model for bias, εij
GCM Ensemble No trend Linear Quadratic Sinusoidal Best fit
NCAR-CCSM3 1 69.07 64.23 70.85 67.00 LinearNCAR-CCSM3 2 49.39 50.51 54.99 54.93 No trendNCAR-CCSM3 3 39.27 38.87 45.46 41.61 LinearNCAR-CCSM3 4 64.08 60.18 65.49 72.08 LinearNCAR-CCSM3 5 65.35 63.35 68.37 69.63 LinearCCCMA-CGCM3.1 1 40.49 45.10 44.78 58.38 No trendCCCMA-CGCM3.1 3 25.58 28.36 31.03 9.79 SinusoidalCCCMA-CGCM3.1 4 46.13 48.16 53.05 59.66 No trendCCCMA-CGCM3.1 5 8.40 11.42 17.40 0.00 SinusoidalCNRM-CM3 111.13 112.77 118.96 120.52 No trendCSIRO-MK3.0 51.67 56.88 59.00 54.67 No trendECHAM5 1 50.24 53.07 54.86 51.37 No trendECHAM5 2 130.23 128.40 134.49 130.18 LinearECHAM5 3 73.91 79.76 86.32 80.91 No trendGFDL-CM2.1 116.52 112.19 117.23 123.89 LinearHadCM3 85.98 89.75 95.32 91.15 No trendHadGEM1 78.51 80.85 87.11 75.53 SinusoidalMRI-CGCM2 3 55.47 50.01 55.80 46.96 Sinusoidal
results of the model averaging; there is also subjectivity in the selecting the set of GCMs and GCMensembles �.
3.3. Results of model averaging
Model weights wij are calculated using Equation (1) or (2). In the absence of any other information,we assign equal prior weight to each of the nine GCMs, and, for GCMs with more than one ensemblerun, assign equal prior weight to each member of the ensemble. This allows us to deal with the nineGCMs in a balanced way, despite the fact that some GCMs have multiple ensembles and others do not.We assume that the four bias models are all equally plausible a priori. Hence φij = 1/36mi, where mi
denotes the number of ensembles associated with the GCM that was used to generate run i ∈ �.We find that Equation (1) lends virtually all weight (more than 99.9%) to be concentrated on just two
of the GCM runs, both of which originate from the same GCM (ensembles 3 and 5 from CGCM). Theassociated predictive distributions for future vegetation carbon stocks are consequently very precise(Figure 2; top), but will also be highly sensitive to the assumption that past performance of a GCMis indicative of future performance. In contrast, Equation (2) produces much more diffuse predictivedistributions (Figure 2; bottom) that span the full range of responses associated with the different GCMs,and so lead to less precise but perhaps more robust predictions of future change.
Predictive distributions from Equation (2) are actually moderately precise in the years up to 2050,but become much more diffuse during the second half of the century. In particular, predictions from2050 onwards reflect the possibility that the trend in carbon may be either increasing or decreasing.From about 2080 onwards there is a non-negligible probability that vegetation carbon stocks will be
Copyright © 2009 John Wiley & Sons, Ltd. Environmetrics 2009; 20: 791–811DOI: 10.1002/env

MODEL AVERAGING OF GLOBAL VEGETATION STOCKS 803
Figure 2. Predictive distributions for global vegetation carbon stocks during the 21st century, based on model averaging usingEquation (1) (top) or Equation (2) (bottom). 2.5, 50 and 97.5% quantiles of the predictive distribution are shown (thin blacklines), together with the baseline simulation (thick black) and GCM-based runs (grey). Stocks are reported as anomalies relative
to the mean value for the period 1961–1990. We account for estimation error by replacing var(Zij) with var(Zij) + var(µij)
lower than in 2002, and by the end of the 21st century the predictions of vegetation carbon stocks are,unsurprisingly, highly uncertain.
In Figure 3 we compare the predictive distributions (PDFs) for 2095 that are generated either bymodel averaging across both bias models and GCMs, or by averaging across GCMs using a particularbias model (e.g. sinusoidal or ‘no trend’). Model averaging using BIC gives a median predicted anomalyin 2095 of 116.5 gtC, and an associated 95% credible interval of [0.4,161.8] gtC. Note that this intervalspans the range of the GCM-driven simulations from LPJ, reflecting the fact that Equation (2) appliesequal weight to each GCM. The predictive distributions obtained by averaging across bias models usingBIC or AIC are fairly similar to those obtained by selecting the model with the lowest BIC/AIC, but doshow differences from those obtained using by the same bias model for each GCM-based simulation.Most notably, the predictive distribution associated with the no trend model differs markedly from theother three models models in which the discrepancy Y − f is allowed to show systematic variation overtime. These results suggest that, for our application, it is crucial to allow the parametric form for ε todepend upon which simulation run i is being considered is, but that it is less important to account forthe uncertainty associated with the choice of parametric form (i.e. model selection and model averagingover candidate models j ∈ B give similar results; note that the same is emphatically not true in the caseof the simulation runs i ∈ �).
Copyright © 2009 John Wiley & Sons, Ltd. Environmetrics 2009; 20: 791–811DOI: 10.1002/env

804 A. BUTLER, R. M. DOHERTY AND G. MARION
Figure 3. Predictive distributions for global vegetation carbon stocks in 2095, based on averaging across simulation runs usingfixed weights φi (i.e. using Equation (2)). The bias term ε is dealt with in six different ways: (a) always using a sinusoidal model(whichever GCM run i ∈ � is being considered); (b) always assuming that the bias is constant over time; (c) by selecting themodel for ε that has lowest AIC for each i ∈ �; (d) by selecting the model for ε that has lowest BIC; (e) by averaging across theset of possible models for ε using AIC and (f) by averaging across this set using BIC. Results are shown with (black) and without
(grey) accounting for uncertainty in the estimation of µij
Copyright © 2009 John Wiley & Sons, Ltd. Environmetrics 2009; 20: 791–811DOI: 10.1002/env

MODEL AVERAGING OF GLOBAL VEGETATION STOCKS 805
Figure 4. Predictive distributions for global vegetation carbon in the year 2001, based only on data up to 1960 (dotted), 1970(dashed), 1980 (thin solid) and 1990 (thick solid). Predictions are produced by model averaging across simulation runs andparametric forms for the bias using either Equation (1) (top) or Equation (2) (bottom). We account for estimation error byreplacing var(Zij) with var(Zij) + var(µij). The actual value of the baseline run in 2001 is also shown, for comparison (large
circle)
3.4. Assessment of past performance
We can partially assess the performance of our model averaging approach by predicting values of Y forperiods in which the baseline simulation is already available—in Figure 4, for example, we compare thepredictive distributions for the year 2001 that we obtain using Equations (1) and (2). These predictionsare based on estimating the values of the parameters and weights (θij , ψij and wij) using values from arestricted period only—either 1900–1960, 1900–1970, 1900–1980 or 1900–1990.
We see that predictive distributions based on values from the shortest period (1900–1960) are highlyuncertain, whether we use Equation (1) or (2). Equation (1) yields a distribution with two widely sepa-rated modes, with all intervening values—including the true value—having low or very low probabilitydensities. Equation (2), in contrast, generates a highly diffuse prediction, and assigns non-negligibledensities to a much wider set of values—including the true value. Similar but less diffuse results areobtained using data from 1900–1970, with the crucial difference that one of the modes in the predictivedistribution generated by Equation (1) now lies close to the actual value of y, so that a relatively high den-sity is assigned to this value. Predictive distributions based on the longest periods (1900–1980 or 1900–1990) are substantially more precise—less diffuse—than those based on 1900–1960 and 1900–1970.
Copyright © 2009 John Wiley & Sons, Ltd. Environmetrics 2009; 20: 791–811DOI: 10.1002/env

806 A. BUTLER, R. M. DOHERTY AND G. MARION
Crucially, the distributions obtained using Equation (1) no longer appear to be bimodal, and now assigna relatively high probability density to the true value. Qualitatively similar results are obtained by usingother periods (1900–1965, 1900–1970 and 1900–1975; not shown), and by considering years other than2001—the predictive distributions obtained via Equation (1) are always relatively precise but sometimeshighly inaccurate (i.e. assign a very low density to the true value of y), whereas the predictions obtainedusing Equation (2) are relatively diffuse but always assign a moderate density to the true value of y.
4. DISCUSSION
The substantial differences between the simulated levels of vegetation carbon obtained using differentGCMs (in Section 2) reflect the sensitive balance between the effects of temperature, precipitationand ambient CO2 concentration: concomitant increases in temperature and precipitation will lead toincreased vegetation growth, whereas increases in CO2 concentrations and temperature that are notassociated with any substantial increase in precipitation will lead to declining stocks of vegetationcarbon.
The largest relative temperature increases between 1961–1990 and 2070–2099 are shown by theHadCM3, HADGEM1 and CNRM-CM3 models (39, 44 and 39%, respectively). For the HadCM3 andHadGEM1 models these increases are not accompanied by any substantial change in precipitation(+1.5 and −0.4%, respectively), with the result that plant water stress is the dominant effect onvegetation carbon stocks after 2050 and that there are consequently only minimal increases in overallvegetation carbon over the course of the 21st century (+3.3 and +3.7%, respectively, between theperiods 1961–1990 and 2070–2099). Precipitation increases in CNRM-CM3, in contrast, are moderatelylarge (+5.3%), leading to a more prolonged, but still relatively slow, increase in vegetation carbonstocks (+7.6%): in this simulation the effects of increasing temperatures and CO2 on plant growth arepresumably balanced by reduced growth resulting from plant and soil water stress. The NCAR-CCSM3and CCCMA-CGCM3.1 models are associated with relatively large increases in both temperature (+35and +38%) and rainfall (+13.3 and +8.1%), leading to sustained and relatively large increases in levelsof vegetation carbon (+17.1 and +15.8%).
The results for the remaining models are somewhat less straightforward to interpret. The overalltemperature and precipitation changes for ECHAM5 are similar to those for the NCAR-CCSM3 andCCCMA-CGCM3.1 models, for example, but this model shows only relatively modest increases invegetation carbon (+13.0%). This may relate to the fact that ECHAM5 exhibits the lowest levelsof baseline rainfall, during 1961–1990, and so may experience relatively high levels of water stress;however, the CNRM-CM3 model exhibits even smaller increases in vegetation carbon despite havingthe highest level of baseline rainfall. A more detailed regional evaluation may be required in order tofully understand the causes of inter-GCM differences in simulated values of global vegetation carbon.
There is generally good agreement between the simulated values of vegetation carbon that we havepresented and those that were reported by Schaphoff et al. (2006). Values for three of the GCMs thatwere used in both studies are similar (ECHAM, CSIRO and HadGCM3), and exhibit the same ordering,although the results that we obtain using CGCM3 are very different to those which were obtainedby Schaphoff et al. (2006) using CGCM1. We might actually have expected to see larger increases invegetation carbon over the 21st century than those reported by Schaphoff et al. (2006), since atmosphericCO2 concentrations for the end of the 21st century are much higher under the SRES A2 emissionsscenario than under the Is92a scenario (19% higher). Despite the higher CO2 concentrations, however,the overall mean global annual temperature for 2070–2099 is substantially lower—by 1.7◦C—for the
Copyright © 2009 John Wiley & Sons, Ltd. Environmetrics 2009; 20: 791–811DOI: 10.1002/env

MODEL AVERAGING OF GLOBAL VEGETATION STOCKS 807
set of GCMs that we used than for the set used by Schaphoff et al. (2006). This difference may be dueto a reduced range of variability amongst the newer versions of GCMs (as noted by Meehl et al., 2007),and probably compensates for the differences in CO2 concentrations.
Note that the total amount of stored carbon will depend upon levels of soil and litter carbon as well asthe level of vegetation carbon. Higher temperatures increase heterotrophic respiration, and soil carbonstocks therefore have the potential to decrease in the future. Several of the GCM-driven simulationsin Schaphoff et al. (2006) simulate soil carbon decreases that are equal in magnitude to vegetationcarbon increases. Note that our results also do not account for future changes in land-use, which couldpotentially alter distributions of Plant Functional Types.
We have combined the simulations of vegetation carbon into a single predictive distribution using aform of model averaging in which the model weights are estimated post hoc. We have found that theresults of the model averaging procedure are strongly dependent upon the procedure used to estimatethe weights (Section 3.3). When the weights associated with the different GCMs were estimated basedon past performance, using Equation (1), then we found that a large amount of weight tended to beallocated to a small number of the climate models (one, in this case). Similar, although less extreme,phenomenon were reported by Min et al. (2007) in the context of surface air temperatures, by Fowleret al. (2007) in an analysis of temperature and precipitation at the catchment scale, and by Fowler andEkstrom (2008) in an analysis of UK precipitation. GCM predictions of the far future relate to climaticconditions that have no analogue in the observational record, so it seems questionable as to whetherwe can robustly assess the relative accuracy of future GCM-based predictions solely on the basis oftheir performance during the historical period. One approach to dealing with these difficulties is to keepthe marginal weights associated with the different GCMs fixed at their prior values, using Equation(2), allowing us to deal with the effect of predictive uncertainty in a more conservative—and, in thisparticular application, probably more plausible—fashion. Fixed model weights have been adopted bya number of authors in the context of climate prediction (e.g. Raisanen and Palmer, 2001; Palmer andRaisanen, 2002).
The key advantage of estimating the weights post hoc, using BIC/AIC, lies in the fact that thisapproach is straightforward and quick to implement: we can fit a separate model εj to each simulationrun fi using maximum likelihood, and then combine the results in a trivial and instantaneous way. Thecurrent methodology could, therefore, easily be extended to more complicated situations in which thepredictions have spatial, spatio-temporal or multivariate structure. There are some limitations, however.Equations (1) and (2) only provide approximate estimators for the weights wij , and the fact that wefit separate models for each simulation run fi prevents us from obtaining more efficient inferences bypooling some elements of the parameter vector θij across models (as in Raftery et al., 2005). Some ofthese difficulties could be avoided through the use of a fully Bayesian approach (using Reversible JumpMarkov chain Monte Carlo; Green, 1995), or by estimating parameters and weights simultaneouslyusing the EM-algorithm (Raftery et al., 2005), but, for computational reasons, these approaches wouldgenerally be less straightforward to generalise to more complicated situations.
Model averaging does not provide the only statistical methodology for combining a set ofdeterministic predictions into a single probabilistic prediction—see Tebaldi and Knutti (2007) for arecent review of methods that have been used in the context of climatology and Fowler et al. (2007) fora review of methods used in climate impact prediction. Alternative approaches for analysing runs drawnfrom a set of different models—so-called ‘ensembles of opportunity’—involve treating the predictiveruns {fi : i ∈ �} as explanatory variables and the baseline run y as the response variable in the context ofa regression model (e.g. Allen and Stott, 2003—optimal fingerprinting; Gneiting et al., 2005— EMOS;Greene et al., 2006), or treating y and {fi : i ∈ �} as mutually independent sources of data about the true,
Copyright © 2009 John Wiley & Sons, Ltd. Environmetrics 2009; 20: 791–811DOI: 10.1002/env
808 A. BUTLER, R. M. DOHERTY AND G. MARION
latent, process in the context of Bayesian hierarchical model (Tebaldi et al., 2004, 2005; Furrer et al.,2007; Smith et al., 2008). Lopez et al. (2006) compared the results obtained using these approaches whenanalysing global temperature. It is important to be aware that there are fundamental difficulties associatedwith generating probabilistic predictions using ensembles of opportunity (Stainforth et al., 2007), sincethe models are not drawn from any meaningful population, are not selected either systematically or atrandom, and are far from independent (Knutti et al., 2008). These issues inevitably afflict all studies thatuse outputs obtained from multiple GCMs, and cannot—with the possible exception of the final issue(dependence)—be corrected for within the statistical analysis. Analyses of ensemble runs that havebeen generated from a single common model (e.g. a single GCM) rest on a firmer conceptual basis, andstatistical methods for this purpose are relatively well-developed (SACCO methods: ‘statistical analysisof computer code output’; e.g. Kennedy and O’Hagan, 2001; Goldstein and Rougier, 2006).
5. CONCLUSIONS
Using state-of-the-art climate models and a DGVM, we have simulated trends in future global vegetationcarbon stocks under a particular emissions scenario, SRES A2. The simulated values suggest areasonable consensus amongst GCMs about both the direction and magnitude of change in the periodup to 2050, but indicate substantial uncertainty beyond that point; they are generally in good agreementwith those obtained in an earlier study by Schaphoff et al. (2006). Simulated values for vegetationcarbon stocks in 2095 (relative to 1961–1990) range from +0.7 to +151.4 gtC.
There are substantial advantages in using statistical approaches to combine these deterministicsimulations into a single probabilistic prediction/projection (Raisanen and Palmer, 2001; Collins, 2007),but there is currently little agreement on how this should be done (Fowler et al., 2007; Tebaldi and Knutti,2007). In this paper we have adopted a simple form of model averaging in which the model weights areestimated post hoc using BIC or AIC values (Buckland et al., 1997). The novel aspect of our statisticalapproach is that we account for two distinct sources of uncertainty: lack of knowledge about whichGCM provides the best basis for prediction, and lack of knowledge about the form of the relationshipbetween each of these GCM-based simulations and the simulation run obtained using observed climatedata (which we treat as being equivalent to the ‘truth’, given the lack of any actual data on globalvegetation carbon stocks). The statistical methodology is generic, so that it could be used to combinelong-term deterministic simulations generated by other environmental models, and ought to generaliseeasily to situations in which these simulations are multivariate or exhibit spatial structure.
The BIC/AIC values can either be used to estimate the weights associated with both the simulationruns themselves and with the models that we use to describe the discrepancy associated with eachof these runs, using information obtained from the period for which observational climate data areavailable, or can just be used to estimate the weights associated with the discrepancy models whilstassign equal weight to each GCM. The former approach leads the vast majority of weight to be attributedto a single GCM (CCCMA-CGCM3.1), and therefore produces narrow predictive distributions for thechange in vegetation carbon stocks from 1961–1990 until 2071–2099: a median of 118.6 gtC and a95% credible interval of [115.0,122.5] gtC. These results seem implausibly precise, and, because theyconcentrate so much weight on a single GCM, will be highly sensitive to the assumption that pastperformance provides a good indicator of future performance. The latter approach produces a muchmore diffuse predictive distribution that spans the full range of simulated responses—a median of116.5 gtC, a 95% credible interval of [+0.4,+161.8] gtC, and a probability of 0.022 that the values willbe lower than the average for 1961–1990. The latter values suggest that, under the SRES A2 emissions
Copyright © 2009 John Wiley & Sons, Ltd. Environmetrics 2009; 20: 791–811DOI: 10.1002/env
MODEL AVERAGING OF GLOBAL VEGETATION STOCKS 809
scenario, (a) vegetation has the potential to sequester more carbon in the future, as indicated by previousstudies; (b) the quantity of carbon that could be stored in this way is highly uncertain; and (c) thereis a small but non-negligible probability that vegetation carbon stocks will actually fall slightly overthe course of the 21st century. These findings are contingent upon the set of GCMs that were selected,the set of statistical models for ε that were considered, and the DVGM that was used, and should beinterpreted alongside concurrent changes in soil and litter carbon.
ACKNOWLEDGEMENTS
This work was funded by European Commission Framework 6 Integrated project ALARM (Assessing LArgescale environmental Risks for biodiversity with tested Methods) (GOCE-CT-2003-506675) and by the ScottishGovernment. Jonathan Rougier provided extensive advice regarding the statistical methodology and notation.Ben Smith, Stephen Sitch, Thomas Hickler, Sybil Schaphoff and Dieter Gerten provided LPJ model code andhelpful discussions regarding Section 2. Useful comments on the manuscript were provided by Chris Glasbeyand Clive Anderson. We acknowledge the GCM modelling groups for providing their data for analysis, and theProgram for Climate Model Diagnosis and Intercomparison (PCMDI) for collecting and archiving the modeloutput.
REFERENCES
Akaike H. 1973. Information theory and an extension of the maximum likelihood principle. In Second International Symposiumon Information Theory. Akademiai Kiado: Budapest; 267–281.
Allen MR, Stott PA. 2003. Estimating signal amplitudes in optimal fingerprinting, part I: theory. Climate Dynamics 21: 477–491.Berrocal VJ, Raftery AE, Gneiting T. 2007. Combining spatial statistical and ensemble information in probabilistic weather
forecasts. Monthly Weather Review 135(4): 1386–1402.Buckland ST, Burnham KP, Augustin NH. 1997. Model selection: an integral part of inference. Biometrics 53(2): 603–618.Cao M, Woodward FI. 1998. Dynamic responses of terrestrial ecosystem carbon cycling to global climate change. Nature 393:
249–252.Climatic Research Unit. 2006. CRU-TS-2.1 gridded global climate dataset. http://www.cru.uea.ac.uk/∼timm/grid/CRU TS
2 1.html (accessed April 2006).Collins M. 2007. Ensembles and probabilities: a new era in the prediction of climate change. Philosophical Transactions of the
Royal Society A 365(1857): 1957–1970.Cramer W, Alberte BF, Woodward I, Prentice CI, Betts RA, Brovkin V, Cox PM, Fisher V, Foley JA, Friend AD, Kucharik C,
Lomas MR, Ramankutty N, Sitch S, Smith B, White A, Young-Molling C. 2001. Global response of terrestrial ecosystemstructure and function to CO2 and climate change: results from six dynamic global vegetation models. Global Change Biology7(4): 357–373.
Doherty R, Sitch S, Smith B, Lewis SL, Thornton P. 2008. Implications of uncertainty in multi-model simulations of futureclimate for the carbon cycle and biogeography in East Africa. Global Ecology and Biogeography (submitted to Global ChangeBiology).
Folland CK, Rayner NA, Brown SJ, Smith TM, Shen SSP, Parker DE, Macadam I, Jones PD, Jones RN, Nicholls N,Sexton DMH. 2001. Global temperature change and its uncertainties since 1861. Geophysical Research Letters 28:2621–2624.
Fowler HJ, Blenkinsop S, Tebaldi C. 2007. Linking climate change modelling to impacts studies: recent advances in downscalingtechniques for hydrological modelling. International Journal of Climatology 27(12): 1547–1578.
Fowler HJ, Ekstrom M. 2008. Multi-model ensemble estimates of climate change impacts on UK seasonal rainfall extremes.International Journal of Climatology (in revision).
Furrer R, Sain SR, Nychka D, Meehl GA. 2007. Multivariate Bayesian analysis of atmosphere-ocean general circulation models.Environmental and Ecological Statistics 14(3): 249–266.
Gerten D, Schaphoff S, Haberlandt U, Lucht W, Sitch S. 2004. Terrestrial vegetation and water balance—hydrological evaluationof a dynamic global vegetation model. Journal of Hydrology 286: 249–270.
Gneiting T, Raftery AE, Westveld AH, Goldman T. 2005. Calibrated probabilistic forecasting using ensemble model outputstatistics and minimum CPRS estimation. Monthly Weather Review 133: 1098–1118.
Goldstein M, Rougier J. 2006. Bayes linear calibrated prediction for complex systems. Journal of the American StatisticalAssociation 101(475): 1132–1143.
Copyright © 2009 John Wiley & Sons, Ltd. Environmetrics 2009; 20: 791–811DOI: 10.1002/env

810 A. BUTLER, R. M. DOHERTY AND G. MARION
Green PJ. 1995. Reversible jump Markov chain Monte Carlo computation and Bayesian model determination. Biometrika 82(4):711–732.
Greene AM, Goddard L, Lall U. 2006. Probabilistic multimodel regional temperature change projections. Journal of Climate19(17): 4326–4343.
Hickler T, Prentice C, Smith B, Sykes MT, Zaehle S. 2006. Implementing plant hydraulic architecture within the LPJ dynamicglobal vegetation model. Global Ecology and Biogeography 15(6): 567–577.
Hoeting JA, Madigan D, Raftery AE, Volinsky CT. 1999. Bayesian model averaging: a tutorial. Statistical Science 14(4):382–417.
Houghton JT, Ding Y, Griggs M, Noguer M, van der Linder PJ, Xiaosu D (eds). 2001. Climate Change 2001: The Scientific Basis.Contribution of Working Group I to the Third Assessment Report of the Intergovernmental Panel on Climate Change (IPCC).Cambridge University Press, Cambridge, UK.
IPCC. 2007. Climate Change 2007: Synthesis Report. Contribution of Working Groups I, II and III to the Fourth AssessmentReport of the Intergovernmental Panel on Climate Change, IPCC: Geneva, Switzerland.
Jones PD, Osborn TJ, Briffa KR. 1997. Estimating sampling errors in large-scale temperature averages. Journal of Climate 10:2548–2568.
Kennedy MC, O’Hagan A. 2001. Bayesian calibration of computer models. Journal of the Royal Statistical Society Series B 63:425–464.
Knutti R, Allen MR, Friedlingstein P, Gregory JM, Hegerl GC, Meehl GA, Meinshausen M, Murphy JM, Plattner G-K, RaperSCB, Stocker TF, Stott PA, Teng H, Wigley TML. 2008. A review of uncertainties in global temperature projections over thetwenty-first century. Journal of Climate 21: 2651–2663.
Lopez A, Tebaldi C, New M, Stainforth D, Allen M, Kettleborough J. 2006. Two approaches to quantifying uncertainty in globaltemperature changes. Journal of Climate 19(19): 4785–4796.
Magnani F, Mencuccini M, Borghetti M, Berbigier P, Berninger F, Delzon S, Grelle A, Hari P, Jarvis PG, Kolari P, Kowalski AS,Lankreijer H, Law BE, Lindroth A, Loustau D, Manca G, Moncrieff JB, Rayment M, Tedeschi V, Valentini R, Grace J. 2007.The human footprint in the carbon cycle of temperate and boreal forests. Nature 447(7146): 848–852.
Meehl GA, Stocker TF, Collins WD, Friedlingstein P, Gaye AT, Gregory JM, Kitoh A, Knutti R, Murphy JM, Noda A, RaperSCB, Watterson IG, Weaver AJ, Zhao ZC. 2007. Global climate projections. In Climate Change 2007: The Physical ScienceBasis. Contribution of Working Group I to the Fourth Assessment of the Intergovernmental Panel on Climate Change, SolomonS, Qin D, Manning M, Chen Z, Marquis M, Averyt KB, Tignor M, Miller HL (eds). Cambridge University Press, Cambridge,UK.
Min SK, Simonis D, Hense A. 2007. Probabilistic climate change predictions applying Bayesian model averaging. PhilosophicalTransactions of the Royal Society A 365(1857): 2103–2116.
Mitchell TD, Jones PD. 2005. An improved method of constructing a database of monthly climate observations and associatedhigh-resolution grids. International Journal of Climatology 25: 693–712.
Murphy J, Sexton D, Barnett D, Jones G, Webb M, Collins M, Stainforth D. 2004. Quantification of modelling uncertainties in alarge ensemble of climate change simulations. Nature 430: 768–772.
Nakicenovic N, Swart R. 2000. Special Report on Emissions Scenarios. Cambridge University Press: UK.New M, Todd M, Hulme M, Jones P. 2001. Precipitation measurements and trends in the twentieth century. International Journal
of Climatology 15: 1889–1922.Palmer TN, Raisanen J. 2002. Quantifying the risk of extreme seasonal precipiation in a changing climate. Nature 415:
512–514.PCMDI. 2006. CMIP3 multi-model dataset archive. http://www.pcmdi.llnl.gov (accessed April 2006).Raftery AE, Gneiting T, Balabdaoui F, Polakowski M. 2005. Using Bayesian model averaging to calibrate forecast ensembles.
Monthly Weather Review 133(5): 1155–1174.Raisanen J, Palmer TN. 2001. A probability and decision-model analysis of a multi-model ensemble of climate change simulations.
Journal of Climate 14: 3212–3226.Schaphoff S, Lucht W, Gerten D, Sitch S, Cramer W, Prentice IC. 2006. Terrestrial biosphere carbon storage under alternative
climate projections. Climatic Change 74: 97–122.Schwarz G. 1978. Estimating the dimension of a model. Annals of Statistics 6: 461–464.Sitch S, Smith B, Prentice IC, Arneth A, Bondeau A, Cramer W, Kaplan J, Levis S, Lucht W, Sykes M, Thonicke K, Venevski S.
2003. Evaluation of ecosystem dynamics, plant geography and terrestrial carbon cycling in the LPJ dynamic vegetation model.Global Change Biology 9: 161–185.
Sloughter JM, Raftery AE, Gneiting T. 2007. Probabilistic quantitative precipitation forecasting using Bayesian model averaging.Monthly Weather Review 135: 3209–3220.
Smith B, Prentice CI, Sykes MT. 2001. Representation of vegetation dynamics in the modelling of terrestrialecosystems: comparing two contrasting approaches within european climate space. Global Ecology & Biogeography 10:621–637.
Smith RL, Tebaldi C, Nychka D, Mearns LO. 2008. Bayesian modeling of uncertainty in ensembles of climate models. Journalof the American Statistical Association (in press).
Copyright © 2009 John Wiley & Sons, Ltd. Environmetrics 2009; 20: 791–811DOI: 10.1002/env

MODEL AVERAGING OF GLOBAL VEGETATION STOCKS 811
Stainforth D, Allen MR, Tredger ER, Smith LA. 2007. Confidence, uncertainty and decision-support relevance in climatepredictions. Philosophical Transactions of the Royal Society A 365(1857): 2163–2177.
Tebaldi C, Knutti R. 2007. The use of the multimodel ensemble in probabilistic climate projections. Philosophical Transactionsof the Royal Society A 365(1857): 2053–2075.
Tebaldi C, Mearns LO, Nychka D, Smith RL. 2004. Regional probabilities of precipitation change: a Bayesian analysis ofmultimodel simulations. Geophysical Research Letters 31(L24213): 1–5.
Tebaldi C, Smith RL, Nychka D, Mearns LO. 2005. Quantifying uncertainty in projections of regional climate change: a Bayesianapproach to the analysis of multimodel ensembles. Journal of Climate 18: 1524–1540.
White A, Cannell MGR, Friend AD. 1999. Climate change impacts on ecosystems and the terrestrial carbon sink: a new analysis.Global Environmental Change 9: S21–S30.
Zaehle S, Sitch S, Smith B, Hatterman F. 2005. Effects of parameter uncertainties on the modeling of terrestrial biospheredynamics. Global Biogeochemical Cycles 19(GB3020): 1–16.
Copyright © 2009 John Wiley & Sons, Ltd. Environmetrics 2009; 20: 791–811DOI: 10.1002/env