model for energy efficiency in radio over fiber
TRANSCRIPT

Model for energy efficiency in radio over fiberdistributed indoor antenna Wi-Fi network
Yves Josse and Bruno FracassoTelecom Bretagne - Dept Optique
Technople Brest-Iroise - CS 8381829238 BREST CEDEX 3 (FRANCE)
Email: yves.josse,[email protected]
Patrice PajuscoTelecom Bretagne - Dept Micro-ondes
Technople Brest-Iroise - CS 8381829238 BREST CEDEX 3 (FRANCE)
Email: [email protected]
Abstract—Distributed antenna systems (DAS) are known toimprove coverage and performance of wireless communicationsin indoor environments. In this paper, the power consumptionand energy efficiency of a DAS using radio over fiber (RoF)are evaluated and compared with those in a centralized antennasystem. The instantaneous power consumption curves of a Wi-Fiaccess point and dongle combination are physically measuredfor different transmission configurations, yielding a distance-dependent energy efficiency model. In a second step, computersimulations show that a distributed system with four antennas is3.8 times more energy-efficient than a centralized antenna system,while the total radiated power is divided by a factor of two.
I. INTRODUCTION
The issue of power consumption and energy efficiency ofindoor wireless networks and more generally energy man-agement in telecommunication is a crucial one. There arecurrently new contexts for power saving, not only in terminalsto increase battery life, but also in access points to reduce thecarbon footprint (towards “greener” telecoms).
Furthermore, demands on throughput and performance keepincreasing, especially in indoor environments where users aredensely located. The advantages of RoF distributed antennasystems are very low fiber transmission loss, large bandwidth,and low transmit power levels, which enable us to improvethe coverage of in-building wireless services [1].
In this paper, our aim is to study the energy efficiency issuewithin RoF distributed antenna systems and to compare it witha centralized antenna system.
In the first part, a propagation model in a dense indoorenvironment is presented, to compare the maximum data rategiven by the 802.11 standard in a centralized antenna systemwith a DAS scheme. We then study the influence of themodulation scheme from a set of measurements of the actualpower consumption at the access point and terminals during adata transmission. Furthermore, modelling and simulation ofthe overall energy consumption in an RoF distributed antennanetwork are presented.
II. MAXIMUM DATA RATE STUDY
A. Indoor propagation model
Although indoor radiofrequency (RF) propagation was ex-tensively studied in the past, the received RF power cannot beaccurately predicted. Multiple scattering and reflections from
walls and furniture, as well as shadowing effects, cause strongtime and space variations in received power.
The model used is statistical and does not require any graph-ical database. Indeed our goal is not to find quantitative results,but to evaluate possible energy consumption discrepenciesbetween the centralized antenna and DAS schemes. Therefore,we shall use a simple model to estimate the RF power receivedby the receiver as a function of distance.
The average received power can be expressed (in dBm) as:
Pr = Pt +Gt +Gr − PL (1)
where Pt is the transmit power in dBm, Gt and Gr arethe transmitter and receiver antenna gains, respectively, andPL is the path loss in dB. Considering isotropic antennas,Gt = Gr = 0 dBi and the path loss is given by the followingequation [2] :
PL = PL(d0) + 10n log10
d
d0(2)
where PL(d0) is the path loss at d0 = 1 m, PL(d0) =−20 log10(c/4πfd0) = 40.2 dB at 2.4 GHz, d is the distancebetween transmitter and receiver and n is the power decayindex.
Considering a dense environment with small rooms, typi-cally a multifloor office where each employee has his/her ownoffice, the power decay index is between 4 and 6 [2]. In oursimulations, we shall use n = 5.12 [3].
B. Relationship between received power level and data rate
Regarding the Wi-Fi standard, the modulation scheme isadjusted according to the received power level. When amodulation is selected, the maximum reachable datarate is setby the 802.11 standard. Datasheets of Wi-Fi access points orWi-Fi cards provide the relationship between the modulationused and the receiver sensitivity. As an example, these dataare presented in Table I for a Netgear Access Point [4].
C. Simulation setup
Combining the receiver sensitivity from datasheets and theindoor propagation model, we can compute a map of thehighest reachable throughput as a function of the distance.The size of the area under consideration is 40 m × 40 m.
The 14th International Symposium on Wireless Personal Multimedia Communications (WPMC'11),
131

Fig. 1: Map of the highest 802.11 reachable data rate with oneaccess point, considering a radiated power of 17dBm
TABLE I: Maximum Data rate given by the 802.11 standardrelative to the power received by the terminal (box/dongle) [4]
Standard Data rate Receiver sensitivity
802.11b 1 Mbps -93 dBm802.11b 11 Mbps -89 dBm802.11g 24 Mbps -84 dBm802.11g 36 Mbps -80 dBm802.11g 48 Mbps -76 dBm802.11g 54 Mbps -75 dBm
In addition to this, we do not restrict the study to a planartopology, as several floors may exist between a terminal andan access point.
Figure 1 presents the evolution of the reachable throughputas a function of the distance between the access point andthe mobile terminal, with a radiated power of 17 dBm. Themaximum data rate given by the 802.11 standard is reachedwhen the distance between the terminal and the access point isless than 10.2 m (i.e. 20.5% of the total area). However, whenthe distance is greater than 23 m, no connection is possible(i.e 7.7% of the total area).
In a second step, the same area is considered with fourdistributed antennas with half the overall radiated power(i.e. each distributed antenna emits 8 dBm of power). Thesimulation result is presented in Figure 2, showing better cov-erage, despite a lower total radiated power. Indeed, a terminalcan communicate with an access point in the whole area.Moreover, the maximum datarate is reachable over 584 m2,representing 36.5% of the total area.
These simulations show the advantages of a distributedantenna network in terms of coverage and radiofrequencyexposure. In the following section, the energy efficiency ofan 802.11 network is studied.
Fig. 2: Map of maximum 802.11 data rate with four accesspoints delivering a total power radiation of 14 dBm (8dBmper distributed antenna)
Fig. 3: Power measurement setup
III. MEASURING ENERGY EFFICIENCY IN AN 802.11NETWORK
In the literature, there are few measurement reports dealingwith the energy consumption of access points and terminalsduring a transmission when the modulation type changes. Ingeneral, device specifications showing drive current curveswhile transmitting and receiving are not sufficient to calculateenergy consumption accurately.
A. Experimental setup
Power measurements were performed using a Netgear WG602 Access point in the infrastructure mode (no encryption)and a Wi-Fi USB dongle TL-WN422g from TP-Link. Othertypes of access points or USB dongles have been used withsimilar results.
The configuration of the access point enables us to choosethe standard (b/g) and the modulation associated with themaximal reachable datarate presented in the previous section.Other parameters can be freely choosen, such as fragmentationlength (2346 Bytes) or RTS Threshold (2347 Bytes).
A TCP connection between an access point and a USBdongle was implemented using the Iperf software [5], asshown in Figure 3. This software enables us to record theeffective throughput, sometimes referred to as “goodput”.
The 14th International Symposium on Wireless Personal Multimedia Communications (WPMC'11),
132
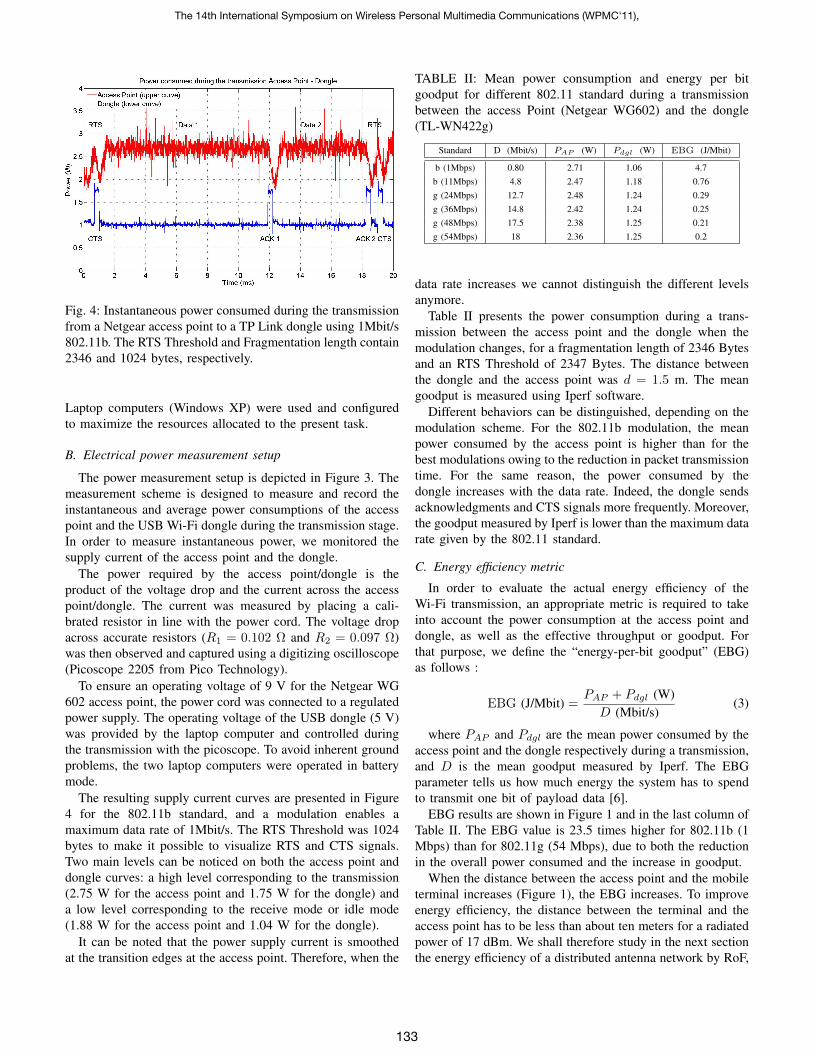
Fig. 4: Instantaneous power consumed during the transmissionfrom a Netgear access point to a TP Link dongle using 1Mbit/s802.11b. The RTS Threshold and Fragmentation length contain2346 and 1024 bytes, respectively.
Laptop computers (Windows XP) were used and configuredto maximize the resources allocated to the present task.
B. Electrical power measurement setup
The power measurement setup is depicted in Figure 3. Themeasurement scheme is designed to measure and record theinstantaneous and average power consumptions of the accesspoint and the USB Wi-Fi dongle during the transmission stage.In order to measure instantaneous power, we monitored thesupply current of the access point and the dongle.
The power required by the access point/dongle is theproduct of the voltage drop and the current across the accesspoint/dongle. The current was measured by placing a cali-brated resistor in line with the power cord. The voltage dropacross accurate resistors (R1 = 0.102 Ω and R2 = 0.097 Ω)was then observed and captured using a digitizing oscilloscope(Picoscope 2205 from Pico Technology).
To ensure an operating voltage of 9 V for the Netgear WG602 access point, the power cord was connected to a regulatedpower supply. The operating voltage of the USB dongle (5 V)was provided by the laptop computer and controlled duringthe transmission with the picoscope. To avoid inherent groundproblems, the two laptop computers were operated in batterymode.
The resulting supply current curves are presented in Figure4 for the 802.11b standard, and a modulation enables amaximum data rate of 1Mbit/s. The RTS Threshold was 1024bytes to make it possible to visualize RTS and CTS signals.Two main levels can be noticed on both the access point anddongle curves: a high level corresponding to the transmission(2.75 W for the access point and 1.75 W for the dongle) anda low level corresponding to the receive mode or idle mode(1.88 W for the access point and 1.04 W for the dongle).
It can be noted that the power supply current is smoothedat the transition edges at the access point. Therefore, when the
TABLE II: Mean power consumption and energy per bitgoodput for different 802.11 standard during a transmissionbetween the access Point (Netgear WG602) and the dongle(TL-WN422g)
Standard D (Mbit/s) PAP (W) Pdgl (W) EBG (J/Mbit)
b (1Mbps) 0.80 2.71 1.06 4.7b (11Mbps) 4.8 2.47 1.18 0.76g (24Mbps) 12.7 2.48 1.24 0.29g (36Mbps) 14.8 2.42 1.24 0.25g (48Mbps) 17.5 2.38 1.25 0.21g (54Mbps) 18 2.36 1.25 0.2
data rate increases we cannot distinguish the different levelsanymore.
Table II presents the power consumption during a trans-mission between the access point and the dongle when themodulation changes, for a fragmentation length of 2346 Bytesand an RTS Threshold of 2347 Bytes. The distance betweenthe dongle and the access point was d = 1.5 m. The meangoodput is measured using Iperf software.
Different behaviors can be distinguished, depending on themodulation scheme. For the 802.11b modulation, the meanpower consumed by the access point is higher than for thebest modulations owing to the reduction in packet transmissiontime. For the same reason, the power consumed by thedongle increases with the data rate. Indeed, the dongle sendsacknowledgments and CTS signals more frequently. Moreover,the goodput measured by Iperf is lower than the maximum datarate given by the 802.11 standard.
C. Energy efficiency metric
In order to evaluate the actual energy efficiency of theWi-Fi transmission, an appropriate metric is required to takeinto account the power consumption at the access point anddongle, as well as the effective throughput or goodput. Forthat purpose, we define the “energy-per-bit goodput” (EBG)as follows :
EBG (J/Mbit) =PAP + Pdgl (W)D (Mbit/s)
(3)
where PAP and Pdgl are the mean power consumed by theaccess point and the dongle respectively during a transmission,and D is the mean goodput measured by Iperf. The EBGparameter tells us how much energy the system has to spendto transmit one bit of payload data [6].
EBG results are shown in Figure 1 and in the last column ofTable II. The EBG value is 23.5 times higher for 802.11b (1Mbps) than for 802.11g (54 Mbps), due to both the reductionin the overall power consumed and the increase in goodput.
When the distance between the access point and the mobileterminal increases (Figure 1), the EBG increases. To improveenergy efficiency, the distance between the terminal and theaccess point has to be less than about ten meters for a radiatedpower of 17 dBm. We shall therefore study in the next sectionthe energy efficiency of a distributed antenna network by RoF,
The 14th International Symposium on Wireless Personal Multimedia Communications (WPMC'11),
133
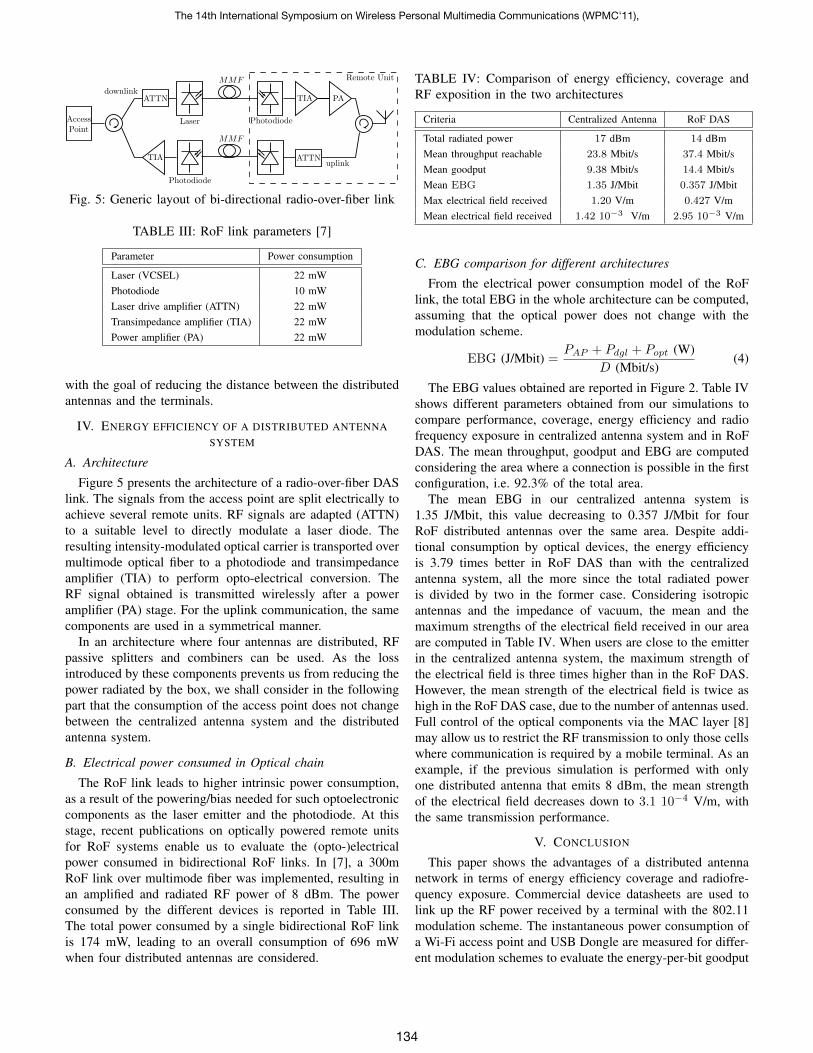
Fig. 5: Generic layout of bi-directional radio-over-fiber link
TABLE III: RoF link parameters [7]
Parameter Power consumption
Laser (VCSEL) 22 mWPhotodiode 10 mWLaser drive amplifier (ATTN) 22 mWTransimpedance amplifier (TIA) 22 mWPower amplifier (PA) 22 mW
with the goal of reducing the distance between the distributedantennas and the terminals.
IV. ENERGY EFFICIENCY OF A DISTRIBUTED ANTENNASYSTEM
A. Architecture
Figure 5 presents the architecture of a radio-over-fiber DASlink. The signals from the access point are split electrically toachieve several remote units. RF signals are adapted (ATTN)to a suitable level to directly modulate a laser diode. Theresulting intensity-modulated optical carrier is transported overmultimode optical fiber to a photodiode and transimpedanceamplifier (TIA) to perform opto-electrical conversion. TheRF signal obtained is transmitted wirelessly after a poweramplifier (PA) stage. For the uplink communication, the samecomponents are used in a symmetrical manner.
In an architecture where four antennas are distributed, RFpassive splitters and combiners can be used. As the lossintroduced by these components prevents us from reducing thepower radiated by the box, we shall consider in the followingpart that the consumption of the access point does not changebetween the centralized antenna system and the distributedantenna system.
B. Electrical power consumed in Optical chain
The RoF link leads to higher intrinsic power consumption,as a result of the powering/bias needed for such optoelectroniccomponents as the laser emitter and the photodiode. At thisstage, recent publications on optically powered remote unitsfor RoF systems enable us to evaluate the (opto-)electricalpower consumed in bidirectional RoF links. In [7], a 300mRoF link over multimode fiber was implemented, resulting inan amplified and radiated RF power of 8 dBm. The powerconsumed by the different devices is reported in Table III.The total power consumed by a single bidirectional RoF linkis 174 mW, leading to an overall consumption of 696 mWwhen four distributed antennas are considered.
TABLE IV: Comparison of energy efficiency, coverage andRF exposition in the two architectures
Criteria Centralized Antenna RoF DAS
Total radiated power 17 dBm 14 dBmMean throughput reachable 23.8 Mbit/s 37.4 Mbit/sMean goodput 9.38 Mbit/s 14.4 Mbit/sMean EBG 1.35 J/Mbit 0.357 J/MbitMax electrical field received 1.20 V/m 0.427 V/mMean electrical field received 1.42 10−3 V/m 2.95 10−3 V/m
C. EBG comparison for different architectures
From the electrical power consumption model of the RoFlink, the total EBG in the whole architecture can be computed,assuming that the optical power does not change with themodulation scheme.
EBG (J/Mbit) =PAP + Pdgl + Popt (W)
D (Mbit/s)(4)
The EBG values obtained are reported in Figure 2. Table IVshows different parameters obtained from our simulations tocompare performance, coverage, energy efficiency and radiofrequency exposure in centralized antenna system and in RoFDAS. The mean throughput, goodput and EBG are computedconsidering the area where a connection is possible in the firstconfiguration, i.e. 92.3% of the total area.
The mean EBG in our centralized antenna system is1.35 J/Mbit, this value decreasing to 0.357 J/Mbit for fourRoF distributed antennas over the same area. Despite addi-tional consumption by optical devices, the energy efficiencyis 3.79 times better in RoF DAS than with the centralizedantenna system, all the more since the total radiated poweris divided by two in the former case. Considering isotropicantennas and the impedance of vacuum, the mean and themaximum strengths of the electrical field received in our areaare computed in Table IV. When users are close to the emitterin the centralized antenna system, the maximum strength ofthe electrical field is three times higher than in the RoF DAS.However, the mean strength of the electrical field is twice ashigh in the RoF DAS case, due to the number of antennas used.Full control of the optical components via the MAC layer [8]may allow us to restrict the RF transmission to only those cellswhere communication is required by a mobile terminal. As anexample, if the previous simulation is performed with onlyone distributed antenna that emits 8 dBm, the mean strengthof the electrical field decreases down to 3.1 10−4 V/m, withthe same transmission performance.
V. CONCLUSION
This paper shows the advantages of a distributed antennanetwork in terms of energy efficiency coverage and radiofre-quency exposure. Commercial device datasheets are used tolink up the RF power received by a terminal with the 802.11modulation scheme. The instantaneous power consumption ofa Wi-Fi access point and USB Dongle are measured for differ-ent modulation schemes to evaluate the energy-per-bit goodput
The 14th International Symposium on Wireless Personal Multimedia Communications (WPMC'11),
134
as a function of the distance between the access point and adongle. Simulations show that a distributed system with fourantennas is 3.8 times more energy-efficient than a centralizedantenna system, while the total radiated power is divided by afactor of two. However, it could be interesting to investigatethe influence of the environment topography (e.g., the powerdecay index n) on the energy efficiency. Moreover, the numberof remote antennas and the corresponding radiated power haveto be investigated with the knowledge of a topography.
Additional improvement in energy efficiency and RF ex-posure of DAS may be expected thanks to full control ofthe optical components via the MAC layer [8]. With thiskind of architecture, the RF power is only radiated on thespot(s) where and when some communications are required inthe presence of mobile terminals. Further increase in energyefficiency can be achieved by switching off the access pointand wake it up in the absence of communication request in thearea [9]. Finally, even if RoF DAS have better performance interms of coverage and energy efficiency, the ultimate objectivewould be to evaluate the impacts on the overall carbonfootprint of the additional (optical) components added in thenetwork. This point is currently being studied and will beshortly submitted for publication.
ACKNOWLEDGMENTS
The authors wish to thank Bernard Della for his supportin the experimental setup, Camilla Karnfelt for her help inthe RF power measurements and Frederic Lucarz for fruitfuldiscussion, within the framework of the CapilRTM platformspecializing in radio over fiber technologies.
REFERENCES
[1] M. Sauer, A. Kobyakov, and J. George, “Radio over fiber for picocellularnetwork architectures,” Lightwave Technology, Journal of, vol. 25, no. 11,pp. 3301–3320, Nov. 2007.
[2] T. Rappaport, Wireless Communications Principles an Practice. UpperSaddle River, NJ: Prentice Hall, 1999.
[3] COST 231, “Digital mobile radio towards future generation systems,”European Commission, Brussels, Belgium, Tech. Rep., 1999.
[4] “WG302 data sheet.” [Online]. Available: http://kbserver.netgear.com/datasheets/WG302 ds 28April05.pdf
[5] “Iperf software.” [Online]. Available: http://iperf.sourceforge.net/%http://dast.nlanr.net
[6] J. Ebert, B. Burns, and A. Wolisz, “A trace-based approach for determin-ing the energy consumption of a wlan network interface,” in In Proc. ofEuropean wireless, Florence, Italy 2002.
[7] D. Wake, A. Nkansah, N. Gomes, C. Lethien, C. Sion, and J.-P. Vilcot,“Optically powered remote units for radio-over-fiber systems,” LightwaveTechnology, Journal of, vol. 26, no. 15, pp. 2484–2491, Aug.1, 2008.
[8] J. Guillory, S. Meyer, I. Siaud, A. Ulmer-moll, B. Charbonnier, A. Pizzi-nat, and C. Algani, “Radio-over-fiber architectures,” Vehicular TechnologyMagazine, IEEE, vol. 5, no. 3, pp. 30 –38, 2010.
[9] I. Haratcherev, C. Balageas, and M. Fiorito, “Low consumption homefemto base stations,” in Personal, Indoor and Mobile Radio Communica-tions, 2009 IEEE 20th International Symposium on, 2009, pp. 1 –5.
The 14th International Symposium on Wireless Personal Multimedia Communications (WPMC'11),
135