modeling and money: the two do mix tair february 1, 2006
TRANSCRIPT

Modeling and Money:The Two DO Mix
TAIRFebruary 1, 2006

Baylor UniversityLocated in Waco TexasAffiliated with Baptist General
Convention of TexasBachelors/Masters/Doctoral degreesSeminary Mdiv and DminLawFall Enrollment approximately 14,000

Nuggets
— Herb Edelstein
“If you’ve got terabytes of data, and
you’re relying on
data mining to find
interesting things
in there for you,
you’ve lost before
you’ve even begun.”

Predictive Modeling at BU
Enrollment ManagementInquiry to Net Deposit Accept to Enroll– Applications of model
• Moving from one stage to another• Classification of students-new freshmen,
new transfers, graduate, etc.• Texas and non-Texas students

Enrollment Management Stages
Inquiry AppliedAcceptedDepositNet DepositEnrollRetentionGraduation
Student Retention– Applications --
• Fall to Spring Retention• Fall to Fall Retention• Enroll to Graduation

Donor Management– Annual Gift– Major Donor– Planned Gift – Retention/Upgrade– New Donors
Business Questions How can we identify potential major
donors? How can we predict propensity of a
donor to make an annual gift? How can we identify potential
planned giving donors? How can we identify current donors
that can move to next level of giving?
How can we identify non-donor constituents with characteristics of a donor?
How can we predict expected value of a gift?

Required Expertise
– Domain
– Data
– Analytical Methods

Project TeamRepresentatives from University
DevelopmentRepresentatives from Institutional
ResearchSAS Consultants
Process/Steps Explore Development data Build datasets for descriptive models Validate datasets Create profiles for analysis Build datasets for predictive modeling/mining Mine the data Create predictive models Apply the models Test the models

Data ExplorationNew database for IR
–Learn and learn more!–Edit reports and data cleansing

ProfilesDonorNon-donorAlumnae donorHispanic donorAfrican-American donor
– More data cleansing!

Indicator Score
Creation of indicator variables with yes/no (1/0) values For Single households
-- 18 indicators For Two-person households
-- 25 indicators (7 indicators could be duplicated)

Indicator Variables DOB_50_ind – over 50 years of age? Married-Widowed_ind - married or
widowed? Children_ind – any info on children? Alumni_ind – an alumni? Contact_ind – any contact info for
donor? Executive_ind – executive job code?
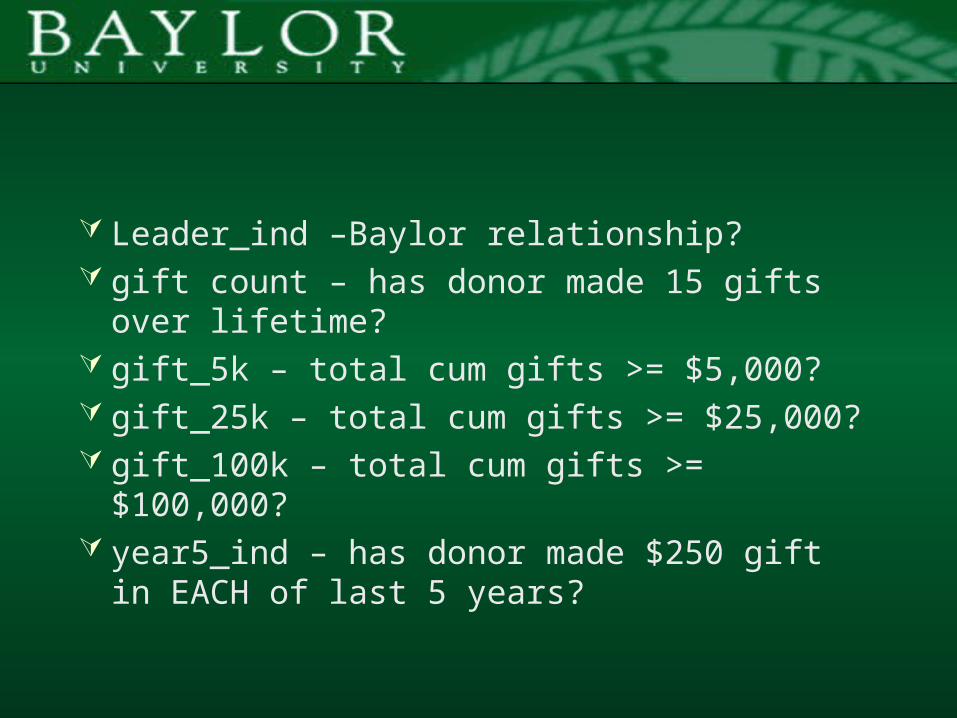
Leader_ind –Baylor relationship? gift count – has donor made 15 gifts over
lifetime? gift_5k – total cum gifts >= $5,000? gift_25k – total cum gifts >= $25,000? gift_100k – total cum gifts >= $100,000? year5_ind – has donor made $250 gift in
EACH of last 5 years?

year2_ind – has donor made ANY gift in EITHER of last 2 years?
Rating_ind – does donor have Echelon rating?
Athletic_gift_ind – has donor made gift to Athletic Department?
Alumn_assoc_ind – has donor made gift to Alumni Association?
Spouse_alum_ind - is spouse coded an alum?

Indicator Score Distribution

Average Cumulative Gift

Donor Household Profile
64,000+ Households72% One donor in household50% Alumni60% Males57% Married19% indicate Baptist religion58% indicate Texas residences

Non-Donor Household Profile
77,000+ HouseholdsMost data fields have a large
percent of missing values

Donor Model for 2004
Use donors for previous 10 years Create target variable Identify predictor variablesBuild modelApply to 2005 donors

Categories of PredictorsBiographical/demographic - 20Contact information - 12Degree data – 9Activities - 15Gift information - 31External rating information - 5Research data - 4
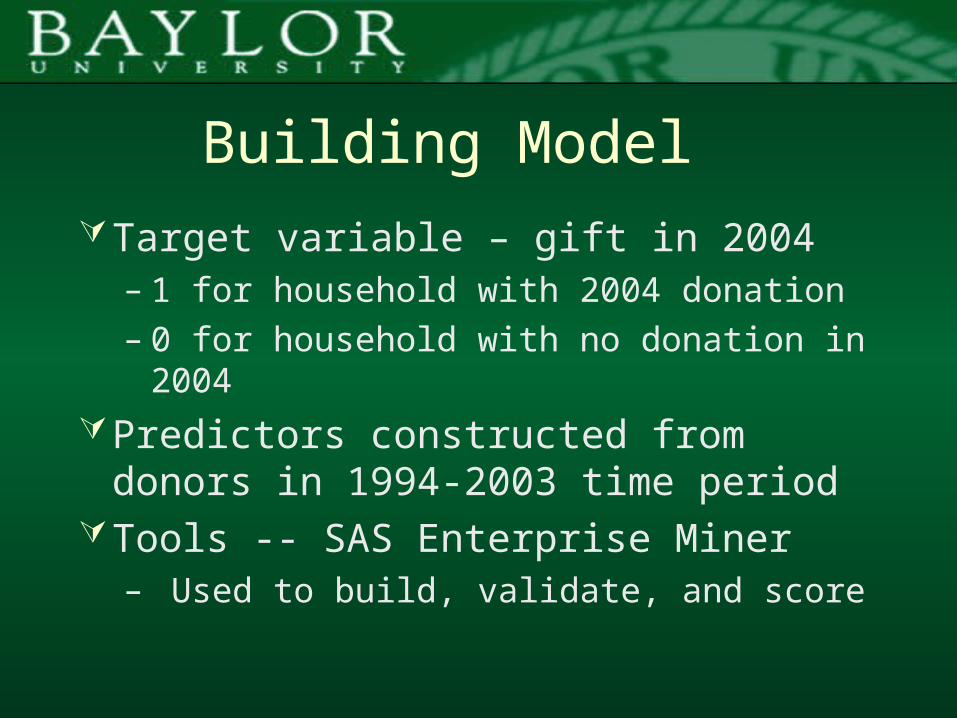
Building ModelTarget variable – gift in 2004
– 1 for household with 2004 donation– 0 for household with no donation in
2004Predictors constructed from donors
in 1994-2003 time period Tools -- SAS Enterprise Miner
– Used to build, validate, and score


ROC Model Comparison

Lift Chart

Distribution of Scores

Model ComparisonsROC curves and Lift charts indicate
all models are performing wellMisclassification rates for the
models are all close to 16%Very little difference between
average profit for the modelsLogistic regression was chosen as
the model to employ

Model ApplicationAnalyze 2004 donors at the end of
June 2005Determine those who have not
made a donationUse probability scores to target
those most likely to make a gift

Future WorkApplication of general model
– Annual gifts– Major gifts– Planned gifts
Non-donor modelGift amount modelLife time value model

Thanks!
Questions or Comments