modeling contagious merger and acquisition via point ... · (61527804, 61221001, 61129001), the 111...
TRANSCRIPT

Junchi Yan13⇤, Shuai Xiao2, Changsheng Li3, Bo Jin1
Xiangfeng Wang1, Bin Ke4, Xiaokang Yang2, Hongyuan Zha1
1East China Normal University, 2Shanghai Jiao Tong University3IBM Research - China, 4National University of Singapore
{jcyan,bjin,xfwang,zha}@sei.ecnu.edu.cn, {benjaminforever,xkyang}@[email protected], [email protected]
AbstractMerger and Acquisition (M&A) has been a criti-cal practice about corporate restructuring. Previousstudies are mostly devoted to evaluating the suit-ability of M&A between a pair of investor and tar-get company, or a target company for its propen-sity of being acquired. This paper focuses on thedual problem of predicting an investor’s prospec-tive M&A based on its activities and firmograph-ics. We propose to use a mutually-exciting pointprocess with a regression prior to quantify the in-vestor’s M&A behavior. Our model is motivatedby the so-called contagious ‘wave-like’ M&A phe-nomenon, which has been well-recognized by theeconomics and management communities. A tai-lored model learning algorithm is devised that in-corporates both static profile covariates and pastM&A activities. Results on CrunchBase suggestthe superiority of our model. The collected datasetand code will be released together with the paper.
1 IntroductionPredicting investor’s M&A Merger and Acquisition (M&A)has become a popular business practice1, allowing firms toinstantly acquire new competencies by different dimensionssuch as brand, channel, technology. M&A has become amajor vehicle for company growth since the 1980s [Veryet al., 2012]. They can help optimize the market structureand increase market power, obtain tax advantage, generateeconomies of scale and other synergies, or serve managerialambitions [Gugler and Konrad, 2002].
Predicting an investor’s prospective M&A in an arbitraryfuture time point/period is challenging and of particular in-terest to both company executives and market institutions.Anticipating mergers and acquisitions (M&A) helps execu-tives and investors to design their firms strategies and decide
⇤Corresponding author. The work is supported by STCSM(15JC1401700, 14XD1402100), NIH/NSF R01 GM108341, NSFC(61527804, 61221001, 61129001), the 111 Program (B07022). Thefirst two authors contribute equally to this work.
1The distinction between ‘merger’ and ‘acquisition’ has becomeblurred. The paper uses M&A and acquisition interchangeably.
on their investments. Variations in M&A activity have beenfound to influence the value created by acquirers. For in-stance, M&A activity is characterized by periods of waves[Resende, 2008] and acquirers market value statistically in-creases more significantly for the early movers in a wave.This is why M&A activity forecasts are especially importantfor many economic stakeholders: prospective M&As help na-tional and international institutions to anticipate Foreign Di-rect Investment flows, investors can track periods of intenseM&A activity in order to acquire shares in future M&A tar-gets. Executives can anticipate movements in the industry.Limitation of classification methods Despite its imperativebusiness value and scientific interest, modeling and predict-ing M&A for an individual investor is rarely studied. [Pa-siouras and Gaganis, 2007] build supervised binary classi-fication models by employing static profiles, and some ag-gregated statistical indicators about past activities e.g. totalnumber of events, frequency as features for M&A prediction.
Such classification approaches simplify the problem andsuffer limitations: they truncate the observation window toan ad-hoc period which induces the label for training set. Infact they are inherently not a behaviorial model, and unableto flexibly capture the dynamics of past M&A events nor theprospective events in continuous time space.The contagious wave-like M&A phenomenon Differentfrom classification/regression models, our point processbased method is tailored to a long-standing and well-knownphenomenon (to corporate finance and management) – M&Aactivities tend to spread across both intra-industry and inter-industry contagiously [Oberg and Holtstrom, 2006] forcedby various spontaneous and extraneous drivers, e.g. see[Mitchell and Mulherin, 1996; Mariana, 2012], which inmacro exhibits the temporal clustering pattern [Maksimovicet al., 2013] or in a more expressive term: ‘waves’ [Brealey,2012]. For instance, in [Oberg and Holtstrom, 2006], the au-thors empirically confirmed that ‘Following an initial M&A,the M&A pendulum swings back and forth between the cus-tomers and suppliers’. In fact, since the 1890s there are 6major M&A waves. Our initial inspection to the acquisitionrecords from CrunchBase also verifies this hypothesis as il-lustrated in Fig.1. Such a contagious nature of M&A activi-ties, to some extent, analogously relates to the viral diffusionin epidemiology, social science and many other disciplines.Key idea and contributions To model the above contagious
Proceedings of the Twenty-Fifth International Joint Conference on Artificial Intelligence (IJCAI-16)
Modeling Contagious Merger and Acquisition viaPoint Processes with a Profile Regression Prior
2690

Figure 1: Wave-like contagious M&A exists in both company and industry level. It can be modeled by a Hawkes process.
and wave-like phenomenon, we utilize Hawkes processes[Hawkes, 1971], a special class of point processes, whose in-tensity function implies how likely an event will happen ateach timeframe. The intensity function of Hawkes comprisesof a spontaneous intensity and a positive influence of the pastevents on the current one. Such a positive influence is orig-inated from the self/mutually-exciting property that the oc-currence of a past event raises the probability of events hap-pening in future. We find that the Hawkes’s self/mutually-exciting property coincides with the fact that investors’ M&Ainfluences each other, and occur in a cascading fashion.
There are three contributions of our work:i) To our best knowledge, it is the first time to adopt a point
process framework for M&A events modeling and prediction,and the profile covariates is incorporated by a regression prioron the background rate of the intensity function.
Specifically, it is the first time, to the best of our knowl-edge, for adapting a mutually-exciting point process to modelthe contagious ‘wave-like’ phenomenon of M&A, thoughthis phenomenon has been a well-established stylized fact toeconomist/management community for a long time.
ii) We propose a learning algorithm for our regression priorbased point process model by Lagrangian relaxation.
iii) We verify our model on a recent real-world dataset ofCrunchBase, which we believe is of particular interest to bothpolicy-makers and market players, especially considering weare in the era that the high-tech industry is booming, and dis-ruptive technologies and new business models are emerging.
2 Related WorkEmpirical study News medium often issue M&A activitypredictions: consulting firms (McKinsey, PWC, or KPMG),investment banks (Goldman Sacks, Morgan Stanley), andinstitutions regularly put forward their own forecasts aboutM&A numbers, the value of the M&A market, or foreign di-rect investments through acquisitions. This is often done byinterviewing a few experts or top executives who give theiropinion about the future [Oberg and Holtstrom, 2006].Algorithmic methods and problem categories By the appli-cation scenario, existing algorithmic methods can be catego-rized into three contexts: i) [Hamilton, 1989; Resende, 2008]forecast the M&A at aggregated country/industry level basedon macroeconomic variables e.g. GDP, money supply, stockmarket growth. A predictive model such as Kalman filter isapplied [Very et al., 2012]; ii) measure the suitability betweena specific bidder company and a target one [Weber and Dho-lakia, 2000; Gugler and Konrad, 2002; Song and Chu, 2006;Pasiouras and Gaganis, 2007], whereby financial and man-agerial variables are often exploited by a classification model;
iii) estimate the possibility of a target company being ac-quired [Slowinski et al., 1997; Ragothaman et al., 2003;Ali-Yrkko et al., 2005; Pasiouras and Gaganis, 2007; Xi-ang et al., 2012]. The business motivation is that a targetcompany with higher chance of being acquired is often morevaluable to potential investors. Logistic Regression is widelyadopted to build the prediction model [Ali-Yrkko et al., 2005;Pasiouras and Gaganis, 2007].Predicting investor’s M&A Compared with the above threecategories of prediction problems, directly predicting indi-vidual investors’ M&A event is less studied. There are fewmethods [Ragothaman et al., 2003] addressing this problemwhile they use Logistic regression similar to the target com-pany classification problem [Xiang et al., 2012]. In contrast,point process formulation can naturally incorporate M&A’stimestamp. The fact that M&As are often in the wave formswhich motivates to design a tailored point process model.Hawkes processes This point process is originated from[Hawkes, 1971; Hawkes and Oakes, 1974]. It is a one-dimensional self-exciting point process modeling the eventsequences that exhibit temporal clustering patterns over time.Its main characteristics is the modeling of chain relation ef-fects, the occurrence of one event triggers that of another.The early application of Hawkes process model [Ogata, 1988;1998] refers to model the occurrences of earthquakes.
There are also multi-dimensional i.e. mutually-excitingHawkes process variants where the triggering effect of dif-ferent types of events are considered. The mutually-excitingHawkes process has been widely used to model social behav-iors on networks [Blundell et al., 2012; Zhou et al., 2013a].There is no work on modeling M&A by Hawkes processes,though the wave-like phenomenon for M&A can be a goodtestbed for extending the boundary of Hakes processes.Contagious wave-like M&A Starting with Nelson [Nelson,1959], a long line of empirical research has shown that mergeractivities tend to cluster in time and the events cascade con-tagiously. [Harford, 2005; Resende, 2008] study the underly-ing drivers for the ‘wave’ phenomenon and reach a consen-sus about its existence across different countries and indus-tries. There are two main explanations by these works: theneoclassical hypothesis ascribes the clustering waves to tech-nology or regulatory shocks [Jovanovic and Rousseau, 2001;2002]. The other behavioral hypothesis [Shleifer and Vishny,2003] posits the temporal clustering of M&A activity isdriven by stock market valuations. Bull markets lead groupsof bidders with overvalued stock to use it to buy real assetsof undervalued targets through M&A. The competition be-tween the bidders further exaggerates the temporal clusteringphenomenon of M&A waves. They also find company whois undertaking strategy transition, tend to repeatedly conduct
2691

M&A in a short time window. [Hou et al., 2015] take theM&A activity from a complex network perspective, and statethat the cascading-failure phenomenon is due to the break-down of one or more nodes or edges may lead to the failureof others via their coupling mechanisms.CrunchBase It has become a popular data source as itmaintains abundant information about M&A and investmentsmostly for North America (https://www.crunchbase.com/).[Eugene and Yuan, 2012] perform prescriptive data mining onthe CrunchBase and uncover several general rules for compa-nies seeking investment. The similar acquisition target iden-tification problem is studied in [Wei et al., 2009], where tech-nological variables derived from patent analysis and profilesof investor and candidate target company are used for an en-semble classification model. [Xiang et al., 2012] find that thefactual and topic features using profiles and news articles onCrunchBase are also indicative and more readily accessiblethan the social relation data used in [Eugene and Yuan, 2012;2013]. They define the M&A prediction problem by clas-sifying the candidate companies into M&A target and non-targets, rather than a point process method and irrelevant tothe investor. On the contrary, this paper predicts a specificinvestor’s future M&A and adopt a point process.
3 Wave-like contagious M&A modeling3.1 Brief on Hawkes processesPoint process and its intensity function Point processes arewidely used to model the occurrences of events. In general,a point process is an event sequence {e1, . . . , en} with times-tamp T = {t1, . . . , tn}. Denote N(t) the number of occurredevents before t, and H
t
= {ei
|ti
< t} as the past events be-fore t. The main concept of point process is the conditionalintensity function, or intensity function for short, is given by:
�(t) = lim
�t!0
E(N(t+�t)�N(t)|Ht
)
�t=
E(dN(t)|Ht
)
dt
where E(dN(t)|Ht
) is the expectation of the number ofevents happened in the interval[t, t + �t] given the histori-cal observations H
t
. The conditional intensity function rep-resents the expected instantaneous rate of events at time t.Hawkes processes For a self-exciting Hawkes point process,its conditional intensity is written by [Hawkes, 1971]:
�(t) = µ+ aX
i:ti<t
g(t� ti
),
where µ is the spontaneous intensity and t
i
the timestamp ofevent e
i
in the process before time t. g(t) models the excitingeffect from the previous events. One general joint likelihoodof observing a sequence of events T = {t1, . . . , tn} withinthe time window [0, T ], can be given as follows:
L(T ) =
Y
ti2T
�(ti
) · exp ��Z
T
0
�(⌧)d⌧�,
3.2 Problem formulationWe formulate the M&A activities as an inhomogeneous Pois-son process with the intensity as the sum of a spontaneousintensity modulated by firms’ profiles and a exciting term re-lated to its past activities and influence from other firms.
Maximum-likelihood estimation In the presence of multi-ple investors, we want to capture not only the self-excitationof behaviors but also the interaction over investors. The in-tensity of M&A for an investor d is thus given by:
�d
(t) = µd
+
X
i:ti<t
addigddi(t� t
i
), (1)
where the spontaneous term µ
d
incorporates the inherent ten-dency of an investor – active investor making more invest-ments benchmarked by a setting without external excitement.a
ddi measures the influence from dimension d
i
to d. Specifi-cally for M&A, d
i
to d refer to two investors and a
ddi quan-tifies the impact from investor d
i
’s M&A event to the otherinvestor d’s. The impact is controlled by the decay func-tion g
ddi whose input usually is the time interval from pre-vious event timestamp t
i
to current time t. An exponentialtime-decaying function is used in the paper: g
ij
(t
i
� t
j
) =
w · e�w(ti�tj) for its wide popularity and efficacy.Then for a M&A event sequence T = {(t
i
, d
i
)}ni=1 of time
t
i
associated with investor di
, the log-likelihood is:
Lcond
=
DX
d=1
⇢ X
(ti,di)2T |di=d)
log �di(ti)�
ZT
0
�d
(t)dt
�,
By plugging Eq. 1, we obtain the following objective func-tion [Liniger, 2009] where G
ddj (t) =
Rt
0 g
ddj (t)dt.
Lcond
=
nX
i=1
log
✓µdi +
X
tj<ti
adidjgdidj (ti � t
j
)
◆(2)
�TDX
d=1
µd
�DX
d=1
nX
j=1
addjGddj (T � t
j
)
Gaussian prior on spontaneous term So far, at the firstglance, the multivariate Hawkes Process seems able to modelself and mutual interactions among investors. However, directapplication to M&A prediction will incur two major issues.First, the model only takes past events into consideration andneglects the intrinsic characteristic for an individual investorthat can affect the M&A action. Second, assigning each com-pany or investor a customized spontaneous term brings theburden of massive parameters to learn and higher risk of over-fitting. However, it is also unrealistic to enforce all investorsto share one common parameter µ
d
. It is appealing to pa-rameterize the spontaneous term µ
d
via the profile covariatesassociated with a company e.g. company size, financial assetsetc. Involving such covariates will also increase the model’sinterpretability and help identify the influential factors.
Without loss of generality, here we concretely use a Lo-gistic regression function by {�/ �1 + exp(�✓
T xd)�}D
d=1 tomodel the spontaneous intensity term for each investor d
where xd = [1, x
d
1, xd
2, . . . , xd
K
]
T concatenate the attributesas summarized in Table 2 and topic features in Table 1. Ac-cordingly, ✓ = [✓0, ✓1, . . . , ✓K ]
T are the coefficients, and �
is a scaling factor. Rather than µ
d
, ✓ and � are the modelparameters needing to be learned from the data.
We adopt a probabilistic view on spontaneous term: aGaussian prior µ
d
s N (�/
�1 + exp(�✓
T xd�,
12p⇢
) for theregression value is used, which is mathematically equivalent
2692

Algorithm 1 Profile-specific Multi-dimensional HawkesProcess (PMHP) learning for M&A modeling
1: Input: M&A event sequence {ti
, d
i
}ni=1 associated with
time t
i
and investor i.e. dimension d
i
for each event;Profile xd = [x1, . . . , xK
]
T for an investor d;2: Initialization for {�, ⇢}, {✓
k
}Ki=0, {µd
}Dd=1, {auv}Du,v=1;
3: while Not converge or l < L do4: Update {p(l+1)
ii
} and {p(l+1)ij
} by Eq.5 and Eq.6;5: Update {µ(l+1)
d
}Dd=1, {a(l+1)
ij
}Di,j=1by Eq.7, Eq.8;
6: Update {�(l+1), ⇢
(l+1)} by Eq.10, Eq.11;7: Update {✓(l+1)
k
}Ki=0 by gradient descent in Eq.12;
8: end while
to measure the deviation by:�µ
d
� �/
�1 + exp(�✓
T xd
)
��2.Its log-likelihood for dimension d is L
pri
=
�⇢
2
�µ
d
� �/
�1 + exp(�✓
T xd)��2
+
12 log(⇢).
By incorporating both the conditional and prior terms asdiscussed above, the overall posterior maximum-likelihoodestimation problem can be written by L(⇥,�, ✓) = L
cond
+
Lpri
, ⇥ = {µ, a} is introduced for convenience:
Lcond
=
nX
i=1
log
✓µdi +
X
tj<ti
adidjgdidj (ti � t
j
)
◆(3)
� TDX
d=1
µd
�DX
d=1
nX
j=1
addjGddj (T � t
j
)
Lpri
=� ⇢2
DX
d=1
����µd
� �1 + exp(�✓T xd
)
����2
2
+
D2
log(⇢)
Given the learned model parameters, the prediction scores
d
for an investor d who might have M&A in a certain fu-ture time [T, T +4T ] is given by firstly simulating �
d
(t) ofHawkes process [Dassios and Zhao, 2013] on time interval[T, T +4T ] and then calculating the conditional cumulativedistribution by integrating the intensity function.
3.3 Learning Algorithm
To efficiently solve the resulting optimization problem, wedesign an algorithm which combines techniques of alter-nating optimization and Majorize-Minimization algorithm[Hunter and Lange, 2004] to maximize L(⇥,�, ✓). The opti-mization task is summarized in Algorithm 1. We provide thealgorithm step-by-step details as follows.
Finding the lower bound as surrogate
Since we consider an exciting reciprocal affection insteadof an inhibiting one, thus the coefficients shall be nonneg-ative a
ij
� 0. This important property leads to a re-sult that L(⇥,�, ✓) can be surrogated by its lower bound
L(⇥|⇥(l),�, ✓) via Jensen’s inequality:
L =
nX
i=1
�pii
log
µdi
pii
+
i�1X
j=1
pij
log
adidjgdidj (ti � t
j
)
pij
�
| {z }part of lower bound by Jensen’s inequality
(4)
�DX
d=1
Tµd
�DX
d=1
nX
j=1
addjGddj (T � t
j
) + Lpri
| {z }part in original form
where p
ii
, pij
are defined as follows in the l+ 1-th iteration,which involves variables in ⇥ in the l-th iteration:
p(l+1)ii
=
µ(l)di
µ(l)di
+
Pi�1j=1 a
(l)didj
gdidj (ti � t
j
)
(5)
p(l+1)ij
=
a(l)didj
gdidj (ti � t
j
)
µ(l)di
+
Pi�1j=1 a
(l)didj
gdidj (ti � t
j
)
(6)
p
ij
can be interpreted as the likelihood that the i-th M&A(d
i
, t
i
) is affected by the previous j-th one (dj
, t
j
). pii
is theprobability that i-th event is affected by the spontaneous term.
To verify the feasibility of using the above surrogate func-tion, one can find the equation holds if and if only: ⇥ = ⇥
(l)
since p
ii
and p
ij
are a function w.r.t. ⇥(l) in the l+ 1th itera-tion. As a result, we have the following relation:
L(⇥,�, ✓) � L(⇥|⇥(l),�, ✓)
L(⇥(l),�(l), ✓(l)) = L(⇥(l)|⇥(l),�(l), ✓(l))
Moreover, since the variables �, ✓ are separable from L, L,we can use the following relation without involving �, ✓:
L(⇥(l)) = L(⇥(l)|(⇥(l)
) � L(⇥(l+1)|(⇥(l)) � L(⇥(l+1)
)
This implies maximizing L at each iteration ensures that thevalue of L increase monotonically.
Solving µ, a by fixing profile parameters �, ✓The advantage of using the surrogate function is that the pa-rameter µ, a
ij
can be solved in closed forms, and the nonneg-ativity constraint of µ, a
ij
is automatically satisfied.Zeroing partial derivatives @L
@µd, { @L
@auv}Du,v=1 leads to:
µd
(l+1)=
�h(xd
) +
qh(xd
)
2+ 4⇢(l)
Pn
i=1,di=u
p(l+1)ii
2⇢(l)(7)
a(l+1)uv
=
Pn
i=1,di=u
Pi�1j=1,dj=v
p(l+1)ijP
n
j=1,dj=v
Guv
(T � tj
)
(8)
where we define h(xd) = T � ⇢
(l) �
(l)
1+exp(�✓
(l)T xd) .
Lpri
=
⇢(l)
�2
DX
d=1
����µ(l+1)d
� �(l)
1 + exp(�✓(l)T xd
)
����2
2
+
D2
log ⇢(l)
(9)
Zeroing derivatives @L@⇢
,
@L@�
leads to:
�(l+1)=
PD
d=1 µ(l+1)dP
D
d=11
1+exp(�✓
(l)T xd)
(10)
⇢(l+1)=
1
D
DX
d=1
⇣µ(l+1)d
� �/⇣1 + exp(�✓(l)T xd
)
⌘⌘2(11)
2693

Table 1: Top words for each topic learned from news articles by LDA: Top 20 words are listed for each topic.
Topic 1 Software services management information security enterprise business data service product cloud technology financial manage application provider support platform system global
Topic 2 Company inc online top acquired united family credit payment e-commerce canada new site acquisition name service small financial travel international
Topic 3 Digital content entertainment video platform consumer time virtual product social create people around buy world use experience leader strategy 3d
Topic 4 Health care company medical treatment pharmaceutical inc development business range services breast include segment used major consumer delivery production clinical
Topic 5 Million global world leading business portfolio new capital technology leader group billion company equity around investment across people private innovative
Table 2: Investor firm profile covariates from CrunchBase.VCI VC, PE investments, IPR investors per round, PFB teammembers with finance background, KFB key person withfinance background, MAY mean of acquisitions/year, VAYvariance acquisition # per year, AMA amount per acquisition.
Covariate Mean Std. Covariate Mean Std.
Investment # 3.8 10.0 Office # 2.31 4.23Acquisition # 11.83 18.2 Team # 21.7 41.0
Board members # 4.8 5.6 VCI # 0.9 1.8Employee # 10M 46M IPR # 1.53 1.08
Amount per round 56M 345M PFB # 0.06 0.2Competitor acquired # 0.38 0.88 News # 91.8 506.0
Competitor # 2.7 5.5 KFB # 1.4 1.9Investor # 1.9 4.6 MAY # 2.04 1.19Product # 3.56 13.90 VAY 1.68 5.46
Funding round # 1.33 2.28 AMA 616M 1630M
We apply gradient ascent to update {✓k
}Kk=1:
@L@✓
k
=⇢DX
d=1
✓µd
� �1 + exp(�✓T xd
)
◆�xd
k
exp(�✓T xd
)
1 + exp(�✓T xd
)
(12)
4 Experiments on CrunchBaseCrunchBase dataset The dataset is TechCrunch’s opendatabase with information about startups, investors, trends,companies etc. The CrunchBase allows public access to itsdata via JSON API, by which we’ve collected a local copyof the data as of May 2015. Our used subset consists of 413companies by two filter criterion: i) the primary role is com-pany; ii) the number of historical M&A is more than 4. Webelieve this preprocessing can help filter out those dormantplayers. In this subset, we note several major brands e.g.IBM, Google, Yahoo, Dell etc, associated with profile tagse.g. company size, funds, news articles – see Table 2.
We also consider news reports as they discuss emergingtechnologies, products, new trends and sometimes acquisi-tion rumors. Previous researches [Xiang et al., 2012] havealso shown that text analysis benefits acquisition prediction.We employ Latent Dirichlet Allocation (LDA) to derive thetopical features and set the number of topics to be 5, resultinga distribution of an underlying set of topics for each company.Table 1 shows the top 20 words in each topic. The final profileinput is a concatenation of profile and topic covariates.
In general, our dataset is comprehensive, free, and up-to-date. In contrast, previous studies e.g. [Pasiouras and Gaga-nis, 2007] use financial data predominantly while [Grinblattand Keloharju, 2000] focuse on investments in Finland only.Compared methods Peer methods are: i) regression models:Linear Regression (LR), Support Vector Machine (SVM) for
Figure 2: AUC and AvP for prediction year for 2010 – 2014.
Regression, Decision Tree (DT), Artificial Neural Network(ANN); ii) point process: Triggering Kernel Learning (TKL)[Zhou et al., 2013b] that models the spontaneous rate with-out profiles. Hence their learning algorithm is also differentfrom ours. Note our method is termed Profile-specific Multi-dimensional Hawkes Process (PMHP) in Fig.3 and Fig.4.Experiments protocol The prediction is performed on arolling basis: We collect all M&A events and company pro-files till year t� 1 to predict the M&A intensity over the nextyear i.e. year t. For point process models, no target supervi-sion is needed and all the data before year t is used to train themodels. While regression models by nature need supervisiontelling the number of M&A events in a forward time window.To predict year t’s M&A, we use the outcome in year t� 1 toset the target variable. Data before year t�1 is used to derivethe input features for regression models. Features used for re-gression models includes all covariates in PMPH plus recentacquisition numbers accounting for recency effect capturedby Hawkes model dynamically. As depicted in Fig.2, t is setto the first day of from 2010 to 2014 respectively.
For the point process models i.e. our methods and TKL,the prediction score for an investor is calculated by the simu-lation method for Hawkes process [Dassios and Zhao, 2013],integrated over the period of the prediction year. While forthe regression models, their output score directly indicatesthe propensity of M&A events in the target year.
Hyper Parameter Setting: PMHP uses one hyper param-eters, the exponential decay kernel parameter w in g(t) =
w exp(�w ⇤ t). For the exponential decay kernel parameterwe tested 0.1, 0.5, 1, 2, 5, 10. After iterations of rigorous ex-periments, we chose 2. The criteria for choosing the optimalvalue was to maximize the model’s likelyhood L
cond
.In line with [Yan et al., 2012; 2013; 2015; Eugene and
Yuan, 2013], we use the area under the Receiver OperatingCharacteristic curve a.k.a. AUC to assess the predictive mod-els. Average precision(AvP) is also adopted to demonstratethe robustness of the proposed model. To compute AUC andAvP, we create the binary label by setting a company instanceas positive if it has at least one M&A in the target year t.
2694
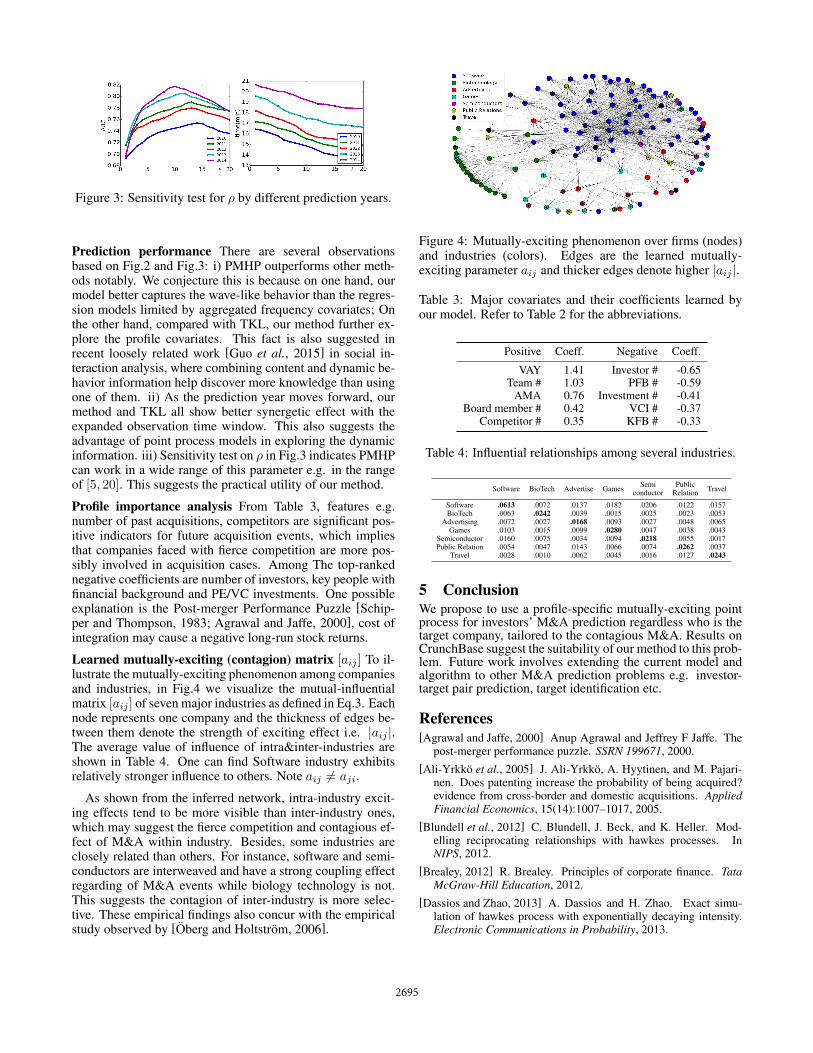
Figure 3: Sensitivity test for ⇢ by different prediction years.
Prediction performance There are several observationsbased on Fig.2 and Fig.3: i) PMHP outperforms other meth-ods notably. We conjecture this is because on one hand, ourmodel better captures the wave-like behavior than the regres-sion models limited by aggregated frequency covariates; Onthe other hand, compared with TKL, our method further ex-plore the profile covariates. This fact is also suggested inrecent loosely related work [Guo et al., 2015] in social in-teraction analysis, where combining content and dynamic be-havior information help discover more knowledge than usingone of them. ii) As the prediction year moves forward, ourmethod and TKL all show better synergetic effect with theexpanded observation time window. This also suggests theadvantage of point process models in exploring the dynamicinformation. iii) Sensitivity test on ⇢ in Fig.3 indicates PMHPcan work in a wide range of this parameter e.g. in the rangeof [5, 20]. This suggests the practical utility of our method.
Profile importance analysis From Table 3, features e.g.number of past acquisitions, competitors are significant pos-itive indicators for future acquisition events, which impliesthat companies faced with fierce competition are more pos-sibly involved in acquisition cases. Among The top-rankednegative coefficients are number of investors, key people withfinancial background and PE/VC investments. One possibleexplanation is the Post-merger Performance Puzzle [Schip-per and Thompson, 1983; Agrawal and Jaffe, 2000], cost ofintegration may cause a negative long-run stock returns.
Learned mutually-exciting (contagion) matrix [a
ij
] To il-lustrate the mutually-exciting phenomenon among companiesand industries, in Fig.4 we visualize the mutual-influentialmatrix [a
ij
] of seven major industries as defined in Eq.3. Eachnode represents one company and the thickness of edges be-tween them denote the strength of exciting effect i.e. |a
ij
|.The average value of influence of intra&inter-industries areshown in Table 4. One can find Software industry exhibitsrelatively stronger influence to others. Note a
ij
6= a
ji
.
As shown from the inferred network, intra-industry excit-ing effects tend to be more visible than inter-industry ones,which may suggest the fierce competition and contagious ef-fect of M&A within industry. Besides, some industries areclosely related than others. For instance, software and semi-conductors are interweaved and have a strong coupling effectregarding of M&A events while biology technology is not.This suggests the contagion of inter-industry is more selec-tive. These empirical findings also concur with the empiricalstudy observed by [Oberg and Holtstrom, 2006].
Figure 4: Mutually-exciting phenomenon over firms (nodes)and industries (colors). Edges are the learned mutually-exciting parameter a
ij
and thicker edges denote higher |aij
|.
Table 3: Major covariates and their coefficients learned byour model. Refer to Table 2 for the abbreviations.
Positive Coeff. Negative Coeff.
VAY 1.41 Investor # -0.65Team # 1.03 PFB # -0.59
AMA 0.76 Investment # -0.41Board member # 0.42 VCI # -0.37
Competitor # 0.35 KFB # -0.33
Table 4: Influential relationships among several industries.
Software BioTech Advertise Games Semiconductor
PublicRelation Travel
Software .0613 .0072 .0137 .0182 .0206 .0122 .0157BioTech .0063 .0242 .0039 .0015 .0025 .0023 .0053
Advertising .0072 .0027 .0168 .0093 .0027 .0048 .0065Games .0103 .0015 .0099 .0280 .0047 .0038 .0043
Semiconductor .0160 .0075 .0034 .0094 .0218 .0055 .0017Public Relation .0054 .0047 .0143 .0066 .0074 .0262 .0037
Travel .0028 .0010 .0062 .0045 .0016 .0127 .0243
5 ConclusionWe propose to use a profile-specific mutually-exciting pointprocess for investors’ M&A prediction regardless who is thetarget company, tailored to the contagious M&A. Results onCrunchBase suggest the suitability of our method to this prob-lem. Future work involves extending the current model andalgorithm to other M&A prediction problems e.g. investor-target pair prediction, target identification etc.
References[Agrawal and Jaffe, 2000] Anup Agrawal and Jeffrey F Jaffe. The
post-merger performance puzzle. SSRN 199671, 2000.[Ali-Yrkko et al., 2005] J. Ali-Yrkko, A. Hyytinen, and M. Pajari-
nen. Does patenting increase the probability of being acquired?evidence from cross-border and domestic acquisitions. AppliedFinancial Economics, 15(14):1007–1017, 2005.
[Blundell et al., 2012] C. Blundell, J. Beck, and K. Heller. Mod-elling reciprocating relationships with hawkes processes. InNIPS, 2012.
[Brealey, 2012] R. Brealey. Principles of corporate finance. TataMcGraw-Hill Education, 2012.
[Dassios and Zhao, 2013] A. Dassios and H. Zhao. Exact simu-lation of hawkes process with exponentially decaying intensity.Electronic Communications in Probability, 2013.
2695

[Eugene and Yuan, 2012] L. Eugene and S. Yuan. Where’s themoney? the social behavior of investors in facebook’s smallworld. In ASONAM, 2012.
[Eugene and Yuan, 2013] L. Eugene and S. Yuan. Investors are so-cial animals: Predicting investor behavior using social networkfeatures via supervised learning approach. In MLG, 2013.
[Grinblatt and Keloharju, 2000] M. Grinblatt and M. Keloharju.The investment behavior and performance of various investortypes: a study of finland’s unique data set. Journal of financialeconomics, 55(1):43–67, 2000.
[Gugler and Konrad, 2002] K. Gugler and K.A. Konrad. Mergertarget selection and financial structure. Journal of Modern Ac-counting and Auditing, 2002.
[Guo et al., 2015] F. Guo, C. Blundell, H. Wallach, and K. Heller.The bayesian echo chamber: Modeling social influence via lin-guistic accommodation. In AISTATS, 2015.
[Hamilton, 1989] J. Hamilton. A new approach to the economicanalysis of nonstationary time series and the business cycle.Econometria, 57(2):357–384, 1989.
[Harford, 2005] J. Harford. What drives merger waves? Journal offinancial economics, 2005.
[Hawkes and Oakes, 1974] A. Hawkes and D. Oakes. A cluster pro-cess representation of a self-exciting process. Journal of AppliedProbability, 1974.
[Hawkes, 1971] A. Hawkes. Spectra of some self-exciting and mu-tually exciting point processes. Biometrika, 1971.
[Hou et al., 2015] R. Hou, J. Yang, C. Yao, and B. McKelvey. Howdoes competition structure affect industry merger waves? a net-work analysis perspective. Physica A: Statistical Mechanics andits Applications, 429:140–156, 2015.
[Hunter and Lange, 2004] D. R. Hunter and K. Lange. A tutorialon mm algorithms. Amer. Statist, pages 30–37, 2004.
[Jovanovic and Rousseau, 2001] B. Jovanovic and P. Rousseau.Mergers and technological change: 1885-1998. Unpublishedworking paper, Vanderbilt University, 2001.
[Jovanovic and Rousseau, 2002] B. Jovanovic and P. Rousseau.The q-theory of mergers. Technical report, National Bureau ofEconomic Research, 2002.
[Liniger, 2009] T. J. Liniger. Multivariate hawkes processes. PhDthesis, Swiss Federal Institute Of Technology, Zurich, 2009.
[Maksimovic et al., 2013] Vojislav Maksimovic, Gordon Phillips,and Liu Yang. Private and public merger waves. The Journalof Finance, 68(5):2177–2217, 2013.
[Mariana, 2012] V. Mariana. An overview on the determinants ofmergers and acquisitions waves. Annals of Faculty of Economics,1(2):390–397, 2012.
[Mitchell and Mulherin, 1996] M. Mitchell and J. Mulherin. Theimpact of industry shocks on takeover and restructuring activity.Journal of financial economics, 41(2):193–229, 1996.
[Nelson, 1959] R. Nelson. How does competition structure affectindustry merger waves? a network analysis perspective. Prince-ton University Press, Princeton, NJ, pages 1895–1956, 1959.
[Oberg and Holtstrom, 2006] C. Oberg and J. Holtstrom. Are merg-ers and acquisitions contagious? Journal of Business Research,59(12):1267–1275, 2006.
[Ogata, 1988] Y. Ogata. Statistical models for earthquake occur-rences and residual analysis for point processes. J. Amer. Statist.Assoc., 83(401):9–27, 1988.
[Ogata, 1998] Y. Ogata. Space-time point-process models for earth-quake occurrences. Annals of the Institute of Statistical Mathe-matics, 50:379–402, 1998.
[Pasiouras and Gaganis, 2007] F. Pasiouras and C. Gaganis. Finan-cial characteristics of banks involved in acquisitions: evidencefrom asia. Applied Financial Economics, 17(4):329–341, 2007.
[Ragothaman et al., 2003] Srinivasan Ragothaman, BijayanandaNaik, and Kumoli Ramakrishnan. Predicting corporate acquisi-tions: An application of uncertain reasoning using rule induction.Information Systems Frontiers, 5(4):401–412, 2003.
[Resende, 2008] M. Resende. Mergers and acquisitions waves inthe uk: a markov-switching approach. Applied Financial Eco-nomics, 18(13):1067–1074, 2008.
[Schipper and Thompson, 1983] K. Schipper and R. Thompson.Evidence on the capitalized value of merger activity for acquiringfirms. Journal of Financial Economics, 11(1):85–119, 1983.
[Shleifer and Vishny, 2003] A. Shleifer and R. Vishny. Stock mar-ket driven acquisitions. Journal of financial Economics, 2003.
[Slowinski et al., 1997] R. Slowinski, C. Zopounidis, and A. Dimi-tras. Prediction of company acquisition in greece by means of therough set approach. European Journal of Operational Research,100(1):1–15, 1997.
[Song and Chu, 2006] X. Song and Y. Chu. A study on financialstrategy for determining the target enterprise of merger and ac-quisition. Journal of Modern Accounting and Auditing, 2006.
[Very et al., 2012] P. Very, E. Metais, S. Lo, and P. Hourquet. Canwe predict m&a activity? Advances in Mergers and Acquisitions,11:1–32, 2012.
[Weber and Dholakia, 2000] J. Weber and U. Dholakia. Includ-ing marketing synergy in acquisition analysis:: A step-wise ap-proach. Industrial Marketing Management, 2000.
[Wei et al., 2009] C. Wei, Y. Jiang, and C. Yang. Patent analysisfor supporting merger and acquisition (m&a) prediction: A datamining approach. In Designing E-business systems. Markets, ser-vices, and networks, pages 187–200. 2009.
[Xiang et al., 2012] G. Xiang, Z. Zheng, M. Wen, J. Hong, C. Rose,and C. Liu. A supervised approach to predict company acquisi-tion with factual and topic features using profiles and news arti-cles on techcrunch. In ICWSM, 2012.
[Yan et al., 2012] Junchi Yan, Chunhua Tian, Jin Huang, andYu Wang. Load forecasting using twin gaussian process model.In SOLI, 2012.
[Yan et al., 2013] J. Yan, Y. Wang, K. Zhou, J. Huang, C. Tian,H. Zha, and W. Dong. Towards effective prioritizing water pipereplacement and rehabilitation. In IJCAI, 2013.
[Yan et al., 2015] J. Yan, C. Zhang, H. Zha, M. Gong, C. Sun,J. Huang, S. Chu, and X. Yang. On machine learning towardspredictive sles pipeline analytics. In AAAI, 2015.
[Zhou et al., 2013a] K. Zhou, H. Zha, and L. Song. Learning socialinfectivity in sparse low-rank networks using multi-dimensionalhawkes processes. In AISTATS, 2013.
[Zhou et al., 2013b] K. Zhou, H. Zha, and L. Song. Learning trig-gering kernels for multi-dimensional hawkes processes. In ICML,2013.
2696