modeling dynamics of tillage adaption tran
TRANSCRIPT
North Carolina Agricultural and Technical State University
Modeling the dynamics of conservation tillage adoption: effects of crop rotation and erodibility of the soil on
continuous conservation tillage adoption in IowaDat Q. Tran1 and Lyubov A. Kurkalova2
1 PhD candidate, North Carolina A&T State University2 Professor, North Carolina A&T State University

North Carolina Agricultural and Technical State University
This presentation Motivation for interest
Statistical models
Data, estimation, and results
Conclusions and next steps
North Carolina Agricultural and Technical State University
Conservation tillage Tillage
»Conventional ‐ less than 30% crop residue left, after planting»Conservation tillage (CT) – at least 30% crop residue left, after planting»Continuous CT (CCT) – CT is used continuously over a period of years
Continuous CT (CCT), and especially continuous NT provides significant environmental benefits, when compared to conventional till»Reduction in soil erosion by water and wind»Reduction in Nitrogen and Phosphorus run‐off»Carbon sequestration

North Carolina Agricultural and Technical State University
Dynamics of tillage For carbon sequestration benefits to occur, CT needs to be
practiced continuously over several years in a row» Even a single year of conventional till in between years of CT (NT) releases most of the accumulated carbon back to atmosphere (Manley et al., 2005; Conant et al., 2007)
Theoretical economic studies: dynamic optimization » McConnell, 1983; Wilman, 2011
However, most of the empirical economic studies of tillage choices did not account for the dynamics:» Binary, single year choice between tillage regimes (e.g., Conventional vs. NT), conditional on the crop grown (Rahm and Huffman, 1984; Soule at al., 2000; Pautsch et al., 2001; Vitale et al., 2011; Druschke and Secchi, 2014, Knowler, 2014, VandenBygaart, 2016)

North Carolina Agricultural and Technical State University
Dynamics of tillage: Limited data Nation‐wide USDA ARMS
» Selected years, crops, states» Limited attempts to gather information on continuous CT
Nation‐wide CTIC» Tillage systems by county and crop, yearly 1989 –1998, 2000, 2002, 2004» Survey was not designed to track tillage from one year to another
Nation‐wide CEAP» Tillage systems, yearly 2003‐2006» Each year, different set of farmers surveyed
Regional, based on surveys of farmers: » Hill, 2001; Napier and Tucker, 2001

North Carolina Agricultural and Technical State University
48%
31%
21% Till every year
Used no‐till 1‐3 years
Used no‐till in all 4 years
Claassen & Ribaudo, (2016, Choices)
Field survey (ARMS data), 2009, 2010 and 2012 Wheat in 2009, corn in 2010, soybeans in 2012 Level: Nationwide

North Carolina Agricultural and Technical State University
Regional studies: Hill (2001, JSWC)
Field survey
Corn‐soybean, 1994 – 1999
Level: IL, IN and MN
State/ counties surveyed
% fields in NT continuously for the indicated number of years
2 3 4 5 6IL/ 18 44 30 22 19 13IN/ 11 41 25 18 14 9MN/ 10 9 7 3 3 n/a

North Carolina Agricultural and Technical State University
Research questions
How often do farmers rotate CT with conventional tillage (CV) in Iowa?
How do CCT and alternating CT (ACT) vary spatially across Iowa?
What factors contribute to the variability of CCT and ACT in Iowa?

North Carolina Agricultural and Technical State University
CTIC data, Iowa state
Crop‐tillage share, Source: CTIC
5%
15%
25%
35%
45%
55%
1989 1990 1991 1992 1993 1994 1995 1996 1997 1998 1999 2000 2001 2002 2003 2004
Tillage‐crop share (%
)
Year
CT corn CV corn
CT soybeans CV soybeans

North Carolina Agricultural and Technical State University
Statistical model used in present study Assume that crop‐tillage choice could be described as a
stationary 1st order Markov process
Si, i = 1,2,3,4 is the share of state’s cropland in1 – CT‐corn, 2 – CV‐corn, 3 – CT‐soybeans, 4 – CV‐soybeans
Each transition probability pij represents the probability of crop‐tillage category i after crop‐tillage category j the year before
11 21 31 41
1 12 22 32 421 2 3 4 1 2 3 4
13 23
14 24
0 00 0
t t
p p p pp p p p
s s s s s s s sp pp p

North Carolina Agricultural and Technical State University
The 1st order Markov transition diagram
Notes: CT = conservation tillage, CV = conventional tillage. The four circles represent the four tillage-crop states (choices) considered. The arrows represent transitions from one state to another. The probabilities of the transitions are listed next to the corresponding arrows. Dashed lines represent the transitions, for which the probabilities are all set to zero in the model: from soybeans (CT or CV) to soybeans (CT or CV).

North Carolina Agricultural and Technical State University
Estimation approaches
We apply Quadratic Programming to 1992‐1997 data for 99 counties in Iowa»Estimate 99 transition matrixes»Calculate the probability of CCT, ACT, CCV
We use ANOVA (SAS, 1996) to analyze the effect of HEL and crop rotation on the tillage dynamics

North Carolina Agricultural and Technical State University
Model performance
CT cornr=0.82
CV cornr=0.87
CT soybeansr=0.80
CV soybeansr=0.77

North Carolina Agricultural and Technical State University
Average probability of CCT, CCV and ACT over 99 counties
0%
20%
40%
60%
80%
100%
1‐year sequence 2‐year sequence 3‐year sequence
CCVACTCCT

North Carolina Agricultural and Technical State University
HEL data (percentage acreage classified as HEL)
North Carolina Agricultural and Technical State University
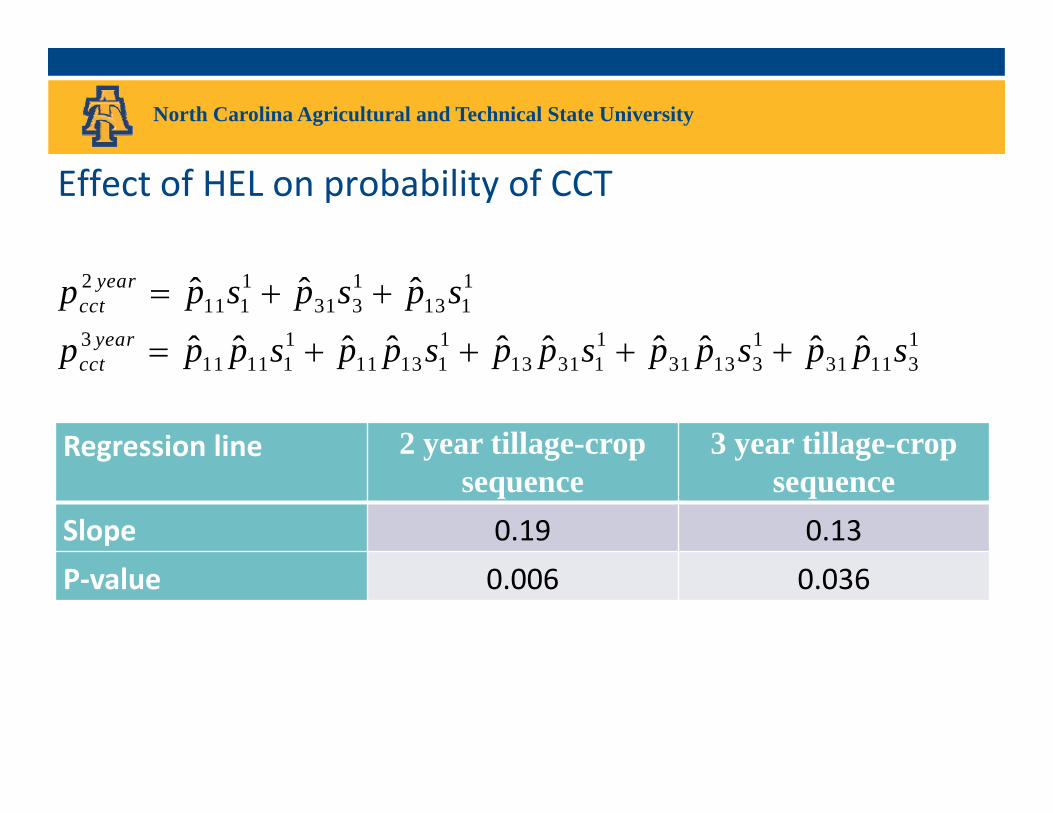
Effect of HEL on probability of CCT
Regression line 2 year tillage-crop sequence
3 year tillage-crop sequence
Slope 0.19 0.13P‐value 0.006 0.036
2 1 1 111 1 31 3 13 1
3 1 1 1 1 111 11 1 11 13 1 13 31 1 31 13 3 31 11 3
ˆ ˆ ˆ
ˆ ˆ ˆ ˆ ˆ ˆ ˆ ˆ ˆ ˆ
yearcct
yearcct
p p s p s p s
p p p s p p s p p s p p s p p s

North Carolina Agricultural and Technical State University
Crop rotation effect on probabilities of CCT and ACT
Rotation CCT* ACT*
Less corn 0.13a 0.53a
More corn 0.03b 0.17b
P(T<=t) <0.001 <0.001
Less corn: 1 year of corn with in 3 yearsMore corn: 2 or 3 years of corn with in 3 years
3 1 1 1 1 122 22 2 22 24 2 24 42 2 42 22 4 42 24 4
3 1 1 1 1 111 11 1 11 13 1 13 31 1 31 13 3 31 11 3
ˆ ˆ ˆ ˆ ˆ ˆ ˆ ˆ ˆ ˆ
ˆ ˆ ˆ ˆ ˆ ˆ ˆ ˆ ˆ ˆ1
yearccv
yearcct
act cct ccv
p p p s p p s p p s p p s p p s
p p p s p p s p p s p p s p p sp p p
*Within‐column simulated means followed by the same letter are not significantly different using Fisher’s LSD at P≤0.05.

North Carolina Agricultural and Technical State University
Conclusions and next steps
Conclusions»HEL and crop rotation/crop choice are found to have significant effect on CCT and ACT
Next steps:»Extend the model to allow the Markov transition matrix to vary across time
»Apply the Markov chain approach to cropping patterns data derived from USDA/NASS‐Cropland Data Layer (CDL)

North Carolina Agricultural and Technical State University
Acknowledgements
This research was partially funded by the USDA Forest Service Southern Research Station agreement No. 15‐JV‐11330143‐010 and by the USDA National Institute of Food and Agriculture, award No. 2016‐67024‐24755. The views expressed in this article are those of the authors and do not necessarily reflect the views or policies of the USDA.

North Carolina Agricultural and Technical State University
Thank You for your attention!
Make my day, please ask me question

North Carolina Agricultural and Technical State University
Estimated mean CCT probabilities of alternative two-year tillage-crop sequences
Current tillage‐crop, year t Previous tillage‐crop, year t‐1 probability*
CT corn CT corn 0.10a
CT corn CT soybeans 0.44b
CT soybeans CT corn 0.51b
LSD (0.05) 0.07
2 1 1 122 2 42 4 24 2ˆ ˆ ˆ
1
yearccv
act cct ccv
p p s p s p sp p p

North Carolina Agricultural and Technical State University
Crop rotation effect on ACT probabilities of alternative two-year tillage-crop sequences
Current tillage‐crop, year t Previous tillage‐crop, year t‐1 probability*
CT corn CV corn 0.12a
CV corn CT corn 0.13a
CT corn CV soybeans 0.40b
CV corn CT soybeans 0.56c
CT soybeans CV corn 0.48d
CV soybeans CT corn 0.27e
LSD (0.05) 0.07