modeling foamy oil flow in porous media · modeling foamy oil flow in porous media d.d ... the...
TRANSCRIPT
Modeling Foamy Oil Flow in Porous Media
D.D. Joseph�, A.M. Kamp�, R. Bai�
�Univ. of Minnesota, Dept. of Aerospace Engng. & Mech, 107 Akerman Hall110 Union Street. S.E., Minneapolis, MN 55455, USA
� PDVSA Intevep, PO Box 76343, Caracas 1070-A, Venezuela
October 2001
Abstract
Certain heavy oils which foam under severe depressurization give riseto increased recovery factor and an increased rate of production under so-lution gas drive. These oils not only stabilize foam, but also stabilize dis-persion of gas bubbles at lower volume ratios. The way this phenomenonis related to the chemistry of the oil and its viscosity is presently not under-stood. We present here a mathematical model of reservoir flow of foamy oilwhich depends only on the velocity through Darcy’s law, the pressure andthe dispersed gas fraction. The theory governs only in situations in which thebubbles do not coalesce to produce the percolation of free gas. In this theorythe bubbles move with the oil as they evolve. The main empirical contentof the theory enters through the derivation of solubility isotherms which canbe obtained from PVT data; modeling of nucleation, coalescence, bubbledrag laws and transfer functions are avoided. The local pressure differenceand dispersed gas fraction are in equilibrium on the solubility isotherm. Ina pressure drawdown the time taken for the system to return to equilibriumis described by a rate law characterized by an empirical relaxation time (rateconstant). The resulting systems of equations can be reduced to a coupledpair of nonlinear PDE’s for the dispersed gas fraction and pressure differ-ence, which can further be reduced in the equilibrium case to a second orderevolution equation for the pressure difference. This system of equations canalso be derived from usual theory of two-phase flow in a porous media basedon relative permeability under the assumption that the bubbles and oil movein lock step. We propose a reformulation of the conventional theory in whichthe concept relative permeability of the porous media is replaced with themore familiar concept of an effective phase viscosity. The equations of ourrelaxation theory are solved numerically, and the mixture viscosity functionand relaxation time are selected to match the sandpack experiments of Mainiand Sarma [1994].
1
1 Introduction
In this paper a model is presented that is motivated by the need to explain anoma-lous features associated with production from reservoirs of so-called foamy oils.These oils are described by some of their properties of response to pressure de-clines; it is noted that they nucleate dispersed gas bubbles and display obviousfoaminess in well head samples produced by solution gas drive in which oil andgas are produced by the drawdown of pressure (Huerta, Otero, Rico, Jimenez, DeMirabal, & Rojas, [1996], De Mirabal, Gordillo, Fuenmayor, Rojas, Rodriguez &Sanchez, [1996]).
When compared with the response of conventional oils, the response of foamyoils to drawdown of pressure is more favorable; primary recovery factor (percent-age of the oil in the reservoir which can be recovered), the rate of production, thevolume ratio of oil to gas which is recovered and the length of time that a givenpressure gradient or rate of production can be maintained are all increased substan-tially; the reasons for the favorable response of foamy oils in solution gas driveare not well understood and tentative explanations which have been put forwardare controversial (see Maini [1996], Pooladi-Darvish and Firoozabadi [1997] andSheng, Maini, Hayes & Tortike, [1999a] for recent reviews).
Foamy oils carry considerable amounts of dissolved gases in the condensedstate. The relevant thermodynamic property for this is “gas solubility”; a func-tion of temperature and pressure at equilibrium which gives the volume ratio ofdispersed gas from the crude oil by outgassing. Tables of solubility of methane,carbon dioxide and other gases in various Canadian crude oils have been given bySvrcek & Mehrotra [1982], Peng, Fu, Bird, & Hsi [1991] and others. The oilsconsidered to be foamy evidently cavitate small dispersed bubbles which, undersome conditions, are believed to move with the crude oil in which they are dis-persed. Experiments done by Pooladi-Darvish & Firoozabadi [1997] have shownthat bubbles which arise from depressurization of silicone oil and heavy crude ofequivalent viscosity are very different; the bubbles in the silicone oil are larger andmuch more mobile than the ones in crude oil. Viscosity alone might not be enoughto demobilize dispersed gas; it is desirable to look at other properties like surfacetension and surface active agents. Possibly there are surface active agents whichare present naturally in foamy crudes which allow them to stabilize foam, but theprecise agents, their composition and the mechanics by which they are releasedapparently have not been studied.
A “foamy oil” is a heavy oil which foams under rapid depressurization. Maini[1996] notes that “� � � the term “foamy oil” is often used to describe certain oils pro-duced by solution gas drive which display obvious foaminess in wellhead samples.The primary production of heavy oil from several reservoirs in western Canada is
2
in the form of an oil continuous foam. This foam resembles a chocolate mousse inappearance and often persists in open vessels for several hours� � � ” Foaming at awell head is a kind of foam formation analogous to the head on beer. To get sucha head the pressure decline must be sufficiently severe to allow the bubbles whichrise from outgassing of condensed gas in the bulk to accumulate at the free surfacefaster than they collapse. Perhaps there are surfactants in foamy oil which stabilizethe films between the bubbles preventing collapse, promoting the buildup of thehead. Foam stability measurements in the laboratory have shown that the foami-ness of crude heavy oils is comparable to aqueous foams used for steam floodingapplications (Sheng, Hayes, Maini & Tortike [1996]). The outgassing of condensedgas will not lead to foam at the well head if the rate of depressurization is too low.
To create foam in a reservoir or in a sandpack it is necessary to depressurizerapidly enough to produce close packed solution gas bubbles which can undergoa topological phase change to stable films and plateau borders. This kind of insitu foaming of sandpacks has been achieved in the experiments of Maini & Sarma[1994]. Gas and liquid move in lock step in these foams and lead to very highprimary recovery factors. At the actual reservoir, gas fractions can be as low as5 to 10%. At these gas fractions the oils cannot foam but are well-dispersed andprotected against coalescence, possibly by the same natural surfactants that mightstabilize the foams.
In solution gas drive of foamy oil the depressurization of the sample leads tocavitation of small dispersed bubbles. The volume ratio of dispersed gas increasesthe volume of our composite fluid and it acts as a pump, gas coming out of solutionpumps the fluid outward. This pumping action is well described by the continuityequation (4.4) which implies that in a closed volume � with boundary � containingdispersed bubbles of volume fraction �
��
�
�� �
��
���� �
��
��� �� (1.1)
where � is the outward normal on � and � is the velocity of our composite fluid.The relative velocity of dispersed gas is important; if the bubbles coalesce and
move relative to the oil more gas and less oil will be produced. Good recoveryis sometimes described by a critical gas saturation value; this is the volume frac-tion of gas at which the gas becomes connected and starts to move faster than theoil. Maini [1996] identifies this critical saturation as a percolation limit, whilstFiroozabadi, Ottensen, Mikkelsen and December [1992] and Pooladi-Darvish andFiroozabadi [1997] identify this even by visual observation of bubbles in a viewingwindow. The values given by Firoozabadi et al. are about 5 times smaller thanthose given by Maini and his coworkers.
3
Mastmann, Moustakis and Bennion (2001) wrote a paper ”Predicting foamyoil recovery” which they applied to the Driza crude oils found in a large Albanianoil field. This oil gives rise to huge amounts of stable foam under rapid depressur-ization. They say
The basic mechanism of foamy oil behavior is related to the existenceof what is commonly termed a “pseudo” bubble point. The true bub-ble point is the pressure at which, at the reservoir temperature, thefirst small bubbles of free gas evolve from solution in the oil and nu-cleate as a distinct free gas phase. For most conventional oils havingrelatively low viscosity, the gas rapidly coalesces into large bubblesand evolves almost immediately from the oil to form a separate anddistinct gas phase. In many reservoirs, this forms a secondary gas-cap during depletion operations and results in high gas-oil ratios atproduction wells due to the high mobility of a free gas phase in theporous media in comparison to the more viscous oil. For this reason,for conventional or non-foamy oils, the bubble point and the “pseudo”bubble point have the same or very close to the same values.
For foamy oils, due to the high viscosity of the oil, the gas bubblescannot immediately coalesce together to form bubbles large enough toallow gravitational forces to separate from the oil. For this reason, theoil phase remains as a continuous dispersed gas-oil emulsion with ahigher and higher concentration of increasingly larger bubbles trappedin a milkshake-like format within the oil as the pressure is reduced.The point for the foamy oil at which the bubbles of free gas can finallystart to escape from solution as a distinct free gas phase is known asthe pseudo bubble point.
Their use of the term “pseudo bubble point” is slightly unconventional. Weprefer to refer to this condition as a “percolation threshold.” This threshold is a fluidmechanics, possibly rheological property of the oil and the producing reservoir orsand pack, and not a thermodynamic property; it could depend on time. Under veryrapid depressurization in a sandpack or at the well head in the reservoir, the gas isnucleated so rapidly that it closes packs and, in a foamy oil, forms a foam withoutgas percolation. In a reservoir, after long time evolution of gas the mechanics ofcoalescence is such as to lead to percolation.
When the gas percolates, the good news about recovery is over; it is no wonderthat all authors find that the critical saturation values are about the same as theprimary recovery factors (which is the fraction of oil recovered by solution gas tooil in the reservoir) even when they disagree about definitions.
4
A few models of foamy oil flow have been put forward; each emphasize somespecial feature. One of the most recent models by Sheng et al. [1996], Sheng etal. [1999a] are multiphase theories based on conservation laws with transfer fromsolution gas to dispersed gas and from dispersed gas to free gas. Their theory doesnot seem to follow the curve of experimental values. Sheng et al. [1996] say that
Published models include the psuedo-bubble point model (Kraus, Mc-Caffrey, & Boyd [1993]), the modified fractional flow model (Lebel[1994]) and the reduced oil viscosity model (Claridge & Prats [1995]).Maini [1996] gave a detailed review and discussion of some of thesemodels. These models have been used to history match heavy oil pro-duction, but their common weakness is that the dynamic processeswhich are important features of foamy oil flow were not included prop-erly. Although it may be possible to get an acceptable history matchusing these models, the predictive ability is likely to be limited� � �
A more successful approach to modeling was recently advanced by Sheng,Hayes, Maini, & Tortike [1999b]. This model also requires the modeling of nucle-ation, bubble growth and disengagement of gas bubbles from the oil. The modelultimately leaves undetermined two adjustable parameters which fit the theory toexperimental data better than previous models.
To predict foamy oil behavior, Mastmann et al. (2001) use “Eclipse” which isa commercial “black oil” simulator. The model equations at the foundation of thissimulator are the conventional multiphase ones based on the concept of relativepermeability (see section 2) which is not well suited to the description of a ho-mogenous mixture in which the oil and gas move in lock step. Obviously, in sucha state the molecular viscosity of the gas is not important. The “black oil” modelallows for gas evolution through solubility tables and not through an equation ofstate like our (2.14)
The present theory could be called a continuum mixture theory which is appro-priate for foamy oil flow with dispersed gas of low mobility relative to the liquidand leads to three coupled nonlinear partial differential equations for �, � and thegas fraction �, five scalar equations in five unknowns. Our model has a few fea-tures in common with the excellent early work of Leibenson [1941] on the motionof gas saturated fluid in a porous media.
The model proposed here does not require information about nucleation, bub-ble growth, compressibility or forces which produce relative velocity. We put up aone-phase or mixture theory in which the dispersed gas is described by a gas frac-tion field in a single fluid in which the viscosity, density and mobility in Darcy’slaw all depend on the gas fraction. This fluid satisfies the usual Darcy law, andthe continuity equation together with a kinetic (constitutive) equation required by
5
the condensation and outgassing of methane (or other gases) in heavy crude. Thetheory depends only on parameters which can be measured in a PVT cell and sand-pack. The virtue of the model is simplicity, but it can work only for relativelyimmobile dispersed gas bubbles in which divergence-free velocities are excluded(see the discussion following (4.4)). Certainly such a theory could not be expectedto give rise to a percolation threshold or even to a critical gas fraction. We shallshow that it can describe many features of solution gas drive of foamy oils in theregimes when the bubbles in the mixture are dispersed and even when they aretrapped in foam.
The assumption that bubbles move in lock step with the oil could not holdwhen the diameter of a large number of the nucleated bubbles grow larger thana typical pore diameter. Nor would our theory work if the diameter of many ofthe bubbles were so small as to produce a sensible effect on the mixture pressure.Under the high pressure conditions of a typical reservoir one atmosphere is verysmall and even a one micron bubble with a tension of 30 dynes/cm would producea capillary pressure of 6 atmospheres. Our theory then assumes a large fraction ofsmall bubbles but is not restricted to small gas fractions.
It is our idea that the increased recovery and production are generated by thepumping of nucleating and growing gas bubbles embodied in (1.1). However re-covery factors and production rates are not the same and we might test some ideas:if two foamy oils have the same viscosity, the one with higher solubility havingmore gas to release will have higher primary recovery and production rate; if twofoamy oils have the same solubility, the one with lower viscosity will have a higherrate of production because the mixture is more mobile, but a lower primary re-covery because the percolation threshold is lower. If the oil foams in situ, oil andgas move in lock step and the primary recovery factor increases while due to theincreased viscosity of foam the rate of production could decrease.
2 Equation of state for dispersed gas
Solubility isotherms are an equation of state for foamy oil in which all of the gasnot in solution is dispersed in small bubbles. Free connected gas is not allowed.When the pressure is dropped, the mass of dissolved gas released goes entirely intodispersed gas bubbles. We have obtained solubility isotherms from measurementin PVT cells and applied the results to characterize the outgassing and absorbingof gasses in foamy oil in porous media. We have adopted the view that foamy oilwill have the same equation of state in a porous media as a PVT cell; the thermo-dynamics of the fluid are independent of the wall of the containing solid providedthat these walls are not so closely spaced as to effect the thermodynamic properties
6
of the bulk fluid.In the experiments of Svrcek & Mehrotra [1982] the pressure is dropped from
� and � to �ref and �ref where in the experiments � ref is atmospheric and �ref ������ÆK. It is assumed that all the gas in the live oil at � � comes out. Definingnow:
��� � � is the volume of dispersed gas,��� � � is the volume of live oil, ��� � � is the volume of dispersed gas which evolves from thecondensed gas when � � are dropped to � ref �ref.
In this model we avoid all constitutive equations regarding nucleation rates andbubble growth. In our model we have only a mixture of liquid and dispersed gas,and the dispersed gas enters only through the volume fraction
� ��
� � �� (2.1)
Equation (2.1) may be solved for
� ����� �
� (2.2)
Svrcek and Mehrotra [1982] give volumetric solubility curves (CO� and meth-ane, figures 8 and 12, pages 34 and 36). Their results show that
� � ����� � � (2.3)
is a linear function of pressure, with a larger slope at lower temperatures. We canassume that this tells you how much dispersed gas can come out of a solution ofdissolved gas in oil which is at a saturation value at any pressure and tempera-ture. We are going to assume that this � determines the dispersed gas fraction �following an argument put forward in what is to follow.
The data of Svrcek and Mehrotra [1982] show that
�� �ref � ���� � � (2.4)
where �� � ���� � is the slope of the solubility isotherms shown in figures 8 and12. This slope is approximately constant. Here we have chosen � ref as a smallpressure at which a negligible amount of gas is dissolved in the oil. For practicalpurposes this could be standard (atmospheric) pressure. In the present approachwe have no way to predict the size distribution of gas bubbles. This means that we
7
are free to choose the size and distribution to measure � and the most convenientchoice is when all the released gas is collected at the top of a PVT such as in theexperiment of Svrcek & Mehrotra.
We first suppose that all the gas which comes out of a solution is dispersedand does not percolate or foam. We must suppose that the nucleation, growth andcompressibility of gas bubbles are working, but these microstructural features arenot monitored in these experiments which give only the solubility � . This is alsowhat we do in the mathematical model.
To convert (2.4) into a relation between � and � at equilibrium we note that thetotal mass of gas in the live oil is invariant, independent of � and � and
� ��� � � � ��� � � (2.5)
where
��� � � is the mass of dispersed gas. ��� � � is the mass of condensed gas.
Since the mass of condensed gas does not change when it is vaporized and assum-ing that this vapor is a perfect gas, we have
� � �ref����ref (2.6)
where � is the gas constant. From the same gas law
� � ������ (2.7)
Hence, from (2.5), (2.6) and (2.7) we have
�����
��ref
�
��ref(2.8)
and, using (2.3) and (2.4)
�����
��ref��ref
��� �ref
��
�� � (2.9)
We next introduce the bubble point pressure � as the pressure at which there is
no dispersed gas, all the gas is dissolved in the live oil so that � � � ���� �
when � � and from (2.4)
�� �ref � ���� � (2.10)
8

where
�� � � � ��� � ����� � �� (2.11)
Since is invariant, we may evaluate (2.8) at the bubble point
��ref��ref
��� � � �� � �� (2.12)
Using (2.10) to eliminate in (2.12) and equating (2.12) and (2.9) we get
�ref�
�
�ref� �
��� �ref
��
���� � � �
��� �ref
��
���� � � � (2.13)
In most depressurization experiments the change of liquid volume due to out-gassing and compressibility is small and ��� � � � ��� � �. In this case theterms proportional to � ref in (2.13) subtract out and after replacing � with �������� we get
��
�� ��
�� �
�(2.14)
where
� ��ref�
��
�ref(2.15)
is completely determined by the solubility isotherm. Since the variation of � issmall on an absolute scale, the values ��� ref are just slightly larger than one.
The variable � is called gas-oil ratio and is the gas-oil ratio at saturationpressure. From (2.10):
���� � ��� �ref
� (2.16)
Substituting this value of �� in (2.15)
� ��ref
�
�� �ref
�ref
� (2.17)
In most practical situations �� � ref so that from (2.17)
� ��ref
�
�
�ref� (2.18)
It is also customary in the oil industry to characterize live oil by its saturationpressure � and its gas-oil ratio at saturation pressure. By virtue of (2.18) one can
9
calculate the solubility parameter �. Note that in most experiments � ref is chosenas atmospheric pressure and �ref as �ÆF = � ��ÆC.
Values for � for two Canadian heavy oils, Lloydminster and Lindbergh (Maini& Sarma, 1994) and for a Venezuelan heavy oil, Cerro Negro, are given in table2.1. Graphs of the isotherm (2.14) for various values of � are shown in figure 2.1.
It can be noted that the solubility value for heavy crude oils from very differentregions are very close, which indicated that they contain similar amounts of dis-solved gases at the same pressures. The oil industry calls oil with dissolved gas”live oil.”
When � and � satisfying (2.14) vary from point to point
�� �����
���� ������ (2.19)
According to Darcy’s law, � � ���� where � is the mobility of the foamy mix-ture in the porous media; hence the fluid flows up the bubble gradient toward re-gions in which there are more bubbles where the pressure is smaller.
Departures from the equilibrium solubility relation (2.14) are indicated as su-persaturation or subsaturation. Defining the function
��� ������ �� �� ������� �� (2.20)
supersaturation �� � � corresponds to having more gas dissolved than thereshould be under thermodynamic equilibrium; subsaturation �� � � corresponds tohaving less gas dissolved than there should be under equilibrium. Supersaturationoccurs when the pressure in the reservoir is drawn down, but the oil cannot evolvegas fast enough to keep up with the depressurization. Subsaturation, on the otherhand, occurs when there is not enough gas available to dissolve in order to sat-isfy thermodynamic equilibrium at prevailing reservoir pressure and temperature.The function � in our theory is thus an indicator for departure from equilibriumsolubility.
Oil � T(ÆK)Lloydminster 3.40 293Lindbergh 3.17 293Cerro Negro 3.53 327
Table 2.1: Solubility coefficients for some heavy oils.
10
0
0.2
0.4
0.6
0.8
1
1.2
0 1 2 3 4 5
=1.5=3.17=3.4=6.0
φ
Pressure (MPa)
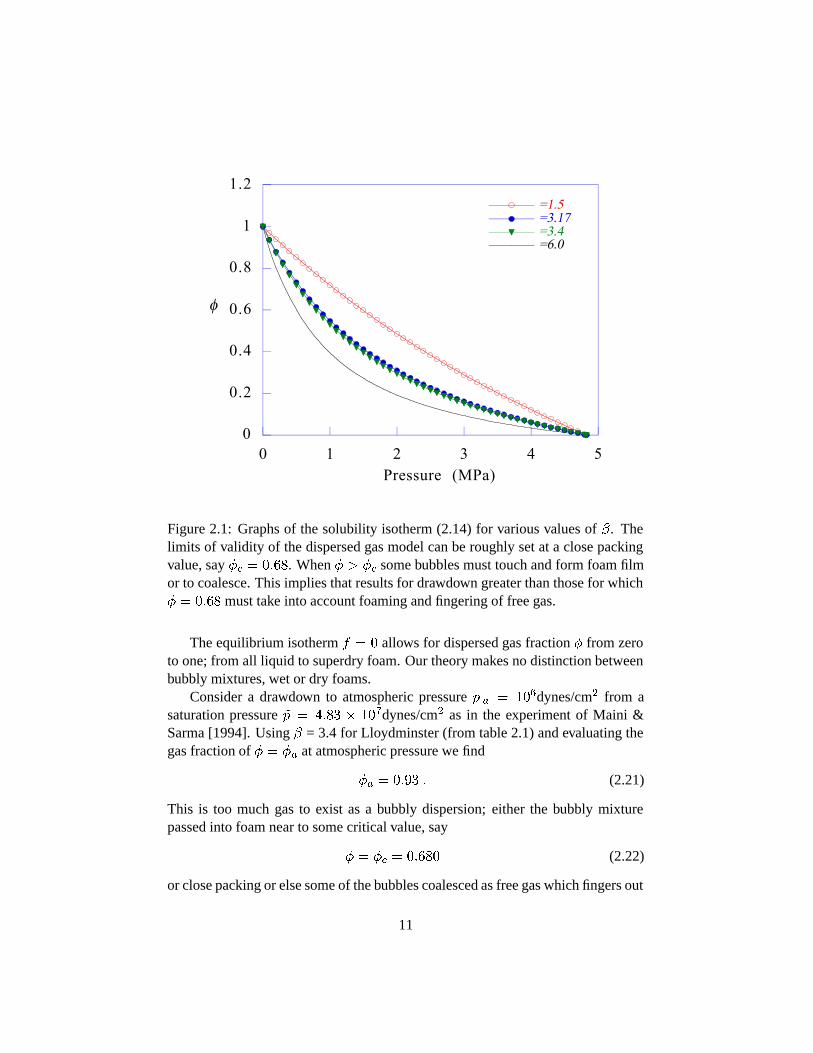
Figure 2.1: Graphs of the solubility isotherm (2.14) for various values of �. Thelimits of validity of the dispersed gas model can be roughly set at a close packingvalue, say �� � ���. When � � �� some bubbles must touch and form foam filmor to coalesce. This implies that results for drawdown greater than those for which� � ��� must take into account foaming and fingering of free gas.
The equilibrium isotherm � � allows for dispersed gas fraction � from zeroto one; from all liquid to superdry foam. Our theory makes no distinction betweenbubbly mixtures, wet or dry foams.
Consider a drawdown to atmospheric pressure � � � ��dynes/cm� from asaturation pressure � � ���� � ��dynes/cm� as in the experiment of Maini &Sarma [1994]. Using � = 3.4 for Lloydminster (from table 2.1) and evaluating thegas fraction of � � �� at atmospheric pressure we find
�� � ��� � (2.21)
This is too much gas to exist as a bubbly dispersion; either the bubbly mixturepassed into foam near to some critical value, say
� � �� � ��� (2.22)
or close packing or else some of the bubbles coalesced as free gas which fingers out
11
of the sandpack. Probably foam and free gas both evolve at the outlet of a closedsandpack after a sudden drawdown to atmospheric from high saturation.
We also note that the physics of supersaturation is complicated by the factthat bubbles cannot nucleate continuously and that the mechanism by which theynucleate is still not well understood. A bubble which might form in crude oil bythe vaporization of dissolved gas at supersaturated conditions can be expected tosatisfy Laplace’s law
���� � � � ���� (2.23)
where � is surface tension (say 30 dynes/cm) and � is the bubble radius. Un-der mildly supersaturated conditions � is slightly smaller than the vapor pressure����; hence, � satisfying (2.23) cannot be very small. In deriving (2.14) we haveassumed the continuity of pressure across the bubble surface, ignoring the smallpressure drop implied by (2.23).
It is argued that the vaporization of dissolved gas under supercritical condi-tions requires the simultaneous presence of undissolved gas hidden in crevices ofimpurities which are wet by gas preferentially. The curvature of the gas-oil in-terface in such a crevice is opposite to a bubble and it is controlled by capillarityrather than interfacial tension. The supersaturated dissolved gas vaporizes at theundissolved gas hidden in the crevice and the volume of the gas grows there until abubble breaks away restoring the nucleation site to its original condition. The trainof gas bubbles which emanate usually from a single site on a glass of beer as thegas comes out of the solution is a convenient example of outgassing at a nucleationsite. The pore walls in a porous media are nucleation sites for outgassing of foamyoil. The possibility that asphaltenes in the oil are nucleation sites for dissolved gasis a current but unresolved question.
3 Live oil and dead oil
Oil without dissolved gas is called dead oil. Oil saturated with dissolved gas iscalled live oil. The dissolved gas can be considered condensed and live oil is amixture of miscible liquids, dead crude oil and condensed gas. The mixture ofmiscible liquids is like glycerin and water with the caveat that the oil and dissolvedgas do not mix in all proportions; the fraction of dissolved gas at saturation is afunction of temperature and pressure. The weight fraction of dissolved gases rangefrom 0.3 to 6%. (See the tables corresponding to figures 8 and 12 in Svrcek &Mehrotra [1982]).
The viscosity of live oil can be orders of magnitude smaller than the viscosityof dead oil; the viscosity of live oil is a strongly decreasing function of the amount
12
of dissolved gas in solution just as the viscosity of glycerol strongly decreases withthe water fraction. In a pressure decline the viscosity of the live oil will increasebecause less gas is dissolved and because the presence of dispersed gas shouldincrease the viscosity of the composite fluid.
We may seek to answer the question “what is the density of the dissolved gasin solution.” We are not able to measure the density of the dissolved gas in oil, butthe density � of the mixture is available in data presented by Svrcek and Mehrotra(1982, see figures 6 and 11, pages 34 and 36). Let us note that this data showsthat the density of the CO� in bitumen is a weak function of the pressure; hencethe density of the non-saturated bitumen is independent of the volume ratio � ofsoluble gas in bitumen. Dissolved methane has a density only slightly differentthan bitumen (see their figures 8 and 12). A theory of miscible mixtures whichapplies to live oil can be found in Chapter X of Joseph & Renardy [1992].
4 Model description
In this model we avoid all constitutive equations regarding nucleation rates andbubble growth. In our model we have only foamy oil and dispersed gas and thedispersed gas enters only through its volume ratio �. The model combines Darcy’slaw, with a � dependent mobility, a mass conservation law for ideal mixtures to-gether with a constitutive equation governing the evolution of departures from equi-librium solubility. For flow not in equilibrium gradients and time derivatives arecrucial. The time derivatives which are used here have a material derivative
�
��� �
�
��� � � � (4.1)
where � is the porosity. The continuity equation is given by
��
��
��
��� ����div � � (4.2)
where
���� � ���� ����� �� � ����� �� (4.3)
because �� � �� where �� is the density of live oil which depends only weakly onthe volume ratio of dissolved gas. Combining (4.3) and (4.2) we find that
� ������ ��
��� div� � (4.4)
Equation (4.4) restricts the theory to dispersions of low mobility relative to thesuspending liquid. In any motion ��� �� of the composite which is divergence free
13
div � � , the dispersed gas fraction does not change following the motion of thefluid
��
���
��
��� � ��� � �
Bubbles rising under gravity would lead to divergence free motions as wouldany motion of the bubbly mixture in which dispersed bubbles do not nucleate,diffuse or compress. Motions with non-zero divergence satisfy (1.1); the flux outof any closed volume, over which the div � does not sum to zero, must be non zero.This is the simplified way that our theory accounts for nucleation and diffusion.
Turning next to Darcy’s law, we let � increase in the direction of gravity. Then
� � ������ ��� � � ������ ������ ��� � (4.5)
where
���� � ������ (4.6)
is the mobility, ���� is the viscosity of live oil with dispersed gas of volume ratio �and ���� is the permeability. The viscosity ���� increases with � for two reasons:dispersed gas bubbles and the reduction of live oil viscosity due to outgassing oflight components.
4.1 Relative permeability
Equations (4.2), (4.5) and (4.6) are implied by the usual theory for two phase flowthrough porous media based on relative permeabilities under the assumption thatthe average liquid and gas velocities are equal. The demonstration of this factleads also to a formula (4.24) for ratio of the relative permeabilities under the sameassumption.
The composite volume average velocity is given by
� � �� ��� (4.7)
where
�� � ��� ������ � ��� (4.8)
are superficial velocities (volume flow rate over total area) and � � is the averageoil velocity and �� is the average gas velocity. The mixture density ���� is givenby (4.3) and the composite mass average velocity is given by
�� ������� ���� � ������
����� (4.9)
14
The equations expressing the conservation of mass of each of the two phases are
������
��� �� �� � ����� ���� � (4.10)
�����
���� � ����� � � (4.11)
When �� � �� , the average gas and liquid velocities are equal and from (4.7),(4.8) and (4.9)
�� � � � �� � �� � (4.12)
After adding (4.10) and (4.11), using (4.12) we get equation (4.2).We now introduce relative permeability and show that we may replace the
concept of relative permeability with an equivalent concept of effective viscos-ity, which is a more familiar concept in the general theory of mixtures. Neglectinggravity and capillarity we have
��� ���� � �� � �� ������� � �
�
������� (4.13)
��� � �� � �� �����
�� � ��
������� (4.14)
where � is the permeability which we will identify as the � in (4.6), ��� and ��� arerelative permeabilities, �� and �� are molecular viscosities and
������
�����
������
�����
(4.15)
are effective viscosities.The introduction of effective viscosities is nothing more than a definition; how-
ever, the definition implies that the differential flow resistance can be associatedwith two fluid phases and not with the porous media. Noting now that � in (4.5) isthe composite velocity, we may write (4.5) and (4.6) neglecting gravity as
� � ��
������ (4.16)
and using (4.7) together with (4.13) and (4.14), we get
�
�����
�
������
�
������ (4.17)
15
Equation (4.17) and (4.15) relate the effective viscosity of the gas-liquid mixtureto the relative permeabilities.
The consequences of our basic assumption that the dispersed gas moves withthe liquid � � �� � �� may be extracted from the above equations. We find that
�
������
�� �
����(4.18)
and
�
������
�
����� (4.19)
The effective gas and liquid viscosities are completely determined by the effec-tive viscosity of the mixture when � � �� � ��. Moreover, the ratio of relativepermeabilities is
������
��������
��������
�� �
�
����
(4.20)
is determined by � and the ratio of molecular viscosities.When �� � ��, we may introduce
� � ����� (4.21)
and then
������
��������
��������
��� �����
���(4.22)
The ratio � of local velocities is related to the ratio of superficial velocities by
� ����
����� ��(4.23)
� is a useful and easily computed parameter for flow diagnosis. When � � �, theflow is homogeneous. When � � , the flow is all gas and the gas has percolated.
When � � �, the homogeneous theory leading to the continuity equation (4.2)does not apply. Instead, the conservation equations (4.10) and (4.11) for the gasand liquid phase must be used.
16
4.2 Constitutive equations relating the dispersed gas fraction to thepressure
We are proposing models in which the basic variables are the pressure and dis-persed gas fraction and are such that disturbed systems which are not forced willrelax to equilibrium with pressure and temperature on the solubility isotherm��� �� � given by (2.14). There are many possible ways to build models withthe above properties. The simplest conceptual model with the desired properties isa first evolution model
��
��� ��
which guarantees that a disturbed stationary system will relax exponentially. Theimplied assumption that both factors in the equilibrium isotherm relax at exactlythe same rate is probably overly restrictive.
The constitutive equation
��
��
��
�� �
�� �
�
��
��� �
�
��
�� �
��
��
�� �(4.24)
allows for separate rates of relaxation. Obviously this equation is very closely tiedto the equilibrium isotherm. To evaluate the possibility that a simple model basedon (4.24), involving only the pressure and dispersed gas fraction, can describesolution gas drive of foamy oil, we must integrate the equations and apply theresults to experiments and field operations. In this work, we apply our model tothe experiments of Maini & Sarma [1994]. The model requires that we identifya viscosity function ���� of the dispersed gas fraction and two relaxation times � and �. In our first attempt at evaluation we put � � ; in this case (4.24)reduces to a Maxwell-like constitutive equation with pressure relaxation leading ahyperbolic system of PDE’s that support wave propagation of pressure and bubblefronts. This system could not be made to simultaneously match experiments onsteady flow, the rate of production of oil in the same steady flow, and the cumulativeproduction in a blowdown experiment. We get a better match when � � with � � and we are able to select a viscosity function ���� � �� � ����� and � to match all the sandpack experiments, but the match of model to drawdownexperiments (figures 9.2 and 9.3) are less good. We speculate that the mismatchis due to percolation of free gas from the sandpack due to the massive pressuredecline in blowdown that must, at best, lead to the copious formation of relativelydry foam.
Obviously we may get a better agreement with the model by fitting two relax-ation parameters ( � and �) rather than one; in this case we might expect to model
17
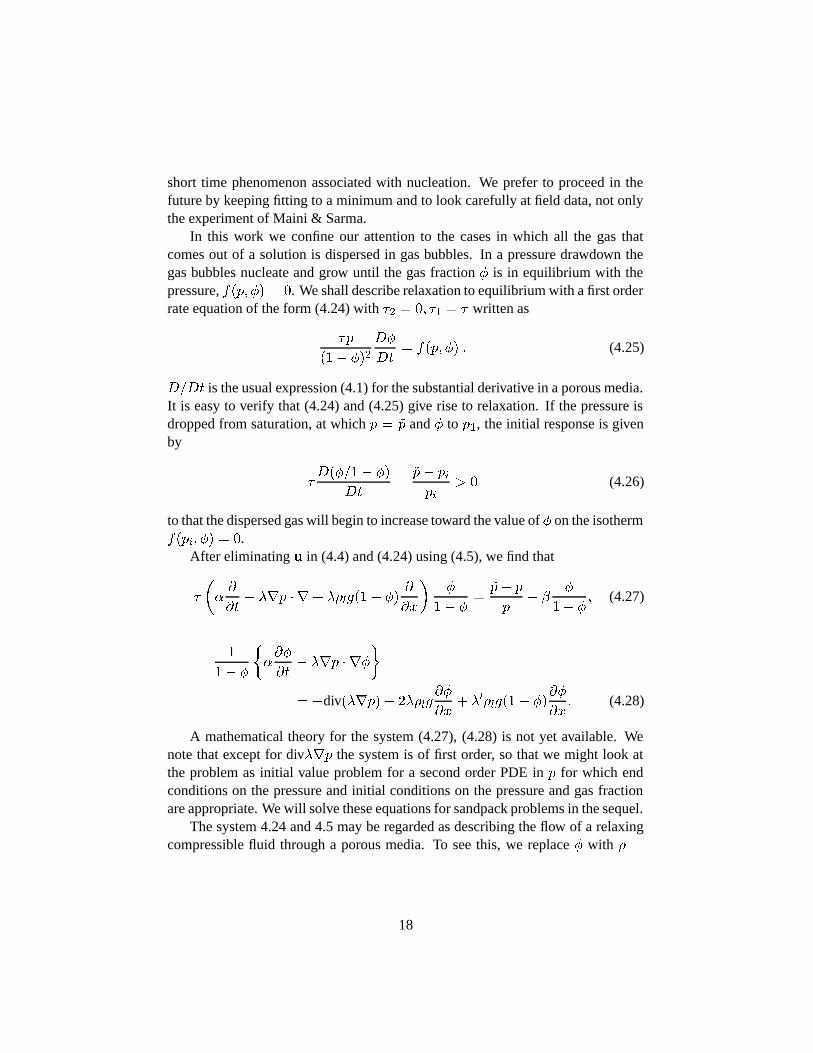
short time phenomenon associated with nucleation. We prefer to proceed in thefuture by keeping fitting to a minimum and to look carefully at field data, not onlythe experiment of Maini & Sarma.
In this work we confine our attention to the cases in which all the gas thatcomes out of a solution is dispersed in gas bubbles. In a pressure drawdown thegas bubbles nucleate and grow until the gas fraction � is in equilibrium with thepressure, ��� �� � . We shall describe relaxation to equilibrium with a first orderrate equation of the form (4.24) with � � � � written as
�
��� �����
��� ��� �� � (4.25)
���� is the usual expression (4.1) for the substantial derivative in a porous media.It is easy to verify that (4.24) and (4.25) give rise to relaxation. If the pressure isdropped from saturation, at which � � � and � to ��, the initial response is givenby
������ ��
���
�� ����
� (4.26)
to that the dispersed gas will begin to increase toward the value of � on the isotherm���� �� � .
After eliminating � in (4.4) and (4.24) using (4.5), we find that
��
�
��� ��� � �� ������� ��
�
��
��
�� ��
�� �
�� �
�
�� � (4.27)
�
�� �
����
��� ��� � ��
�
� �div������ �������
��� �������� ��
��
��� (4.28)
A mathematical theory for the system (4.27), (4.28) is not yet available. Wenote that except for div��� the system is of first order, so that we might look atthe problem as initial value problem for a second order PDE in � for which endconditions on the pressure and initial conditions on the pressure and gas fractionare appropriate. We will solve these equations for sandpack problems in the sequel.
The system 4.24 and 4.5 may be regarded as describing the flow of a relaxingcompressible fluid through a porous media. To see this, we replace � with � �
18
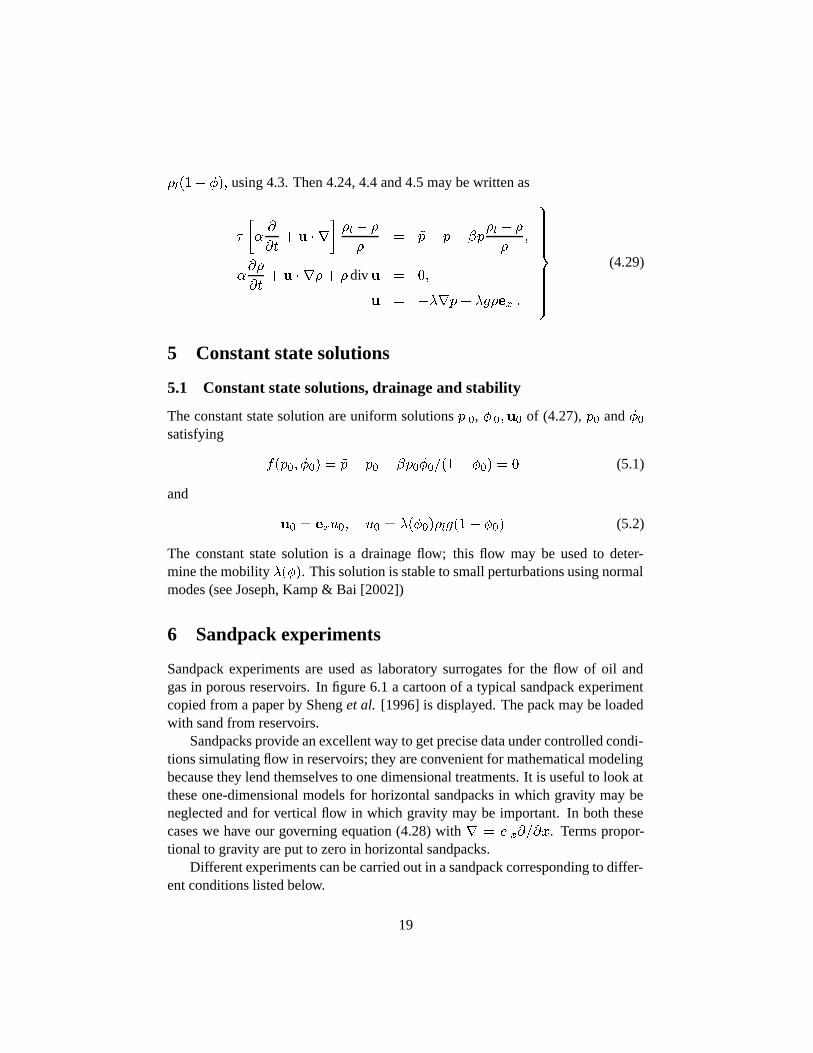
����� �� using 4.3. Then 4.24, 4.4 and 4.5 may be written as
��
�
��� � � �
��� � �
�� �� �� ��
�� � �
�
���
��� � � ��� � div� �
� � ����� ���� �
��
(4.29)
5 Constant state solutions
5.1 Constant state solutions, drainage and stability
The constant state solution are uniform solutions � �, � ��� of (4.27), �� and ��satisfying
���� ��� � �� �� � ��������� ��� � (5.1)
and
�� � � �� �� � ����������� ��� (5.2)
The constant state solution is a drainage flow; this flow may be used to deter-mine the mobility ����. This solution is stable to small perturbations using normalmodes (see Joseph, Kamp & Bai [2002])
6 Sandpack experiments
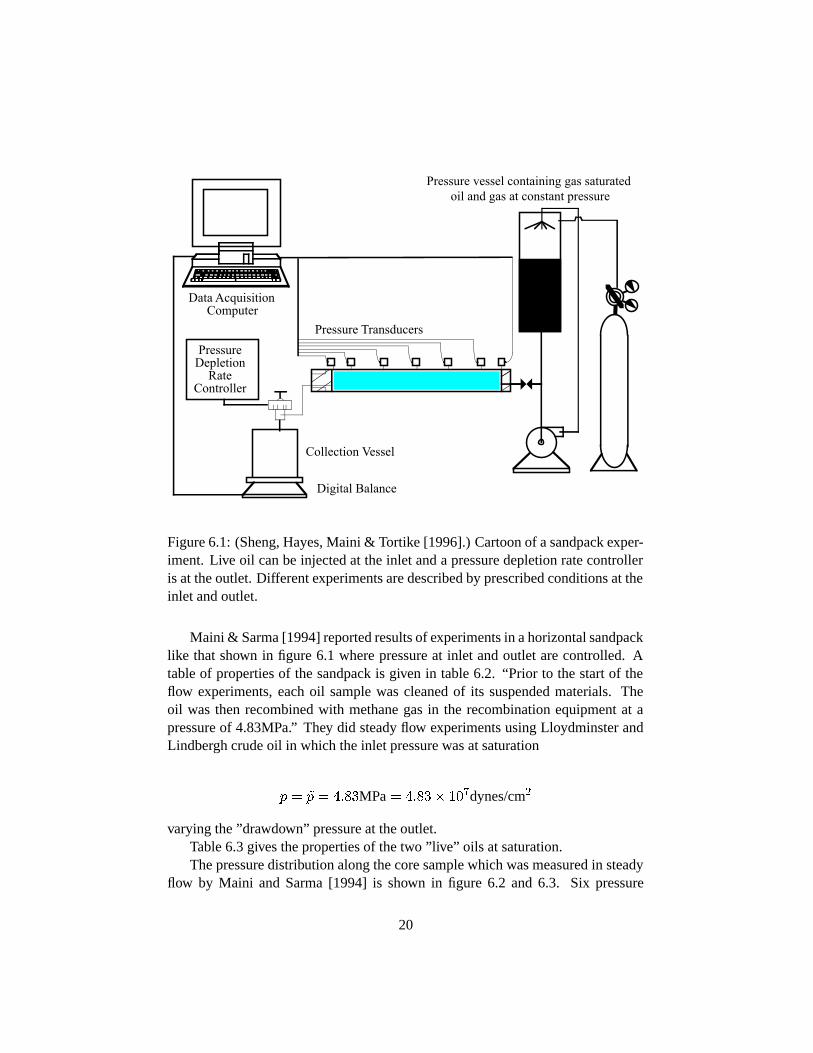
Sandpack experiments are used as laboratory surrogates for the flow of oil andgas in porous reservoirs. In figure 6.1 a cartoon of a typical sandpack experimentcopied from a paper by Sheng et al. [1996] is displayed. The pack may be loadedwith sand from reservoirs.
Sandpacks provide an excellent way to get precise data under controlled condi-tions simulating flow in reservoirs; they are convenient for mathematical modelingbecause they lend themselves to one dimensional treatments. It is useful to look atthese one-dimensional models for horizontal sandpacks in which gravity may beneglected and for vertical flow in which gravity may be important. In both thesecases we have our governing equation (4.28) with � � ! ����. Terms propor-tional to gravity are put to zero in horizontal sandpacks.
Different experiments can be carried out in a sandpack corresponding to differ-ent conditions listed below.
19
Data AcquisitionComputer
Collection Vessel
Digital Balance
Pressure Transducers
Pressure vessel containing gas saturated oil and gas at constant pressure
Pressure Depletion
Rate Controller
Figure 6.1: (Sheng, Hayes, Maini & Tortike [1996].) Cartoon of a sandpack exper-iment. Live oil can be injected at the inlet and a pressure depletion rate controlleris at the outlet. Different experiments are described by prescribed conditions at theinlet and outlet.
Maini & Sarma [1994] reported results of experiments in a horizontal sandpacklike that shown in figure 6.1 where pressure at inlet and outlet are controlled. Atable of properties of the sandpack is given in table 6.2. “Prior to the start of theflow experiments, each oil sample was cleaned of its suspended materials. Theoil was then recombined with methane gas in the recombination equipment at apressure of 4.83MPa.” They did steady flow experiments using Lloydminster andLindbergh crude oil in which the inlet pressure was at saturation
� � � � ����MPa � ����� ��dynes/cm�
varying the ”drawdown” pressure at the outlet.Table 6.3 gives the properties of the two ”live” oils at saturation.The pressure distribution along the core sample which was measured in steady
flow by Maini and Sarma [1994] is shown in figure 6.2 and 6.3. Six pressure
20
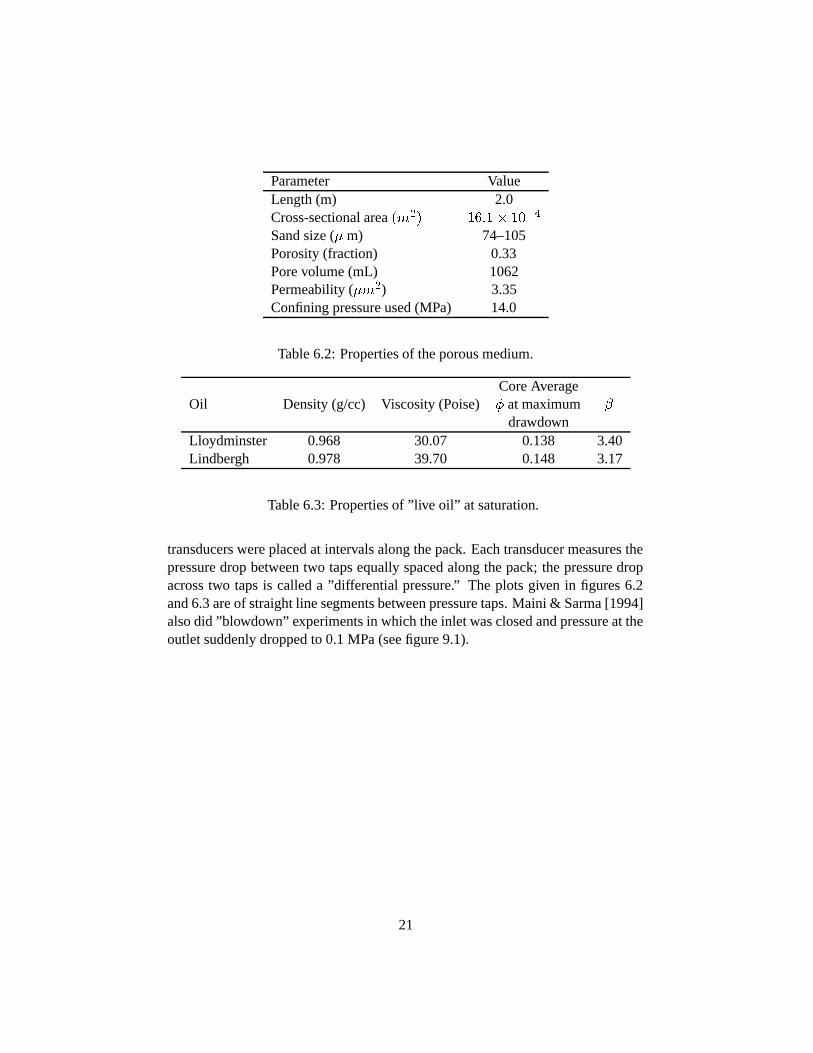
Parameter ValueLength (m) 2.0Cross-sectional area �"�� ����� ���
Sand size (� m) 74–105Porosity (fraction) 0.33Pore volume (mL) 1062Permeability (�"�) 3.35Confining pressure used (MPa) 14.0
Table 6.2: Properties of the porous medium.
Core AverageOil Density (g/cc) Viscosity (Poise) � at maximum �
drawdownLloydminster 0.968 30.07 0.138 3.40Lindbergh 0.978 39.70 0.148 3.17
Table 6.3: Properties of ”live oil” at saturation.
transducers were placed at intervals along the pack. Each transducer measures thepressure drop between two taps equally spaced along the pack; the pressure dropacross two taps is called a ”differential pressure.” The plots given in figures 6.2and 6.3 are of straight line segments between pressure taps. Maini & Sarma [1994]also did ”blowdown” experiments in which the inlet was closed and pressure at theoutlet suddenly dropped to 0.1 MPa (see figure 9.1).
21
5
4
3
2
1
00 50 100 150 200
Axial Distance from Inlet (cms)
Pore
Pre
ssur
e (M
Pa)
Increasing Pressure Drawdown
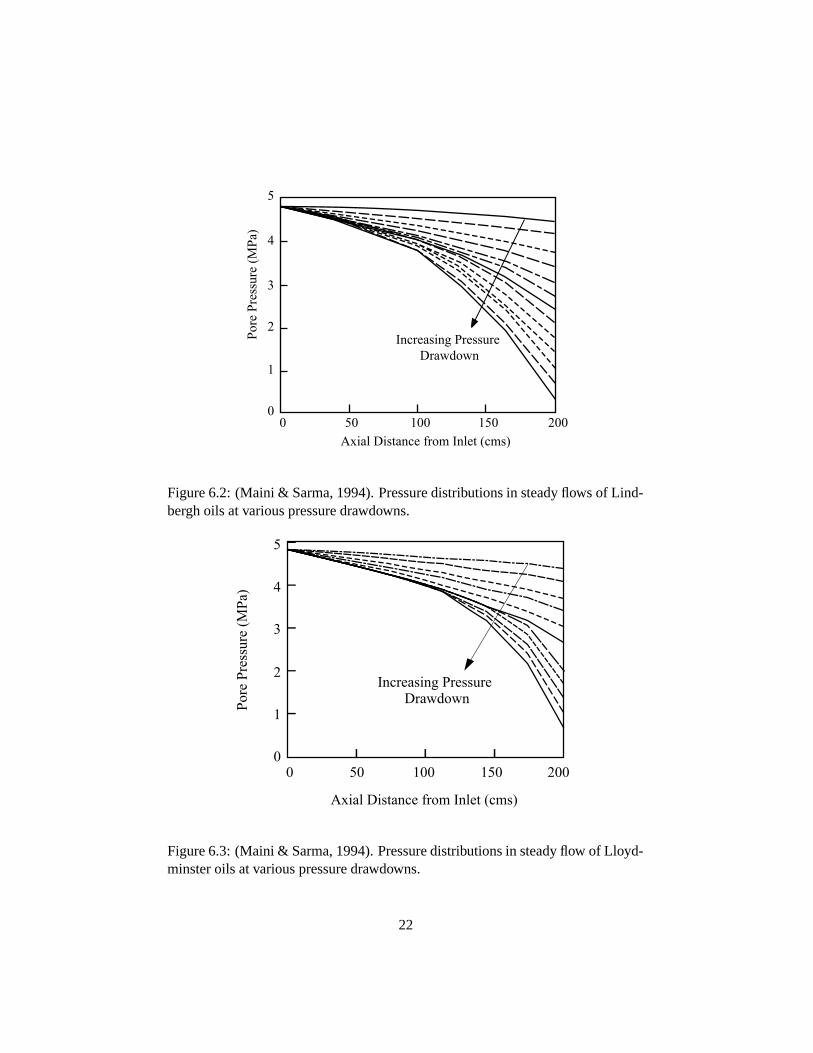
Figure 6.2: (Maini & Sarma, 1994). Pressure distributions in steady flows of Lind-bergh oils at various pressure drawdowns.
5
4
3
2
1
00 50 100 150 200
Pore
Pre
ssur
e (M
Pa)
Axial Distance from Inlet (cms)
Increasing PressureDrawdown
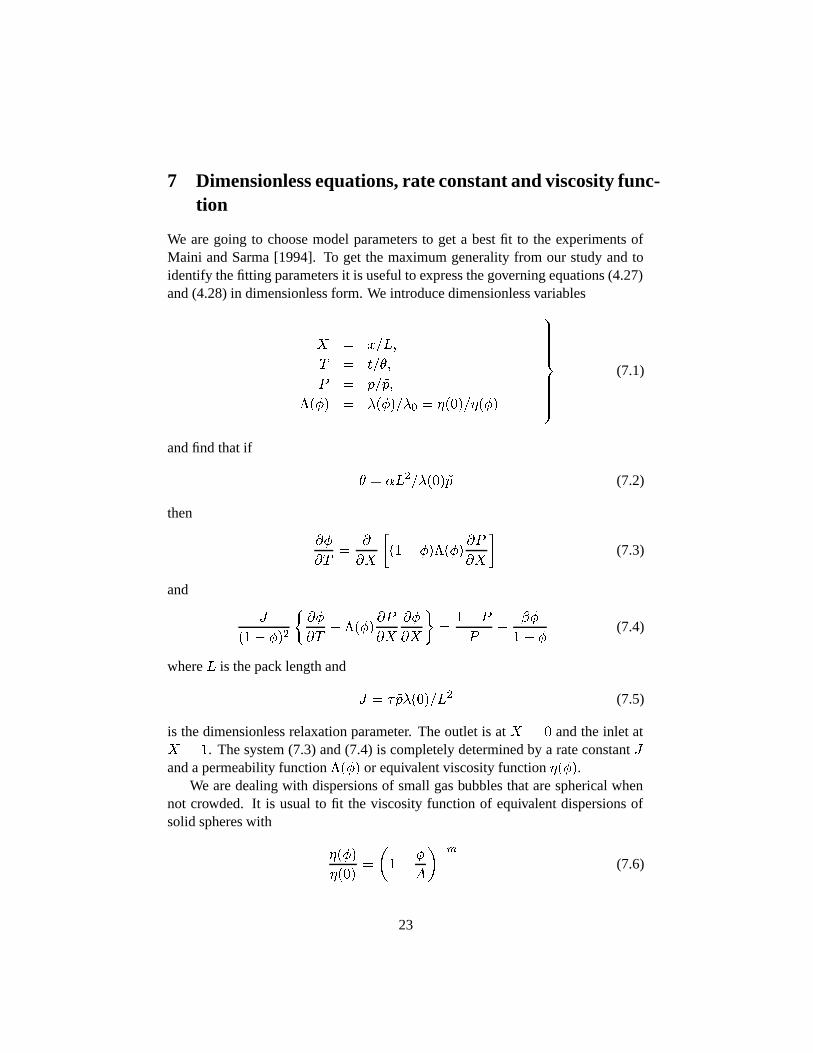
Figure 6.3: (Maini & Sarma, 1994). Pressure distributions in steady flow of Lloyd-minster oils at various pressure drawdowns.
22
7 Dimensionless equations, rate constant and viscosity func-tion
We are going to choose model parameters to get a best fit to the experiments ofMaini and Sarma [1994]. To get the maximum generality from our study and toidentify the fitting parameters it is useful to express the governing equations (4.27)and (4.28) in dimensionless form. We introduce dimensionless variables
# � ��$
� � ��%
& � ���
���� � ������� � ��������
��
(7.1)
and find that if
% � �$������ (7.2)
then
��
���
�
�#
���� ������
�&
�#
�(7.3)
and
'
��� ���
���
��� ����
�&
�#
��
�#
��
�� &
&�
��
�� �(7.4)
where $ is the pack length and
' � �����$� (7.5)
is the dimensionless relaxation parameter. The outlet is at # � and the inlet at# � �. The system (7.3) and (7.4) is completely determined by a rate constant 'and a permeability function ���� or equivalent viscosity function ����.
We are dealing with dispersions of small gas bubbles that are spherical whennot crowded. It is usual to fit the viscosity function of equivalent dispersions ofsolid spheres with
����
����
���
�
(
���
(7.6)
23
where ( is a maximum packing fraction, � (, and " � is selected from data;" � � works well.
It is altogether different for gas bubbles at large � where stabilized bubbleswould change phase, first to wet and then to dry foams. To be consistent with thesolubility expression (2.14) we should seek a viscosity that increases continuallywith � from dilute dispersions with � � to dry foam with � � �; hence ( � �and " is to be determined. The viscosity function
���� ����
��� ���" �
says that dry foam has an infinite resistance to flow. Of course, the foam wouldbreak under pressure for dispersed fraction � near one; the gas bubbles would col-lapse with free gas channels percolating through the pack. We have a one parameterfamily of viscosity functions depending on the exponent ". After fitting our modelto the experimental data of Maini and Sarma [1994] we found that " � ��, whichat small � gives
���� � ����� � ���� � � � �� (7.7)
The value 11 is greater than the Einstein value " � �� for dilute dispersions ofsolid spheres possibly because of the additional increases in the viscosity of theliquid phase caused by the vaporization of dissolved gases; in other words, theviscosity of mixture increases because there is less dissolved and more dispersedgas.
It follows now that the system (7.3) and (7.4) is well characterized when theparameter ' and "
���� � ��� ��� (7.8)
are known. We have tried to fit the model predictions to the experiments with anearly best, but imperfect fit, when
" � �� ' � � (7.9)
In the next section we describe the experiments and compare the data with themodel prediction. Using the data given in section 6 we found that
' � ���� � ��� � (7.10)
Our data fitting gives ' � or � ����� �� sec.
24
8 Steady flow in a horizontal sandpack
Foamy oil is driven from a reservoir at saturation & � � at # � to anotherreservoir at the outlet pressure �� &� � ���� � �. Since ����� � for steadyflow, equation (7.3) implies that
�������� ���&
�#� ) � constant (8.1)
Equation (8.1) says that the oil velocity
���&
�#��� �� (8.2)
is a constant in steady flow, independent of # . Combining (8.1) and (7.4) we get
')
��� �����
�#�
�� &
&�
��
�� �(8.3)
Equations (8.1) and (8.3) are to be solved subject to the conditions that
& � �
& � &�
at # = 0
at # = 1
��
(8.4)
when ' �
& ��� �
�� � ���� ��&
�#�
�� ����#
��� � ���� ���(8.5)
and
� �
� � �� ��� &�
� � �� � ��&�
at # = 0
at # = 1
��
(8.6)
Elimination of �&��# in (8.1) then gives rise to the following quadrature
25
)# �
� �
�
�������� ����
�� � �� � �����(8.7)
The constant ) is then determined by the outlet pressure given by (8.6). The inte-gral in (8.7) can be done when ���� is given by (7.8).
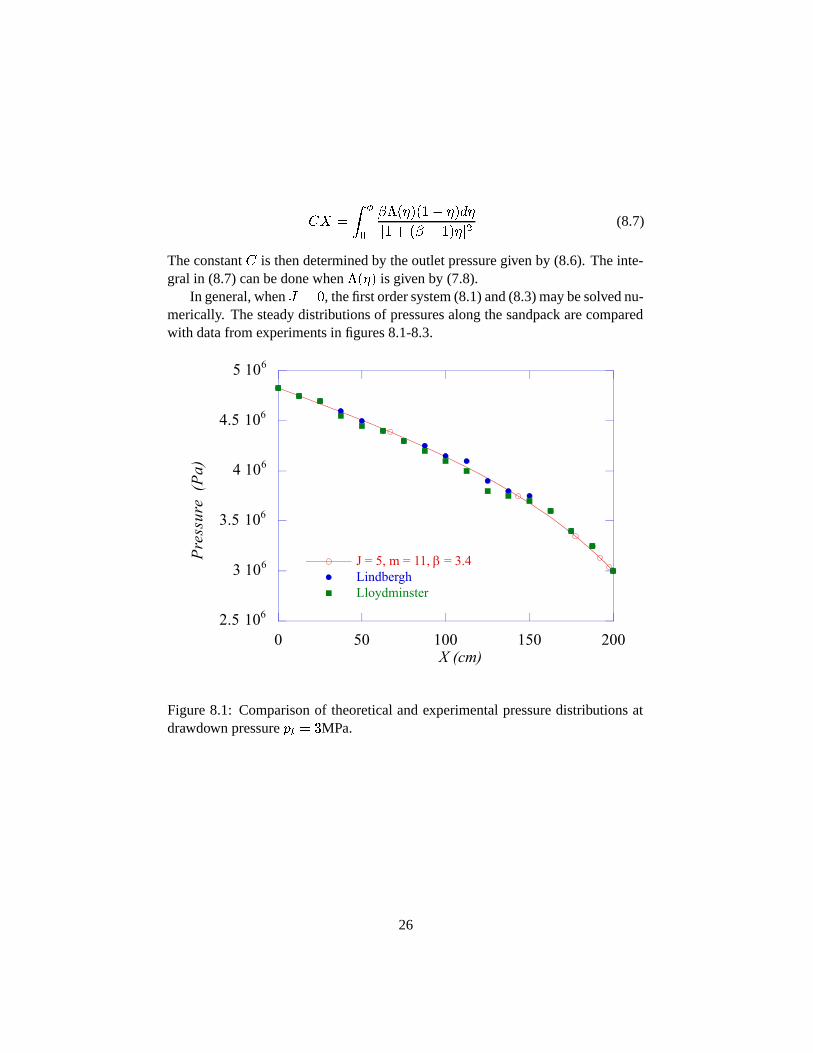
In general, when ' � , the first order system (8.1) and (8.3) may be solved nu-merically. The steady distributions of pressures along the sandpack are comparedwith data from experiments in figures 8.1-8.3.
2.5 106
3 106
3.5 106
4 106
4.5 106
5 106
0 50 100 150 200
J = 5, m = 11, β = 3.4Lindbergh Lloydminster
Pres
sure
(Pa
)
X (cm)
Figure 8.1: Comparison of theoretical and experimental pressure distributions atdrawdown pressure �� � �MPa.
26
0
1 106
2 106
3 106
4 106
5 106
0 50 100 150 200
J = 5, m = 11, β = 3.4Lindbergh Lloydminster
Pres
sure
(Pa
)
X (cm)
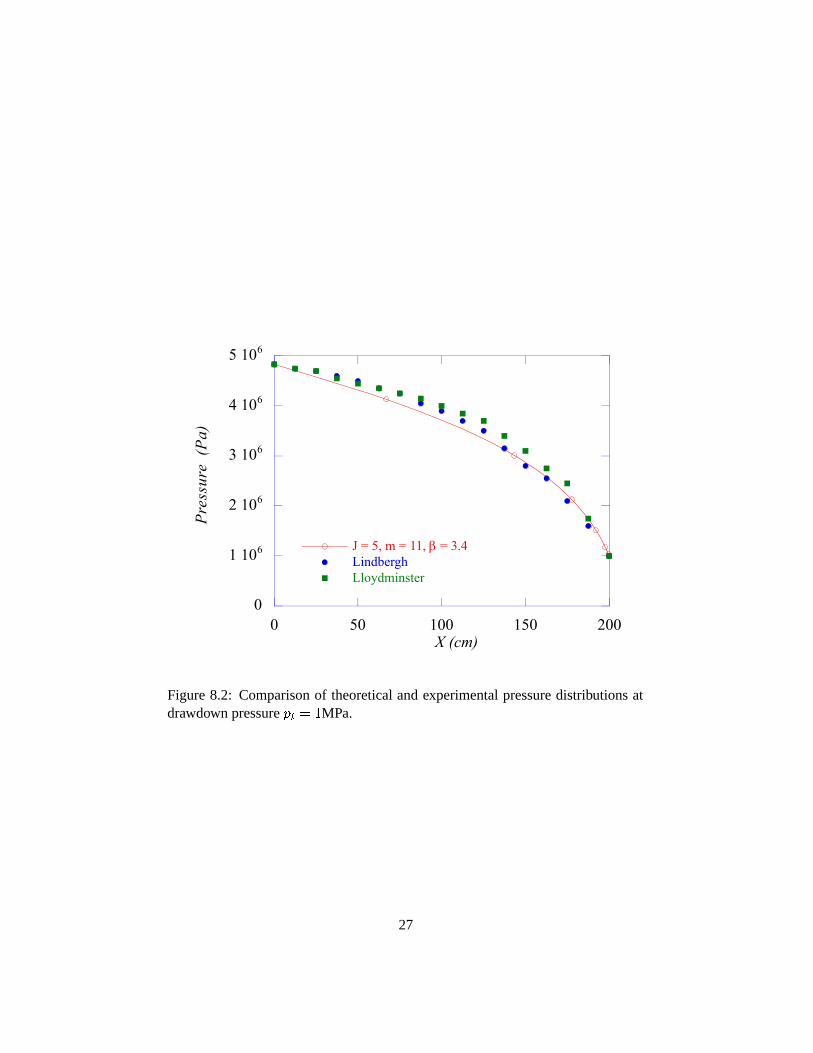
Figure 8.2: Comparison of theoretical and experimental pressure distributions atdrawdown pressure �� � �MPa.
27
0
1 106
2 106
3 106
4 106
5 106
0 50 100 150 200
J = 5, m = 11, β = 3.4Lindbergh Lloydminster
Pres
sure
(Pa
)
X (cm)
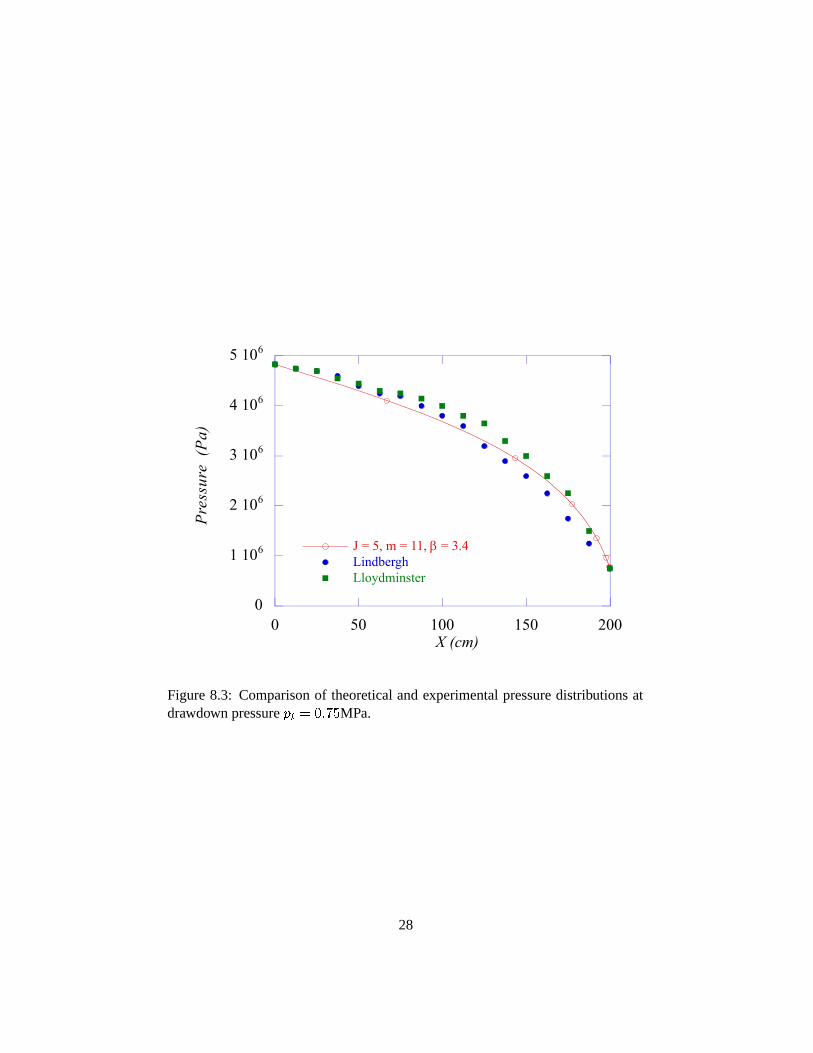
Figure 8.3: Comparison of theoretical and experimental pressure distributions atdrawdown pressure �� � �� MPa.
28
0
0.05
0.1
0.15
0.2
0.25
0 1 106 2 106 3 106 4 106 5 106
J = 5, m = 11, β = 3.4LloydminsterLindbergh
Oil
prod
uctio
n ra
te (
kg/d
ay)
Pressure drawdown (Pa)
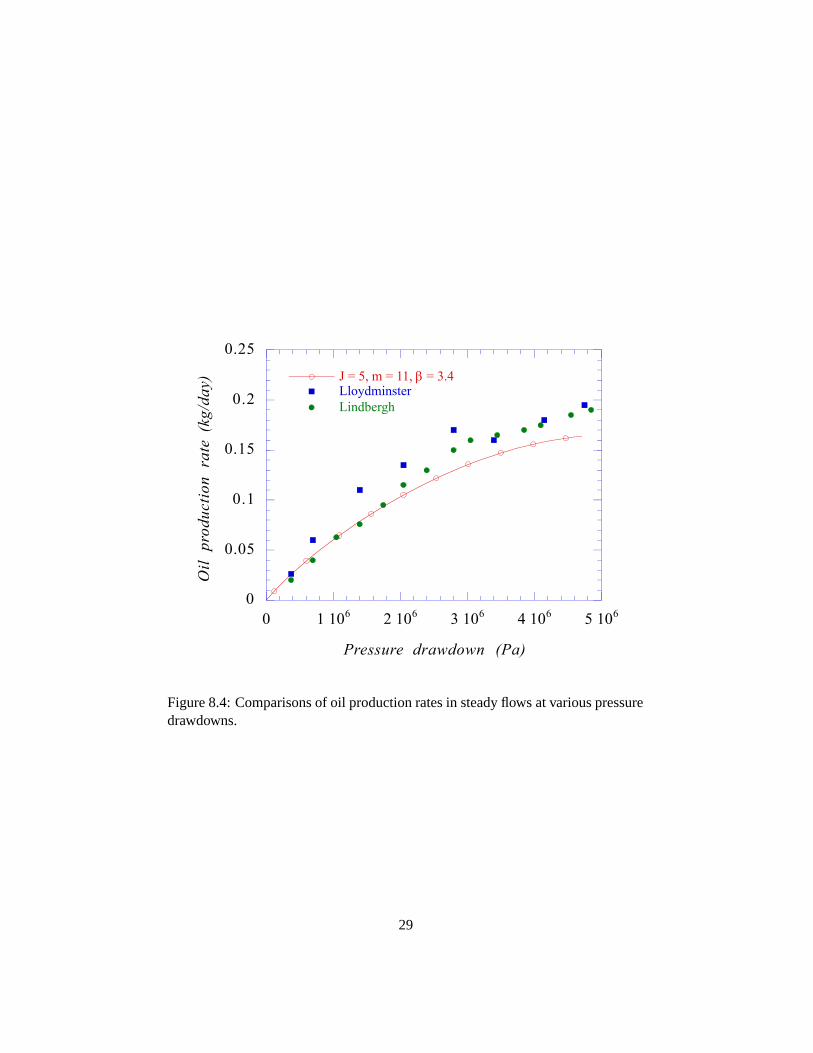
Figure 8.4: Comparisons of oil production rates in steady flows at various pressuredrawdowns.
29
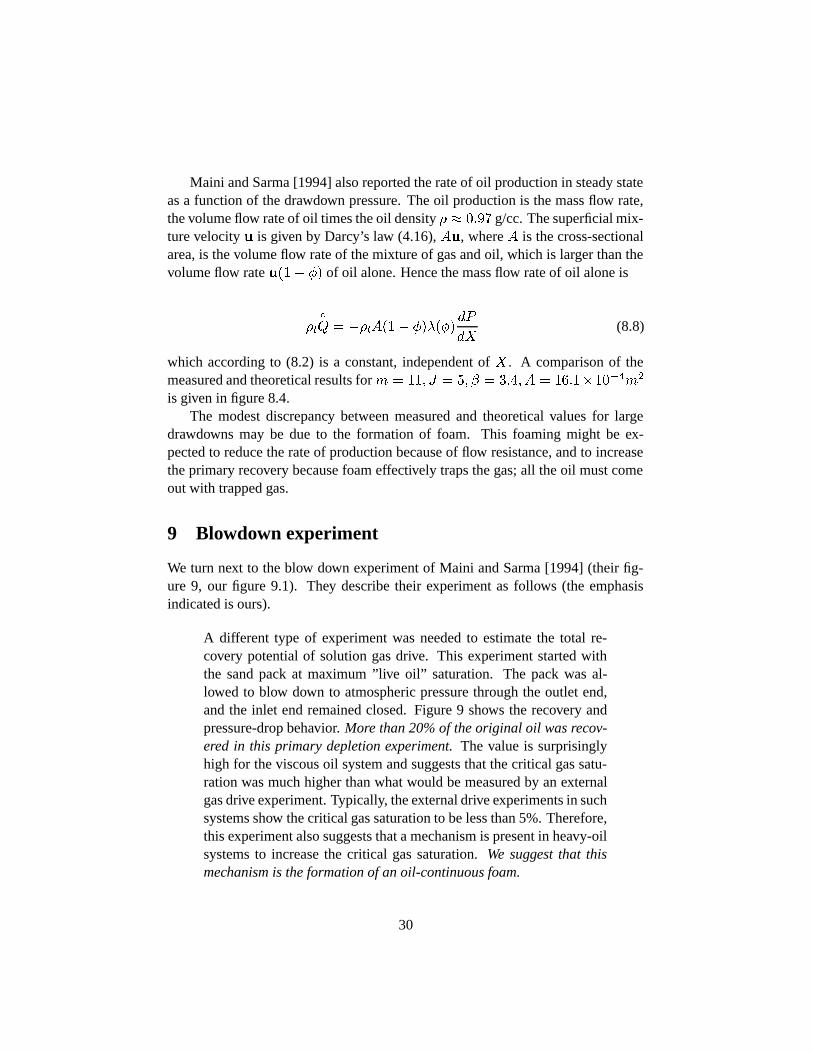
Maini and Sarma [1994] also reported the rate of oil production in steady stateas a function of the drawdown pressure. The oil production is the mass flow rate,the volume flow rate of oil times the oil density � � ��� g/cc. The superficial mix-ture velocity � is given by Darcy’s law (4.16), (�, where ( is the cross-sectionalarea, is the volume flow rate of the mixture of gas and oil, which is larger than thevolume flow rate ���� �� of oil alone. Hence the mass flow rate of oil alone is
��Æ
* � ���(��� �������&
�#(8.8)
which according to (8.2) is a constant, independent of # . A comparison of themeasured and theoretical results for " � �� ' � � � ��� ( � ��������"�
is given in figure 8.4.The modest discrepancy between measured and theoretical values for large
drawdowns may be due to the formation of foam. This foaming might be ex-pected to reduce the rate of production because of flow resistance, and to increasethe primary recovery because foam effectively traps the gas; all the oil must comeout with trapped gas.
9 Blowdown experiment
We turn next to the blow down experiment of Maini and Sarma [1994] (their fig-ure 9, our figure 9.1). They describe their experiment as follows (the emphasisindicated is ours).
A different type of experiment was needed to estimate the total re-covery potential of solution gas drive. This experiment started withthe sand pack at maximum ”live oil” saturation. The pack was al-lowed to blow down to atmospheric pressure through the outlet end,and the inlet end remained closed. Figure 9 shows the recovery andpressure-drop behavior. More than 20% of the original oil was recov-ered in this primary depletion experiment. The value is surprisinglyhigh for the viscous oil system and suggests that the critical gas satu-ration was much higher than what would be measured by an externalgas drive experiment. Typically, the external drive experiments in suchsystems show the critical gas saturation to be less than 5%. Therefore,this experiment also suggests that a mechanism is present in heavy-oilsystems to increase the critical gas saturation. We suggest that thismechanism is the formation of an oil-continuous foam.
30
We have already remarked that the solubility isotherm with � � ��� or 3.17leads to dispersed gas fractions of the order 0.93; foaming is inevitable.
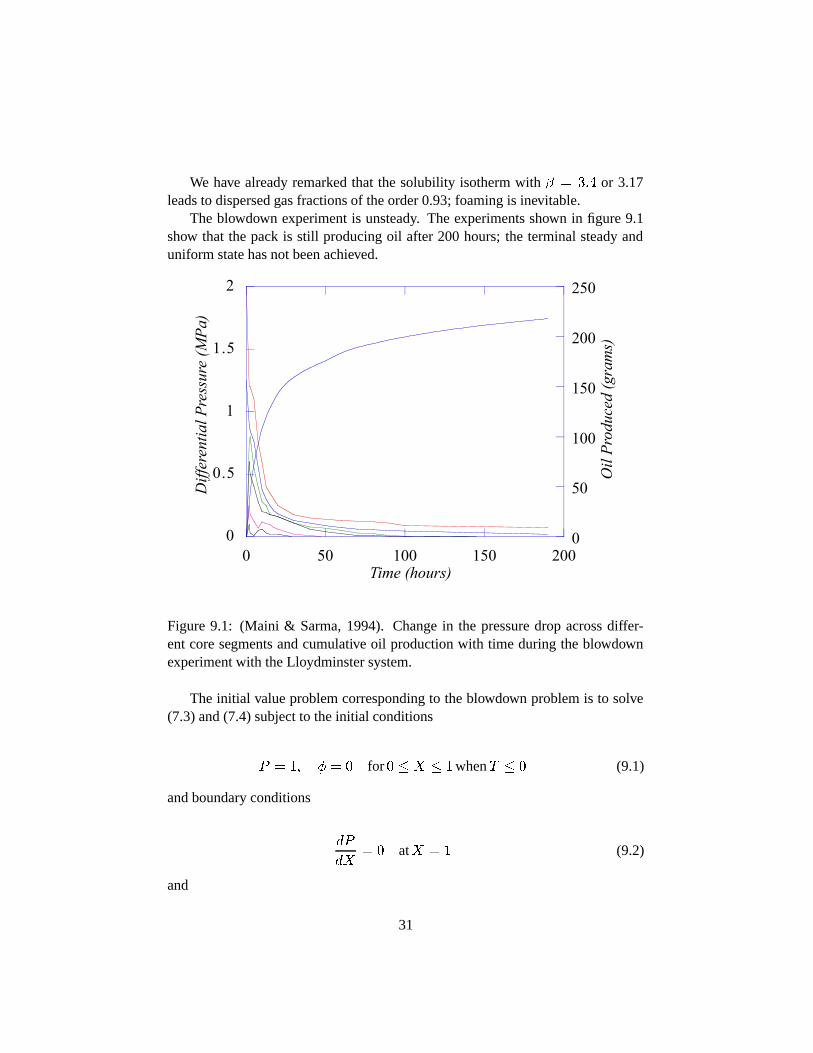
The blowdown experiment is unsteady. The experiments shown in figure 9.1show that the pack is still producing oil after 200 hours; the terminal steady anduniform state has not been achieved.
0
0.5
1
1.5
2
0
50
100
150
200
250
0 50 100 150 200
Diff
eren
tial P
ress
ure
(MPa
)
Oil
Prod
uced
(gra
ms)
Time (hours)
Figure 9.1: (Maini & Sarma, 1994). Change in the pressure drop across differ-ent core segments and cumulative oil production with time during the blowdownexperiment with the Lloydminster system.
The initial value problem corresponding to the blowdown problem is to solve(7.3) and (7.4) subject to the initial conditions
& � � � � for # �when� (9.1)
and boundary conditions
�&
�#� at# � � (9.2)
and
31
& � &����+���� at# � (9.3)
where +��� is unit step function �� � ��MPa, � � ����MPa, &� � ���� ��� � The integration of these equations was carried by numerical methods.
The cumulative production may be obtained as the integral over time of the rateof production
��*��� � ��
� �
�
Æ
*��� �� (9.4)
where
Æ
* � ( ���� �� �&��# (9.5)
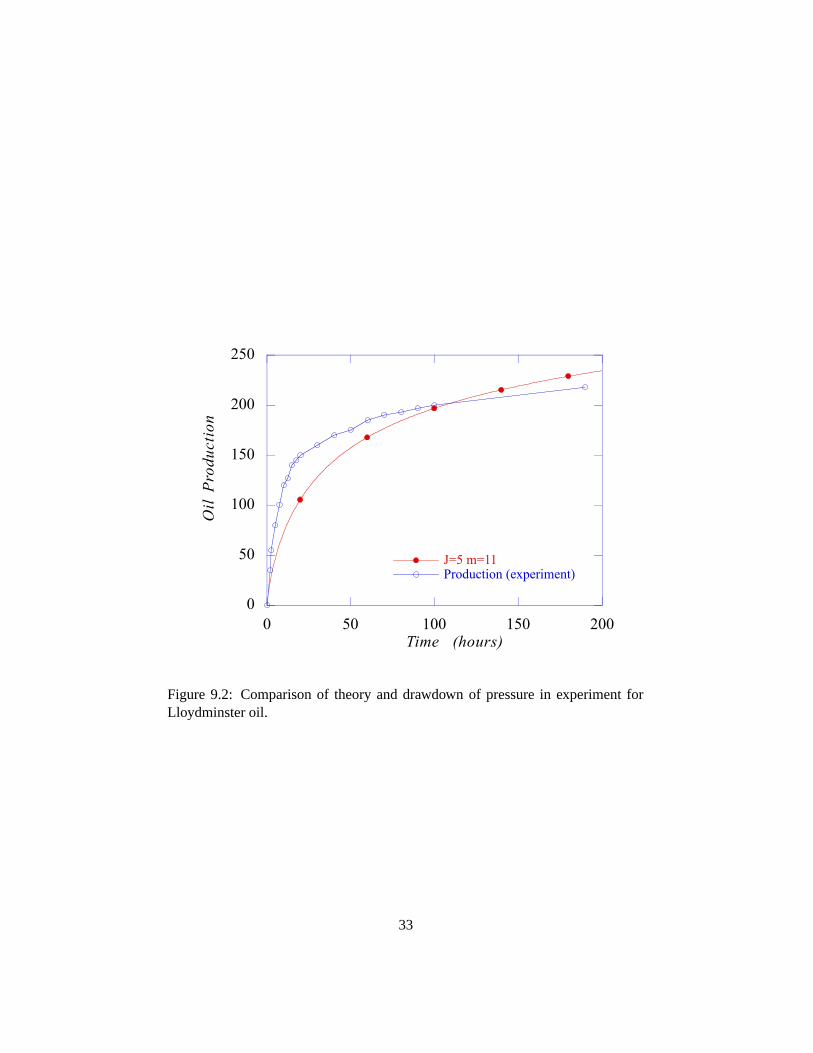
is evaluated at # � , the open end of the sandpack. A comparison of the modelpredition with " � �� and ' � and the experiment are shown in figure 9.2.The values " � �� ' � were selected for a best fit for the steady pressuredistributions given in figure 8.1 through 8.3, the rate of production in steady flowgiven in figure 8.4 and the comparison of theory and experiment in drawdown givenin figure 9.2.
32
0
50
100
150
200
250
0 50 100 150 200
J=5 m=11Production (experiment)
Oil
Prod
uctio
n
Time (hours)
Figure 9.2: Comparison of theory and drawdown of pressure in experiment forLloydminster oil.
33
0
5 105
1 106
1.5 106
2 106
2.5 106
3 106
3.5 106
0 50 100 150 200
segment 1segment 2segment 3segment 4segment 5segment 6
Pres
sure
(Pa
)
Time (hour)
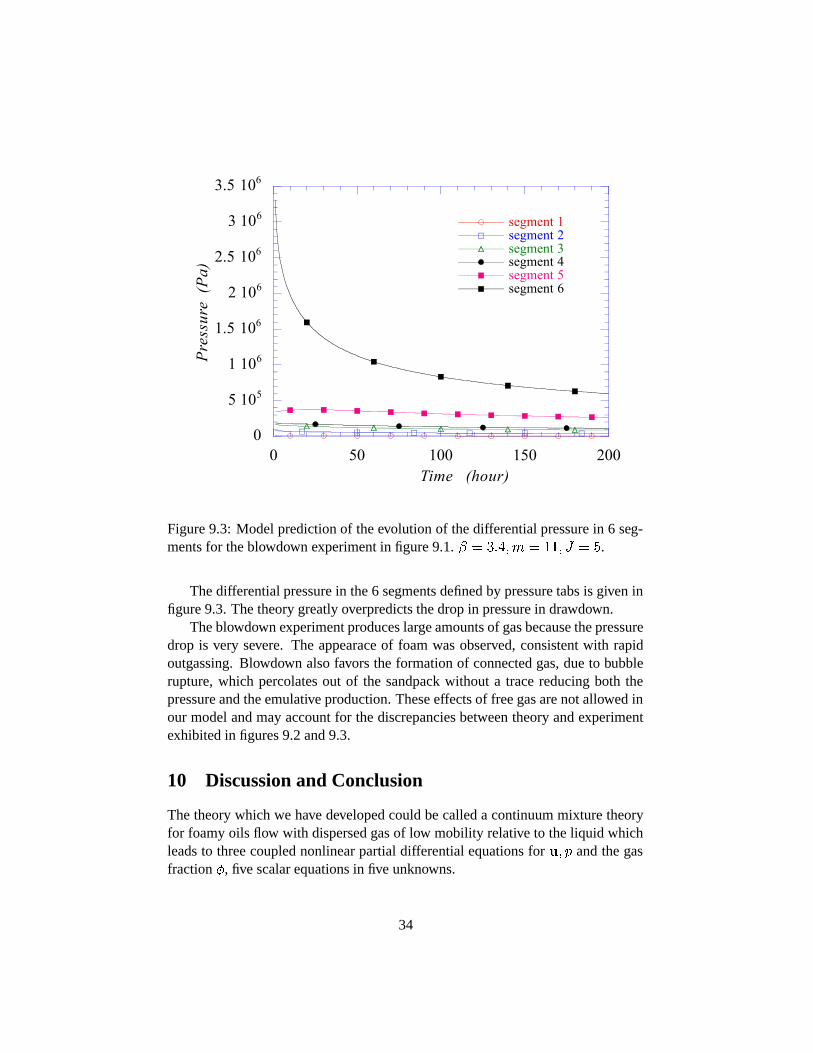
Figure 9.3: Model prediction of the evolution of the differential pressure in 6 seg-ments for the blowdown experiment in figure 9.1. � � ���" � �� ' � .
The differential pressure in the 6 segments defined by pressure tabs is given infigure 9.3. The theory greatly overpredicts the drop in pressure in drawdown.
The blowdown experiment produces large amounts of gas because the pressuredrop is very severe. The appearace of foam was observed, consistent with rapidoutgassing. Blowdown also favors the formation of connected gas, due to bubblerupture, which percolates out of the sandpack without a trace reducing both thepressure and the emulative production. These effects of free gas are not allowed inour model and may account for the discrepancies between theory and experimentexhibited in figures 9.2 and 9.3.
10 Discussion and Conclusion
The theory which we have developed could be called a continuum mixture theoryfor foamy oils flow with dispersed gas of low mobility relative to the liquid whichleads to three coupled nonlinear partial differential equations for � � and the gasfraction �, five scalar equations in five unknowns.
34
We derived an equation of state (called an equilibrium isotherm) for foamy oil.This equation gives the volume fraction of dispersed gas at a given temperature andpressure at equilibrium for the situation in which the gas that comes from releasingdisolved gas remains dispersed. This equation depends on only one material co-efficient, a function of the temperature which can be obtained from measurementin a PVT cell. Such measurements were made and yielded only modestly differ-ent values of the coefficient for two Canadian and one Venezuelan crude oils. Theempirically based equation of state avoids constitutive hypotheses about nucleationand bubble growth, which are implicit in the measured equilibrium values of thevolume fraction of dispersed gas. The derivation and application of equilibriumisotherms is one of the principal contributions of this paper.
Another contribution is the development of a flow description for foamy oilwhose center pieces are a continuity equation for the bubbly mixture, Darcy’s lawand a relaxation equation for the equilibrium isotherm. The relaxation equationdepends on a to-be-determined rate constant which allows for delay in the growthof the gas fraction � to a change of pressure expressing the idea that it takes timefor bubbles to nucleate and grow. It is possible that the pressure also relaxes, butthe modeling of pressure relaxation would introduce another rate constant and isleft for future work.
The mobility function ���� which appears in Darcy’s law must also be mod-eled. The mobility function for our model is the measured permeability of theporous media over the to-be-determined effective viscosity of the mixture.
The modeling of the viscosity of the mixture as a function of the dispersed gasis very difficult and we have no guidelines from the literature. Our model, whichdepends only on the dispersed gas fraction, makes no formal distinction betweenbubbly mixture and the foam that arises inevitably under the kind of severe de-pressurization seen in the Maini-Sarma blowdown experiments. The range of thedispersed gas fraction is from � � , in which the oil is saturated with dissolvedgases, to � � � which can be interpreted as a super-dry foam. The viscosity ofthe foam ought to be much greater than the bubbly mixture but less great than con-centrated dispersions of solids that can’t move at all when they are closely packed.An additional complication in the modeling of the viscosity is that the viscosityof the liquid increases rather sharply when gas is released; its like lowering thefraction of water in a glycerin and water mixture. So the viscosity of the mixtureincreases both because of the presence of more bubbles and because the continuousliquid-phase viscosity also increases.
We related our flow description to the conventional description of two-phaseflow in porous media using the concept of relative permeability. We write downall the usual equations with the caveat that the mobility function for each phase isexpressed in terms of an effective viscosity rather than a relative permeability; for
35
the gas we have
����� ������
��
�����(10.1)
where � is permeability, �� is relative permeability, �� is gas viscosity, and �����is effective gas viscosity. Of course, we have done nothing but change the namesof symbols, but our concept is closer to mixture theory in which we describe flowproperties of fluid phases in a porous media of fixed properties independent of thefluid and flow. Moreover, our effective viscosities can be directly related to themeasured values of the mixture viscosity
���� �
��
������
�
�����
���
(10.2)
where ����� is the effective viscosity of the liquid phase.Our mixture theory arises as a rigorous consequence of the conventional theory
under the assumption that the average velocities of dispersed gas and liquid areidentical and in this case we get explicit
����� �����
�(10.3)
����� �����
��� ��(10.4)
relating effective viscosity of the phases to the effective viscosity of the mixture.In addition we find that
������
��� �
�
����
(10.5)
relating the ratio of relative permeabilities to the ratio of molecular viscosities.We applied our theory to the sandpack experiments of Maini & Sarma [1994],
backing out the rate constant and mixture viscosity function to fit data. The viscos-ity function was selected in the frequently used form
���� � �����
���
��
��
(10.6)
36
where �� is the maximum packing fraction. �� is a perfectly clear concept forsolid spheres and might be considered for bubbly mixtures. But if our bubblymixtures foam we can get dispersed gas all the way to � � �, hence �� � �.Our equilibrium isotherm also allows for a full range of dispersed gas fractions � � up to dry foams. We then look for a single continuous expressionfor ���� in the form (10.6) with �� � �. We think that dry foams are rigidunless riding on a liquid layer, which is not easily formed in a porous media; hence������ as �� �.
In the dilute limit
����� ����� �"��� (10.7)
In foamy oil " should be larger than the Einstein value 2.5 because of the addedviscosity increase of the continuous oil phase due to the release of dissolved gas.
We backed out a viscosity function by fitting, finding " � �� together with arelaxation time corresponding to a dimensionless time ' � . With these values weachieved some good agreements between the sandpack model prediction and datafor steady flow but with larger discrepancies in blowdown experiments in whichdispersed gas probably percolated into free gas.
We think that this comparison of model and experiment establishes a directionfor model building using the average velocity of phases, the pressure and volumefraction of dispersed gas as primitive variables. It is possible for the dispersed gasto move relative to the oil without forming connected gas through coalescence andpercolation. To describe such a condition we would need to consider momentumand mass balances of the two phases, but the description could be formed with sameset of primitive variables, replacing constitutive equations for nucleation, bubblegrowth and possibly some coalescence, with relaxation of equilibrium isothermsfrom PVT data.
Our model has limitations; it only applies for small bubbles, but not too smalleither. Since monitoring of bubble size in porous medium is hard to do, or evenpresently impossible, there is no way of knowing whether the assumptions thatwe made are valid. The results seem to indicate that they might be. Models, likethe one proposed here, should be tested against more data particularly against datafrom producing fields. For production the conditions for the breakdown of modelsthat work when all the gas is dispersed due to the formation of connected gas iseven more important than the models themselves.
37
Acknowledgement. The work of D.D. Joseph was supported in part by the DOE(Engineering Research Program of the Department of Basic Energy Sciences), theNSF under Grant Opportunities for Academic Liasons with Industry and the Min-nesota Supercomputer Institute. We are indebted to Prof. G.I. Barenblatt for pro-viding us with a translation of the prescient work of Leibenson [1941] and forcalling our and the reader’s attention to the possibility that gas release in reservoirscould be quite different than in a PVT cell or even in a sandpack.
References
1. Claridge, E.L. and Prats, M. June 19-21, 1995. “A Proposed Model and Mechanismfor Anomalous Foamy Heavy Oil Behavior,” paper SPE 29243 presented at theInternational Heavy Oil Symposium, Calgary, AB Proc., 9-20; also the unsolicitedmanuscript of SPE (USMS) 29243, 1994.
2. Firoozabadi, A., Ottesen, B., & Mikkelsen, M. December 1992. “Measurement ofSupersaturation and Critical Gas Saturation”, SPE Formation Evaluation, 337–344.
3. Huerta, M., Otero, C., Rico, A., Jimenez, I., De Mirabal, M. & Rojas, G., October 6-9,1996. “Understanding Foamy Oil Mechanisms for Heavy Oil Reservoirs during Pri-mary Production”, paper SPE 36749, presented at the 1996 SPE Annual TechnicalConference and Exhibition, Denver, Colorado, 671–685.
4. Joseph, D.D., A.M. Kamp and R. Bai 2002. “Foamy Oil Flow in Porous Media,” Con-finement and Remediation of Environmental Hazards and Resource Recovery, Inst.Math. Applications, Vol # J. Chadam, A. Cunningham, R.E. Ewing, P. Ortoleva, M.Wheeler, Eds. Springer-Verlag. To appear.
5. Joseph, D.D. and Y. Renardy 1992. Fundamentals of Two-Fluid Dynamics, Vol. I:Mathematical Theory and Applications, Vol. II: Lubricated Transport, Drops andMiscible Liquids, Springer.
6. Kraus, W.P., McCaffrey, W.J., & Boyd, G.W. 1993. “Pseudo-Bubble Point Model forFoamy Oils,” paper CIM 93-94 presented at the 44th Annual Technical Conferenceof the Petroleum Society of CIM, Calgary, AB, May 9-12.
7. Lebel, J.P. March 2, 1994. ”Performance implications of various reservoir access geo-metrics”, Paper presented at the 11�� Annual Heavy Oil & Oil Sands Tech. Symp..
8. Leibenson, L.S., 1941. “The motion of gas-saturated fluid in a porous media. Bulletin,”USSR Acad. Science, Ser. Geography & Geophysics, No. 3.
9. Maini, B.B., June 1996. “Foamy Oil Flow in Heavy Oil Production,” JCPT 35(6),21-24.
10. Maini B.B. & Sarma, H. 1994. “Role of Nonpolar Foams in Production of Heavy Oils,”in: “Advances in Chemistry Series” 242: 405–420.
38
11. De Mirabal, M., Gordillo, R., Fuenmayor, M., Rojas, G., Rodriguez H. & Sanchez, R.April 23–26, 1996. “Integrated Study for the Characterization and Development ofthe MFB-53 Reservoir, North Hamaca-Orinoco Belt, Venezuela”, paper SPE 36095,presented at the Fourth Latin American & Caribbean Petroleum Engineering Con-ference, Port-of-Spain, Trinidad & Tobago.
12. Mastmann, M., Moustakis, M. & Bennion, D.B. 2001. “Predicing foamy oil recovery,”SPE 68860, SPE Western Regional meeting held in Bakersfield, CA, 26-30 March2001.
13. Peng, D.Y., Fu, C.T., Bird, G.W. & Hsi, C., August, 4-9, 1991. “Effect of Gas com-ponents on thermodynamic properties of Alberta Heavy Crudes and Bitumens,” in:5th Unitar Heavy Crude & Tar Sands International Conference, Caracas, Venezuela,Proc. 1: 47-55.
14. Pooladi-Darvish M. & Firoozabadi, A. June 11, 1997. “Solution gas drive in heavy oilreservoirs”, paper no. 97-113, presented at the 48th Annual Technical meeting ofthe Petroleum Society of CIM in Calgary, Canada.
15. Sheng, J.J., Hayes, R.E., Maini A.B. & Tortike, W.S. 1996. “A dynamic model tosimulate foamy oil flow in porous media,” SPE 36750.
16. Sheng, J.J., Maini, B.B., Hayes R.E. & Tortike, W.S. May 1999a. “Critical Review offoamy Oil Flow”, Transport in Porous Media, 35(2), 157-187.
17. Sheng, J.J., Hayes, R.E., Maini, B.B. & Tortike, W.S. May 1999b. “Modeling FoamyOil Flow in Porous Media”, Transport in Porous Media, 35(2), 227-258.
18. Svrcek, W.Y. & Mehrotra, A.K. 1982. “Gas solubility, viscosity and density measure-ments for Athabasca bitumen,” J. Canadian Petroleum Technology, 21(4), 31–38.
39