modeling of hvdc tie-links and their utilization in agc/lfc...
TRANSCRIPT

0278-0046 (c) 2018 IEEE. Personal use is permitted, but republication/redistribution requires IEEE permission. See http://www.ieee.org/publications_standards/publications/rights/index.html for more information.
This article has been accepted for publication in a future issue of this journal, but has not been fully edited. Content may change prior to final publication. Citation information: DOI 10.1109/TIE.2018.2835387, IEEETransactions on Industrial Electronics
IEEE TRANSACTIONS ON INDUSTRIAL ELECTRONICS
Abstract— This paper presents the accurate modeling of HVDC links for the dynamic studies of automatic generation control/load frequency control (AGC/LFC) of multi-area interconnected power system. In earlier AGC studies, HVDC links were simply modeled by using the first-order transfer function with system time constant 𝑻𝒅𝒄. It was argued that 𝑻𝒅𝒄 is the time required by HVDC links to establish DC current after following a load disturbance in power system. However, no mathematical or analytical justification was provided in support to the existing transfer function model of HVDC links. This paper presents the accurate modeling of HVDC links for AGC studies. The comparative analysis has also been performed to demonstrate error being accrued due to the use of conventional model of HVDC links. Furthermore, this paper also implements the inertia emulation based control (INEC) strategy in AGC which allows to harness the stored energy from the capacitance of HVDC links for AGC operations.
Index Terms— Automatic generation control, AC−DC
interconnections and discrete supplementary controllers.
I. NOMENCLATURE
𝑖 & 𝑗 Index referred to areas (𝑖 & 𝑗 = 1, 2, 3,…)
∆𝑓 & ∆𝑃𝑡𝑖𝑒 Frequency and tie-line power deviations
∆𝑃𝑔 Change in generator power output
𝑃𝑟 Rated area capacity
𝐵 Frequency bias factor
𝑅 Speed regulation parameter
𝑇𝑝 & 𝐾𝑝 Power system time constant and gain constant
𝑇𝑆𝐶 Steam chest time constant
𝑇𝑅𝐻 & 𝐾𝑅𝐻 Reheater time constant and gain constant
𝑇𝑖𝑗 Synchronizing coefficient of tie-line
𝑎𝑖𝑗 Area capacity ratio (−𝑃𝑟𝑖 𝑃𝑟𝑗 )
Manuscript received August 09, 2017; revised November 13, 2017,
January 05, 2018 and February 17, 2018; accepted March 26, 2018. (Corresponding author: Nikhil Pathak)
N. Pathak, A. Verma and T.S. Bhatti are with the Centre for Energy Studies, Indian Institute of Technology Delhi, New Delhi, India (e-mail: [email protected]; [email protected]; [email protected]) .
I. Nasiruddin is with the Department of Electrical Engineering, College of Engineering, Qassim University, Buraidah 51452, Saudi Arabia, on leave from Jamia Millia Islamia University, New Delhi, India-
110025. (e-mail: [email protected])
II. INTRODUCTION
HE power system frequency is maintained to its nominal
value by nullifying the power mismatch between active
power generation and load demand using AGC. Numerous studies have been conducted so far upon multi-area
interconnected thermal power systems considering non-reheat
as well as reheat turbines [1−4]. The power system
nonlinearities, such as, generation rate constraints (GRCs),
governor dead-band effects were also considered [5]. The
various meta-heuristic algorithms, such as, genetic, particle
swarm optimization, bacterial foraging and harmonic search
etc., were also developed for the optimization of
supplementary controller gains [6−8]. The studies were
further carried out for different loading conditions of power plants. It was discovered that power system model parameters,
namely, turbine time constants (𝑇𝑡 ), power system time and
gain constants (𝑇𝑝 & 𝐾𝑝 ), frequency bias factor (𝐵) also varies
along with power system loading conditions and significantly
affects the system dynamics [9]. The studies were further
extended to discrete supplementary control of AGC system.
The sampling period of 2s was selected for discrete AGC controllers [10].
Nowadays, drastic increase of load demand in power system
areas raised the necessity of increasing inter-area power
transfer capabilities. The HVDC links are being added in
parallel to existing AC links to increase the power transfer
capacity of tie-links. Recently, lot of researchers studied the
effect of HVDC links on the dynamic of performance of AGC
system [11−17]. In these studies, HVDC links were simply
represented by first-order transfer function with time constant
and gain constant 𝑇𝑑𝑐 & 𝐾𝑑𝑐 , respectively. It was stated that
𝑇𝑑𝑐 is the time taken by HVDC system to establish DC current
after having a small load perturbation. Furthermore, the value
of 𝐾𝑑𝑐 was selected so that the system exhibits improved
dynamic performance. Furthermore, HVDC links were also
studied in transient stability studies of power systems, such as,
line faults analysis, large power system load disturbances etc.
The INEC strategy was developed to utilize the capacitive
stored energy of HVDC links during sudden load changes and
line faults. The non-linear models of INEC were developed for
these transient stability studies. In [18], INEC strategy was implemented upon a small system comprising of offshore
wind farm at one end of HVDC link and a single synchronous
generator on the other end. The study was further extended in
which the INEC strategy was combined with the control
strategy utilizing inertial response of wind turbines in order to
Modeling of HVDC Tie-Links and Their Utilization in AGC/LFC Operations of Multi-
Area Power Systems Nikhil Pathak, Student Member, IEEE, Ashu Verma, Senior Member, IEEE, T.S. Bhatti
and Ibraheem Nasiruddin
T
0278-0046 (c) 2018 IEEE. Personal use is permitted, but republication/redistribution requires IEEE permission. See http://www.ieee.org/publications_standards/publications/rights/index.html for more information.
This article has been accepted for publication in a future issue of this journal, but has not been fully edited. Content may change prior to final publication. Citation information: DOI 10.1109/TIE.2018.2835387, IEEETransactions on Industrial Electronics
IEEE TRANSACTIONS ON INDUSTRIAL ELECTRONICS
support primary frequency control [19]. The INEC strategy
was also implemented upon HVDC system comprising of
various industrial loads, such as, induction motor, resistive
load, diode rectifier load etc [20]. In this study, vector control
or d-q control was utilized to control the voltage level of VSC-
HVDC links. The same control strategy was also implemented
upon multi-terminal HVDC systems [21, 22]. The frequency
support capability HVDC system based on INEC strategy was
also studied [23−25]. Based on literature survey, following
research gaps have been found and addressed in this paper:
1) No mathematical or analytical procedure was provided in
support to the existing first-order transfer function model of
HVDC links. Furthermore, no guidelines were given in order
to calculate model parameter values of HVDC links. This
paper fulfills the aforementioned research gaps and presents
the modeling of HVDC links in AGC studies. For the first
time, transfer function model of HVDC link has been derived
mathematically with proper physical as well as analytical
justifications. The comparative analysis has also been carried out with existing model of HVDC links to demonstrate the
error being accrued in AGC studies due to the use of
conventional model of HVDC links.
2) The INEC strategy has been widely used in various
transient stability studies of power systems to utilize the stored
energy of HVDC links as well as other energy storage devices.
This paper implements the same INEC strategy in AGC for
frequency support applications. The linearized model of INEC
strategy has been developed to utilize the stored energy of
HVDC links in AGC operations. Alongside physical as well as
analytical justifications, INEC control strategy has been successfully implemented upon two-area reheat thermal power
systems interconnected via parallel AC−DC links.
III. MODELING OF HVDC LINKS FOR AGC SYSTEM
This section presents the accurate modeling of HVDC links
in AGC system. The conventional model of HVDC link has
also been discussed. These studies are as follows:
A. Conventional Model of HVDC Links:
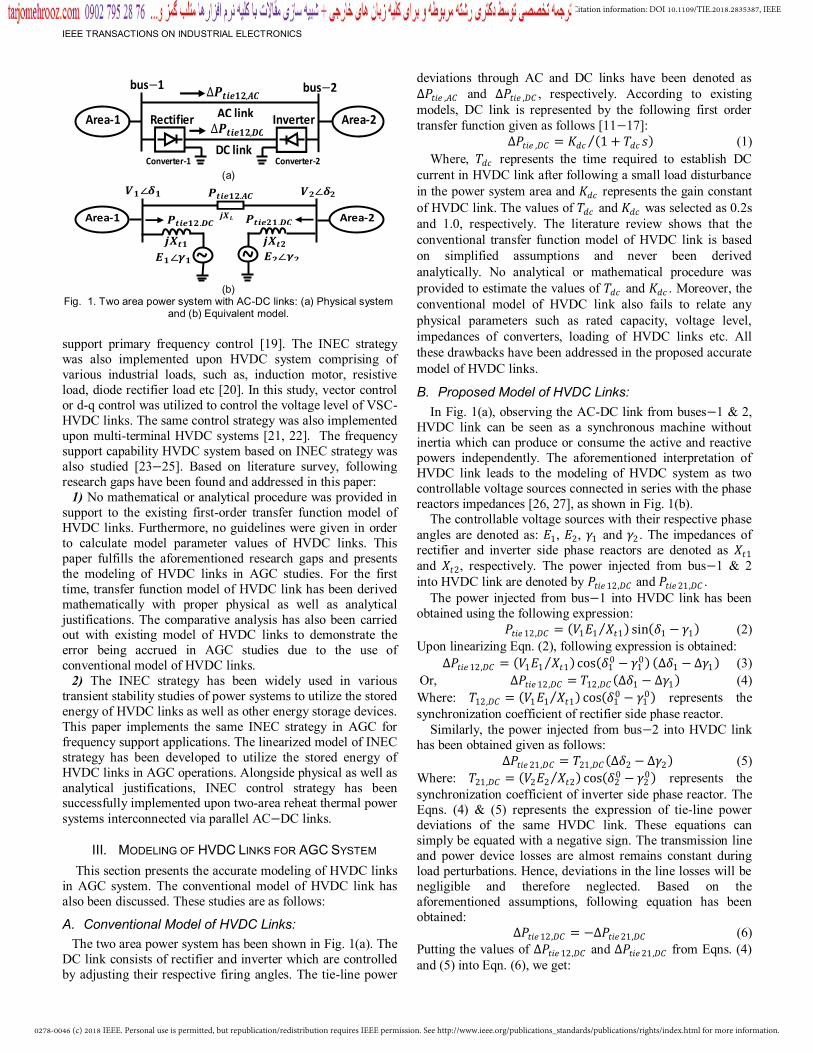
The two area power system has been shown in Fig. 1(a). The
DC link consists of rectifier and inverter which are controlled
by adjusting their respective firing angles. The tie-line power
deviations through AC and DC links have been denoted as
∆𝑃𝑡𝑖𝑒 ,𝐴𝐶 and ∆𝑃𝑡𝑖𝑒 ,𝐷𝐶 , respectively. According to existing
models, DC link is represented by the following first order
transfer function given as follows [11−17]:
∆𝑃𝑡𝑖𝑒 ,𝐷𝐶 = 𝐾𝑑𝑐 1 + 𝑇𝑑𝑐 𝑠 (1)
Where, 𝑇𝑑𝑐 represents the time required to establish DC
current in HVDC link after following a small load disturbance
in the power system area and 𝐾𝑑𝑐 represents the gain constant
of HVDC link. The values of 𝑇𝑑𝑐 and 𝐾𝑑𝑐 was selected as 0.2s
and 1.0, respectively. The literature review shows that the
conventional transfer function model of HVDC link is based
on simplified assumptions and never been derived
analytically. No analytical or mathematical procedure was
provided to estimate the values of 𝑇𝑑𝑐 and 𝐾𝑑𝑐 . Moreover, the
conventional model of HVDC link also fails to relate any
physical parameters such as rated capacity, voltage level,
impedances of converters, loading of HVDC links etc. All
these drawbacks have been addressed in the proposed accurate
model of HVDC links.
B. Proposed Model of HVDC Links:
In Fig. 1(a), observing the AC-DC link from buses−1 & 2,
HVDC link can be seen as a synchronous machine without
inertia which can produce or consume the active and reactive
powers independently. The aforementioned interpretation of
HVDC link leads to the modeling of HVDC system as two
controllable voltage sources connected in series with the phase
reactors impedances [26, 27], as shown in Fig. 1(b).
The controllable voltage sources with their respective phase
angles are denoted as: 𝐸1, 𝐸2, 𝛾1 and 𝛾2 . The impedances of
rectifier and inverter side phase reactors are denoted as 𝑋𝑡1
and 𝑋𝑡2, respectively. The power injected from bus−1 & 2
into HVDC link are denoted by 𝑃𝑡𝑖𝑒 12,𝐷𝐶 and 𝑃𝑡𝑖𝑒 21,𝐷𝐶 .
The power injected from bus−1 into HVDC link has been
obtained using the following expression:
𝑃𝑡𝑖𝑒 12,𝐷𝐶 = 𝑉1𝐸1 𝑋𝑡1 sin 𝛿1 − 𝛾1 (2)
Upon linearizing Eqn. (2), following expression is obtained:
∆𝑃𝑡𝑖𝑒 12,𝐷𝐶 = 𝑉1𝐸1 𝑋𝑡1 cos 𝛿10 − 𝛾1
0 ∆𝛿1 − ∆𝛾1 (3)
Or, ∆𝑃𝑡𝑖𝑒 12,𝐷𝐶 = 𝑇12,𝐷𝐶 ∆𝛿1 − ∆𝛾1 (4)
Where: 𝑇12,𝐷𝐶 = 𝑉1𝐸1 𝑋𝑡1 cos 𝛿10 − 𝛾1
0 represents the
synchronization coefficient of rectifier side phase reactor.
Similarly, the power injected from bus−2 into HVDC link
has been obtained given as follows:
∆𝑃𝑡𝑖𝑒 21,𝐷𝐶 = 𝑇21,𝐷𝐶 ∆𝛿2 − ∆𝛾2 (5)
Where: 𝑇21,𝐷𝐶 = 𝑉2𝐸2 𝑋𝑡2 cos 𝛿20 − 𝛾2
0 represents the
synchronization coefficient of inverter side phase reactor. The
Eqns. (4) & (5) represents the expression of tie-line power
deviations of the same HVDC link. These equations can
simply be equated with a negative sign. The transmission line
and power device losses are almost remains constant during
load perturbations. Hence, deviations in the line losses will be
negligible and therefore neglected. Based on the
aforementioned assumptions, following equation has been
obtained:
∆𝑃𝑡𝑖𝑒 12,𝐷𝐶 = −∆𝑃𝑡𝑖𝑒 21,𝐷𝐶 (6)
Putting the values of ∆𝑃𝑡𝑖𝑒 12,𝐷𝐶 and ∆𝑃𝑡𝑖𝑒 21,𝐷𝐶 from Eqns. (4)
and (5) into Eqn. (6), we get:
(a)
(b)
Fig. 1. Two area power system with AC-DC links: (a) Physical system and (b) Equivalent model.
Rectifier Inverter
bus−2 bus−1
DC link
AC link ∆𝑷𝒕𝒊𝒆𝟏𝟐,𝑫𝑪
∆𝑷𝒕𝒊𝒆𝟏𝟐,𝑨𝑪
Area-1 Area-2
Converter-1 Converter-2
𝑽𝟏∠𝜹𝟏
𝑷𝒕𝒊𝒆𝟐𝟏,𝑫𝑪 𝑷𝒕𝒊𝒆𝟏𝟐,𝑫𝑪
𝑷𝒕𝒊𝒆𝟏𝟐,𝑨𝑪 𝑽𝟐∠𝜹𝟐
𝑬𝟐∠𝜸𝟐 𝑬𝟏∠𝜸𝟏
𝒋𝑿𝒕𝟐 𝒋𝑿𝒕𝟏
𝒋𝑿𝑳 Area-1 Area-2

0278-0046 (c) 2018 IEEE. Personal use is permitted, but republication/redistribution requires IEEE permission. See http://www.ieee.org/publications_standards/publications/rights/index.html for more information.
This article has been accepted for publication in a future issue of this journal, but has not been fully edited. Content may change prior to final publication. Citation information: DOI 10.1109/TIE.2018.2835387, IEEETransactions on Industrial Electronics
IEEE TRANSACTIONS ON INDUSTRIAL ELECTRONICS
𝑇12,𝐷𝐶 ∆𝛿1 − ∆𝛾1 = −𝑇21,𝐷𝐶 ∆𝛿2 − ∆𝛾2 (7)
To transmit the tie-line power from one area to the other via
HVDC links, it is essential that both side converters are well
synchronized. In other words, it can be stated that the change
in rectifier‟s phase angle (∆𝛾1) must be equal to the change in
inverter‟s phase angle (∆𝛾2) in order to transfer a specified amount of power between interconnected areas. Hence, it can
be written as: ∆𝛾1 = ∆𝛾2 = ∆𝛾. Putting these values in Eqn.
(7), the following expression is obtained:
∆𝛾 = ∆𝛿1 + 𝑇21,𝐷𝐶
𝑇12,𝐷𝐶 ∆𝛿2 1 +
𝑇21,𝐷𝐶
𝑇12,𝐷𝐶 (8)
Putting back the value of ∆𝛾 in Eqn. (4) and further solving
the equation, we found:
∆𝑃𝑡𝑖𝑒 12,𝐷𝐶 = 𝑇12,𝐷𝐶𝑇21,𝐷𝐶 𝑇12,𝐷𝐶 + 𝑇21,𝐷𝐶 ∆𝛿1 − ∆𝛿2 (9)
Or, ∆𝑃𝑡𝑖𝑒 12,𝐷𝐶 = 2𝜋 𝑇12,𝐷𝐶𝑇21,𝐷𝐶 𝑇12,𝐷𝐶 + 𝑇21,𝐷𝐶 ∆𝑓1 −
∆𝑓2𝑑𝑡 (10) Taking the Laplace transform on both sides of Eqn. (10):
∆𝑃𝑡𝑖𝑒 12,𝐷𝐶(𝑠) = 𝑇12,𝐷𝐶 𝑇21,𝐷𝐶
𝑇12,𝐷𝐶 +𝑇21,𝐷𝐶
2𝜋
𝑠 ∆𝑓1 (𝑠) − ∆𝑓2 (𝑠) (11)
Or, ∆𝑃𝑡𝑖𝑒 12,𝐷𝐶(𝑠) = 2𝜋𝑇𝑒𝑞𝑣 𝑠 ∆𝑓1 (𝑠) − ∆𝑓2 (𝑠) (12)
Where: 𝑇𝑒𝑞𝑣 = 𝑇12,𝐷𝐶𝑇21,𝐷𝐶 𝑇12,𝐷𝐶 + 𝑇21,𝐷𝐶 represents the
equivalent synchronization coefficient of HVDC link. The
Eqn. (12) establishes the relationship between frequency
deviations of interconnecting areas and tie-line power
deviations of HVDC link. The corresponding transfer function
model of HVDC link has been shown in Fig. 2.
For the comparative analysis between the synchronization
coefficients of HVDC and AC links, Eqns. (2)−(12) have
been solved further in Appendix I. Eqn. (52) of Appendix I
shows that the synchronization coefficient of HVDC link is
just half to that of AC link provided both tie-links exhibits same power transfer capacities and have been loaded equally.
C. Physical as well as Analytical Interpretation of Proposed Model of HVDC Links:
It has been observed from the proposed model that the
HVDC links exhibits their own synchronization coefficient
similar to the AC links. Hence, it can be stated that the exchange of power through HVDC links relies upon the
synchronization coefficients of rectifier as well as inverter side
phase reactors denoted as: 𝑇12,𝐷𝐶 and 𝑇21,𝐷𝐶 , respectively. The
mathematical expression of these synchronization coefficients
reveals that 𝑇12,𝐷𝐶 and 𝑇21,𝐷𝐶 are dependent upon the physical
parameters of HVDC links, such as, voltage level, bus angle
difference and impedances of both side inverters employed to
regulate the active power flow of HVDC links. Based on these
physical parameters values of HVDC links, the value of
HVDC synchronization coefficient are obtained. Furthermore,
it has also been proven analytically that the synchronization
coefficient of HVDC link is just half to that of AC link
synchronization coefficient for equal power transfer
capabilities and loadings of both tie-links.
Here, it is important to note that in previous AGC studies,
first-order transfer function model was used in simulation
studies irrespective to the topologies (LCC/VSC) used to
operate HVDC links. Surprisingly, no information was
provided regarding the topology for which first-order model
was developed. However, in this paper, proposed model of
HVDC link has been developed for VSC topology. The
fundamental difference between these two topologies is that
the reactive power cannot be controlled independent of the
active power in case of LCC topology. However, in case of VSC topology, active as well as reactive powers both can be
controlled independently. It is because of the fact that the
control system of LCC topology has only the capability of
„turn-on‟ operation of semiconductor devices and relies on
external AC system for „turn-off‟ operation. Hence, the
control system of LCC topology has only one-degree of
freedom. However, in case of VSC topology, control system
exhibits both capabilities of turning „on‟ and „off‟ operations
of semiconductor devices and has the two-degree of freedom.
This two degree of freedom of control system gives the
capability to VSC topology to control the active and reactive
powers independently. Based on the aforementioned fact, in the proposed model, active and reactive powers have been
decoupled and the equivalent circuit has been developed for
VSC topology of HVDC links.
D. Synchronization Coefficient Calculations:
The calculations of AC and HVDC link synchronization
coefficients are given as follows:
1) AC link synchronization coefficients calculations Max power transfer capability:
𝑃𝑚𝑎𝑥 ,𝐴𝐶 = 𝑉1𝑉2 𝑋𝐿 = 200𝑀𝑊 (13)
Rated capacity of area-1: 𝑃𝑟1 = 2000𝑀𝑊
Loading of AC link: 𝑃𝑡𝑖𝑒 12,𝐴𝐶 = 50% or 100MW
Bus angle difference required for 50% loading:
𝑃𝑡𝑖𝑒 12,𝐴𝐶 = 𝑃𝑚𝑎𝑥 ,𝐴𝐶 sin 𝛿10 − 𝛿2
0 (14)
Or, 100 = 200 sin 𝛿10 − 𝛿2
0 (15)
𝛿10 − 𝛿2
0 = 30° (16) AC link synchronization coefficient:
𝑇12,𝐴𝐶 =𝑃𝑚𝑎𝑥 ,𝐴𝐶
𝑃𝑟cos 𝛿1
0 − 𝛿20 (17)
𝑇12,𝐴𝐶 = 0.0865 (18)
2) DC link synchronization coefficient calculations Max power transfer capability:
𝑃𝑚𝑎𝑥 ,𝐷𝐶 = 𝑉1𝐸1 𝑋𝑡1 = 𝑉2𝐸1 𝑋𝑡2 = 600𝑀𝑊 (19)
Rated capacity of area-1, 2: 𝑃𝑟1 = 2000𝑀𝑊, 𝑃𝑟2 = 1000𝑀𝑊
Loading of HVDC link: 𝑃𝑡𝑖𝑒 12,𝐷𝐶 = 50% or 300MW
Bus angle difference required between bus-1 and rectifier
(converter-1) for 50% loading condition:
𝑃𝑡𝑖𝑒 12,𝐷𝐶 = 𝑃𝑚𝑎𝑥 ,𝐷𝐶 sin 𝛿10 − 𝛾1
0 (20)
Or, 300 = 600 sin 𝛿10 − 𝛾1
0 (21)
Or, 𝛿10 − 𝛾1
0 = 30° (22)
Similarly, bus angle difference required between bus-2 and
inverter (converter-2) for 50% loading condition has been
obtained given as follows:
𝛿20 − 𝛾2
0 = 30° (23)
Fig. 2. Proposed accurate model of HVDC tie-links.
∆𝒇𝟐(𝒔)
∆𝒇𝟏(𝒔)
𝑻𝟏𝟐,𝑫𝑪𝑻𝟐𝟏,𝑫𝑪
𝑻𝟏𝟐,𝑫𝑪 + 𝑻𝟐𝟏,𝑫𝑪
𝟐𝝅
𝒔 ∆𝑷𝒕𝒊𝒆𝟏𝟐,𝑫𝑪
0278-0046 (c) 2018 IEEE. Personal use is permitted, but republication/redistribution requires IEEE permission. See http://www.ieee.org/publications_standards/publications/rights/index.html for more information.
This article has been accepted for publication in a future issue of this journal, but has not been fully edited. Content may change prior to final publication. Citation information: DOI 10.1109/TIE.2018.2835387, IEEETransactions on Industrial Electronics
IEEE TRANSACTIONS ON INDUSTRIAL ELECTRONICS
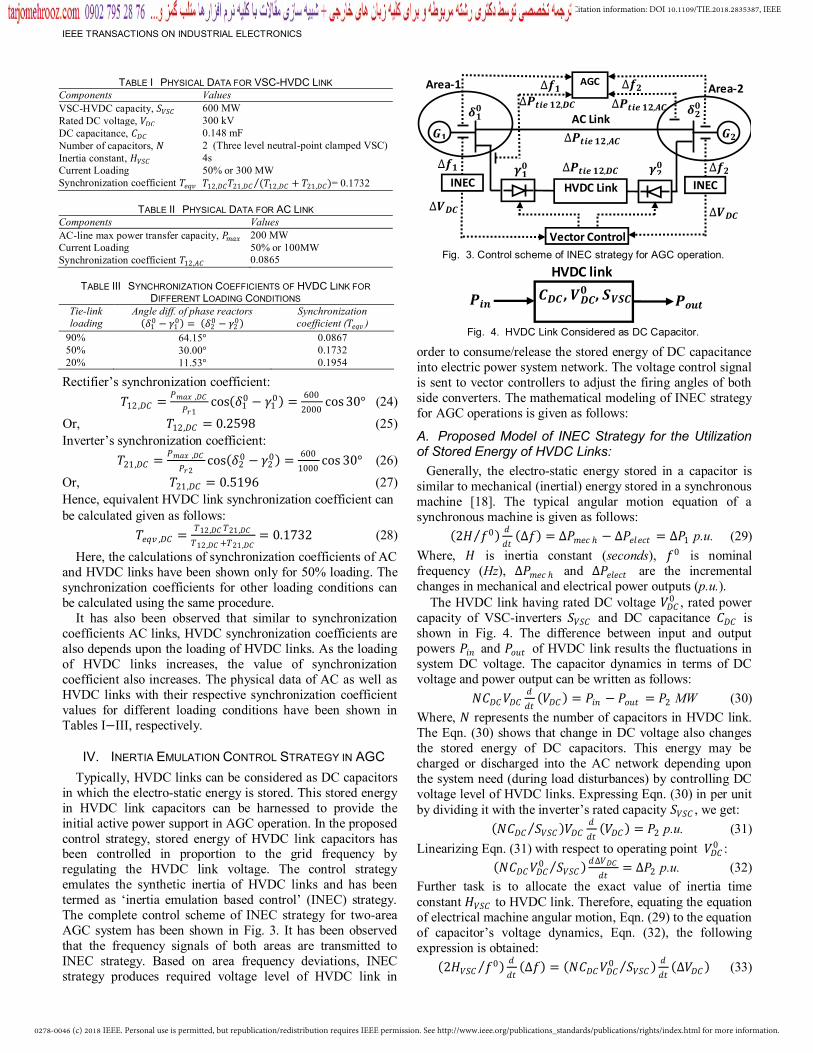
Rectifier‟s synchronization coefficient:
𝑇12,𝐷𝐶 =𝑃𝑚𝑎𝑥 ,𝐷𝐶
𝑃𝑟1cos 𝛿1
0 − 𝛾10 =
600
2000cos 30° (24)
Or, 𝑇12,𝐷𝐶 = 0.2598 (25)
Inverter‟s synchronization coefficient:
𝑇21,𝐷𝐶 =𝑃𝑚𝑎𝑥 ,𝐷𝐶
𝑃𝑟2cos 𝛿2
0 − 𝛾20 =
600
1000cos 30° (26)
Or, 𝑇21,𝐷𝐶 = 0.5196 (27)
Hence, equivalent HVDC link synchronization coefficient can
be calculated given as follows:
𝑇𝑒𝑞𝑣 ,𝐷𝐶 =𝑇12,𝐷𝐶 𝑇21,𝐷𝐶
𝑇12,𝐷𝐶 +𝑇21,𝐷𝐶= 0.1732 (28)
Here, the calculations of synchronization coefficients of AC
and HVDC links have been shown only for 50% loading. The
synchronization coefficients for other loading conditions can
be calculated using the same procedure.
It has also been observed that similar to synchronization
coefficients AC links, HVDC synchronization coefficients are
also depends upon the loading of HVDC links. As the loading
of HVDC links increases, the value of synchronization
coefficient also increases. The physical data of AC as well as
HVDC links with their respective synchronization coefficient
values for different loading conditions have been shown in
Tables I−III, respectively.
IV. INERTIA EMULATION CONTROL STRATEGY IN AGC
Typically, HVDC links can be considered as DC capacitors
in which the electro-static energy is stored. This stored energy
in HVDC link capacitors can be harnessed to provide the
initial active power support in AGC operation. In the proposed
control strategy, stored energy of HVDC link capacitors has been controlled in proportion to the grid frequency by
regulating the HVDC link voltage. The control strategy
emulates the synthetic inertia of HVDC links and has been
termed as „inertia emulation based control‟ (INEC) strategy.
The complete control scheme of INEC strategy for two-area
AGC system has been shown in Fig. 3. It has been observed
that the frequency signals of both areas are transmitted to
INEC strategy. Based on area frequency deviations, INEC
strategy produces required voltage level of HVDC link in
order to consume/release the stored energy of DC capacitance
into electric power system network. The voltage control signal
is sent to vector controllers to adjust the firing angles of both
side converters. The mathematical modeling of INEC strategy
for AGC operations is given as follows:
A. Proposed Model of INEC Strategy for the Utilization of Stored Energy of HVDC Links:
Generally, the electro-static energy stored in a capacitor is
similar to mechanical (inertial) energy stored in a synchronous
machine [18]. The typical angular motion equation of a
synchronous machine is given as follows:
2𝐻 𝑓0 𝑑
𝑑𝑡 ∆𝑓 = ∆𝑃𝑚𝑒𝑐 − ∆𝑃𝑒𝑙𝑒𝑐𝑡 = ∆𝑃1 p.u. (29)
Where, 𝐻 is inertia constant (seconds), 𝑓0 is nominal
frequency (Hz), ∆𝑃𝑚𝑒𝑐 and ∆𝑃𝑒𝑙𝑒𝑐𝑡 are the incremental
changes in mechanical and electrical power outputs (p.u.).
The HVDC link having rated DC voltage 𝑉𝐷𝐶0 , rated power
capacity of VSC-inverters 𝑆𝑉𝑆𝐶 and DC capacitance 𝐶𝐷𝐶 is
shown in Fig. 4. The difference between input and output
powers 𝑃𝑖𝑛 and 𝑃𝑜𝑢𝑡 of HVDC link results the fluctuations in
system DC voltage. The capacitor dynamics in terms of DC
voltage and power output can be written as follows:
𝑁𝐶𝐷𝐶𝑉𝐷𝐶𝑑
𝑑𝑡 𝑉𝐷𝐶 = 𝑃𝑖𝑛 − 𝑃𝑜𝑢𝑡 = 𝑃2 MW (30)
Where, 𝑁 represents the number of capacitors in HVDC link.
The Eqn. (30) shows that change in DC voltage also changes
the stored energy of DC capacitors. This energy may be
charged or discharged into the AC network depending upon
the system need (during load disturbances) by controlling DC
voltage level of HVDC links. Expressing Eqn. (30) in per unit
by dividing it with the inverter‟s rated capacity 𝑆𝑉𝑆𝐶 , we get:
𝑁𝐶𝐷𝐶 𝑆𝑉𝑆𝐶 𝑉𝐷𝐶𝑑
𝑑𝑡 𝑉𝐷𝐶 = 𝑃2 p.u. (31)
Linearizing Eqn. (31) with respect to operating point 𝑉𝐷𝐶0 :
𝑁𝐶𝐷𝐶𝑉𝐷𝐶0 𝑆𝑉𝑆𝐶
𝑑∆𝑉𝐷𝐶
𝑑𝑡= ∆𝑃2 p.u. (32)
Further task is to allocate the exact value of inertia time
constant 𝐻𝑉𝑆𝐶 to HVDC link. Therefore, equating the equation
of electrical machine angular motion, Eqn. (29) to the equation
of capacitor‟s voltage dynamics, Eqn. (32), the following
expression is obtained:
2𝐻𝑉𝑆𝐶 𝑓0 𝑑
𝑑𝑡 ∆𝑓 = 𝑁𝐶𝐷𝐶𝑉𝐷𝐶
0 𝑆𝑉𝑆𝐶 𝑑
𝑑𝑡 ∆𝑉𝐷𝐶 (33)
TABLE I PHYSICAL DATA FOR VSC-HVDC LINK
Components Values
VSC-HVDC capacity, 𝑆𝑉𝑆𝐶 600 MW
Rated DC voltage, 𝑉𝐷𝐶 300 kV
DC capacitance, 𝐶𝐷𝐶 0.148 mF
Number of capacitors, 𝑁 2 (Three level neutral-point clamped VSC)
Inertia constant, 𝐻𝑉𝑆𝐶 4s
Current Loading 50% or 300 MW
Synchronization coefficient 𝑇𝑒𝑞𝑣 𝑇12,𝐷𝐶𝑇21,𝐷𝐶 (𝑇12,𝐷𝐶 + 𝑇21,𝐷𝐶) = 0.1732
TABLE II PHYSICAL DATA FOR AC LINK
Components Values
AC-line max power transfer capacity, 𝑃𝑚𝑎𝑥 200 MW
Current Loading 50% or 100MW
Synchronization coefficient 𝑇12,𝐴𝐶 0.0865
TABLE III SYNCHRONIZATION COEFFICIENTS OF HVDC LINK FOR
DIFFERENT LOADING CONDITIONS
Tie-link
loading
Angle diff. of phase reactors 𝛿1
0 − 𝛾10 = 𝛿2
0 − 𝛾20
Synchronization
coefficient (𝑇𝑒𝑞𝑣 )
90% 64.15° 0.0867
50% 30.00° 0.1732
20% 11.53° 0.1954
Fig. 3. Control scheme of INEC strategy for AGC operation.
Fig. 4. HVDC Link Considered as DC Capacitor.
∆𝒇𝟏
Area-2
Area-1
∆𝑷𝒕𝒊𝒆 𝟏𝟐,𝑨𝑪
∆𝑷𝒕𝒊𝒆 𝟏𝟐,𝑫𝑪
∆𝑷𝒕𝒊𝒆 𝟏𝟐,𝑨𝑪
∆𝑷𝒕𝒊𝒆 𝟏𝟐,𝑫𝑪
∆𝒇𝟐
∆𝒇𝟏
𝜹𝟏𝟎
𝜸𝟐𝟎 𝜸𝟏
𝟎
∆𝑽𝑫𝑪
AC Link
∆𝑽𝑫𝑪
∆𝒇𝟐
HVDC Link INEC
INEC
𝜹𝟐𝟎
𝑮𝟏 𝑮𝟐
AGC
Vector Control
HVDC link
𝑷𝒊𝒏 𝑷𝒐𝒖𝒕 𝑪𝑫𝑪, 𝑽𝑫𝑪
𝟎 , 𝑺𝑽𝑺𝑪

0278-0046 (c) 2018 IEEE. Personal use is permitted, but republication/redistribution requires IEEE permission. See http://www.ieee.org/publications_standards/publications/rights/index.html for more information.
This article has been accepted for publication in a future issue of this journal, but has not been fully edited. Content may change prior to final publication. Citation information: DOI 10.1109/TIE.2018.2835387, IEEETransactions on Industrial Electronics
IEEE TRANSACTIONS ON INDUSTRIAL ELECTRONICS
Taking Laplace transform on both sides:
2𝐻𝑉𝑆𝐶 𝑓0 𝑠∆𝑓(𝑠) = 𝑁𝐶𝐷𝐶𝑉𝐷𝐶0 𝑆𝑉𝑆𝐶 𝑠∆𝑉𝐷𝐶(𝑠) (34)
Or, ∆𝑉𝐷𝐶 𝑠 = 2𝐻𝑉𝑆𝐶𝑆𝑉𝑆𝐶 𝑁𝐶𝐷𝐶𝑓0𝑉𝐷𝐶
0 ∆𝑓 𝑠 (35)
Dividing Eqn. (35) by 𝑉𝐷𝐶0 to convert DC voltage into per unit
system, we get:
∆𝑉𝐷𝐶 𝑠 𝑝.𝑢. = 2𝐻𝑉𝑆𝐶 𝑆𝑉𝑆𝐶
𝑁𝐶𝐷𝐶 𝑓0𝑉𝐷𝐶0 2 ∆𝑓 𝑠 (36)
The above equation directly relates the voltage deviations
∆𝑉𝐷𝐶 of HVDC link with the frequency deviations ∆𝑓 of AC
system. Hence, it can be stated that in order to support the AC
system from the stored energy of HVDC links for the duration
of 𝐻𝑉𝑆𝐶 seconds; HVDC link will be subjected to voltage
deviations of ∆𝑉𝐷𝐶 as per the Eqn. (36).
Practically, DC voltage fluctuations in HVDC links are
allowed upto some extent. Therefore, DC voltage level must be restricted within upper and lower constraints. Typically,
DC voltage of HVDC links are allowed to vary approximately
in the range of ±15 to ±30% of rated DC voltage. However,
the exact values of upper and lower constraints depends upon
the insulation level and current ratings of HVDC systems. The
complete transfer function block diagram of proposed control
for the utilization of stored energy from HVDC system is
shown in Fig. 5. It can be observed that voltage deviation
∆𝑉𝐷𝐶∗ has been multiplied by current 𝐼𝐷𝐶 to obtain the change
in DC power output ∆𝑃𝐷𝐶 in per unit. The value of 𝐼𝐷𝐶 is decided by the loading of HVDC link, for example, in case of
50% loaded line, value of 𝐼𝐷𝐶 will be 0.5 p.u. i.e. 50% of its
rate current. The factor 𝑆𝑉𝑆𝐶 𝑃𝑟 has also been multiplied to
∆𝑃𝐷𝐶 to convert the per unit value of power output from
HVDC system base, 𝑆𝑉𝑆𝐶 to power system area base 𝑃𝑟 .
B. Calculation of Required Practical Size of DC Capacitance for Stored Energy Support: Using the differential form of Eqn. (33) given as follows:
2𝐻𝑉𝑆𝐶 𝑓0 𝑑𝑓
𝑑𝑡= 𝑁𝐶𝐷𝐶𝑉𝐷𝐶 𝑆𝑉𝑆𝐶
𝑑𝑉𝐷𝐶
𝑑𝑡 (37)
Integrating Eqn. (37) yields the following expression:
2𝐻𝑉𝑆𝐶 𝑓0 𝑑𝑓 = 𝑁𝐶𝐷𝐶 𝑆𝑉𝑆𝐶 𝑉𝐷𝐶𝑑𝑉𝐷𝐶 (38)
Or, 2𝐻𝑉𝑆𝐶 𝑓0 𝑓 = 𝑁𝐶𝐷𝐶𝑉𝐷𝐶2 2𝑆𝑉𝑆𝐶 + 𝐾 (39)
Where constant 𝐾 is the integration coefficient which has been
obtained as per the specified values of HVDC physical
parameters, such as, inertia constant 𝐻𝑉𝑆𝐶 , converter‟s power
ratings 𝑆𝑉𝑆𝐶 , rated DC voltage 𝑉𝐷𝐶0 and total system DC
capacitance 𝑁 × 𝐶𝐷𝐶 . Substituting, 𝑓 = 𝑓0 and 𝑉𝐷𝐶 = 𝑉𝐷𝐶0 in
Eqn. (39) to obtain „𝐾‟for initial conditions, we get:
𝐾 =2𝐻𝑉𝑆𝐶
𝑓0 𝑓0 −𝑁𝐶𝐷𝐶 𝑉𝐷𝐶
0 2
2𝑆𝑉𝑆𝐶 (40)
Putting back the value of „𝐾‟ in Eqn. (39) yields:
2𝐻𝑉𝑆𝐶
𝑓0 𝑓 =𝑁𝐶𝐷𝐶 𝑉𝐷𝐶
2
2𝑆𝑉𝑆𝐶+
2𝐻𝑉𝑆𝐶 𝑓0
𝑓0 −𝑁𝐶𝑉𝐷𝐶
0 2
2𝑆𝑉𝑆𝐶 (41)
Or, 2𝐻𝑉𝑆𝐶 𝑓−𝑓0
𝑓0 =
𝑁𝐶𝐷𝐶
2𝑆𝑉𝑆𝐶 𝑉𝐷𝐶
2 − 𝑉𝐷𝐶0 2
(42)
Or, 𝐻𝑉𝑆𝐶∆𝑓
𝑓0 =𝑁𝐶𝐷𝐶 𝑉𝐷𝐶
0 2
4𝑆𝑉𝑆𝐶
𝑉𝐷𝐶
𝑉𝐷𝐶0
2
− 1 (43)
Substituting 𝑉𝐷𝐶=𝑉𝐷𝐶0 + ∆𝑉𝐷𝐶 in Eqn. (43) yields the
following expression:
𝐻𝑉𝑆𝐶∆𝑓
𝑓0 =𝑁𝐶𝐷𝐶 𝑉𝐷𝐶
0 2
4𝑆𝑉𝑆𝐶 1 +
∆𝑉𝐷𝐶
𝑉𝐷𝐶0
2
− 1 (44)
Applying Taylor series expansion upon Eqn. (44):
𝐻𝑉𝑆𝐶 =𝑁𝐶𝐷𝐶 𝑉𝐷𝐶
0 2𝑓0
4𝑆𝑉𝑆𝐶 ∆𝑓 1 +
2∆𝑉𝐷𝐶
𝑉𝐷𝐶0 − 1 (45)
As we know that 𝑉𝐷𝐶0 ≫ ∆𝑉𝐷𝐶 , thus the higher order terms of
expansion series, such as, ∆𝑉𝐷𝐶2 𝑉𝐷𝐶
0 2 , ∆𝑉𝐷𝐶
3 𝑉𝐷𝐶0 3
…will become smaller and smaller. Therefore, these higher order
terms have been neglected. This approximation yields the
following expression:
𝐻𝑉𝑆𝐶 =𝑁𝐶𝐷𝐶 𝑓0𝑉𝐷𝐶
0 ∆𝑉𝐷𝐶
2𝑆𝑉𝑆𝐶 ∆𝑓 (46)
Using Eqn. (46), the required physical size of DC capacitance of HVDC link can be calculated for the desirable values of
inertia constant 𝐻𝑉𝑆𝐶 , maximum allowable limits of frequency
change ∆𝑓, DC voltage deviations ∆𝑉𝐷𝐶 and number of
capacitors 𝑁 present in the HVDC links. However, here it is
important to note that the parameters of Eqn. (46) given as:
𝑁,𝑓0 , 𝑉𝐷𝐶0 , 𝑉𝐷𝐶 , 𝑆𝑉𝑆𝐶 & ∆𝑓 are fixed for a pre-defined HVDC
system. Hence in this case, synthetic inertia of HVDC link
becomes directly proportional to the required DC capacitor
size i.e. 𝐻𝑉𝑆𝐶 ∝ 𝐶𝐷𝐶 . Now, we have to make a balance
between these two parameters. Selecting the higher values of synthetic inertia will increase the required size of DC
capacitance. Therefore, before selecting the value of synthetic
inertia, we have to make sure that the required size of HVDC
link capacitance is feasibly possible for the implementation of
INEC strategy. For example, given values of parameters:
𝐻𝑉𝑆𝐶 = 4𝑠, ∆𝑉𝐷𝐶 = 90kV (30% of rated DC voltage
𝑉𝐷𝐶=300kV), ∆𝑓 = 0.1𝐻𝑧, 𝑁 = 2 (three-level neutral-point
clamped VSC), 𝑆𝑉𝑆𝐶 =600MW, the required size of HVDC
capacitance as per the Eqn. (46) is given as: 𝐶𝐷𝐶=0.148mF.
C. Some Practical Implementation Aspects of INEC Strategy for AGC Operations:
It has been proved that stored energy of HVDC links have
the capability to support AC system during load disturbances
in the form of inertia time constant 𝐻𝑉𝑆𝐶 provided that HVDC
voltage ∆𝑉𝐷𝐶 is allowed to vary within the prescribed limits.
Eqn. (46) shows the relationship between HVDC link
parameters 𝐻𝑉𝑆𝐶 , ∆𝑓 and ∆𝑉𝐷𝐶 . The following equation has
been plotted in three-dimensional graph as shown in Fig. 6.
The figure shows the variation in system DC voltage due to
HVDC inertia time constant 𝐻𝑉𝑆𝐶 varying in the range of
0−4s for the specified values of system frequency deviations
∆𝑓. Furthermore, it is also observed that the voltage deviation of HVDC link is inversely proportional to DC capacitance.
This indicates that to avoid wide variations in DC voltage,
Fig. 6. Three dimensional view of relationship between ∆𝑉𝐷𝐶 , ∆𝑓 and 𝐻𝑉𝑆𝐶 .
Fig. 5. Model of INEC Strategy for AGC Operation.
+𝟏𝟓% ∆𝑷𝑫𝑪
∗ (𝒔) ∆𝒇(𝒔) ∆𝑷𝑫𝑪(𝒔)
𝑰𝑫𝑪(𝒔)
∆𝑽𝑫𝑪∗ (𝒔)
−𝟏𝟓%
∆𝑽𝑫𝑪(𝒔) 𝟐𝑯𝑽𝑺𝑪𝑺𝑽𝑺𝑪
𝑵𝑪𝒇𝟎𝑽𝑫𝑪𝟎 𝟐
𝝅 𝑺𝑽𝑺𝑪
𝑷𝒓
0278-0046 (c) 2018 IEEE. Personal use is permitted, but republication/redistribution requires IEEE permission. See http://www.ieee.org/publications_standards/publications/rights/index.html for more information.
This article has been accepted for publication in a future issue of this journal, but has not been fully edited. Content may change prior to final publication. Citation information: DOI 10.1109/TIE.2018.2835387, IEEETransactions on Industrial Electronics
IEEE TRANSACTIONS ON INDUSTRIAL ELECTRONICS
large size DC capacitors must be used for HVDC links. The larger DC capacitors will require extra efforts for the
protection of HVDC links. However, if the system DC voltage
is allowed to vary upto some extent, then smaller DC
capacitances can also be used.
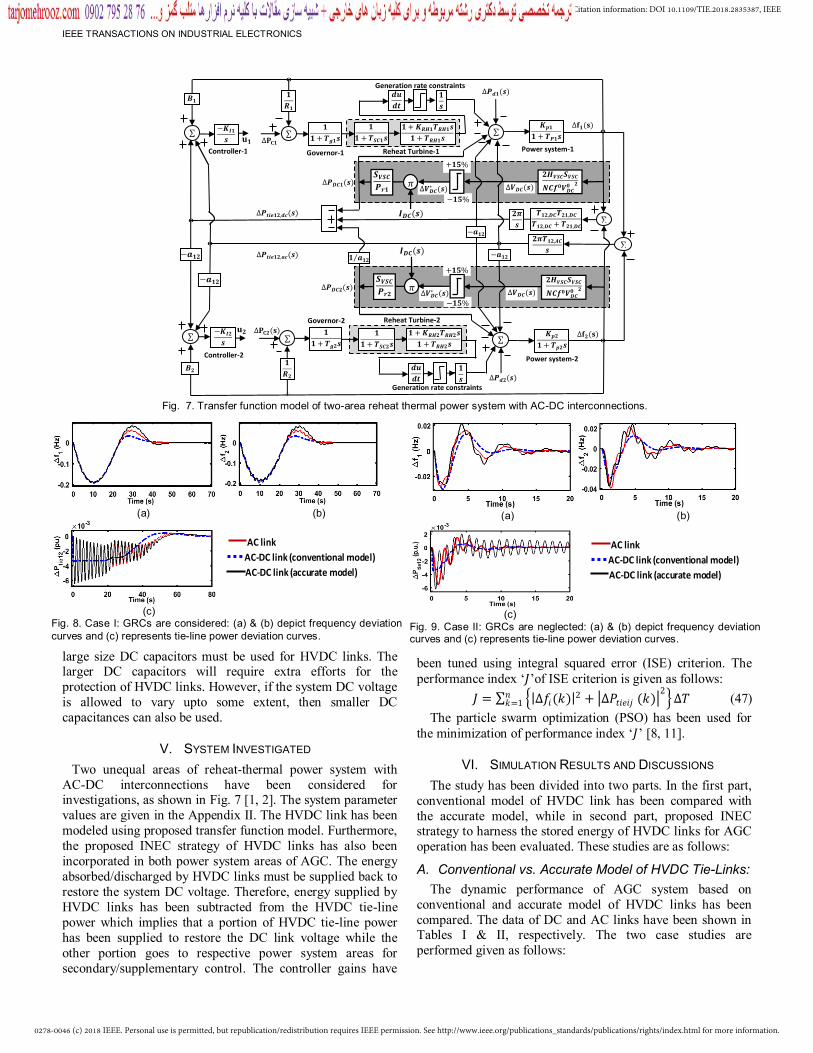
V. SYSTEM INVESTIGATED
Two unequal areas of reheat-thermal power system with
AC-DC interconnections have been considered for investigations, as shown in Fig. 7 [1, 2]. The system parameter
values are given in the Appendix II. The HVDC link has been
modeled using proposed transfer function model. Furthermore,
the proposed INEC strategy of HVDC links has also been
incorporated in both power system areas of AGC. The energy
absorbed/discharged by HVDC links must be supplied back to
restore the system DC voltage. Therefore, energy supplied by
HVDC links has been subtracted from the HVDC tie-line
power which implies that a portion of HVDC tie-line power
has been supplied to restore the DC link voltage while the
other portion goes to respective power system areas for
secondary/supplementary control. The controller gains have
been tuned using integral squared error (ISE) criterion. The
performance index „𝐽‟of ISE criterion is given as follows:
𝐽 = ∆𝑓𝑖(𝑘) 2 + ∆𝑃𝑡𝑖𝑒𝑖𝑗 (𝑘) 2 𝑛
𝑘=1 ∆𝑇 (47)
The particle swarm optimization (PSO) has been used for
the minimization of performance index „𝐽‟ [8, 11].
VI. SIMULATION RESULTS AND DISCUSSIONS
The study has been divided into two parts. In the first part,
conventional model of HVDC link has been compared with
the accurate model, while in second part, proposed INEC strategy to harness the stored energy of HVDC links for AGC
operation has been evaluated. These studies are as follows:
A. Conventional vs. Accurate Model of HVDC Tie-Links:
The dynamic performance of AGC system based on
conventional and accurate model of HVDC links has been
compared. The data of DC and AC links have been shown in Tables I & II, respectively. The two case studies are
performed given as follows:
Fig. 7. Transfer function model of two-area reheat thermal power system with AC-DC interconnections.
∆𝑷𝑫𝑪𝟐(𝒔)
∆𝑷𝑫𝑪𝟏(𝒔)
𝑰𝑫𝑪(𝒔)
−𝟏𝟓%
+𝟏𝟓%
𝑰𝑫𝑪(𝒔)
∆𝑽𝑫𝑪(𝒔)
∆𝐟𝟐(𝐬)
∆𝐟𝟏(𝐬)
∆𝑷𝒕𝒊𝒆𝟏𝟐,𝒅𝒄(𝒔)
∆𝑷𝒕𝒊𝒆𝟏𝟐,𝒂𝒄(𝒔)
𝐮𝟐
𝐮𝟏
∆𝐏𝐂𝟐(𝐬)
∆𝐏𝐂𝟏 Governor-1
Controller-2
Generation rate constraints
Reheat Turbine-2
Reheat Turbine-1 Controller-1
∆𝑷𝒅𝟐(𝒔)
∆𝑷𝒅𝟏(𝒔)
𝑩𝟐
−𝒂𝟏𝟐
𝑲𝒑𝟐
𝟏 + 𝑻𝒑𝟐𝒔
𝑲𝒑𝟏
𝟏 + 𝑻𝑷𝟏𝒔 𝟏
𝟏 + 𝑻𝑺𝑪𝟏𝒔
𝟏
𝟏 + 𝑻𝒈𝟏𝒔
𝟏
𝑹𝟏
𝑩𝟏
−𝑲𝑰𝟏
𝒔
𝟐𝝅𝑻𝟏𝟐,𝑨𝑪
𝒔
𝟏 + 𝑲𝑹𝑯𝟏𝑻𝑹𝑯𝟏𝒔
𝟏 + 𝑻𝑹𝑯𝟏𝒔
−𝒂𝟏𝟐
𝟏
𝑹𝟐
−𝑲𝑰𝟐
𝒔
𝟏
𝟏 + 𝑻𝒈𝟐𝒔
𝟏
𝟏 + 𝑻𝑺𝑪𝟐𝒔
𝟏 + 𝑲𝑹𝑯𝟐𝑻𝑹𝑯𝟐𝒔
𝟏 + 𝑻𝑹𝑯𝟐𝒔
𝒅𝒖
𝒅𝒕
𝟏
𝒔
Governor-2
Generation rate constraints
𝑺𝑽𝑺𝑪
𝑷𝒓𝟏
∆𝑽𝑫𝑪∗ (𝒔)
−𝟏𝟓%
+𝟏𝟓% 𝟐𝑯𝑽𝑺𝑪𝑺𝑽𝑺𝑪
𝑵𝑪𝒇𝟎𝑽𝑫𝑪𝟎 𝟐
𝜋
Power system-1
𝑻𝟏𝟐,𝑫𝑪𝑻𝟐𝟏,𝑫𝑪
𝑻𝟏𝟐,𝑫𝑪 + 𝑻𝟐𝟏,𝑫𝑪
−𝒂𝟏𝟐
−𝒂𝟏𝟐
𝑺𝑽𝑺𝑪
𝑷𝒓𝟐
∆𝑽𝑫𝑪∗ (𝒔) ∆𝑽𝑫𝑪(𝒔)
𝟐𝑯𝑽𝑺𝑪𝑺𝑽𝑺𝑪
𝑵𝑪𝒇𝟎𝑽𝑫𝑪𝟎 𝟐
Power system-2
𝟏 𝒂𝟏𝟐
𝟐𝝅
𝒔
𝜋
𝒅𝒖
𝒅𝒕
𝟏
𝒔
(a) (b)
(c) Fig. 8. Case I: GRCs are considered: (a) & (b) depict frequency deviation
curves and (c) represents tie-line power deviation curves.
(a) (b)
(c)
Fig. 9. Case II: GRCs are neglected: (a) & (b) depict frequency deviation curves and (c) represents tie-line power deviation curves.
AC-DC link (accurate model)
AC-DC link (conventional model)
AC link
AC-DC link (accurate model)
AC-DC link (conventional model)
AC link

0278-0046 (c) 2018 IEEE. Personal use is permitted, but republication/redistribution requires IEEE permission. See http://www.ieee.org/publications_standards/publications/rights/index.html for more information.
This article has been accepted for publication in a future issue of this journal, but has not been fully edited. Content may change prior to final publication. Citation information: DOI 10.1109/TIE.2018.2835387, IEEETransactions on Industrial Electronics
IEEE TRANSACTIONS ON INDUSTRIAL ELECTRONICS
1) Study of AGC dynamic performance at the fixed loading conditions of HVDC links
Both AC and DC links are loaded equally upto 50% of their rated capacities. The synchronizing coefficients of AC and DC
links for 50% loading condition are 0.0865 and 0.129,
respectively. The step load perturbation of 1% magnitude has
been given in area-1. The optimized values of controller gains
are given in Appendix II. The system dynamic responses have
been obtained for two cases. In this first case, system GRCs of
3% per minute have been considered to restrict the thermal
generating unit‟s power outputs; while in the second case,
system GRCs have been neglected. The dynamic responses for
these two cases are shown in Figs. 8 & 9, respectively. In
these figures, dynamic responses have been compared
obtained for the systems having AC link, AC-DC link with conventional model and AC-DC link with accurate model of
HVDC link. It has been observed that the conventional model
of HVDC link depicts the improvement in system dynamic
performance irrespective of considering system GRCs, when it
is added in parallel to AC link. However, the proposed
accurate model of HVDC tie-line just shows the opposite trend
i.e. the addition of HVDC link in parallel to the existing AC
link do not improve the AGC dynamic performance, instead
the system becomes more oscillatory in nature for both cases,
with and without system GRCs. The main reason behind the
degradation in system dynamic performance is that the HVDC tie-link exhibits its own synchronization coefficient.
Therefore, adding it in parallel to AC link increases the overall
synchronization coefficient of entire AC-DC link.
2) Study of AGC dynamic performance at different loading conditions of HVDC links
The investigations are also carried out to study the AGC
dynamic performance at different loading conditions of
HVDC links. The values of synchronization coefficients (𝑇𝑒𝑞𝑣 )
of HVDC link for 90%, 50% and 20% loading conditions are
given in Table III. It has been observed from the table that as
the loading of HVDC link varies from 90% to 20%,
synchronization coefficient of HVDC link also varies from
0.0654 to 0.146. The system dynamic responses have been
obtained for different values of synchronization coefficients acquired from different loading conditions of HVDC link.
Here, two cases are studied. In first case, 1% step load
perturbation (SLP) has been considered in area-1, while in the
second case, 1% SLP has been considered in area-2. The
system dynamic responses for these two cases are shown in
Figs. 10 and 11, respectively. The system dynamic responses
shows that as the loading of HVDC link decreases or in other
words, as the value of HVDC synchronization coefficient
increases, system dynamic performance deteriorates in terms
of number of oscillations and settling time irrespective to the
location of power system load disturbances. Hence, it can be concluded that the proposed accurate transfer function model
of HVDC link demonstrates the dependency of its model
parameters upon the loading of tie-link and affects the system
dynamic performance similar to the AC links.
B. Evaluation of Proposed INEC Strategy for AGC Operation:
The proposed INEC strategy to utilize the stored energy of
HVDC links in AGC operation has been evaluated under two
case studies. In the first case study, proposed control strategy
has been evaluated under step load as well as continuous
power system load disturbances. In the second case study, proposed control strategy has been evaluated for different
values of HVDC link model parameters. These case studies
are as follows:
1) Evaluation of INEC Strategy under Step Load Disturbances of Power System
The proposed control strategy for AC-DC interconnected
system has been compared with the normal AC-DC system.
The system dynamic responses have been obtained for step
load perturbations in area-1, as shown in Figs. 12(a)−(e). In
these figures, various AGC system output responses, such as,
frequency deviations, tie-line power deviations and voltage deviations in HVDC link have been shown for comparative
analysis. These dynamic responses clearly shows that the
proposed control strategy demonstrate the better dynamic
performance in terms of maximum undershoot, subsequent
oscillations and settling time. The voltage deviation curve of
(a) (b)
(c) Fig. 10. Case I: 1% step load perturbation in area-1: (a) & (b) depict frequency deviation curves, (c) represents tie-line power deviation curves.
(a) (b)
(c)
(a) (b)
(c) Fig. 11. Case II: 1% step load perturbation in area-2: (a) & (b) depict frequency deviation curves and (c) shows tie-line power deviation curves.
90% loading of HVDC link
50% loading of HVDC link
20% loading of HVDC link
90% loading of HVDC link
50% loading of HVDC link
20% loading of HVDC link

0278-0046 (c) 2018 IEEE. Personal use is permitted, but republication/redistribution requires IEEE permission. See http://www.ieee.org/publications_standards/publications/rights/index.html for more information.
This article has been accepted for publication in a future issue of this journal, but has not been fully edited. Content may change prior to final publication. Citation information: DOI 10.1109/TIE.2018.2835387, IEEETransactions on Industrial Electronics
IEEE TRANSACTIONS ON INDUSTRIAL ELECTRONICS
HVDC tie-link has also been shown in Figs. 12(e). It has been
observed that in case of proposed control strategy, DC voltage
level of HVDC link fluctuates considerably due to the
utilization of stored energy of HVDC system. However, this
voltage deviation diminishes quickly as the discharged energy
of HVDC tie-link restores back to its nominal condition.
2) Evaluation for INEC Strategy for Different Values of HVDC Link Model Parameters
The proposed control strategy for AC-DC interconnected
system has been evaluated under different values of HVDC
link model parameters, namely, inertia constant (𝐻𝑉𝑆𝐶 ) and dc
capacitance (𝐶𝐷𝐶). The system dynamic responses obtained for
different values of 𝐻𝑉𝑆𝐶 varying in the range of 0 to 3s are
shown in Fig. 13. It has been observed that as the value of
𝐻𝑉𝑆𝐶 increases, the system dynamic performance improves. It can be clearly observed from Figs. 13(a) & (b), that the
maximum peaks, subsequent and settling time of frequency
deviation curves have been reduced considerably with the
increased values 𝐻𝑉𝑆𝐶 . However, at the same time fluctuations
in voltage level of HVDC tie-link (𝑉𝐷𝐶 ) have been increased, as shown in Fig. 14(c).
The system dynamic responses have also been obtained for
different values of DC capacitance as shown in Figs. 14(a) &
(b). It has been observed that selecting higher value of DC
capacitance degrades the system dynamic performance.
However, at the same time fluctuations in HVDC link voltage
also decreases as shown in Fig. 14(c). Hence, it can be
concluded that selecting higher value of DC capacitance
reduces fluctuations in DC voltage. However, allowing the DC
voltage fluctuations upon to some pre-specified limits will not
only reduce the requirement of large size DC capacitors, but
also improve the AGC dynamic performance.
C. Eigen Value Analysis of Proposed HVDC Link Model: The Eigen value analysis has been performed to study the
impact of HVDC link model parameters on AGC dynamic
performance. In order to perform state space analysis, AGC
system has been represented by following state space model
given as:
𝑥 = 𝐴𝑥 + 𝐵𝑢 + 𝐹𝑤 (48)
𝑦 = 𝐶𝑥 (49)
Where, 𝑥 =State matrix, 𝑢 = Control vector, 𝑤 = Disturbance
vector, 𝐴 =State distribution matrix, 𝐵 =Control distribution
matrix, 𝐶 =Output matrix and 𝐹 =Disturbance matrix. The 11
state variables have been considered for state space analysis
given as follows:
𝑥1 = ∆𝑓1 , 𝑥2 = ∆𝑃𝑔1, 𝑥3 = ∆𝑃𝑟1, 𝑥4 = ∆𝑋𝑔1, 𝑥5 = ∆𝑃𝑡𝑖𝑒 =
∆𝑃𝑡𝑖𝑒 12,𝑑𝑐 + ∆𝑃𝑡𝑖𝑒 12,𝑎𝑐 , 𝑥6 = 𝐴𝐶𝐸1, 𝑥7 = ∆𝑓2, 𝑥8 = ∆𝑃𝑔2 ,
𝑥9 = ∆𝑃𝑟2 , 𝑥10 = ∆𝑋𝑔2, 𝑥11 = 𝐴𝐶𝐸2
TABLE IV EIGEN VALUES FOR DIFFERENT VALUES OF HVDC LINK MODEL
PARAMETERS
Modes 𝑇𝑒𝑞𝑣 = 0.0867 𝑇𝑒𝑞𝑣 = 0.1732 𝑇𝑒𝑞𝑣 = 0.1954
𝝀𝟏 −33.47+ 𝒊0 −30.47+ 𝒊0 −28.47+ 𝒊0
𝜆2 −33.46+ 𝑖0 −33.46+ 𝑖0 −33.46+ 𝑖0
𝝀𝟑 −0.751+ 𝒊4.88 −0.754+ 𝒊5.83 −0.755+ 𝒊6.055
𝝀𝟒 −0.751− 𝒊4.88 −0.754− 𝒊5.83 −0.755− 𝒊6.055
𝜆5 −3.014− 𝑖0 −3.169− 𝑖0 −3.197− 𝑖0
𝝀𝟔 −1.79+ 𝒊1.57 −1.00+ 𝒊1.90 −0.69+ 𝒊2.01
𝝀𝟕 −1.79− 𝒊1.57 −1.00− 𝒊1.90 −0.69− 𝒊2.01
𝜆8 −0.744+ 𝑖0 −0.742+ 𝑖0 −0.731+ 𝑖0
𝜆9 −0.401+ 𝑖0 −0.400+ 𝑖0 −0.380+ 𝑖0
𝜆10 −0.219+ 𝑖0 −0.219+ 𝑖0 −0.219+ 𝑖0
𝜆11 −0.199+ 𝑖0 −0.199+ 𝑖0 −0.199+ 𝑖0
(a) (b)
(c) (d)
(e) Fig. 12. Comparison of system dynamic performance for step load
disturbances of power system: (a) is load disturbance in area-1, (b) & (c) are frequency deviations, (d) is tie-line power deviation and (e) is voltage deviation of HVDC link.
(a) (b)
(c) Fig. 13. System dynamic performance for different values of HVDC inertia
constants 𝐻𝑉𝑆𝐶 : (a) &(b) are the frequency deviation curves and (c) is the
change in voltage deviations of HVDC link.
(a) (b)
(c) Fig. 14. System dynamic performance for different values of HVDC
capacitance 𝐶𝐷𝐶 where (a) & (b) are the frequency deviations and (c)
represents the change in voltage level of HVDC link.
AC-DC link
AC-DC link with proposed control
𝑯𝑽𝑺𝑪 = 𝟎 (Without proposed control)
With 𝑯𝑽𝑺𝑪 =𝟏𝒔
With 𝑯𝑽𝑺𝑪 = 𝟑𝒔

0278-0046 (c) 2018 IEEE. Personal use is permitted, but republication/redistribution requires IEEE permission. See http://www.ieee.org/publications_standards/publications/rights/index.html for more information.
This article has been accepted for publication in a future issue of this journal, but has not been fully edited. Content may change prior to final publication. Citation information: DOI 10.1109/TIE.2018.2835387, IEEETransactions on Industrial Electronics
IEEE TRANSACTIONS ON INDUSTRIAL ELECTRONICS
The matrices 𝐴,𝐵, 𝐶 and 𝐹 obtained from the state space
model have been given in the Appendix III. Finding control
vector 𝑢 which minimizes the performance index is given as:
𝐽 =1
2 𝑥 𝑇𝑄𝑥 + 𝑢 𝑇𝑅𝑢
∞
0𝑑𝑡 (50)
The above equation has been solved using Riccati equation
[28]. The Eigen values obtained for different values of
proposed HVDC link model parameters have been shown in
Table IV. The HVDC link model parameter 𝑇𝑒𝑞𝑣 has been
varied from 0.0867 to 0.1954 and corresponding Eigen values
have been obtained. It has been observed that as the value of
HVDC link synchronization coefficient increases, modes 𝜆1,
𝜆6 and 𝜆7 moves towards right side of complex s-plain, while
the imaginary part of modes 𝜆3 and 𝜆4 increases in size. This indicates that system dynamic performance deteriorates in
terms of undershoots and oscillations with increased value of
HVDC link synchronization coefficient.
D. Validation of Proposed Model of HVDC Link: The detailed physical simulation study has been performed
using „Simpower System/Matlab‟ software platform in order to
validate the proposed model of HVDC links. The system
considered for simulation study has been shown in Fig. 15(a).
The ‘vector control’ method has been used to regulate the tie-
line power of HVDC link as shown in Fig. 15(b). The 100kms
transmission lines are selected for both AC as well as HVDC links. The details of physical components and parameter
values are given in Appendix IV. The validation has been
performed into three different comparative case studies given
as follows:
1) In the first case, conventional first-order transfer function
model of HVDC link has been tested with the physical
simulation study of AGC system. The simulation results have
been obtained for AC-DC link with the conventional and
simpower models as shown in Fig. 16. Both, AC and HVDC
links has been considered to be loaded at 50% of their rated
capacities. These simulation results complements the findings of proposed HVDC link model is that adding HVDC links in
parallel to AC link degrades AGC dynamic performance.
2) In the second case, the accuracy of proposed HVDC link
model has been tested with physical simulation study of AGC
system. The system dynamic responses using proposed and
simpower models of HVDC link have been shown in Fig 17. It
has been observed that the maximum magnitude of error
between these models varies in the range of 3 to 4× 10⁻⁴, which is considerably small and can be neglected. The reason
of this error is due to the fact that physical simulation study
involves non-linear dynamics of generators and other
components of power systems participating in AGC
operations.
3) In the third case, system dynamic responses have also been
obtained for different loading conditions of HVDC link using
physical simulation of AGC system. These system dynamic
responses have been shown in Fig. 18. It has been observed
that system dynamic performance deteriorates as the HVDC
link loading decreases from its rated/nominal loading condition. Hence, all these physical simulation studies
complement the findings of proposed model of HVDC link.
Here, it is important to note that when HVDC tie-line power
again converted into AC power, it needs to be first
synchronized with the other interconnected power system
area. Typically, phase locked loops (PLLs) are used for this
purpose. The quality/degree of synchronization between
power system areas affects AGC dynamic performance.
(a)
(b)
Fig. 15. System considered for investigation where (a) is the two-area
power system with AC-HVDC link and (b) is the control system used to control VSC−HVDC links.
Rectifier Inverter HVDC link
AC link
100km
100 km
𝑮𝟏 𝑮𝟐
2000MVA
22KV 2000MVA
22/300KV 2000MVA
300/22KV
2000MVA
22KV
𝑽𝑫𝑪
𝑰𝑫𝑪
From
primary
control
𝒊𝒅∗
𝒊𝒒∗
𝒗𝒒 𝒗𝒅
𝑽𝒙𝒅
𝒊𝒒 𝒊𝒅
𝜽
𝒗𝒂𝒃𝒄 𝒊𝒂𝒃𝒄
𝑳𝒇 𝑹𝒇
𝑪𝑫𝑪
𝑪𝑫𝑪
Phase
reactor
AC filters
PWM
𝑪𝒇
PLL
Current
Control
dq
abc
dq
abc
AC
Side
(a) (b)
(c) Fig. 16. Comparison of dynamic responses obtained using AC link, AC-DC with conventional model, AC-DC link with simpower model.
(a) (b)
Fig. 17. Comparison of system dynamic responses obtained using proposed model and simpower model of HVDC links.
Fig. 18. System frequency deviation at different loading conditions of
HVDC link obtained using Matlab/simpower software platform.

0278-0046 (c) 2018 IEEE. Personal use is permitted, but republication/redistribution requires IEEE permission. See http://www.ieee.org/publications_standards/publications/rights/index.html for more information.
This article has been accepted for publication in a future issue of this journal, but has not been fully edited. Content may change prior to final publication. Citation information: DOI 10.1109/TIE.2018.2835387, IEEETransactions on Industrial Electronics
IEEE TRANSACTIONS ON INDUSTRIAL ELECTRONICS
Hence, synchronizing coefficient of HVDC link plays a
significant role in power system dynamics. In previous AGC
studies, aforementioned synchronization aspect of HVDC link
was completely ignored in existing transfer function model of
HVDC link. The existing model is independent of this HVDC
link‟s synchronization characteristic. However, proposed
model incorporates the synchronization characteristic and
describes its detailed dynamic behavior against the
interconnected grid. It shows that AGC dynamic performance
depends upon the synchronization coefficient or in other
words depends upon the degree of synchronization similar to AC link. The loading of HVDC links changes the degree of
synchronization between interconnecting power system areas.
As a result, it also changes the value of synchronization
coefficient and in turn it affects the AGC dynamic
performance. Finally based on the aforementioned findings, it
can be concluded that it was system design issue which was
not taken into account in previous AGC studies.
VII. CONCLUSIONS The significant contributions are given as follows:
1) For the first time, transfer function model of HVDC links
has been derived mathematically with physical as well as
analytical justifications. The model shows that adding HVDC link in parallel to AC link do not always improves the AGC
dynamic performance; instead system dynamic performance
depends upon the loading of HVDC link. As the loading of
HVDC link decreases, system dynamic performance
deteriorates due to the increased value of HVDC link
synchronizing coefficient. The inferences drawn remain the
same for both cases, with and without system GRCs. The
detailed simulation studies have also been performed in order
to validate the proposed model of HVDC links.
2) Furthermore proposed accurate model of HVDC link also
reveals that the HVDC links have their own synchronization coefficients similar to AC links. The power transfer between
the interconnecting power system areas via HVDC links
depends upon these synchronization coefficients.
3) It has also been proved analytically that the synchronization
coefficient of HVDC link is just half to that of AC link for
equal power transfer capability and loadings of both tie-links.
This indicates that if an AC link is completely replaced by
HVDC link of same size and capacity, then the HVDC link
will always exhibit better dynamic performance in comparison
to AC link because of its lesser value of torque
synchronization coefficient. However, if the HVDC link is
being added in parallel to AC link, then the system dynamic performance depends upon the overall synchronization
coefficient of AC-DC link. The study shows that HVDC link
synchronization coefficient decreases as the tie-link loading
reaches to its rated condition. Therefore, it is recommended to
operate HVDC links near to their ratings in order to achieve
better system dynamic performance.
4) The INEC strategy has been implemented in AGC to utilize
the stored energy of HVDC links for AGC operation.
Alongside physical and analytical justifications, the proposed
control strategy has been successfully implemented upon two-
area reheat thermal power system. To demonstrate the superiority of proposed control strategy, AGC system has been
tested for step load disturbances of power system. In each and
every case, proposed control strategy demonstrates better
dynamic performance in terms of maximum undershoot,
subsequent oscillations and settling time.
5) The INEC strategy allows to varying the HVDC link
voltage upto some pre-specified limits. Therefore, the impact
of various system parameters, mainly inertia constant 𝐻𝑉𝑆𝐶
and capacitance 𝐶𝐷𝐶 on HVDC system voltage has also been
studied. It has been discovered that selecting the higher values
of 𝐻𝑉𝑆𝐶 and the lower values 𝐶𝐷𝐶 improves the system dynamic performance. However, at the same time fluctuations
in HVDC system voltage also increases. Therefore, selecting
the values of 𝐻𝑉𝑆𝐶 and 𝐶𝐷𝐶 is the most critical part of the
proposed control strategy. These values of 𝐻𝑉𝑆𝐶 and 𝐶𝐷𝐶 must
be selected after keeping in view the maximum allowable
limits of HVDC system voltage variations.
APPENDIX I (a) AC link: The synchronization coefficient for AC link as shown in Fig.
1(b), can be written as follows:
𝑇12,𝐴𝐶 = 𝑃𝑚𝑎𝑥 ,𝐴𝐶 cos 𝛿10 − 𝛿2
0 (48)
Where: 𝑃𝑚𝑎𝑥 ,𝐴𝐶 = 𝑉1𝑉2 𝑋𝐿 represents the maximum power transfer
capacity of AC link.
(b) DC link: The synchronization coefficient has been derived for HVDC link
is given as follows:
𝑇𝑒𝑞𝑣 ,𝐷𝐶 = 𝑇12,𝐷𝐶𝑇21,𝐷𝐶 𝑇12,𝐷𝐶 + 𝑇21,𝐷𝐶 (49)
Where:
𝑇12,𝐷𝐶 = 𝑃𝑚𝑎𝑥 ,𝐷𝐶 cos 𝛿10 − 𝛾1
0 & 𝑇21,𝐷𝐶 = 𝑃𝑚𝑎𝑥 ,𝐷𝐶 cos 𝛿20 − 𝛾2
0 (50)
It is assumed that maximum power transfer capabilities of both AC and DC
links are equal i.e. 𝑃𝑚𝑎𝑥 ,𝐴𝐶 = 𝑃𝑚𝑎𝑥 ,𝐷𝐶 . Further, both links are equally loaded.
Hence, bus angle differences for both tie-links must be equal i.e. 𝛿10 − 𝛿2
0 =𝛿1
0 − 𝛾10 = 𝛿2
0 − 𝛾20 (for example, at 50% loading condition, all the bus angle
differences will be 300).
Applying these assumptions in Eqns. (48) & (50), following expression is
obtained:
𝑇12,𝐴𝐶 = 𝑇12,𝐷𝐶 = 𝑇21,𝐷𝐶 (51)
Substituting Eqn. (51) into Eqn. (49), the following relation is obtained:
𝑇𝑒𝑞𝑣 ,𝐷𝐶 = 𝑇12,𝐴𝐶 2 (52)
APPENDIX II Parameters values of two-area reheat thermal power system:
𝑓0=60Hz, 𝑃𝑟1=2000MW, 𝑃𝑟2=1000MW, 𝑇𝑝1 = 𝑇𝑝2=20s, 𝑇𝑆𝐶1 = 𝑇𝑆𝐶2=0.3s,
𝐾𝑅𝐻1 = 𝐾𝑅𝐻2 =0.5, 𝑅1=𝑅2=2.4Hz/𝑀𝑊𝑝 .𝑢 ., 𝐾𝑝1=𝐾𝑝2=120.048Hz/𝑀𝑊𝑝 .𝑢 .,
𝐵1=𝐵2= 0.425𝑀𝑊𝑝 .𝑢 ./Hz, 𝑇𝑔1=𝑇𝑔2=0.08s and 𝑎12=2.
Optimized values of supplementary controller gains:
(a) With GRCs: 𝐾𝐼1=0.255, 𝐾𝐼2=0.151 (b) Without GRCs: 𝐾𝐼1= 0.686, 𝐾𝐼2=
0.117
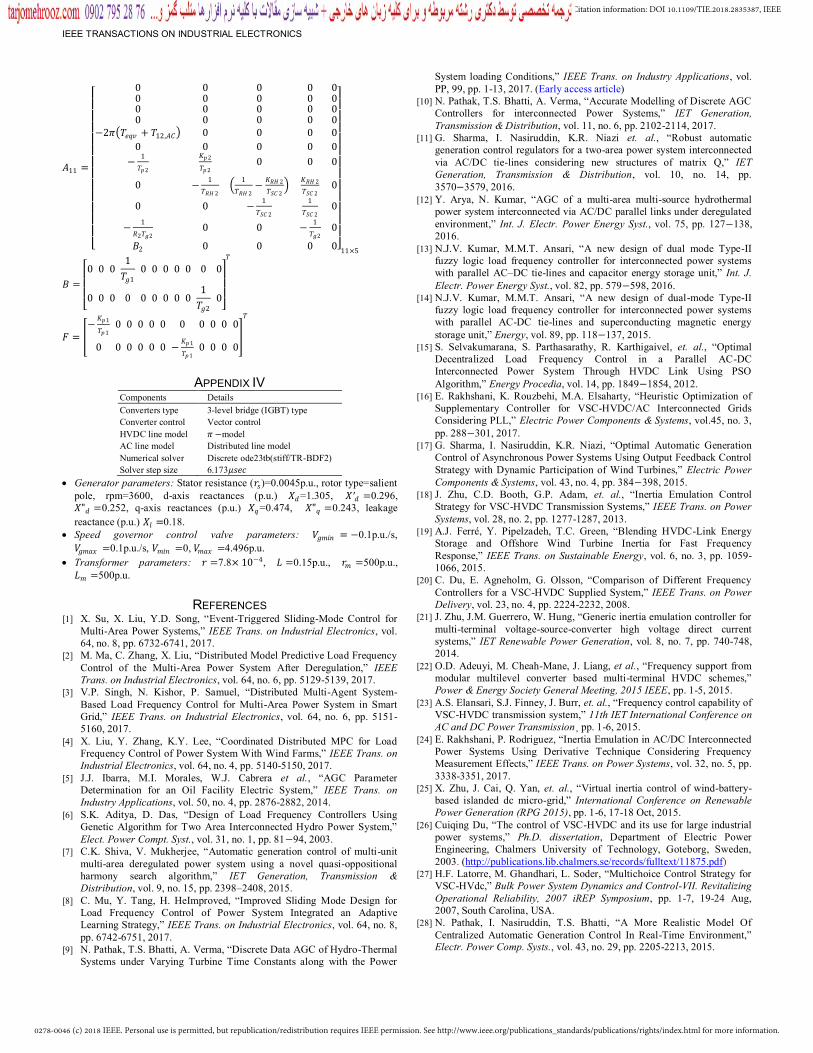
APPENDIX III 𝐴 = 𝐴11 𝐴12 , where matrices 𝐴11 and 𝐴12 are given as follows:
𝐴11
=
−
1
𝑇𝑝1
𝐾𝑝1
𝑇𝑝1
0 0 −𝐾𝑝1
𝑇𝑝1
0
0 −1
𝑇𝑅𝐻1
1
𝑇𝑅𝐻1
−𝐾𝑅𝐻1
𝑇𝑆𝐶1
𝐾𝑅𝐻1
𝑇𝑆𝐶1
0 0
0 0 −1
𝑇𝑆𝐶1
1
𝑇𝑆𝐶1
0 0
−1
𝑅1𝑇𝑔1
0 0 −1
𝑇𝑔1
0 0
2𝜋 𝑇𝑒𝑞𝑣 + 𝑇12,𝐴𝐶 0 0 0 0 0
𝐵1 0 0 0 1 0
0 0 0 0𝑎12𝐾𝑝2
𝑇𝑝2
0
0 0 0 0 0 00 0 0 0 0 00 0 0 0 0 00 0 0 0 −𝑎12 0
11×6
0278-0046 (c) 2018 IEEE. Personal use is permitted, but republication/redistribution requires IEEE permission. See http://www.ieee.org/publications_standards/publications/rights/index.html for more information.
This article has been accepted for publication in a future issue of this journal, but has not been fully edited. Content may change prior to final publication. Citation information: DOI 10.1109/TIE.2018.2835387, IEEETransactions on Industrial Electronics
IEEE TRANSACTIONS ON INDUSTRIAL ELECTRONICS
𝐴11 =
0 0 0 0 00 0 0 0 00 0 0 0 00 0 0 0 0
−2𝜋 𝑇𝑒𝑞𝑣 + 𝑇12,𝐴𝐶 0 0 0 0
0 0 0 0 0
−1
𝑇𝑝2
𝐾𝑝2
𝑇𝑝20 0 0
0 −1
𝑇𝑅𝐻 2
1
𝑇𝑅𝐻 2−
𝐾𝑅𝐻 2
𝑇𝑆𝐶 2
𝐾𝑅𝐻 2
𝑇𝑆𝐶 20
0 0 −1
𝑇𝑆𝐶 2
1
𝑇𝑆𝐶 20
−1
𝑅2𝑇𝑔20 0 −
1
𝑇𝑔20
𝐵2 0 0 0 0
11×5
𝐵 =
0 0 0
1
𝑇𝑔1
0 0 0 0 0 0 0
0 0 0 0 0 0 0 0 01
𝑇𝑔2
0 𝑇
𝐹 = −
𝐾𝑝1
𝑇𝑝10 0 0 0 0 0 0 0 0 0
0 0 0 0 0 0 −𝐾𝑝1
𝑇𝑝10 0 0 0
𝑇
APPENDIX IV
Components Details
Converters type 3-level bridge (IGBT) type
Converter control Vector control
HVDC line model 𝜋 −model
AC line model Distributed line model
Numerical solver Discrete ode23tb(stiff/TR-BDF2)
Solver step size 6.173𝜇𝑠𝑒𝑐
Generator parameters: Stator resistance (𝑟𝑠)=0.0045p.u., rotor type=salient
pole, rpm=3600, d-axis reactances (p.u.) 𝑋𝑑=1.305, 𝑋′𝑑 =0.296,
𝑋"𝑑 =0.252, q-axis reactances (p.u.) 𝑋𝑞=0.474, 𝑋"𝑞 =0.243, leakage
reactance (p.u.) 𝑋𝑙 =0.18.
Speed governor control valve parameters: 𝑉𝑔𝑚𝑖𝑛 = −0.1p.u./s,
𝑉𝑔𝑚𝑎𝑥 =0.1p.u./s, 𝑉𝑚𝑖𝑛 =0, 𝑉𝑚𝑎𝑥 =4.496p.u.
Transformer parameters: 𝑟 =7.8× 10⁻⁴, 𝐿 =0.15p.u., 𝑟𝑚 =500p.u.,
𝐿𝑚 =500p.u.
REFERENCES [1] X. Su, X. Liu, Y.D. Song, “Event-Triggered Sliding-Mode Control for
Multi-Area Power Systems,” IEEE Trans. on Industrial Electronics, vol.
64, no. 8, pp. 6732-6741, 2017.
[2] M. Ma, C. Zhang, X. Liu, “Distributed Model Predictive Load Frequency
Control of the Multi-Area Power System After Deregulation,” IEEE
Trans. on Industrial Electronics, vol. 64, no. 6, pp. 5129-5139, 2017.
[3] V.P. Singh, N. Kishor, P. Samuel, “Distributed Multi-Agent System-
Based Load Frequency Control for Multi-Area Power System in Smart
Grid,” IEEE Trans. on Industrial Electronics, vol. 64, no. 6, pp. 5151-
5160, 2017.
[4] X. Liu, Y. Zhang, K.Y. Lee, “Coordinated Distributed MPC for Load
Frequency Control of Power System With Wind Farms,” IEEE Trans. on
Industrial Electronics, vol. 64, no. 4, pp. 5140-5150, 2017.
[5] J.J. Ibarra, M.I. Morales, W.J. Cabrera et al., “AGC Parameter
Determination for an Oil Facility Electric System,” IEEE Trans. on
Industry Applications, vol. 50, no. 4, pp. 2876-2882, 2014.
[6] S.K. Aditya, D. Das, “Design of Load Frequency Controllers Using
Genetic Algorithm for Two Area Interconnected Hydro Power System,”
Elect. Power Compt. Syst., vol. 31, no. 1, pp. 81−94, 2003.
[7] C.K. Shiva, V. Mukherjee, “Automatic generation control of multi-unit
multi-area deregulated power system using a novel quasi-oppositional
harmony search algorithm,” IET Generation, Transmission &
Distribution, vol. 9, no. 15, pp. 2398–2408, 2015.
[8] C. Mu, Y. Tang, H. HeImproved, “Improved Sliding Mode Design for
Load Frequency Control of Power System Integrated an Adaptive
Learning Strategy,” IEEE Trans. on Industrial Electronics, vol. 64, no. 8,
pp. 6742-6751, 2017.
[9] N. Pathak, T.S. Bhatti, A. Verma, “Discrete Data AGC of Hydro-Thermal
Systems under Varying Turbine Time Constants along with the Power
System loading Conditions,” IEEE Trans. on Industry Applications, vol.
PP, 99, pp. 1-13, 2017. (Early access article)
[10] N. Pathak, T.S. Bhatti, A. Verma, “Accurate Modelling of Discrete AGC
Controllers for interconnected Power Systems,” IET Generation,
Transmission & Distribution, vol. 11, no. 6, pp. 2102-2114, 2017.
[11] G. Sharma, I. Nasiruddin, K.R. Niazi et. al., “Robust automatic
generation control regulators for a two-area power system interconnected
via AC/DC tie-lines considering new structures of matrix Q,” IET
Generation, Transmission & Distribution, vol. 10, no. 14, pp.
3570−3579, 2016.
[12] Y. Arya, N. Kumar, “AGC of a multi-area multi-source hydrothermal
power system interconnected via AC/DC parallel links under deregulated
environment,” Int. J. Electr. Power Energy Syst., vol. 75, pp. 127−138,
2016.
[13] N.J.V. Kumar, M.M.T. Ansari, “A new design of dual mode Type-II
fuzzy logic load frequency controller for interconnected power systems
with parallel AC–DC tie-lines and capacitor energy storage unit,” Int. J.
Electr. Power Energy Syst., vol. 82, pp. 579−598, 2016.
[14] N.J.V. Kumar, M.M.T. Ansari, “A new design of dual-mode Type-II
fuzzy logic load frequency controller for interconnected power systems
with parallel AC-DC tie-lines and superconducting magnetic energy
storage unit,” Energy, vol. 89, pp. 118−137, 2015.
[15] S. Selvakumarana, S. Parthasarathy, R. Karthigaivel, et. al., “Optimal
Decentralized Load Frequency Control in a Parallel AC-DC
Interconnected Power System Through HVDC Link Using PSO
Algorithm,” Energy Procedia, vol. 14, pp. 1849−1854, 2012.
[16] E. Rakhshani, K. Rouzbehi, M.A. Elsaharty, “Heuristic Optimization of
Supplementary Controller for VSC-HVDC/AC Interconnected Grids
Considering PLL,” Electric Power Components & Systems, vol.45, no. 3,
pp. 288−301, 2017.
[17] G. Sharma, I. Nasiruddin, K.R. Niazi, “Optimal Automatic Generation
Control of Asynchronous Power Systems Using Output Feedback Control
Strategy with Dynamic Participation of Wind Turbines,” Electric Power
Components & Systems, vol. 43, no. 4, pp. 384−398, 2015.
[18] J. Zhu, C.D. Booth, G.P. Adam, et. al., “Inertia Emulation Control
Strategy for VSC-HVDC Transmission Systems,” IEEE Trans. on Power
Systems, vol. 28, no. 2, pp. 1277-1287, 2013.
[19] A.J. Ferré, Y. Pipelzadeh, T.C. Green, “Blending HVDC-Link Energy
Storage and Offshore Wind Turbine Inertia for Fast Frequency
Response,” IEEE Trans. on Sustainable Energy, vol. 6, no. 3, pp. 1059-
1066, 2015.
[20] C. Du, E. Agneholm, G. Olsson, “Comparison of Different Frequency
Controllers for a VSC-HVDC Supplied System,” IEEE Trans. on Power
Delivery, vol. 23, no. 4, pp. 2224-2232, 2008.
[21] J. Zhu, J.M. Guerrero, W. Hung, “Generic inertia emulation controller for
multi-terminal voltage-source-converter high voltage direct current
systems,” IET Renewable Power Generation, vol. 8, no. 7, pp. 740-748,
2014.
[22] O.D. Adeuyi, M. Cheah-Mane, J. Liang, et al., “Frequency support from
modular multilevel converter based multi-terminal HVDC schemes,”
Power & Energy Society General Meeting, 2015 IEEE, pp. 1-5, 2015.
[23] A.S. Elansari, S.J. Finney, J. Burr, et. al., “Frequency control capability of
VSC-HVDC transmission system,” 11th IET International Conference on
AC and DC Power Transmission¸ pp. 1-6, 2015.
[24] E. Rakhshani, P. Rodriguez, “Inertia Emulation in AC/DC Interconnected
Power Systems Using Derivative Technique Considering Frequency
Measurement Effects,” IEEE Trans. on Power Systems, vol. 32, no. 5, pp.
3338-3351, 2017.
[25] X. Zhu, J. Cai, Q. Yan, et. al., “Virtual inertia control of wind-battery-
based islanded dc micro-grid,” International Conference on Renewable
Power Generation (RPG 2015), pp. 1-6, 17-18 Oct, 2015.
[26] Cuiqing Du, “The control of VSC-HVDC and its use for large industrial
power systems,” Ph.D. dissertation, Department of Electric Power
Engineering, Chalmers University of Technology, Goteborg, Sweden,
2003. (http://publications.lib.chalmers.se/records/fulltext/11875.pdf)
[27] H.F. Latorre, M. Ghandhari, L. Soder, “Multichoice Control Strategy for
VSC-HVdc,” Bulk Power System Dynamics and Control-VII. Revitalizing
Operational Reliability, 2007 iREP Symposium, pp. 1-7, 19-24 Aug,
2007, South Carolina, USA.
[28] N. Pathak, I. Nasiruddin, T.S. Bhatti, “A More Realistic Model Of
Centralized Automatic Generation Control In Real-Time Environment,” Electr. Power Comp. Systs., vol. 43, no. 29, pp. 2205-2213, 2015.
0278-0046 (c) 2018 IEEE. Personal use is permitted, but republication/redistribution requires IEEE permission. See http://www.ieee.org/publications_standards/publications/rights/index.html for more information.
This article has been accepted for publication in a future issue of this journal, but has not been fully edited. Content may change prior to final publication. Citation information: DOI 10.1109/TIE.2018.2835387, IEEETransactions on Industrial Electronics
IEEE TRANSACTIONS ON INDUSTRIAL ELECTRONICS
BIOGRAPHIES
Nikhil Pathak (S‟17) received the B.Tech degree in
electrical and electronics engineering from IIMT
engineering College, Meerut, India, in 2012 and the
M.Tech degree in electrical power system &
management from Jamia Millia Islamia University, New
Delhi, India, in 2014. He is currently working toward
the Ph.D. degre e in power system operation and control
from the Centre for Energy Studies, Indian Institute of Technology Delhi,
New Delhi, India. His research interest focuses on automatic generation
control (AGC) of thermal and hydropower system as well as intelligent
control techniques in AGC.
Ashu Verma (M‟12−SM‟17) received the M.Tech
degree in power systems in 2002 and the Ph.D. degree in
transmission expansion planning in 2010, both from
Indian Institute of Technology Delhi, New Delhi, India.
She is currently an Assistant Professor with the Centre
for Energy Studies, Indian Institute of Technology, New
Delhi. She also worked as an Assistant Engineer in
Nathpa Jhakri Hydro Electric Project, H.P. Her current
research interests include power system planning, operation and control
aspects of integrated renewable energy systems, policy and regulatory
framework for enabling large scale integration of renewable energy sources in
India.
T.S. Bhatti received the Ph.D. degree in power system
operation and control from the Department of Electrical
Engineering, Indian Institute of Technology Delhi, New
Delhi, India, in 1985. He is currently a Professor with
the Centre for Energy Studies, Indian Institute of
Technology Delhi. He has been involved in teaching
and research at Indian Institute of Technology Delhi
since 1980. During 1987, he was a Postdoctoral Fellow
at the University of Newcastle, Callaghan, NSW, Australia. His research
interests include reactive power control, automatic generation control, wind
energy conversion systems and small-hydropower systems.
Ibraheem Nasiruddin received the Ph.D. degree in
power systems from the Department of Electrical
Engineering, Aligarh Muslim University (AMU),
Aligarh, India, in 2000. He is currently working in the
Department of Electrical Engineering, Qassim
Engineering College, Qassim University, Kingdom of
Saudi Arabia, as a Full Professor. Before taking this
assignment, he worked at Jamia Millia Islamia, New
Delhi, India, for more than 25 years as teaching faculty and in various other
positions. His research interests include power system operation and control,
optimal control theory applications in power systems, application of
intelligent controls in deregulated power systems and renewable energy
systems.