modeling of the tohoku oki 2011 tsunami … · · 2015-04-14hereafter, we first briefly describe...
TRANSCRIPT

Coastal Dynamics 2013 Paper No.
MODELING OF THE TOHOKU-OKI 2011 TSUNAMI GENERATION, FAR-FIELD AND
COASTAL IMPACT: A MIXED CO-SEISMIC AND SMF SOURCE
Stephan Grilli1, Jeffrey C. Harris1,2, James T. Kirby3, Fengyan Shi3, Gangfeng Ma4, Tim Masterlark5, David Tappin6 and Tayebeh S. Tajalli Bakhsh1
Abstract Tsunami hazard assessment for future megathrust earthquakes requires that we understand the source mechanisms and tsunami generation processes for large historical events, such as the devastating Tohoku-oki tsunami of March 11th 2011. Although associated with a Magnitude 9 earthquake, simulations of the tsunami based solely on this co-seismic source do not reproduce the elevated runup heights of 40 m along the coast of northern Honshu, nor the wave timing and high frequency wave periods recorded at offshore GPS and DART buoys. Here, we show that an additional tsunami source associated with a large submarine mass failure (SMF), triggered North-East of the main source after a 2 min. delay, satisfies the necessary observations. To do so, we model the tsunami sourced from both earthquake and SMF. This dual source reproduces both the recorded onshore runups and the wave heights and wave frequencies recorded at offshore buoys. The significant contribution from an SMF to the Tohoku-oki tsunami has important implications for assessing coastal hazard from future megathrust earthquake events. Key words: Tsunami generation, coastal hazard, runup and inundation, landslide tsunami. 1. Introduction A careful modeling of the 2011 Tohoku-oki tsunami generation and coastal impact using the latest generation dispersive/non-hydrostatic models (Kirby et al., 2013; Ma et al., 2012; Shi et al., 2012) shows that its devastating coastal impact cannot be fully explained by a co-seismic source alone, even when assimilating all available geodetic data onland and underwater (Grilli et al., 2012a,b). Using the best available co-seismic source for the event, but without assimilating any tsunami observation as proposed by some (Fuji and Satake, 2011; Romano et al., 2012; Takagawa and Tomita, 2012), Grilli et al.’s (2012a,b) simulations fail to reproduce the elevated tsunami runup heights of up to 40 m along the (Sanriku) coast of northern Honshu, and the large amplitude higher frequency dispersive waves (of 3-4 min. period) recorded at offshore buoys (both GPS and DART). To account for these discrepancies, here, we identify and parameterize an additional source responsible for the generation of the observed higher-frequency tsunami waves and high focused runup and inundation, in the form of a large rotational Submarine Mass Failure (SMF), which we source north of the main rupture, based on travel time of the higher frequency waves. Using the three-dimensional (3D) (sigma-layer) non-hydrostatic model NHWAVE (Ma et al., 2012), we simulate tsunami generation triggered by a time and space dependent seafloor motion, due to the combination of: (i) a novel co-seismic source based on a detailed 3D Finite Element Modeling (FEM) of the heterogeneous subduction zone, with geodetic data assimilation, that slightly updates our earlier source (Grilli et al., 2012a,b); and (ii) the additional tsunami source from the SMF, triggered with a 2 min. time delay, whose kinematics is specified based on earlier scaling and modeling work (Grilli and Watts, 2005). After 5 min. of simulations in NHWAVE, tsunami waves are re-interpolated onto the nonlinear and dispersive model FUNWAVE-TVD two-dimensional grid, in Cartesian coordinates for near-field simulations (Shi et al., 2012) and in spherical coordinates for far-field simulations (Kirby et al., 2013). Various levels of grid nesting are used, both in near- and far-field, with bathymetric/topographic data of
1Dept. of Ocean Engineering, University of Rhode Island, Narragansett, RI 02882, USA, [email protected] 2Laboratoire St Venant, EDF Chatou, France, [email protected] 3Center for Appl. Coastal Res., University of Delaware, Newark, DE 19716, USA, [email protected], [email protected] 4Dept. Civil and Environmental Engineering, Old Dominion University, Norfolk, VA 23529, USA, [email protected] 5Dept. of Geol. Geol. Engng., S. Dakota Sc. of Mines&Tech., Rapid City, SD, USA, [email protected] 6British Geological Survey, Kingsley Dunham Centre, Keyworth, Nottingham, NG12 5GG, UK, [email protected]

Coastal Dynamics 2013 Paper No.
commensurate accuracy. In results, detailed below, we show that the multi-source tsunami simulations agree well with all the available near-field observations, both onshore (runup/inundation) and offshore (GPS and DART buoy data), as well as far-field observations (DART buoys), as far as South America. It should be stressed that this good agreement is achieved without assimilating any of the tsunami observations in the source (which most of the models proposed to date have done). Hence, our simulations are robust. Hereafter, we first briefly describe our numerical modeling methodology and then present numerical results, with their comparison to field data wherever available. 2. Methodology
3.1 Tsunami wave modeling
In tsunami propagation and runup simulations, we use FUNWAVE-TVD, which is the most recent implementation of our Boussinesq model (BM), in Cartesian (Shi et al. 2012) or spherical coordinates with Coriolis effects (Kirby et al., 2013). The code uses a TVD (Total Variation Diminishing) shock-capturing algorithm that more accurately simulates wave breaking and inundation by turning off dispersive terms once wave breaking is detected (hence solving Nonlinear Shallow Water (NSW) equations during breaking). Earlier work has shown that the numerical diffusion resulting from the TVD scheme yields an accurate representation of wave height decay in the surfzone (Shi et al., 2012). FUNWAVE-TVD has been validated for tsunami propagation and coastal impact, against a large set of analytical, laboratory, and field benchmarks, as part of the development of tsunami hazard maps for the US East Coast (Tehranirad et al., 2011). Because of their more complex equations, BMs are typically more computationally demanding than NSW models. For this reason, an optimized MPI parallel implementation of FUNWAVE-TVD was developed, which has highly scalable algorithms with a typical acceleration of computations of more than 90% the number of cores in a typical medium size computer cluster. This makes it possible running the model over large ocean basin-scale grids with a sufficiently fine resolution. Another important aspect of tsunami generation resulting from large mega-thrust earthquakes, such as the 2004 Indian Ocean (Grilli et al., 2007) and the Tohoku event, is that the co-seismic source is highly variable in space and time. For Tohoku, this could be seen for instance in results of seismic inversion models (Yue and Lay, 2011), where the main rupture lasted for 4-5 min., gradually displacing various parts of the seafloor in the 200 by 500 km source area (Fig. 1a). Hence, in tsunami simulations of the Tohoku event, in contrast to the standard approach of specifying co-seismic tsunami sources as an instantaneous initial free surface elevation (without velocity), we specify the co-seismic source as a time sequence that mimics seismic inversion results; furthermore, owing to the large variability in space and depth-range of the seafloor deformation, instead of specifying the seafloor deformation on the free surface of the BM model (as is customary), we trigger the co-seismic tsunami source as a time-dependent seafloor displacement/boundary condition (Grilli et al., 2012b). As this was not a standard feature of FUNWAVE-TVD at the time (although now it is), we used the non-hydrostatic three-dimensional (3D) model NHWAVE (Ma et al., 2012) to compute the initial co-seismic tsunami generation (here up to t = 300 s). This model solves 3D Navier-Stokes equations for incompressible fluids in a σ-coordinate framework (typically with 3 levels), with the simplifying assumption of a single-valued free surface displacement. NHWAVE was validated for highly dispersive and transient landslide tsunami generation, by comparing numerical results to the laboratory data of Enet and Grilli (Enet and Grilli, 2007) as well as for all the standard tsunami benchmarks (Tehranirad et al., 2011). Here, NHWAVE will also be used to simultaneously simulate tsunami generation for the proposed additional SMF source, which it has been shown to be perfectly suitable to do. Numerical modeling of tsunami generation, propagation, and surface elevation/runup/inundation is thus carried out in a number of stages. First, the most likely tsunami sources are determined, and for Tohoku we propose here a mixed co-seismic and SMF source (as discussed in the introduction and detailed below). Second, the time-dependent seafloor motion resulting from these sources is specified as a bottom-boundary condition in NHWAVE, using the best available bathymetric and topographic grid, and tsunami generation and propagation simulations are carried out. Third, after an initial propagation in NHWAVE, results are re-interpolated into FUNWAVE-TVD grid to further simulate tsunami propagation and coastal impact. The accurate modeling of runup and inundation requires finer scale, nested model grids, because nearshore waves are very sensitive to changes in local bathymetry and onshore topography (particularly along the

Coastal Dynamics 2013 Paper No.
complex Sanriku coastline); this is done in FUNWAVE-TVD, using a one-way coupling approach. More details of bathymetric data used and tsunami model features can be found in Grilli et al. (2012a,b). [Note, since SMF tsunamis are typically made of shorter, more dispersive waves, their accurate simulation requires using a propagation model that includes frequency dispersion such as here NHWAVE and FUNWAVE-TVD.] Specifically, in the present Tohoku simulations, NHWAVE is used to simulate wave generation up to t = 300 s (in a 1000 m resolution Cartesian grid with 3 vertical σ-levels; Fig. 1b) from a new mixed co-seismic and SMF source, specified as time-dependent bottom motions. Then, results for both surface elevation and horizontal velocity (at the required 53% of the local depth for FUNWAVE) are re-interpolated onto FUNWAVE-TVD’s nearshore Cartesian grid, to further simulate tsunami propagation and coastal impact (runup/inundation) onshore, as well as offshore propagation. The latter is further calculated over the Pacific Ocean, by re-interpolating FUNWAVE-TVD’s regional grid results into a larger 2 arc-min. resolution ocean scale grid (Fig. 1b). To accurately compute coastal runup and inundation, up to three levels of FUNWAVE nested grids are used (with 1000, 250, and 50 m resolution; Fig. 1b). [Earth’s sphericity is corrected in the Cartesian coordinate grids with a transverse secant Mercator projection with its origin located at (39◦ N, 143◦ E).] In all simulations (FUNWAVE or NHWAVE), free-slip (wall) boundary conditions are applied on solid lateral boundaries. To prevent non-physical reflection from these boundaries, sponge layers are specified over a number of grid cells to absorb outgoing waves (inside of the outer domain boundary marked in Fig. 1b), for which damping terms are activated in the model equations. For the Pacific grid, sponge layers are 100 km thick along all lateral boundaries and, in the 1000 m regional grid, they are 50 km thick in the north and south ends of the domain, and 200 km thick in the east. Finally, in the 250 m coastal grid, sponge layers are 50 km thick along the north, east and south boundaries. Simulation results are validated by comparison with field data; for Tohoku these are time series of surface elevation at nearshore GPS and deep water DART buoys and flow depth/runup/inundation measured along the coast (Yamazaki et al., 2011). This is detailed in the following. (a) (b)
Figure 1. (a) Tohoku 2011 M9.1 earthquake seismotectonics (rupture is red polygon) and FEM domain (“model domain”); large symbol is the epicenter; yellow dots show M > 4 aftershocks (11 March – 06 May 2011); the Pacific-Okhotsk plate convergence is about 8 cm/yr. (b) Computational domains for FUNWAVE simulations: (i) near-field
(regional 1000 m resolution, 800 by 1200 km, and coastal 250 m, large/small red boxes; the 50 m grid off of the Sanriku coast is not shown) Cartesian grid (the 1000 m grid is also used for NHWAVE); and (ii) far-field (Pacific basin
scale) 2’ spherical grid from 132◦ E to 68◦ W and 60◦ S to 60◦ N), with marked location of 18 DART buoys (yellow/red dots) and nearshore GPS buoys (white dots).
3.1 Tsunami co-seismic source modeling A number of fault-slip models of the Tohoku earthquake have been published (Grilli et al., 2012b). Those based on inversion of seismic and geodetic data relate slip to deformation by assuming a superposition of planar dislocations (i.e., finite faults) embedded in either a homogeneous or layered elastic domain, having

Coastal Dynamics 2013 Paper No.
a stress-free surface. Grilli et al. (2012a,b) addressed the complex geometry, material properties, and structure of the Japan convergent margin by developing a novel co-seismic source (termed UA) that is representative of its actual geometry, the 3D inhomogeneous structure of the stiff, subducting Pacific Plate and the relatively weak, overlying accretionary complex, forearc, and volcanic arc of the overriding Okhotsk plate (Fig. 1a). From new inverse methods based on Green’s function obtained from FEMs (Masterlark, 2003), and using both on- and offshore geodetic data, they simulated fault-slip-driven elastic-dislocation-deformation at the toe of the accretionary complex. [An implementation of this approach for a mega-thrust earthquake was successfully validated and verified for the 2004 M9.1 Indian Ocean earthquake; Masterlark and Hughes, 2008.] The result was a more realistic co-seismic slip distribution and seafloor deformation, yielding more accurate tsunami generation as compared to other proposed sources (Fig. 2). As indicated above, in NHWAVE, seafloor motion was represented by time-dependent functions for each slip patch in the source area, estimated from Yue and Lay’s (2011) seismic inversion model.
(a) (b)
Figure 2. (a) Tohoku 2011 UA co-seismic source and horizontal deformation (Grilli et al., 2012b). The horizontal extent of the map delimits the model domain of the FEM. (b) Vertical co-seismic deformation. The observed vertical displacements (colored circles) are well predicted by the calibrated FEM source. Note the substantial uplift near the
trench (up to 11.4 m). The white star marks the position of the modeled SMF source (Fig. 3), and numbered black dots indicate locations of GPS buoys (time series at Nb. 3-7 are plotted in Fig. 5).
Figure 3. Maximum envelope of free surface elevation computed for the UA co-seismic tsunami source, for the Tohoku 2011 event, using NHWAVE for the initialization in a 1000 m resolution grid (up to 5 min. of propagation)
and then FUNWAVE-TVD for the propagation in the 2 arc min. basin-scale grid (Fig. 1b).
Coastal Dynamics 2013 Paper No.
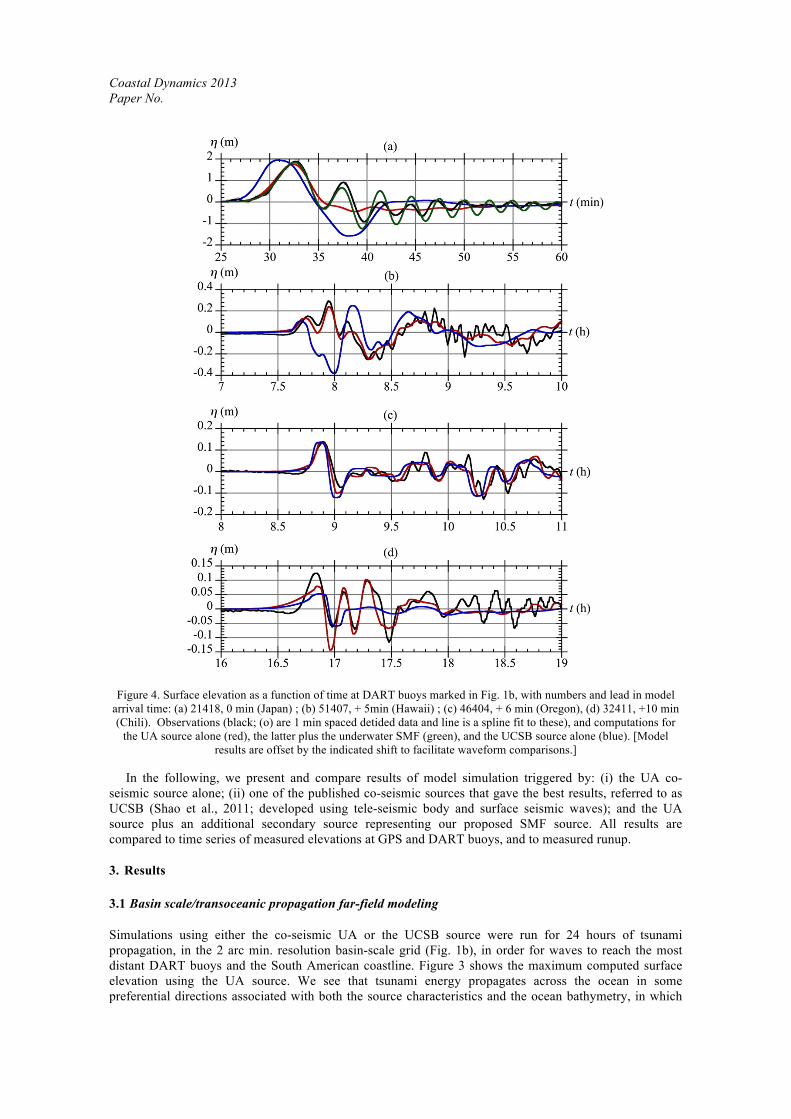
Figure 4. Surface elevation as a function of time at DART buoys marked in Fig. 1b, with numbers and lead in model arrival time: (a) 21418, 0 min (Japan) ; (b) 51407, + 5min (Hawaii) ; (c) 46404, + 6 min (Oregon), (d) 32411, +10 min (Chili). Observations (black; (o) are 1 min spaced detided data and line is a spline fit to these), and computations for
the UA source alone (red), the latter plus the underwater SMF (green), and the UCSB source alone (blue). [Model results are offset by the indicated shift to facilitate waveform comparisons.]
In the following, we present and compare results of model simulation triggered by: (i) the UA co-seismic source alone; (ii) one of the published co-seismic sources that gave the best results, referred to as UCSB (Shao et al., 2011; developed using tele-seismic body and surface seismic waves); and the UA source plus an additional secondary source representing our proposed SMF source. All results are compared to time series of measured elevations at GPS and DART buoys, and to measured runup.
3. Results 3.1 Basin scale/transoceanic propagation far-field modeling Simulations using either the co-seismic UA or the UCSB source were run for 24 hours of tsunami propagation, in the 2 arc min. resolution basin-scale grid (Fig. 1b), in order for waves to reach the most distant DART buoys and the South American coastline. Figure 3 shows the maximum computed surface elevation using the UA source. We see that tsunami energy propagates across the ocean in some preferential directions associated with both the source characteristics and the ocean bathymetry, in which

Coastal Dynamics 2013 Paper No.
ridges may cause wave-guiding effects. This is particularly clear for the eastward propagation towards Northern California, around 40◦ N; large wave oscillations (nearly 4 m trough to crest) and damage were indeed observed at this latitude in Crescent City, CA. For the far-field propagation, Kirby et al. (2013) further reported that Coriolis effects account only for up to ±5%, while dispersive effects for up to ±60%, of maximum surface elevations; hence, constructive and destructive wave interferences resulting from frequency dispersions are significant, even in deep water, in the far-field, which justifies using a BM in the modeling.
Figure 5. Surface elevations as a function of time at GPS buoys marked in Fig. 2b: (3) Matsu Ogawara; (4) North Iwate; (5) Central Iwate; (6) South Iwate; (7) North Miyagi. Observations (black), and computations for the UA source
alone (red), the latter plus the underwater SMF (green), and the UCSB source alone (blue).

Coastal Dynamics 2013 Paper No.
Figure 4 shows time series of surface elevations computed at a few DART buoys, for both co-seismic sources, as compared to measurements, close to Japan, in Hawaii, off of Oregon and Chili. Overall, results of the UA source capture well the observed long wave (i.e., low frequency) features of the tsunami in the far-field. By contrast, the UCSB source overpredicts the leading wave crest height at most locations and, most notably, overpredicts the amplitude of the leading wave troughs. At distant DART buoys, both the UA and UCSB sources predict that waves arrive slightly sooner than seen in observations, but this is more pronounced for the UCSB source, as well as the mismatch with observations. [Hence, to allow for an easier comparison, slight time shifts have been added to simulations in the figure, in order to synchronize the first elevation wave with that observed. These represent less than 1% of the tsunami propagation time and can be explained in part by a combination of grid and bathymetric resolution effects, as well as slight errors in the source location and triggering. Additional systematic errors on propagation times could results from the fact that the Earth is not perfectly spherical. For these simulations, we assumed an earth radius of 6,371 km.] 3.2 Near-field modeling In the near-field, by contrast, Figure 5 shows that the UA source accurately matches the long-wave features of the tsunami elevation measured at GPS buoys, but neither the UA, the UCSB, or other co-seismic sources can simulate the large higher frequency 3-4 min. period waves observed at the three buoys off of the Iwate prefecture (and the Sanriku coast). Similarly, at the nearest DART buoy #21418 (Fig. 4a), the UA source reproduces well the first wave crest, corresponding to the arrival of the leading co-seismic tsunami wave, but fails to simulate the next (6) oscillations in the higher frequency tsunami tail. Regarding onshore tsunami impact, we see in Figure 6 that simulations using the UA source alone significantly underpredict the maximum runup measured along the Sanriku coast (39.2-40.4 N), even considering the 50 m finer resolution grid and bathymetry/topography used there, while runup is reasonably well predicted elsewhere (considering the coarser 250 m grid used there). These results indicate that there should have been another source of tsunami generation in the near-field, besides the co-seismic source. Moreover, both the high-frequency waves observed at the Iwate GPS buoys, the large focused runup along 80 km of the Sanriku coast, and the near absence of these waves in the far-field, are typical signatures of tsunamis generated by submarine mass failures (Grilli and Watts, 2005; Enet and Grilli, 2007; Tappin et al., 2008). Hence, a SMF is proposed here as a second potential source of tsunami generation. The location for this SMF is sourced by performing a backward travel time analysis (ray tracing; not detailed here) for the dispersive waves measured at the three Iwate GPS and at the #21418 DART buoy; this leads to an area almost due east of the area of maximum runup, with elliptical footprint of about 40 by 20 km (Fig. 7a). To match the arrival time of waves at various buoys, this analysis also leads to a triggering delay for the SMF of 135 s. Geotechnical slope stability analyses (not detailed here) were performed to identify parts of the seafloor that are most unstable (smaller factor of safety) under seismic loading, which confirmed that this area of the seafloor is the most likely to have failed.
Figure 6: Comparison of simulated runup with measurements (black dots), for: UA co-seismic source alone (red), and
combined UA co-seismic plus SMF source (green).
Coastal Dynamics 2013 Paper No.
(a)
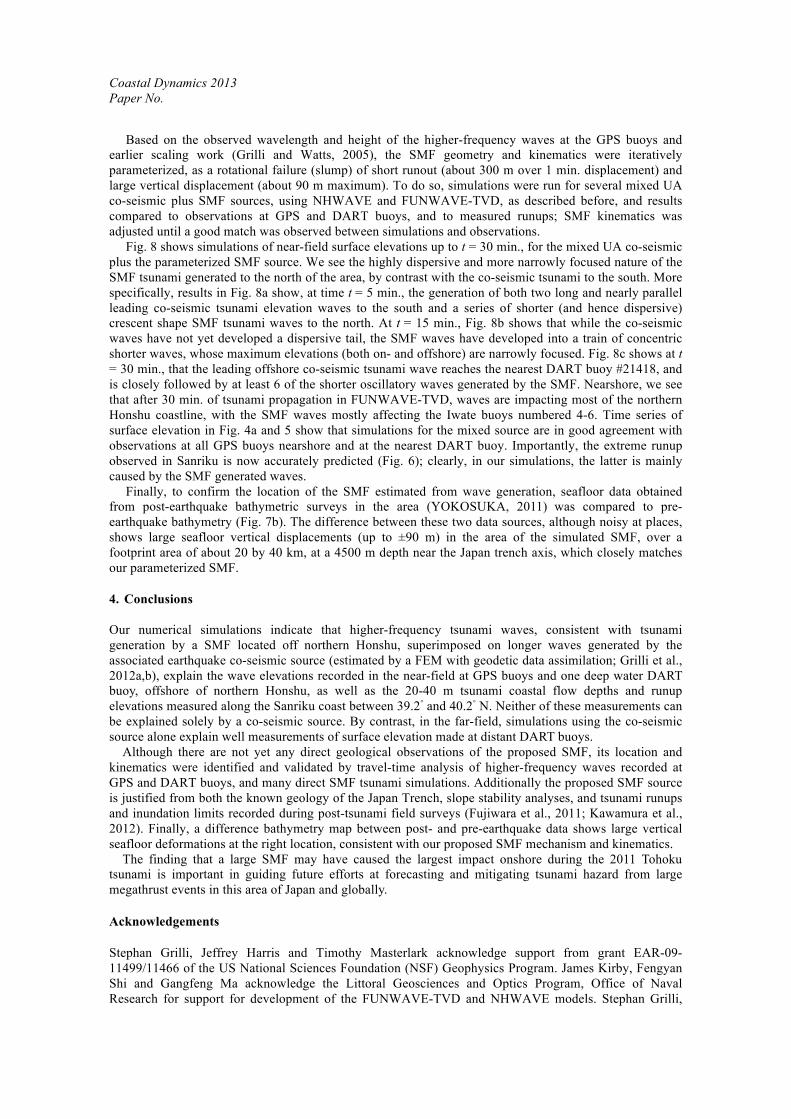
(b)
Figure 7. (a) Coastal topography and ocean bathymetry (from GEBCO) in the Japan Trench off the East Coast of
Tohoku (Fig. 1). The earthquake epicenter is marked by a star and the location of the modeled SMF is encircled in red (centered at 39.37°N, 144.00°E). The area of largest observed runup/inundation (around 39.5° N) along the Sanriku coast is also marked. (b) Detail of SMF source location (from Fig. 3a), showing surface difference values between post-March 11, 2011 multibeam bathymetric swaths (YOKOSUKA, 2011) (shown by white dotted lines) and pre-March 11 bathymetry draped on the latter. Note, SMF headscarp, downdrop at rear of SMF, and uplift at SMF toe.
Water depths from pre-earthquake bathymetry shown bottom right. Surface difference values.
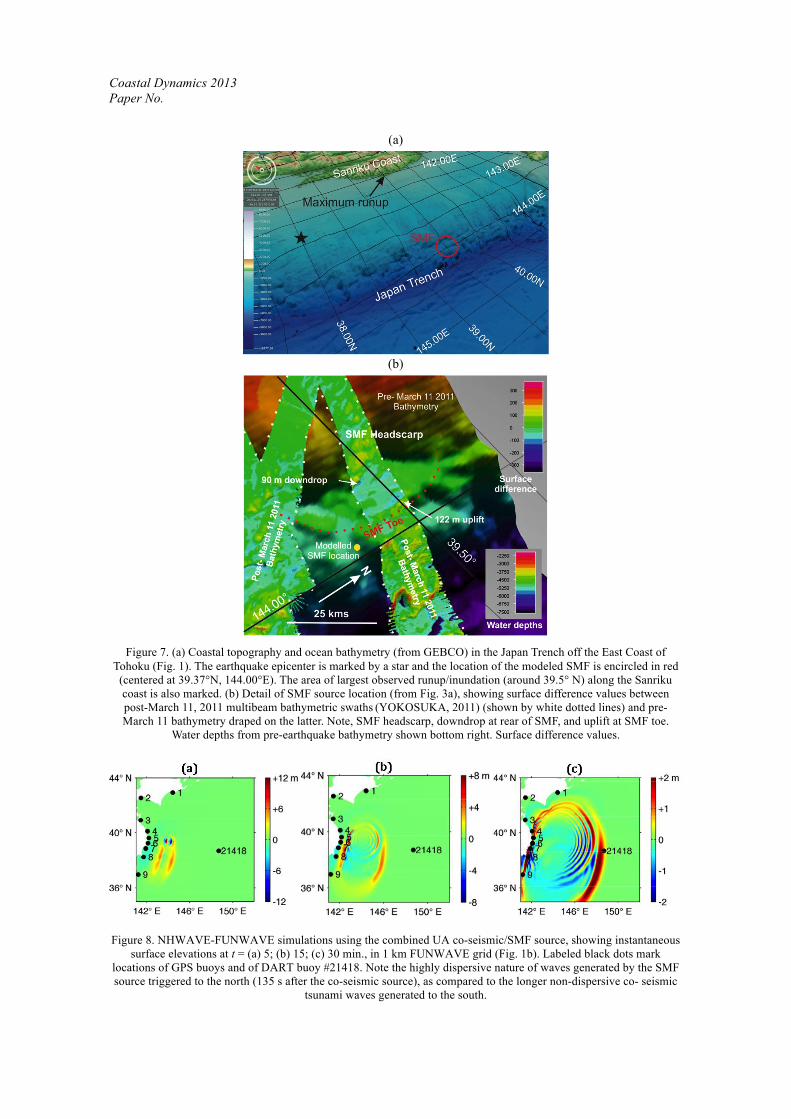
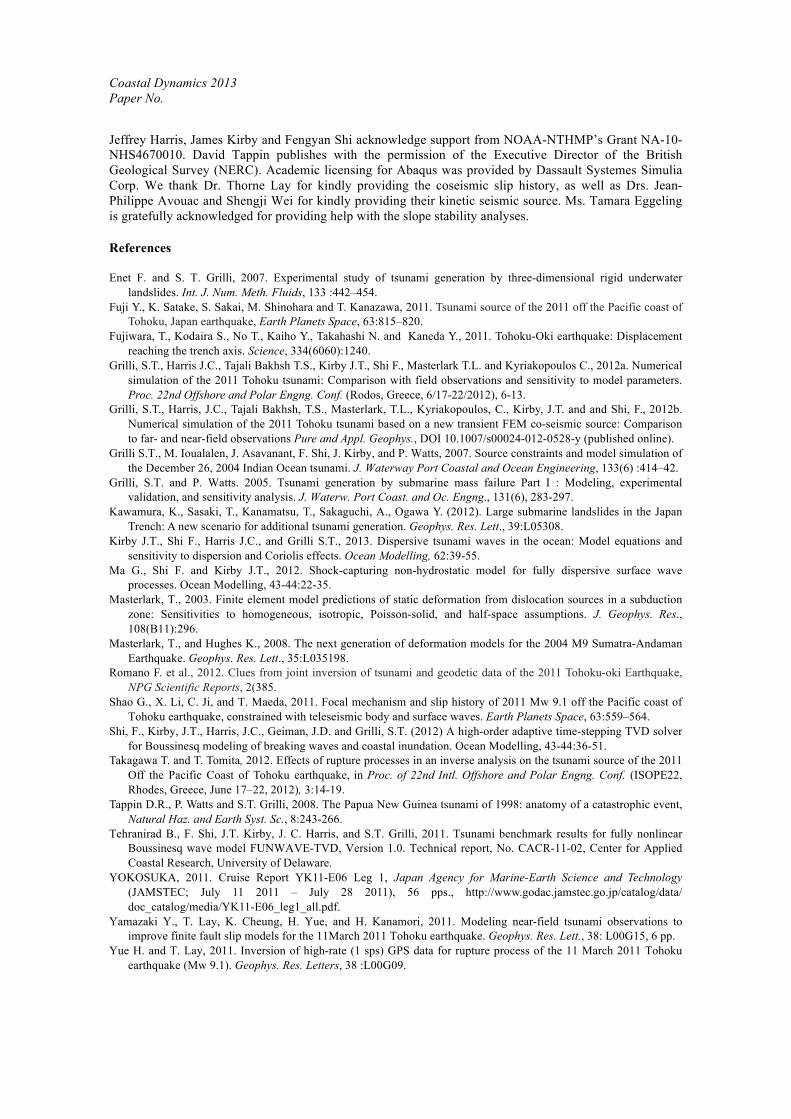
Figure 8. NHWAVE-FUNWAVE simulations using the combined UA co-seismic/SMF source, showing instantaneous
surface elevations at t = (a) 5; (b) 15; (c) 30 min., in 1 km FUNWAVE grid (Fig. 1b). Labeled black dots mark locations of GPS buoys and of DART buoy #21418. Note the highly dispersive nature of waves generated by the SMF source triggered to the north (135 s after the co-seismic source), as compared to the longer non-dispersive co- seismic
tsunami waves generated to the south.
Coastal Dynamics 2013 Paper No.
Based on the observed wavelength and height of the higher-frequency waves at the GPS buoys and earlier scaling work (Grilli and Watts, 2005), the SMF geometry and kinematics were iteratively parameterized, as a rotational failure (slump) of short runout (about 300 m over 1 min. displacement) and large vertical displacement (about 90 m maximum). To do so, simulations were run for several mixed UA co-seismic plus SMF sources, using NHWAVE and FUNWAVE-TVD, as described before, and results compared to observations at GPS and DART buoys, and to measured runups; SMF kinematics was adjusted until a good match was observed between simulations and observations. Fig. 8 shows simulations of near-field surface elevations up to t = 30 min., for the mixed UA co-seismic plus the parameterized SMF source. We see the highly dispersive and more narrowly focused nature of the SMF tsunami generated to the north of the area, by contrast with the co-seismic tsunami to the south. More specifically, results in Fig. 8a show, at time t = 5 min., the generation of both two long and nearly parallel leading co-seismic tsunami elevation waves to the south and a series of shorter (and hence dispersive) crescent shape SMF tsunami waves to the north. At t = 15 min., Fig. 8b shows that while the co-seismic waves have not yet developed a dispersive tail, the SMF waves have developed into a train of concentric shorter waves, whose maximum elevations (both on- and offshore) are narrowly focused. Fig. 8c shows at t = 30 min., that the leading offshore co-seismic tsunami wave reaches the nearest DART buoy #21418, and is closely followed by at least 6 of the shorter oscillatory waves generated by the SMF. Nearshore, we see that after 30 min. of tsunami propagation in FUNWAVE-TVD, waves are impacting most of the northern Honshu coastline, with the SMF waves mostly affecting the Iwate buoys numbered 4-6. Time series of surface elevation in Fig. 4a and 5 show that simulations for the mixed source are in good agreement with observations at all GPS buoys nearshore and at the nearest DART buoy. Importantly, the extreme runup observed in Sanriku is now accurately predicted (Fig. 6); clearly, in our simulations, the latter is mainly caused by the SMF generated waves. Finally, to confirm the location of the SMF estimated from wave generation, seafloor data obtained from post-earthquake bathymetric surveys in the area (YOKOSUKA, 2011) was compared to pre-earthquake bathymetry (Fig. 7b). The difference between these two data sources, although noisy at places, shows large seafloor vertical displacements (up to ±90 m) in the area of the simulated SMF, over a footprint area of about 20 by 40 km, at a 4500 m depth near the Japan trench axis, which closely matches our parameterized SMF. 4. Conclusions Our numerical simulations indicate that higher-frequency tsunami waves, consistent with tsunami generation by a SMF located off northern Honshu, superimposed on longer waves generated by the associated earthquake co-seismic source (estimated by a FEM with geodetic data assimilation; Grilli et al., 2012a,b), explain the wave elevations recorded in the near-field at GPS buoys and one deep water DART buoy, offshore of northern Honshu, as well as the 20-40 m tsunami coastal flow depths and runup elevations measured along the Sanriku coast between 39.2◦ and 40.2◦ N. Neither of these measurements can be explained solely by a co-seismic source. By contrast, in the far-field, simulations using the co-seismic source alone explain well measurements of surface elevation made at distant DART buoys. Although there are not yet any direct geological observations of the proposed SMF, its location and kinematics were identified and validated by travel-time analysis of higher-frequency waves recorded at GPS and DART buoys, and many direct SMF tsunami simulations. Additionally the proposed SMF source is justified from both the known geology of the Japan Trench, slope stability analyses, and tsunami runups and inundation limits recorded during post-tsunami field surveys (Fujiwara et al., 2011; Kawamura et al., 2012). Finally, a difference bathymetry map between post- and pre-earthquake data shows large vertical seafloor deformations at the right location, consistent with our proposed SMF mechanism and kinematics. The finding that a large SMF may have caused the largest impact onshore during the 2011 Tohoku tsunami is important in guiding future efforts at forecasting and mitigating tsunami hazard from large megathrust events in this area of Japan and globally. Acknowledgements Stephan Grilli, Jeffrey Harris and Timothy Masterlark acknowledge support from grant EAR-09-11499/11466 of the US National Sciences Foundation (NSF) Geophysics Program. James Kirby, Fengyan Shi and Gangfeng Ma acknowledge the Littoral Geosciences and Optics Program, Office of Naval Research for support for development of the FUNWAVE-TVD and NHWAVE models. Stephan Grilli,
Coastal Dynamics 2013 Paper No.
Jeffrey Harris, James Kirby and Fengyan Shi acknowledge support from NOAA-NTHMP’s Grant NA-10-NHS4670010. David Tappin publishes with the permission of the Executive Director of the British Geological Survey (NERC). Academic licensing for Abaqus was provided by Dassault Systemes Simulia Corp. We thank Dr. Thorne Lay for kindly providing the coseismic slip history, as well as Drs. Jean-Philippe Avouac and Shengji Wei for kindly providing their kinetic seismic source. Ms. Tamara Eggeling is gratefully acknowledged for providing help with the slope stability analyses. References Enet F. and S. T. Grilli, 2007. Experimental study of tsunami generation by three-dimensional rigid underwater
landslides. Int. J. Num. Meth. Fluids, 133 :442–454. Fuji Y., K. Satake, S. Sakai, M. Shinohara and T. Kanazawa, 2011. Tsunami source of the 2011 off the Pacific coast of
Tohoku, Japan earthquake, Earth Planets Space, 63:815–820. Fujiwara, T., Kodaira S., No T., Kaiho Y., Takahashi N. and Kaneda Y., 2011. Tohoku-Oki earthquake: Displacement
reaching the trench axis. Science, 334(6060):1240. Grilli, S.T., Harris J.C., Tajali Bakhsh T.S., Kirby J.T., Shi F., Masterlark T.L. and Kyriakopoulos C., 2012a. Numerical
simulation of the 2011 Tohoku tsunami: Comparison with field observations and sensitivity to model parameters. Proc. 22nd Offshore and Polar Engng. Conf. (Rodos, Greece, 6/17-22/2012), 6-13.
Grilli, S.T., Harris, J.C., Tajali Bakhsh, T.S., Masterlark, T.L., Kyriakopoulos, C., Kirby, J.T. and and Shi, F., 2012b. Numerical simulation of the 2011 Tohoku tsunami based on a new transient FEM co-seismic source: Comparison to far- and near-field observations Pure and Appl. Geophys., DOI 10.1007/s00024-012-0528-y (published online).
Grilli S.T., M. Ioualalen, J. Asavanant, F. Shi, J. Kirby, and P. Watts, 2007. Source constraints and model simulation of the December 26, 2004 Indian Ocean tsunami. J. Waterway Port Coastal and Ocean Engineering, 133(6) :414–42.
Grilli, S.T. and P. Watts. 2005. Tsunami generation by submarine mass failure Part I : Modeling, experimental validation, and sensitivity analysis. J. Waterw. Port Coast. and Oc. Engng., 131(6), 283-297.
Kawamura, K., Sasaki, T., Kanamatsu, T., Sakaguchi, A., Ogawa Y. (2012). Large submarine landslides in the Japan Trench: A new scenario for additional tsunami generation. Geophys. Res. Lett., 39:L05308.
Kirby J.T., Shi F., Harris J.C., and Grilli S.T., 2013. Dispersive tsunami waves in the ocean: Model equations and sensitivity to dispersion and Coriolis effects. Ocean Modelling, 62:39-55.
Ma G., Shi F. and Kirby J.T., 2012. Shock-capturing non-hydrostatic model for fully dispersive surface wave processes. Ocean Modelling, 43-44:22-35.
Masterlark, T., 2003. Finite element model predictions of static deformation from dislocation sources in a subduction zone: Sensitivities to homogeneous, isotropic, Poisson-solid, and half-space assumptions. J. Geophys. Res., 108(B11):296.
Masterlark, T., and Hughes K., 2008. The next generation of deformation models for the 2004 M9 Sumatra-Andaman Earthquake. Geophys. Res. Lett., 35:L035198.
Romano F. et al., 2012. Clues from joint inversion of tsunami and geodetic data of the 2011 Tohoku-oki Earthquake, NPG Scientific Reports, 2(385.
Shao G., X. Li, C. Ji, and T. Maeda, 2011. Focal mechanism and slip history of 2011 Mw 9.1 off the Pacific coast of Tohoku earthquake, constrained with teleseismic body and surface waves. Earth Planets Space, 63:559–564.
Shi, F., Kirby, J.T., Harris, J.C., Geiman, J.D. and Grilli, S.T. (2012) A high-order adaptive time-stepping TVD solver for Boussinesq modeling of breaking waves and coastal inundation. Ocean Modelling, 43-44:36-51.
Takagawa T. and T. Tomita, 2012. Effects of rupture processes in an inverse analysis on the tsunami source of the 2011 Off the Pacific Coast of Tohoku earthquake, in Proc. of 22nd Intl. Offshore and Polar Engng. Conf. (ISOPE22, Rhodes, Greece, June 17–22, 2012), 3:14-19.
Tappin D.R., P. Watts and S.T. Grilli, 2008. The Papua New Guinea tsunami of 1998: anatomy of a catastrophic event, Natural Haz. and Earth Syst. Sc., 8:243-266.
Tehranirad B., F. Shi, J.T. Kirby, J. C. Harris, and S.T. Grilli, 2011. Tsunami benchmark results for fully nonlinear Boussinesq wave model FUNWAVE-TVD, Version 1.0. Technical report, No. CACR-11-02, Center for Applied Coastal Research, University of Delaware.
YOKOSUKA, 2011. Cruise Report YK11-E06 Leg 1, Japan Agency for Marine-Earth Science and Technology (JAMSTEC; July 11 2011 – July 28 2011), 56 pps., http://www.godac.jamstec.go.jp/catalog/data/ doc_catalog/media/YK11-E06_leg1_all.pdf.
Yamazaki Y., T. Lay, K. Cheung, H. Yue, and H. Kanamori, 2011. Modeling near-field tsunami observations to improve finite fault slip models for the 11March 2011 Tohoku earthquake. Geophys. Res. Lett., 38: L00G15, 6 pp.
Yue H. and T. Lay, 2011. Inversion of high-rate (1 sps) GPS data for rupture process of the 11 March 2011 Tohoku earthquake (Mw 9.1). Geophys. Res. Letters, 38 :L00G09.