modeling the effect of flow mal-distribution on the performance of a catalytic converter
TRANSCRIPT

Chemical Engineering Science 71 (2012) 310–320
Contents lists available at SciVerse ScienceDirect
Chemical Engineering Science
0009-25
doi:10.1
n Corr
E-m
journal homepage: www.elsevier.com/locate/ces
Modeling the effect of flow mal-distribution on the performance of acatalytic converter
Gaurav Agrawal a, Niket S. Kaisare a,b, S. Pushpavanam a,n, Karthik Ramanathan b
a Department of Chemical Engineering, Indian Institute of Technology, Chennai 600036, Indiab India Science Laboratory, General Motors Global Research and Development Center, Bangalore 560066, Karnataka, India
a r t i c l e i n f o
Article history:
Received 18 September 2011
Received in revised form
26 December 2011
Accepted 26 December 2011Available online 4 January 2012
Keywords:
Catalytic convertor
Flow mal-distribution
Chemical reactors
Simulation
Transport processes
Reaction engineering
09/$ - see front matter & 2011 Elsevier Ltd. A
016/j.ces.2011.12.041
esponding author. Tel.: þ91 44 2257 4161; f
ail address: [email protected] (S. Pushpavanam
a b s t r a c t
A numerical study of the interaction between flow, reactions and thermal effects in a planar two
dimensional model of a catalytic convertor is presented. A typical catalytic convertor consists of an inlet
manifold, a catalytic monolith and an outlet manifold. The catalytic monolith is modeled as a multi-
channel structure. Two different planar 2D geometries are compared: a full-scale geometry with 85
channels and a reduced-scale model with 21 channels. The diverging diffuser section of the inlet
manifold, which lies immediately upstream the catalytic monolith, induces flow non-uniformity along
the transverse direction. The flow immediately upstream of the multi-channel monolith is highly non-
uniform. However, the frictional pressure drop in the individual channels tends to reduce this non-
uniformity within individual channels. A ‘‘flow distribution index’’ – ratio of actual flow-rate in a
channel to the ideal expected flow-rate if the flow was uniform – is defined to numerically characterize
the flow mal-distribution across the various channels in the monolith. The velocity and scale effects are
analyzed. Higher inlet velocities induce more flow non-uniformity. Catalytic oxidation of CO repre-
sented by power-law kinetics is employed to study the role of flow distribution. The flow distribution
affects the conversion in the catalytic convertor, with different conversions in central and peripheral
channels of the monolith. The net conversion from the device is marginally lower than what is
predicted by single channel simulations with an assumption of uniform flow distribution. The thermal
effects due to heat losses and reactions also in turn affect flow distribution. The flow tends to be more
uniform when heat losses are included in the non-adiabatic simulations for the geometric parameters
and kinetics considered in this work.
& 2011 Elsevier Ltd. All rights reserved.
1. Introduction
Three way catalytic converters (TWC) are used to reduce theimpact of exhaust gases on air quality. The economic growth ofseveral countries such as China and India has resulted in a drasticincrease in the number of vehicles on the road. Stricter normssuch as Euro 6 are being evolved to reduce the impact of vehicleemissions on air quality. The design of these catalytic convertersto meet the stringent emission standards can be improved usingmathematical modeling of the entire catalytic convertor device(Koltsakis and Stamatelos, 1997).
A typical catalytic converter is made of a ceramic ‘‘monolith’’substrate. It consists of several hundreds of channels runningthrough the length of the monolith. A sectional view is schema-tically shown in Fig. 2. The channels are usually 1 mm or less indiameter. The channel walls are coated with a thin washcoat
ll rights reserved.
ax: þ91 44 2257 0509.
).
(usually made of alumina, ceria, or other metal oxides), whichsupport the noble metal catalysts (Pt, Pd and Rh). The overallarrangement of channels in the cross-section resembles a honey-comb like structure within the monolith (Chakravarthy et al.,2003). The complete catalytic convertor assembly consists of aninlet manifold – consisting of an inlet pipe of uniform cross-section followed by a diverging section – which leads to thecatalytic monolith; the gases exiting the monolith pass through aconverging section before exiting via an outlet pipe to theatmosphere.
The behavior of catalytic convertors has been analyzed exten-sively in the past (see Koltsakis and Stamatelos, 1997; Shelef andMcCabe, 2000; Kapar et al., 2003; Twigg, 2007 for recent reviews).A large majority of numerical studies have focussed on thebehavior of a single channel in the convertor. They considervarious phenomena such as external diffusion to the catalyticphase, heat conduction in the solid walls, transverse heat andmass transfer between the washcoat and the bulk gas andinternal mass transfer within the washcoat (Koltsakis andStamatelos, 1997; Siemund et al., 1996; Hoebink et al., 2000;

G. Agrawal et al. / Chemical Engineering Science 71 (2012) 310–320 311
Holder et al., 2006; Rao et al., 2009). Such a model is referred to asa 1D heterogeneous model, with the transverse transportaccounted for using Nusselt and Sherwood number correlations(Gupta and Balakotaiah, 2001). Indeed, a bulk of recent effortshave focussed on accurately modeling the internal diffusion in thewashcoat and the interaction with the reaction chemistry(Wanker et al., 2000; Santos, 2009; Mladenov et al., 2010), aswell as elucidating the role of the active catalyst and catalyst-support interactions (Hoebink et al., 2000; Rao et al., 2009).
An implicit assumption in all these single channel studies isthat all the channels behave in an identical manner. The flow,temperature and species distribution within one channel isassumed to be exactly the same as in any other channel. However,this assumption is strictly not valid in an actual catalytic con-vertor device due to two factors: flow mal-distribution and heatlosses. Flow mal-distribution is known to adversely affect theperformance of a convertor (Bella et al., 1991). The geometry ofthe device, especially the inlet diffuser (see Fig. 1), can result in aflow mal-distribution. This leads to difference in the flow rates,and therefore the residence times, in different channels of themonolith. Heat losses to the surroundings can lead to differenttemperature profiles in the central and peripheral channels. Thecentral and peripheral channels, therefore, differ both in thermaland flow characteristics. A multi-channel model is required toaccount for such non-uniform behavior across monolithic chan-nels. This issue becomes especially important in the light ofincreasing demand for reducing emission standards imposed byrecent legislations.
The model of an individual channel of the monolith has beenfurther expanded, for example by using a more rigorous 2D modelfor heat transfer in the solid phase (Hayes et al., 2004). Sincerigorous simulation of all individual channels in a monolithis computationally challenging, computationally efficientapproaches are sought. Koltsakis and Stamatelos (1997) describedthe solid monolith structure using a 2D model and used a 1Dheterogeneous model with appropriate kinetics for flow withinsome individual channels. A similar approach has been used byMarek and coworkers, for example in Jahn et al. (1997), in the
26.5 MonoliInlet Manifold
8040 53
L1L2 L3
Diffuser
.
.
.
.
.
.
42.5 cha
6.8 MonolitInlet Manifold
8010 13.2
L1' L2
' L3'
Diffuser
.
.
.
.
.
.
x
y
Fig. 1. Schematic of two-dimensional planar geometries of the catalytic convertor: (a)
short dashes represents the plane of symmetry. The shaded regions represent solid se
so-called ‘‘3D-plus-1D approach,’’ with the transient 3D model ofthe monolith focussed on thermal effects and plug flow assump-tion for flow within the channels. Deutschmann and co-workersdeveloped the DETCHEM suite for reacting flows. Tischer et al.(2001) combined simulations of a monolith with individualchannels using DETCHEM modules. The flow-reaction couplingin individual channels of the monolith was modeled using aboundary-layer approximation. They used this approach forsimulation of a three way catalytic convertor (Windmann et al.,2003), where the surface reaction was modeled using a 62-stepmechanism. The differences in the time scales of the thermalresponse of the monolith and the flow problem allowed them tosolve the transient problem for the monolith and a steady stateproblem for individual monolith channels. A similar approach wasemployed by Schwiedernoch et al. (2002) to study ignition ofmethane in a catalytic monolith.
Flow mal-distribution inside the catalytic convertor has beenwidely studied. In the above mentioned approaches, non-unifor-mity in flow distribution could be computed and separatelyincorporated in equivalent channel simulations. However,coupled simulations of the entire device, rather than the segre-gated approach, is needed because the flow distribution isdependent on device operating conditions. Flow distributionbecomes worse with increase in the inlet flow rate as well asangle of divergence of the inlet diffuser (Karvounis and Assanis,1992; Lai and Kim, 1991). Chakravarthy et al. (2003) showed thatthe flow non-uniformity caused by the recirculation zones indeedaffects the overall monolith performance, especially during thecold-start transient operations. Indeed, measures to improve flowuniformity across the monolith have been investigated. Howittand Sekella (1974) showed that the flow distribution could bemade uniform by placing different ‘‘flow-tailoring devices’’upstream of the monolith. However, the flow-tailoring devicesincrease the pressure drop and the thermal mass of the system,the latter delaying the catalyst light-off. Bella et al. (1991)introduced similar flow constraints in the diverging section ofthe inlet to improve the flow distribution across the monolithchannels compared to the free flow conditions (without the flow
th Outlet Manifold
59.7
20
.
.
.
nnels...
Monolith walls (catalytic)
TWC walls(non-catalytic)
h Outlet Manifold
14.9
5
.
.
.
10.5 channels
.
.
.
Monolith walls (catalytic)
TWC walls(non-catalytic)
full-scale geometry; (b) reduced-scale geometry. The line with alternate long and
ctions in the monolith. All the dimensions are in mm.

Starting of monolithReactor wall(non-catalytic)
Monolith walls(catalytic)
Channel
G. Agrawal et al. / Chemical Engineering Science 71 (2012) 310–320312
constraints). Another way to reduce flow mal-distribution is toreduce the angle of the inlet diffuser (the diverging sectionconnecting the inlet manifold to the monolith) (Weltens et al.,1993). However, this requires a very long diffuser, which may belimited by space and design constraints in a typical automotiveexhaust architecture. This issue gains even greater significance ifthe catalytic convertors are mounted close to the engine (tominimize cold-start emissions). In these ‘‘close coupled conver-tors,’’ space constraints to place the monolith close to the enginecan lead to widely nonuniform flow behavior (Badami et al., 2003;Salasc et al., 2005).
In addition to the flow distribution, heat losses are alsoimportant. Kumar and Mazumder (2010) showed that heat lossescause significant variations in temperature and hence conversionprofiles in the monolith. They modeled the actual monolith, i.e., asa solid matrix containing multiple parallel channels. In theirstudy, they assumed the flow to be equally distributed in all themonolith channels. The preceding discussion indicates the impor-tance of accurately modeling the flow distribution and thermalbehavior of the catalytic convertor. Computational fluid dynamics(CFD) is a powerful tool for calculating the flow field inside thecatalytic converter. Flow profiles obtained by commercial CFDcodes are known to be in good agreement with experimentalresults published in the literature (Tsinoglou et al., 2004).Although a few studies in the past (Bella et al., 1991; Guojiangand Song, 2005; Karvounis and Assanis, 1992) have focused onthe effect of flow mal-distribution over the conversion efficiency,this issue has still not been perfectly understood.
The focus of this work is to understand the coupling betweenflow distribution, heat transfer and reactions inside a catalyticconvertor. This includes consideration of the complete device,including the inlet and outlet manifolds and the monolith. Thecontinuum approach using porous medium approximation doesnot capture the true nature of the monolith, which consists ofseveral straight channels separated by the substrate matrix. CFDis used to simulate the multi-channel catalytic converter system inthis work. The geometry (described in the next section) is similarto the one used by Chakravarthy et al. (2003). While Chakravarthyet al. modeled the catalytic monolith as a porous medium, weaccount for individual channels in the monolith in a planar 2Dgeometry as the focus of our work is to understand the effect offlow distribution on reactions. Additionally, we consider oxida-tion of carbon monoxide over platinum/alumina catalyst as arepresentative reaction to capture these effects. A reduced-scalegeometry that includes the same geometric features as the full-scale geometry is also compared, to investigate the effect of scaleand to verify if the reduced-scale model may be used for detailedanalysis of the catalytic convertor (as doing CFD simulations onfull-scale geometries to evaluate various designs can be compu-tationally intensive). Both isothermal and non-adiabatic simula-tions are performed to delineate the roles of flow and heattransfer in both the geometries. We also identify the differences(in terms of flow and thermal characteristics) in central andperipheral channels for both isothermal and non-isothermal case.
(1 mm)
Wall of theMonolith(0.4 mm)
Fig. 2. A representative grid of full scale geometry depicting uniform radial
spacing of channels and uniform spacing of axial nodes.
2. System description
The catalytic convertor consists of a central monolith, which isa three-dimensional structure containing hundreds of channelsaligned parallel to the axis. Since 3D CFD simulations areextremely resource intensive, a two-dimensional planar structureis considered in our CFD simulations. The model uses flowbetween parallel plates (a 2D approximation) to simulate theinteraction between monoliths which is 3D. This helps make thecalculations computationally efficient retaining the important
physics. The effect of the flow mal-distribution arising from thediverging section can be studied using this approach. It also helpsto understand how a reduced scale model can be developed to getmeaningful insight into scaling up/down the system. Fig. 1 depictsthe geometry modeled in this work. The modeled geometryrepresents a sectional view of the entire 3D structure. Thecatalytic convertor device consists of an inlet manifold, a catalyticmonolith and an outlet manifold. The inlet manifold has an initialsection of constant cross-section, followed by a diverging inlet
diffuser.Two different geometries are analyzed: (a) a full-scale geo-
metry and (b) a reduced-scale geometry. The full-scale geometryis similar to the one used by Chakravarthy et al. (2003) to studythe flow field. Chakravarthy et al. (2003) represented the mono-lith as a porous medium. However, the channels of the monolithare ordered, running parallel to the axis. Consequently, weconsider a multi-channel geometry as shown in Fig. 1, since it isa more accurate description of the actual system. Anotheradvantage of our geometry is that the behavior of each channelcan be analyzed individually. Due to the planar symmetry, onlyhalf the system is considered, with symmetry boundary condi-tions applied at the center-line (alternating long-and-short-dashline in Fig. 1), for both full-scale and reduced-scale geometries.The main difference with the earlier works (Windmann et al.,2003; Schwiedernoch et al., 2002; Jahn et al., 1997) is that theflow problem in the entire device is solved simultaneously withcatalytic reaction, diffusion and heat effects. This allows us toinvestigate how reactions and thermal effect, in turn, affect flowdistribution as well.
The full-scale geometry consists of 85 channels; the simulatedcatalytic monolith consists of 42.5 channels due to symmetry(Fig. 2). The figure also shows three vertical lines (labeled L1, L2
and L3) along which the flow-field is analyzed in detail. The lineL1ð88 mmÞ is located within the inlet diffuser, L2ð115 mmÞ islocated just upstream of the monolith, and L3ð150 mmÞ is locatedwithin the monolith section. The shaded regions represent solidwalls of the monolith. Each channel is 1 mm in width and isseparated by 400 mm walls. The inner walls of each channel arecoated with Pt/Al2O3 catalyst and the channel walls are made ofcordierite. As shown in Fig. 1, the walls of the catalytic convertordevice (thick lines) are non-catalytic, whereas the monolith wallsare catalytic. Thus, no reaction takes place in either the inlet oroutlet manifolds, but only in the monolith. The wall thickness of400 mm may be considered as a combined thickness of themonolith walls and the washcoat and that all the catalyst islocated at the surface of these walls. Resistance to internaldiffusion (in the washcoat) is neglected, since the focus of this

Table 1Operating conditions and parameters for the catalytic convertor simulations.
Monolith channel geometry
Monolith length 80 cm
Channel diameter 1 mm
Wall thickness 400 mm
Average velocity 3 m/s 5 m/s
Channel Re number Rechan 384 640
Inlet conditions
Inlet velocity (full-scale) vin 6.38 m/s 10.63 m/s
Rein 16,320 27,200
Inlet velocity (reduced) vin 6.3 m/s 10.5 m/s
Rein 4030 6717
Temperature Tin 723 K
Pressure P 1 atm
Mass fractions
CO YCO 0.0004
O2 YO20.12
Inerts YN20.8796
Ambient conditions
Temperature Text 300 K
Heat loss coefficient hext 5 or 20 W=m2 K
G. Agrawal et al. / Chemical Engineering Science 71 (2012) 310–320 313
work is on flow distribution through various channels in themonolith. It is expected that including internal diffusion resis-tance will not change our results qualitatively.
A second, reduced-scale geometry is also simulated (Fig. 2) toconsider the effect of scale. The reduced-scale geometry consistsof 21 channels (10.5 channels are modeled due to symmetry). Thechannel width of each channel and the wall thickness are kept thesame (1 mm and 400 mm, respectively). This is because heat andmass transfer within monolith channels have a strong depen-dence on the channel width. The length of the channels is keptsame to ensure the same residence time for the same flowvelocity. Lesser number of channels reduces the overall diameterof the monolith from 119.4 to 29.8 mm. The diameter of the inletmanifold is also scaled down by the same ratio. The length of theinlet diffuser is adjusted so that the reduced scale geometry hasthe same divergence as the full-scale geometry, because the angleof divergence is known to have a strong effect on the flow mal-distribution at the inlet of the catalytic convertor (Lai and Kim,1991). In other words, the diffuser angle (36.831) is kept same inboth the geometries. For a meaningful comparison with the fullscale geometry, three locations L01 ¼ 22 mm, L02 ¼ 28 mm andL03 ¼ 60 mm are correspondingly chosen and these are indicatedin Fig. 2.
3. CFD modeling
3.1. Mathematical formulation
The commercial CFD package, FLUENT, is used for simulationsin this work (FLUENT, 2006a). The flow inside the catalyticconvertor is assumed to be steady and two-dimensional. Astransient simulations are computationally demanding only thesteady-state simulations are considered. The gas is assumed to beideal and incompressible. The incompressibility assumption isbased on the fact that the typical variations in pressure are lessthan 10% of the absolute pressure (Holmgren et al., 1997). Here byincompressible we mean that the Mach number Ma51. Thevariation of properties like density, etc., on composition andtemperature is included in the model.
The typical range of operating velocities inside monolithicchannels is from 0 to 12 m/s (Chakravarthy et al., 2003), with theflow rates for gasoline vehicles being lower than those for dieselvehicles. An average velocity of 3 and 5 m/s through a singlemonolith channel is used for both the full-scale and reduced-scalegeometries. These correspond to a residence time of 27 and 16 msrespectively in the catalytic monolith. The inlet temperature is723 K, and the inlet mass fraction of CO and O2 are 0.0004 and0.12, respectively (Mladenov et al., 2010). For the 5 m/s case, theReynolds number (based on hydraulic diameter) within eachmonolith channel is approximately Rechan ¼ 640. The correspond-ing inlet velocity at the entrance of the inlet manifold is 10.63 m/sfor the full-scale geometry and 10.5 m/s for the reduced-scalegeometry. While the flow inside the monolith channel is laminar,the flow in the inlet manifold (Re9inlet C27;200 and 6717 for thefull-scale and reduced-scale geometries, respectively) is turbu-lent. The operating conditions for the device are summarized inTable 1. Unless otherwise mentioned, the average velocity in eachmonolith channel is kept constant at this nominal value and theinlet velocity of the catalytic convertor is adjusted appropriately.
Since the flow upstream and downstream of the monolith isturbulent, the standard k�E model (Launder and Spalding, 1972)is used for turbulence modeling. This is similar to the studies ofChakravarthy et al. (2003) and Tsinoglou et al. (2004) who haveused the k�E model in their analysis of the TWC. In addition, wehave further used the enhanced wall treatment near the walls
option in FLUENT to obtain more accurate results (FLUENT,2006b). The turbulence is specified through the intensity andhydraulic diameter method. The fluid flow at the inlet is assumedto be fully developed, and the turbulent intensity is estimatedfrom the following empirical relation for pipe flows:
I�u0
uavg¼ 0:16 Re�1=8
DHð1Þ
These are standard options in FLUENT for modeling turbulenceusing the k�E model (FLUENT, 2006a). The hydraulic diameterused was twice the channel width. Following Chakravarthy et al.(2003) parameters like turbulent length scale, etc., chosen weredefault values in Fluent. Besides inside the channels the predic-tions of the k�E model were found to be comparable to that of thelaminar model. This assures us of the insensitivity of the results tothe choice of the turbulence model.
The fluid properties are temperature and species dependent.The specific heat and other thermodynamic properties are calcu-lated using piecewise polynomial fits from the FLUENT database.The transport properties of the fluid species, such as viscosity,thermal conductivity and diffusivity, are computed using thekinetic theory. The mixture properties are computed using themass-weighted mixing law. The solid properties are constant;specifically, the wall thermal conductivity is assumed to be 3 W/m/K (corresponding to cordierite). The operating pressure isatmospheric, and is specified as a pressure-outlet boundarycondition.
Oxidation of carbon monoxide on the Pt/Al2O3 is taken as amodel reaction for this study. The power law kinetics fromAmphlett et al. (1996) are used. The reaction and the rateexpression used are
COþ12O2-CO2 ðDH0
298 ¼�283 kJ=molÞ
rCO ¼ 0:15 exp �300
T
� �CCO
Here, CCO and T represent concentration of carbon monoxide andtemperature respectively. Since the focus of this work is on thecoupling between flow distribution in multiple channels and thereaction and thermal effects, single reaction of CO combustionwith power-law kinetics is considered as illustration. As we shallshow later, the reaction affects flow maldistribution only throughthermal effects; the reaction exothermicity is captured suffi-ciently by CO oxidation.

0 0.2 0.4 0.6 0.8 10
1
2
3
4
5
y/H
Vel
ocity
mag
nitu
de (m
/s)
L2
L1
L3
Fig. 3. Magnitude of the velocity vs. non-dimensional distance in the transverse
direction at various locations (L1 ,L2 and L3) in the full scale geometry correspond-
ing to 6.38 m/s inlet velocity. For clarity, only the locus of peak velocities inside
the monolithic channels is shown at L3. Also see Fig. 4.
1
2
3
4
5
Vel
ocity
mag
nitu
de (m
/s)
G. Agrawal et al. / Chemical Engineering Science 71 (2012) 310–320314
3.2. Computational grid
A structured grid with 2;05,761 nodes is used for the simula-tion of the full-scale geometry shown in Fig. 1. A careful gridindependence study was conducted by doubling the number ofaxial and the number of radial nodes and verifying that the resultsdo not change quantitatively. Fig. 2 shows a detailed view of thegrid used in the region near the intersection of the diffuser andthe monolith. The total number of transverse nodes in eachmonolith channel is 10, that in the monolith walls is 4 (uniformgrid spacing of 10�4 in the transverse direction). Thus, the totalnumber of transverse nodes in the entire convertor is 597, for thefull-scale geometry, whereas the number of axial nodes in themonolith region is 90. Fine gridding in the transverse directionwas required because of the transition from turbulent to laminarflow as the fluid enters the monolith channel from the inletdiffuser.
Similarly, a structured grid having 24,585 nodes is used forthe simulation of reduced-scale geometry. The axial and trans-verse grid spacing is kept the same as the full-scale geometry. Thenumber of transverse nodes is lesser here due to the smaller sizeof the device.
3.3. Solver parameters and details
The FLUENT CFD code solves simultaneously the mass,momentum, species and energy balance equations. The energybalance equation is also solved for the solid phase (monolithwalls). We wish to emphasize that the complete coupled ellipticproblem is solved, without making any further assumptions. Thedetailed view of the grid is shown in Fig. 2. The thick outer wallsof the convertor are non-catalytic; no-slip and zero flux boundaryconditions are imposed for the velocity and mass fractions,respectively. The monolith walls are non-porous and catalytic(i.e., internal diffusion resistance is neglected). Thus the reactiontakes place only on the surface of the monolith walls. In case ofnon-isothermal simulations, heat of reaction is also included inthe model. A no-slip boundary condition is imposed on themonolith walls as well.
The equations are expressed in the standard conservative form(FLUENT, 2006a; Patankar, 1980) and solved using the finitevolume method employing a fully implicit pressure-based solver.We used the standard discretizing scheme for pressure, first orderupwind scheme for momentum, and second order upwind forspecies as well as energy. Default values are used for under-relaxation factors. A SIMPLE pressure–velocity coupling is used,which is based on a relationship between velocity and pressurecorrections to enforce mass conservation and to obtain thepressure field.
Convergence of the governing equations is monitored throughmultiple means. We verify that the average residuals for thesolved quantities (velocity components, turbulent quantities,mass, species and energy balance) are less than 10�5. In addition,the velocity along the centerline and the temperature and COmass fraction at the solid walls are monitored; we ensure thatthese values remain constant over 10,000 iterations for a con-verged solution. Finally, we verify that the global mass and energybalances are satisfied. All these checks are implemented for eachiteration to ensure the validity of the numerical results.
0 0.2 0.4 0.6 0.8 10
y/H
Fig. 4. Velocity magnitude vs. dimensionless transverse distance inside the
monolithic channels in the full scale geometry corresponding to 6.38 m/s inlet
velocity.
4. Results and discussions
The results for the two geometries from CFD simulations areanalyzed in this section. As described earlier, the full- andreduced-scale geometries are compared for the same residence
time in the monolith (27 and 16 ms). First we focus on the flowdistribution in the catalytic convertor, followed by analysis ofreactions and thermal characteristics as a second step.
4.1. Flow distribution in full-scale geometry
Fig. 3 depicts the transverse velocity profiles at various loca-tions (L1,L2 and L3) in the full-scale geometry for an inlet velocityof 6.38 m/s. The dimensionless distance, y=H, from the symmetryplane forms abscissa (note that the total transverse height for thefull-scale geometry is H¼59.7 mm). The symbols represent locusof peak velocities in each of the monolith channels at location L3.The complete velocity profile at this location is shown in Fig. 4.Clearly, each monolith channel exhibits a parabolic velocityprofile (as expected for laminar flow) with the maximum velocityat the center and zero at the walls. In the subsequent discussions,we show only the peak velocities at location L3 to capture theeffect of flow mal-distribution. Note that for an average velocityof 3 m/s, the maximum centerline velocity for an ideal uniformlydistributed flow is 4.5 m/s. Owing to flow mal-distribution, the

1.30e+01
Zoom In
1.24e+011.17e+011.11e+011.04e+019.78e+009.13e+008.48e+007.83e+007.17e+006.52e+005.87e+005.22e+004.57e+003.91e+003.26e+002.61e+001.96e+001.30e+006.52e-010.00e+00
Fig. 5. Velocity contour plot depicting recirculation zones and pressure field’s effect inside full scale geometry. A little section has been zoomed in further in order to show
the velocity vectors before fluid enters into monolith.
0 0.2 0.4 0.6 0.8 10
2
4
6
8
10
y/H
Vel
ocity
mag
nitu
de (m
/s)
L1
L2
L3
Fig. 6. Variation in the velocity magnitude vs. dimensionless transverse coordi-
nate at various locations (L1 ,L2 and L3) in the full scale geometry at 10.63 m/s inlet
velocity. The locus of peak velocities inside the monolithic channels is shown at L3.
G. Agrawal et al. / Chemical Engineering Science 71 (2012) 310–320 315
maximum centerline velocities in various channels deviate fromthis ideal value.
The flow distribution along the transverse direction is moreuniform at location L2 than location L1. This is attributed to thepresence of a flat section (93oxo119:5) between the inletdiffuser and the catalytic monolith. The flow distribution insidethe monolith section is determined by the flow expansion inthe inlet cone and the frictional pressure drop across each of thechannels. As the flow expands in the inlet diffuser, recirculationzones are created. These lead to high axial velocities around thecenterline and lower axial velocities towards the periphery. Sincethe frictional pressure drop increases rapidly with the inletvelocity in individual channels, the channels with higher flowrate offer higher frictional resistance. Hence, the pressure fieldredirects the fluid flow from the center towards the peripheralchannels to minimize the frictional resistance exerted by thechannel walls. Thus, the frictional effect tends to make the flowuniform across various monolith channels.
To further understand the flow behavior, a velocity contourplot depicting the recirculation zones and the effect of thepressure field inside full-scale geometry is shown in Fig. 5. Thelarge recirculation zones in the inlet diffuser due to the suddenexpansion make the flow non-uniform. The inset shows thevelocity vectors just before the fluid enters into the monolith.The transverse component of the velocity is higher than the axialcomponent, indicating that the fluid drifts towards peripheralchannels. Immediately upstream of the monolith, the flow isstrongly driven from the center towards the periphery, as indi-cated by the ‘‘north-east’’ facing velocity vectors (with referenceto the reader). Hence, formation of recirculation zones and thepressure field counteract with each other, the former inducingmal-distribution while the latter homogenizing the system.
In summary, the flow distribution in the monolith is deter-mined by (i) recirculation patterns induced by the expandingzone; and (ii) frictional pressure drop distribution across themonolith (Chakravarthy et al., 2002). The velocity profile atlocation L3, shown in Fig. 3, is the resultant effect of these twofactors. The maximum centerline velocity of about 4.9 m/s isobserved in the central channel; the minimum velocity of about4 m/s is observed in the peripheral channel. Thus, the net
deviation from the ideal centerline velocity of 4.5 m/s is approxi-mately 10%. This aspect will be further discussed in the nextsubsection.
4.2. Velocity and scale effects
The analysis of flow distribution is now repeated on the full-scale geometry for a higher inlet velocity of 10.63 m/s in Fig. 6.The qualitative trends are similar to those observed at the lowerinlet velocity. The flow mal-distribution is again found to behigher at location L1, in the inlet diffuser, compared to location L2.The flat section in the catalytic convertor geometry, upstream ofthe monolith improves the flow distribution. Indeed, increasinglength of the flat section would make the flow more uniform. Asbefore, the distribution of flow in the various channels at locationL3 (symbols in Fig. 6) results from the flow expansion in the inletcone and the pressure drop across each channel. The ideal vmax atthe centerline of each channel is 7.5 m/s; the maximum deviation

0 0.2 0.4 0.6 0.8 10
1
2
3
4
5
6
y/H
Vel
ocity
mag
nitu
de (m
/s)
0 0.2 0.4 0.6 0.8 10
2
4
6
8
10
y/H
Vel
ocity
mag
nitu
de (m
/s)
L2’L2
’
L3’L3
’
L1’
L1’
Fig. 7. Velocity profiles along the transverse direction at various locations (L01 ,L02 and L03) in the reduced scale geometry for inlet velocity of (a) 6.3 m/s and (b) 10.5 m/s.
The locus of peak velocities inside the monolithic channels is shown at L3.
0 0.2 0.4 0.6 0.8 10
1
2
3
4
5
y/H
Vel
ocity
mag
nitu
de (m
/s)
Fig. 8. Velocity magnitude vs. dimensionless transverse distance inside the
monolithic channels in the reduced scale geometry corresponding to 6.38 m/s
inlet velocity.
0 0.2 0.4 0.6 0.8 1
0.8
0.9
1
1.1
1.2
r/R
Flow
dis
tribu
tion
inde
x
Full Scale:6.38 m/s
25.5 m/s
6.3 m/s
Fig. 9. Variation of flow distribution index along the dimensionless transverse
distance: effect of scale and flow rate. Broken lines and open symbols represent
reduced-scale geometry and solid lines and filled symbols represent full-scale
geometry.
G. Agrawal et al. / Chemical Engineering Science 71 (2012) 310–320316
of vmax from this ideal value is 15% across all channels. Clearly, theflow mal-distribution is greater at this higher velocity. Theincrease in the net flow rate gives rise to stronger recirculationpatterns in the inlet diffuser, which ultimately makes the flowmore non-uniform across channels. Hence, as expected, thegreater the inlet flow rate, greater is the flow mal-distribution.
However, an important observation is that even at a higherinlet velocity of 10.63 m/s, the actual flow within the monolith ismuch more uniform than what is expected based on the flowdistribution immediately upstream (or downstream) of themonolith.
The effect of scaling of the geometry is considered next. Flowsimulation for the reduced scale geometry has been performed forinlet velocities of 6.3 m/s and 10.5 m/s, as described earlier.The two panels of Fig. 7 depict the transverse velocity profilesfor the two inlet velocities at various locations (L01, L02 and L03) inthe reduced scale geometry. The flow behavior at these threelocations is qualitatively similar to that obtained for the full-scalegeometry. For instance, flow mal-distribution at location L02(immediately upstream of the monolith) is lesser than locationL01 in the inlet diffuser. The deviations in the peak velocitieswithin the monolithic channels are also similar to the full scalegeometry. Furthermore, increasing the flow rate makes the flowmore mal-distributed at L01. These results show that the reduced-scale monolith reliably captures the key features of the full scalegeometry. The way the scaling was done helps us capture thefeatures of the full-size system. This indicates that the geometricparameters of the diffuser, rather than the scale, have a strongimpact on the flow distribution. Furthermore, this similarity canbe exploited to perform a thorough parametric study to examinethe effect of various factors that affect performance of thecatalytic convertor. The computational effort is drasticallyreduced for the reduced-scale geometry since the number ofcomputational nodes reduce by a factor of 4.
Fig. 8 depicts the complete velocity profiles inside the mono-lithic channels (at location L03) in the reduced scale geometry.A parabolic velocity profile is obtained within each channel withmaximum velocity at the center and zero at the walls. The fluidflow is perfectly laminar inside the monolith section.
In order to compare the effect of scale and flow rates, wedefine a dimensionless parameter—‘flow distribution index’which represents the extent of flow mal-distribution inside themonolith channels. The flow distribution index (fi) is defined asthe ratio of the actual mass flow rate in the ith channel to theideal mass flow rate expected if the flow was uniform, i.e.
f i ¼mi
1n
Pj
mj
Here, mi is the mass flow rate in the ith channel of the monolithand n is the number of channels. Ideally, fi should be one for nomal-distribution inside the monolith; fi is greater than one if theflow rate in a channel is more than the ideal expected flow

0 0.5 10.9
0.95
1
1.05
1.1
r/R
Flow
dis
tribu
tion
inde
x
FlowIsothermalNon-adiabatic
0 0.5 1r/R
FlowIsothermalNon-adiabatic
Fig. 10. Variation of flow distribution index along the dimensionless radius for (a) full-scale geometry at vin ¼ 6:38 m=s and (b) reduced-scale geometry at vin ¼ 6:3 m=s.
The curves for ‘‘flow’’ (blue lines with circle symbols) and ‘‘isothermal’’ (red lines with square symbols) are not distinguishable because they overlap. (For interpretation of
the references to colour in this figure legend, the reader is referred to the web version of this article.)
0.04725
0.027700
0.014675
L3’
0.001650
Fig. 11. Contours of (a) temperature and (b) CO mass fraction for the reduced-
scale geometry at vin ¼ 6:3 m=s and hext ¼ 5 W=m2=K.
G. Agrawal et al. / Chemical Engineering Science 71 (2012) 310–320 317
(central channels) and is lower than one if the flow rate is lesserthan the ideal (peripheral channels).
Fig. 9 shows the flow distribution index for various channels inthe reduced- (broken lines, open symbols) and full-scale geome-tries (solid line, filled symbols). The flow distribution index isplotted for inlet velocity of 6.38 m/s (Rein ¼ 16 320;vavg
chan ¼ 3 m=s)for the full-scale geometry and for two different inlet velocities –6.3 m/s (Rein ¼ 4030;vavg
chan ¼ 3 m=s), and 25.5 m/s (Rein ¼ 16320;vavg
chan ¼ 12:15 m=s) – for the reduced-scale geometry. The flowdistribution in full- and reduced-scale geometries is similar whenthe average velocity (as well as Reynolds number) inside the
monolith channels is kept the same between the two geometries(circles and squares in Fig. 9). Next, we considered the case wherethe Reynolds number at the inlet of the device for the reduced-scale geometry is kept the same as that in the full-scale geometry(dash-dot lines with diamond symbols). Note that the inletvelocity is scaled by a factor of 4, which is the ratio of the inletdiameters for the two geometries. Clearly, the flow is significantlymore mal-distributed at this inlet velocity, even though the inletReynolds number is the same. We therefore surmise that thepressure drop within the monolith section is a primary factorgoverning the overall flow distribution in the catalytic convertor.Qualitatively similar results were observed for the higher inletvelocity of 10.5 m/s as well.
4.3. Reactions and thermal effects
The flow maldistribution across the monolith channels inducesdifferences in the residence times, which would lead to differencein the conversions in each channel and possibly in reduction ofefficiency of the catalytic convertor. Thermal effects due to theexothermic nature of CO oxidation and heat losses to thesurroundings can affect the overall behavior of the catalyticconvertor. While flow distribution indeed affects conversion andtemperature within the monolith, reaction and thermal effectsmay, in turn, affect flow distribution, especially because thephysical properties of the fluid (especially density and viscosity)vary with temperature and species concentration. In order todelineate the effects of reaction and thermal effects, both iso-thermal and non-adiabatic simulations are performed. Isothermalsimulations, where the temperature is kept at 723 K through outthe catalytic convertor geometry, account for the couplingbetween concentration effects due to reactions and flow. On theother hand, non-adiabatic simulations (with heat loss to the
surroundings modeled with Newton’s law of cooling) accountfor the thermal effects as well.
First, the flow distribution in various channels is compared forisothermal and non-adiabatic cases in Fig. 10 for the full-scale andreduced-scale geometries at inlet velocities of 6.38 m/s and 6.3 m/s (corresponding to 3 m/s average velocity in each channel),respectively. As before, f¼1 represents ideal (uniform) flow;any deviation from this value indicates the extent of flowmaldistribution. While only the results at one condition areshown for brevity, the reduced-scale model is able to accuratelypredict the qualitative trends observed in the full-scale geometry.The flow distribution index for flow simulations (withoutreaction) and isothermal reaction match exactly, as indicated byoverlapping circle and square symbols. This indicates that in thedilute reacting systems (the inlet mass fraction of CO is 0.0004),concentration effects due to reactions do not affect flow distribu-tion. We expect this observation to hold even when otherreactions occurring in a typical three-way catalyst are included.However, for the non-adiabatic simulations (with externalheat loss coefficient of 5 W/m2/K) represented by ‘triangle’markers in the figure, the flow tends to become more uniformespecially in the peripheral channels. The fluid properties aretemperature dependent; the change in flow distribution indexwith thermal effects included, as compared to the flow simula-tions, is attributed to the dependence of density on the fluidtemperature.
0 0.1 0.2 0.3 0.4 0.5 0.6 0.7 0.8 0.9 10
0.2
0.4
0.6
0.8
1
x/L
Con
vers
ion
of C
O
0.7 0.8 0.9 10.85
0.9
0.95
Symbols: Reduced−scaleDashed Lines: Full−scaleSolid Line: Single Chan.
Outermostchannel
Centralchannel
Singlechannel
Fig. 13. Variation of conversion of carbon monoxide along the dimensionless axial
length in the full-scale (dashed lines) and reduced-scale (symbols) geometries in
the central and peripheral channels for the isothermal case. The solid lines
represent single-channel simulations for the average velocity of 3 m/s. Note that
the dashed lines and symbols overlap in the main figure. The results near the
monolith exit are zoomed in for better viewing.
0 0.2 0.4 0.6 0.8 10
0.2
0.4
0.6
0.8
1
x/L
Con
vers
ion
of C
O
Outermostchannel
Singlechannel
Centralchannel
Symbols: Reduced−scaleDashed Lines: Full−scaleSolid Line: Single Channel
Fig. 14. CO conversion profiles for the full-scale (dashed lines) and reduced-scale
(symbols) geometries; and single channel simulations (solid line) for the average
velocity of 5 m/s. Note that the dashed lines and symbols overlap.
G. Agrawal et al. / Chemical Engineering Science 71 (2012) 310–320318
Next, we analyze the flow-reaction-thermal coupling in a non-adiabatic device. The catalytic monolith within the catalyticconvertor device is the primary focus of the discussion. Fig. 11shows the contours of temperature and CO mass fraction for thereduced-scale geometry at 6.3 m/s. The temperature in theperipheral channels is lower than those in the central channelsdue to heat losses to the surroundings. One of the limitations ofthe 2D planar geometry is that the transverse heat transferthrough the monolith solid structure is not adequately captured.The adjacent solid walls are not in direct thermal contact in the2D geometry; heat transfer between them is mediated by trans-verse heat transfer in the fluid channels. As a result, only two orthree of the peripheral channels are affected due to heat losses.Fig. 11(b) shows the CO mass fraction contours.
Compared to the other channels, CO conversion is the least inthe central channel due to the lower residence time (note that theflow distribution index is highest at r=R¼ 0). The variation intemperature and CO mass fraction in the transverse direction atL03 is shown in Fig. 12. Clearly, the mass fraction of CO is thehighest in the central channel, the mass fraction decreases as onemoves towards the peripheral channel and finally increases againin the last two channels at the periphery. The initial decrease inCO mass fraction (i.e., higher conversion) is because of the higherresidence time as one moves away from the center. Heat losses tothe surroundings are responsible for lower conversion in the lasttwo channels in the catalytic monolith. Qualitatively similarresults are observed for other operating conditions as well asfor the full-scale geometry. These results were obtained for arather simple power-law kinetics for CO oxidation (with lowactivation energy). For more complex kinetics and higher activa-tion energy, the drop in conversion in the peripheral channels isexpected to be higher. Thus, the result that peripheral channel hashigher conversion than the central channel is dependent on thereaction kinetics; the qualitative non-monotonic behavior that COconversion increases as one moves away from the central mono-lith channel and then decreases again at the peripheral channel islikely to hold for other kinetics as well.
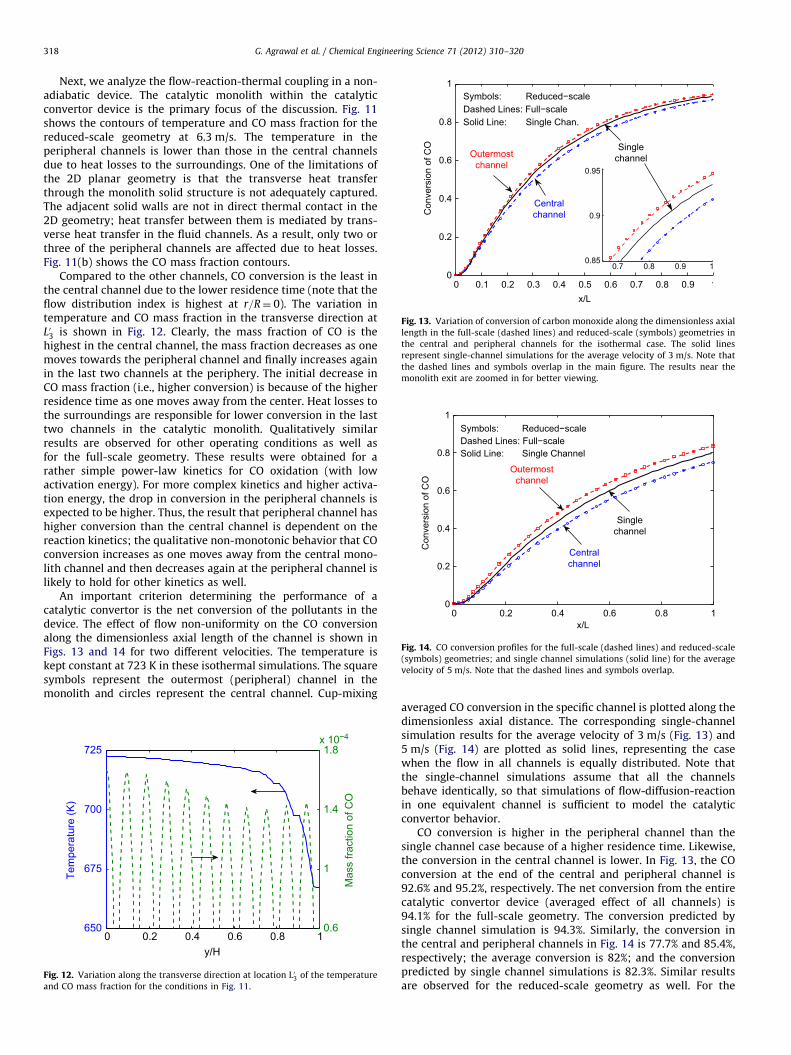
An important criterion determining the performance of acatalytic convertor is the net conversion of the pollutants in thedevice. The effect of flow non-uniformity on the CO conversionalong the dimensionless axial length of the channel is shown inFigs. 13 and 14 for two different velocities. The temperature iskept constant at 723 K in these isothermal simulations. The squaresymbols represent the outermost (peripheral) channel in themonolith and circles represent the central channel. Cup-mixing
0 0.2 0.4 0.6 0.8 1650
675
700
725
Tem
pera
ture
(K)
0.6
1
1.4
1.8x 10⁻⁴
y/H
Mas
s fra
ctio
n of
CO
Fig. 12. Variation along the transverse direction at location L03 of the temperature
and CO mass fraction for the conditions in Fig. 11.
averaged CO conversion in the specific channel is plotted along thedimensionless axial distance. The corresponding single-channelsimulation results for the average velocity of 3 m/s (Fig. 13) and5 m/s (Fig. 14) are plotted as solid lines, representing the casewhen the flow in all channels is equally distributed. Note thatthe single-channel simulations assume that all the channelsbehave identically, so that simulations of flow-diffusion-reactionin one equivalent channel is sufficient to model the catalyticconvertor behavior.
CO conversion is higher in the peripheral channel than thesingle channel case because of a higher residence time. Likewise,the conversion in the central channel is lower. In Fig. 13, the COconversion at the end of the central and peripheral channel is92.6% and 95.2%, respectively. The net conversion from the entirecatalytic convertor device (averaged effect of all channels) is94.1% for the full-scale geometry. The conversion predicted bysingle channel simulation is 94.3%. Similarly, the conversion inthe central and peripheral channels in Fig. 14 is 77.7% and 85.4%,respectively; the average conversion is 82%; and the conversionpredicted by single channel simulations is 82.3%. Similar resultsare observed for the reduced-scale geometry as well. For the

0 0.2 0.4 0.6 0.8 10.8
0.9
1
1.1
1.2
1.3
y/H
Flow
dis
tribu
tion
inde
x
Thick lines: vin = 10.5 m/sThin lines: vin = 18.9 m/s
Dash−dot lines: h = 20Dashed lines: h = 5Solid lines: Flow only
Fig. 15. Flow distribution index for the reduced-scale geometry for the flow
simulations (solid lines), non-adiabatic case with h¼ 5 W=m2 K (dashed lines) and
non-adiabatic case with h¼ 20 W=m2 K. Two different inlet velocities are com-
pared, as indicated in the figure. The symbols represent heat loss only with the
reaction turned off, for h¼ 5, vin ¼ 10:5 case.
G. Agrawal et al. / Chemical Engineering Science 71 (2012) 310–320 319
simulation conditions in this work, the single channel simulationsonly marginally over-estimate the average conversion from thecatalytic convertor; however the single channel simulationspredict much higher conversions than the central channels andlower conversions than the peripheral channel. Therefore, theeffect of flow mal-distribution on the multi-channel systemperformance needs to be carefully considered in the light ofstringent emissions like Euro 6.
The reaction and heat transfer, in turn, affect the flow dis-tribution as well. Earlier, we had seen that the heat losses reducethe flow mal-distribution inside the catalytic convertor in the full-scale geometry. Fig. 15 shows the effect of reaction and heattransfer on flow distribution in the reduced-scale geometry fortwo different flow rates (inlet velocities of 10.5 m/s and 18.9 m/s).The solid lines correspond to flow simulations only, with bothreactions and heat loss turned off. The dashed lines representnon-adiabatic CO oxidation with a heat loss of 5 W/m2 K).To further understand the effect of heat loss, an additional case isalso considered, with a higher value of heat transfer coefficientðh¼ 20 W=m2 KÞ. At all velocities considered, heat losses tend toimprove the flow distribution. When the heat loss is furtherincreased to 20 W=m2 K, the flow becomes more uniform. Forexample, the flow through the central channel exceeds the ideal(uniform) flow case by 15% for the flow simulations (and isothermalreactions), by 14.1% for the non-adiabatic case with h1 ¼ 5 W=m2 K,and 12.2% for h1 ¼ 20 W=m2 K. We performed an additionalsimulation with the reaction turned off, but with the same heatloss of 5 W=m2 K. The results are shown as symbols in the figure.The overlapping symbols with the thick dashed line indicate that thereaction does not affect the flow distribution significantly. Similarresults are expected at other velocities as well.
Thus, the simulations show a two-way coupling: reactions andthermal response is affected by flow distribution in the catalyticconvertor; the thermal effects (due to heat losses and reactionexothermicity) in turn influence the flow distribution as well.
5. Conclusions
A systematic and comprehensive study of interaction betweenflow, reaction and thermal effects in a two-dimensional model ofa multi-tubular catalytic converter geometry with a single globalreaction was presented. The flow distribution in a monolith is
non-uniform due to the geometry of the inlet manifold and thecatalytic monolith. While the bulk of the past work studying flowdistribution aspects in a catalytic convertor assumed the mono-lith as a porous medium, realistic multi-tubular geometries wereconsidered in this paper. We showed that the results from areduced-scale geometry (with 21 channels in 2D) matched thosefrom an actual full-scale geometry (with 85 channels in 2D) whenthe average velocity in the channel was kept the same.
The flow distribution inside the monolith section is governedby the resultant effect of flow expansion in the inlet diffuser andthe frictional pressure drop across each of the channels of themonolith. While the former tends to make the flow mal-distrib-uted, the frictional pressure drop considerations tend to make theflow more uniform than what was previously believed. The flowbecame more mal-distributed at higher inlet velocities, with thecentral channels experiencing higher flow rate than the periph-eral channels. The deviation in the mass flow rates in the centralchannel (compared to the ideal case of uniform flow distribution)could be as high as 20% for a reasonably high inlet flow rate of10 m/s. The effect of scale was also analyzed by comparing flowdistribution in the full-scale geometry with the reduced-scalegeometry for two conditions: same value of Reynolds number inthe inlet manifold or within the monolith channel. The flowdistribution was strongly dependent on the Reynolds numberwithin the monolith channel, based on the average velocity.In other words, the scaled-down geometry showed the same flowmal-distribution behavior when the Reynolds number in themonolith channel, rather than at the inlet manifold of thecatalytic convertor, was kept the same.
Flow mal-distribution significantly affects conversion, espe-cially at higher flow rates. The performance of the convertor inrealistic conditions deviates from the performance predicted bythe single channel model. In isothermal simulations, the conver-sion in the central channels was lower and that in the peripheralchannels was higher than that predicted through single-channelsimulations. In the non-adiabatic case also, CO conversion fromthe central and peripheral channels differed from the singlechannel predictions. Consequently, the net conversion of COwas over-estimated by single channel models, when comparedwith more realistic convertor geometry. Furthermore, the totaloutlet conversion efficiency decreases as the flow becomes moremal-distributed at higher velocities.
Finally, the effect of reactions and heat transfer on flowdistribution was also analyzed. The reactions did not have asignificant effect on flow distribution. However, heat loss to thesurroundings made the flow more uniform across the monolith.This is attributed to the dependence of density and other gasproperties on temperature.
In summary, the flow within the monolith channels is indeedmal-distributed, though the maximum deviation from the idealuniformly distributed flow-rate is rather modest. This results in aslightly lower conversion of the exhausts than what is predictedfrom single-channel simulations.
Acknowledgments
The financial support of this project by the General MotorsGlobal R & D Center is gratefully acknowledged. The authors alsoacknowledge High Performance Computing Environment (HPCE), IITMadras for providing us computational facilities.
References
FLUENT, 2006a. User’s Guide, ver. 6.3. Fluent Inc., Lebanon, NH.FLUENT, 2006b. User’s Guide, Chapter 12. Fluent Inc., Lebanon, NH.

G. Agrawal et al. / Chemical Engineering Science 71 (2012) 310–320320
Amphlett, J.C., Mann, R.F., Peppley, B.A., 1996. On board hydrogen purification forsteam reformation/pem fuel cell vehicle power plants. Int. J. Hydrogen Energy21, 673–678.
Badami, M., Millo, F., Zuarini, A., Gambarotto, M., 2003. CFD Analysis andExperimental Validation of the Inlet Flow Distribution in Close CoupledCatalytic Converters. Technical Report 2003-01- 3072, SAE Paper.
Bella, G., Rocco, V., Maggiore, M., 1991. A study of inlet flow distortion effects onautomotive catalytic converters. J. Eng. Gas Turbines Power 113.
Chakravarthy, V.K., Conklin, J.C., Daw, C.S., D’Azevedo, E.F., 2003. Multi-dimensionalsimulations of cold-start transients in a catalytic converter under steady inflowconditions. Appl. Catal. A: General 241, 289–306.
Chakravarthy, K., Daw, C.S., Conklin, J.C., 2002. Intra-Channel Mass and Heat-Transfer Modeling in Diesel Oxidation Catalysts. Technical Report 2002-01-1879, SAE Paper.
Costa, M., Santos, H., 2009. Modelling transport phenomena and chemical reactions inautomotive three-way catalytic converters. Chem. Eng. J. 148, 173–183.
Guojiang, W., Song, T., 2005. CFD simulation of the effect of upstream flowdistribution on the light-off performance of a catalytic converter. EnergyConvers. Manage. 46, 2010–2031.
Gupta, N., Balakotaiah, V., 2001. Heat and mass transfer coefficients in catalyticmonoliths. Chem. Eng. Sci. 56, 4771–4786.
Hayes, R.E., Mukadi, L.S., Votsmeier, M., Gieshoff, J., 2004. Three-way catalyticconverter modelling with detailed kinetics and washcoat diffusion. Top. Catal.26, 411–415.
Hoebink, J.H.B.J., Gemert, R.A., Tillaart, J.A.A., Marin, G.B., 2000. Competingreactions in three-way catalytic converters: modelling of the NOx conversionmaximum in the light-off curves under net oxidising conditions. Chem. Eng.Sci. 55, 1573–1581.
Holder, R., Bollig, M., Anderson, D.R., Hochmuth, J.K., 2006. A discussion ontransport phenomena and three-way kinetics of monolithic converters. Chem.Eng. Sci. 61, 8010–8027.
Holmgren, A., Gronstedt, T., Andersson, B., 1997. Improved flow distribution inautomotive monolith converters. React. Kinet. Catal. Lett. 60, 363–371.
Howitt, J.S., Sekella, T.C., 1974. Technical Report 740244, SAE Paper.Jahn, R., Snita, D., Kubicek, M., Marek, M., 1997. 3-D modeling of monolith reactors.
Catal. Today 38, 39–46.Kapar, J., Fornasiero, P., Hickey, N., 2003. Automotive catalytic converters: current
status and some perspectives. Catal. Today 77, 419–449.Karvounis, E., Assanis, D.N., 1992. The effect of inlet flow distribution on catalytic
conversion efficiency. Int. J. Heat Mass Transfer 36, 1495–1504.Koltsakis, G.C., Stamatelos, A.M., 1997. Catalytic automotive exhaust after treat-
ment. Prog. Energy Combust. Sci. 23, 1–39.
Kumar, A., Mazumder, S., 2010. Towards simulation of full-scale monolithiccatalytic converters with complex heterogeneous chemistry. Comput. Chem.Eng. 34, 135–145.
Lai, M.C., Kim, J.Y., 1991. Three-Dimensional Simulations of Automotive CatalyticConverter Internal Flow. Technical Report 910200, SAE Paper.
Launder, B.E., Spalding, D.B., 1972. Lectures in Mathematical Models of Turbu-lence. Academic Press, London.
Mladenov, N., Koop, J., Tischer, S., Deutschmann, O., 2010. Modeling of transportand chemistry in channel flows of automotive catalytic converters. Chem. Eng.Sci. 65, 812–826.
Patankar, S.V., 1980. Numerical Heat Transfer and Fluid Flow. ComputationalMethods in Mechanics and Thermal Sciences. Hemisphere Publishing.
Rao, S.K., Imam, R., Ramanathan, K., Pushpavanam, S., 2009. Sensitivity analysisand kinetic parameter estimation in a three way catalytic converter. Ind. Eng.Chem. Res. 48, 3779–3790.
Salasc, S., Barrieu, E., Leroy, V., 2005. Impact of Manifold Design on FlowDistribution of a Close-Coupled Catalytic Converter. Technical Report 2005-01-1626, SAE Paper.
Schwiedernoch, R., Tischer, S., Deutschmann, O., Warnatz, J., 2002. Experimentaland numerical investigation of the ignition of methane combustion in aplatinum-coated honeycomb monolith. Proc. Combust. Inst. 29, 1005–1011.
Shelef, M., McCabe, R., 2000. Twenty-five years after introduction of automotivecatalysts: What next? Catal. Today 62, 35–50.
Siemund, S., Leclerc, J.P., Schweich, D., Prignet, M., Castagna, F., 1996. Three-waymonolithic converter: simulation versus experiments. Chem. Eng. Sci. 51,3709–3720.
Tischer, S., Correa, C., Deutschmann, O., 2001. Transient three-dimensionalsimulations of a catalytic combustion monolith using detailed models forheterogeneous and homogeneous reactions and transport phenomena. Catal.Today 69, 57–62.
Tsinoglou, D., Koltsakis, G., Missirlis, D., Yakinthos, K., 2004. Transient modelling offlow distribution in automotive catalytic converters. Appl. Math. Model. 28,775–794.
Twigg, M.V., 2007. Progress and future challenges in controlling automotiveexhaust gas emissions. Appl. Catal. B: Environ. 70, 2–15.
Wanker, R., Raupenstrauch, H., Staudinger, G., 2000. A fully distributed model forthe simulation of a catalytic combustor. Chem. Eng. Sci. 55, 4709–4718.
Weltens, H., Bressler, H., Terres, F.,H., N., D., R., 1993. Technical Report 930780,SAE Paper.
Windmann, J., Braun, J., Zacke, P., Tischer, S., Deutschmann, O., Warnatz, J., 2003.Impact of the Inlet Flow Distribution on the Light-Off Behavior of a 3-WayCatalytic Converter. Technical Report 2003-01-0937, SAE Paper.