modelling and simulation of intensified absorber for post
TRANSCRIPT
1
Modelling and simulation of intensified absorber for
post-combustion CO2 capture using different mass
transfer correlations
Atuman S. Joel, Meihong Wang*, Colin Ramshaw
Process\Energy Systems Engineering Group, School of Engineering, University of Hull, HU6 7RX, UK
*Corresponding author. Tel: +0044 (0)1482 466688; Fax: +0044 1482 466664; Email address: [email protected]
ABSTRACT
This paper studied mass transfer in rotating packed bed (RPB) which has the
potential to significantly reduce capital and operating costs in post-combustion CO2
capture. To model intensified absorber, mass transfer correlations were
implemented in visual FORTRAN and then were dynamically linked with Aspen
Plus® rate-based model. Two sets of mass transfer correlations were studied and
compared through model validations. The second set of correlations performed
better at the MEA concentrations tested as compared with the first set of
correlations. For insights into the design and operation of intensified absorber,
process analysis were carried out, which indicates: (a) With fixed RPB equipment
size and fixed lean MEA flow rate, CO2 capture level decreases with increase in
flue gas flow rate; (b) Higher lean MEA inlet temperature leads to higher CO2
capture level. (c) At higher flue gas temperature (from 30 oC to 80 oC), the CO2
capture level of the intensified absorber can be maintained. Compared with
conventional absorber using packed columns, the insights obtained from this study
are (1) Intensified absorber using RPB improves mass transfer significantly. (2)
Cooling duty cost can be saved since higher lean MEA temperature can improve
the performance of RPB and high flue gas temperature shows little or no effect on
the performance of the RPB.
Keywords: Post-combustion, CO2 capture, Chemical Absorption, MEA solvent,
Process Intensification (PI), Rotating Packed Bed (RPB), Process simulation,
© 2014, Elsevier. Licensed under the Creative Commons Attribution-NonCommercial-NoDerivatives 4.0 International http://creativecommons.org/licenses/by-nc-nd/4.0/
2
Introduction
Carbon dioxide (CO2) emission has become crucial environmental concern in
recent years because of its contribution to global warming. Combustion of coal and
petroleum accounts for the majority of CO2 emissions. Petroleum is mostly used
as a transportation fuel for vehicles while coal is used mostly for electricity
generation, for instance about 85.5% of coal is used for electricity generation in
2011 in the UK [1]. Moulijn et al. [2] stated that among the greenhouse gases, CO2
contributes more than 60% to global warming. Atmospheric CO2 concentration is
close to 400 ppm which is higher than the pre-industrial level of about 300 ppm [3],
this increased atmospheric concentrations of CO2 affect the radiative balance of
the Earth and, consequently, its temperature and other aspects of its climate.
In order to meet the set target of 50% emission reduction as compared to the level
of 1990 as proposed by Intergovernmental panel on climate change (IPCC) [4],
carbon capture and storage (CCS) is an important option for that to be achieved.
The International Energy Agency (IEA) [5] identifies CCS as a significant and low-
cost option in fighting climate change. The most matured CO2 capture technology
is post-combustion CO2 capture (PCC) with chemical absorption as reported in
Mac Dowell et al. [6] which is also believed to be a low-risk technology and
promising near-term option for large-scale CO2 capture.
Post-combustion CO2 Capture for coal-fired power plants using conventional
absorber has been reported by many authors. Dugas [7] carried out pilot plant
study of post-combustion CO2 capture in the context of fossil fuel-fired power
plants. Lawal et al. [8,9,10] carried out dynamic modelling of CO2 absorption for
post-combustion capture in coal-fired power plants. In these studies, one of the
identified challenges to the commercial roll out of the technology has been the
large size of the packed columns needed. This translates to high capital and
operating cost and unavoidable impact on electricity cost. Approaches such as
heat integration, inter-cooling among others could reduce the operating cost
slightly. However, they limit the plant flexibility and will make operation and control
more difficult [11]. Process intensification (PI) has the potential to meet this
challenge [12,13,14].
Nomenclature
A gas-liquid interfacial area (m2/m3)
a fibre diameter (m)
at total specific surface area of packing (m2/m3)
c mesh square opening (m)
𝐷𝐿 diffusivity coefficient of liquid (m2/s)
dp diameter of packing pore (m)

3
G superficial gas velocity (m/s)
gc gravitational acceleration or acceleration due to centrifugal field (m2/s)
go characteristic acceleration value (100 m2/s)
𝑘𝐿 liquid phase mass transfer coefficient (m/s)
L superficial liquid velocity (m/s)
𝑄𝐿 volumetric flow rate of liquid (m3/s)
R radial position (m)
T temperature (K)
U superficial flow velocity (m/s)
Uo characteristic superficial flow velocity (1cm/s)
𝑦𝐶𝑂2,𝑖𝑛 Mole fraction of CO2 in inlet stream
𝑦𝐶𝑂2,𝑜𝑢𝑡 Mole fraction of CO2 in outlet stream
𝑍 axial height of the packing (m)
Greek letters
∈𝐿 liquid holdup
𝜇 Viscosity (Pa.s)
𝜌𝐿 liquid density (kg/m3)
𝜌𝐺 gas density (kg/m3)
𝜎 liquid surface tension (N/m)
𝜎𝑐 critical surface tension (N/m)
𝑣𝐿 kinematic liquid viscosity (m2/s)
𝑣𝐺 kinematic gas viscosity (m2/s)
𝜔 angular velocity (rad/s)
Dimensionless groups
𝐹𝑟𝐿 liquid Froude number (𝐿2𝑎𝑡 𝑔𝑐⁄ )
𝐺𝑟𝐺 gas Grashof number (𝑑𝑝3𝑔𝑐 𝜈𝐺
2⁄ )
𝐺𝑟𝐿 liquid Grashof number (𝑑𝑝3𝑔𝑐 𝜈𝐿
2⁄ )
𝑅𝑒𝐺 gas Reynolds number (𝐺 𝑎𝑡𝜈𝐺⁄ )
𝑅𝑒𝐿 liquid Reynolds number (𝐿 𝑎𝑡𝜈𝐿⁄ )
𝑆𝑐𝐿 liquid Schmidt number (𝜈𝐿 𝐷𝐿⁄ )
𝑊𝑒𝐿 liquid Webber number (𝐿2𝜌𝐿 𝑎𝑡𝜎⁄ )
4
𝜑 𝑐2/(𝑑 + 𝑐)2
1.1 Motivation
Over 8,000 tonnes of CO2 per day will be released from 500 MWe supercritical
coal fired power plant operating at 46% efficiency (LHV basis) [15]. This big volume
of flue gas will result in the use of high amount of solvent and big size of packed
columns if conventional technology is to be applied. Lawal et al. [16] reported
dynamic modelling study of a 500MWe sub-critical coal-fired power plant using the
conventional packed column. From the analysis, two absorbers of 17m in packing
height and 9m in diameter will be needed to separate CO2 from the flue gas. These
huge conventional packed columns will mean higher capital and operating costs.
This could increase electricity costs by over 50% and has been a major impediment
to commercializing the technology.
1.3 Novel contributions of the paper
There are two novel aspects in this paper: (a) steady state validation of the
intensified absorber is performed, where comparison is made by using two
different sets of mass transfer correlations and the results indicated that Set 2
correlations give better predictions at higher (i.e. 75 wt%) and lower (i.e. 56 wt%)
MEA concentration than Set 1. (b) With the models developed using Set 2
correlations and validated, process analysis of the intensified absorber with RPB
involving different process scenarios were carried out to gain insights for process
design and operation. These process scenarios are: (i) when the RPB absorber
size is fixed and lean MEA flow rate is fixed, the impact of flue gas flow rate on
CO2 capture level was explored;. (ii) The effect of higher lean MEA temperature on
CO2 capture level for RPB absorber was explored; (iii) the effect of higher flue gas
temperature on CO2 capture level was explored. The results indicate higher lean-
MEA temperature increases CO2 capture level and at higher flue gas temperature,
CO2 capture level can be maintained. These results indicate that cooling duty for
lean MEA and flue gas can be greatly reduced.
Comparison between this paper and Joel et al. [17], there are three main
differences: (a) In Joel et al. [17] only Set 1 correlations were used while in this
paper Set 1 and Set 2 correlations were studied and implemented. (b) Process
analysis was done using Set 1 correlations in Joel et al. [17] while Set 2
correlations were used in this paper. (c) Process scenarios considered in Joel et
al. [17] were effect of lean MEA concentration, effect of rotating speed, effect of
lean MEA temperature on CO2 capture level and temperature bulge analysis in
RPB. While in this paper process scenarios considered are: Effect of flue gas flow
rate, effect of lean MEA temperature and effect of flue gas temperature on CO2
capture level.
5
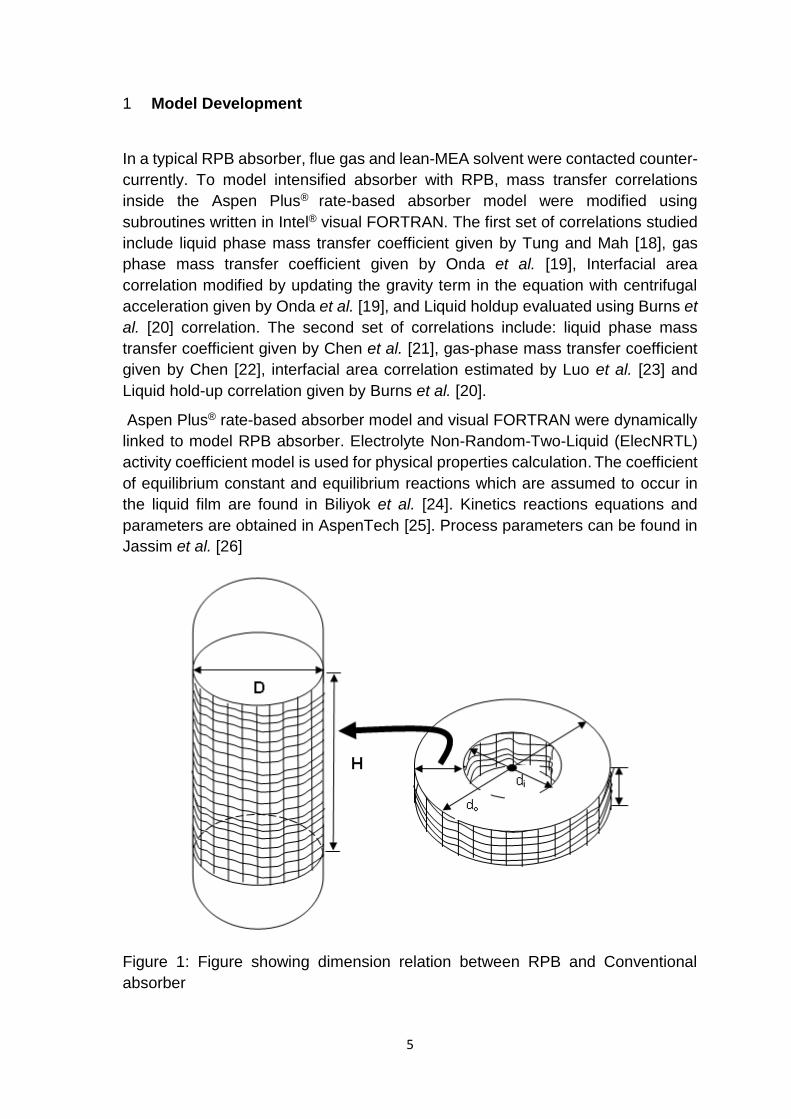
1 Model Development
In a typical RPB absorber, flue gas and lean-MEA solvent were contacted counter-
currently. To model intensified absorber with RPB, mass transfer correlations
inside the Aspen Plus® rate-based absorber model were modified using
subroutines written in Intel® visual FORTRAN. The first set of correlations studied
include liquid phase mass transfer coefficient given by Tung and Mah [18], gas
phase mass transfer coefficient given by Onda et al. [19], Interfacial area
correlation modified by updating the gravity term in the equation with centrifugal
acceleration given by Onda et al. [19], and Liquid holdup evaluated using Burns et
al. [20] correlation. The second set of correlations include: liquid phase mass
transfer coefficient given by Chen et al. [21], gas-phase mass transfer coefficient
given by Chen [22], interfacial area correlation estimated by Luo et al. [23] and
Liquid hold-up correlation given by Burns et al. [20].
Aspen Plus® rate-based absorber model and visual FORTRAN were dynamically
linked to model RPB absorber. Electrolyte Non-Random-Two-Liquid (ElecNRTL)
activity coefficient model is used for physical properties calculation. The coefficient
of equilibrium constant and equilibrium reactions which are assumed to occur in
the liquid film are found in Biliyok et al. [24]. Kinetics reactions equations and
parameters are obtained in AspenTech [25]. Process parameters can be found in
Jassim et al. [26]
Figure 1: Figure showing dimension relation between RPB and Conventional
absorber
6
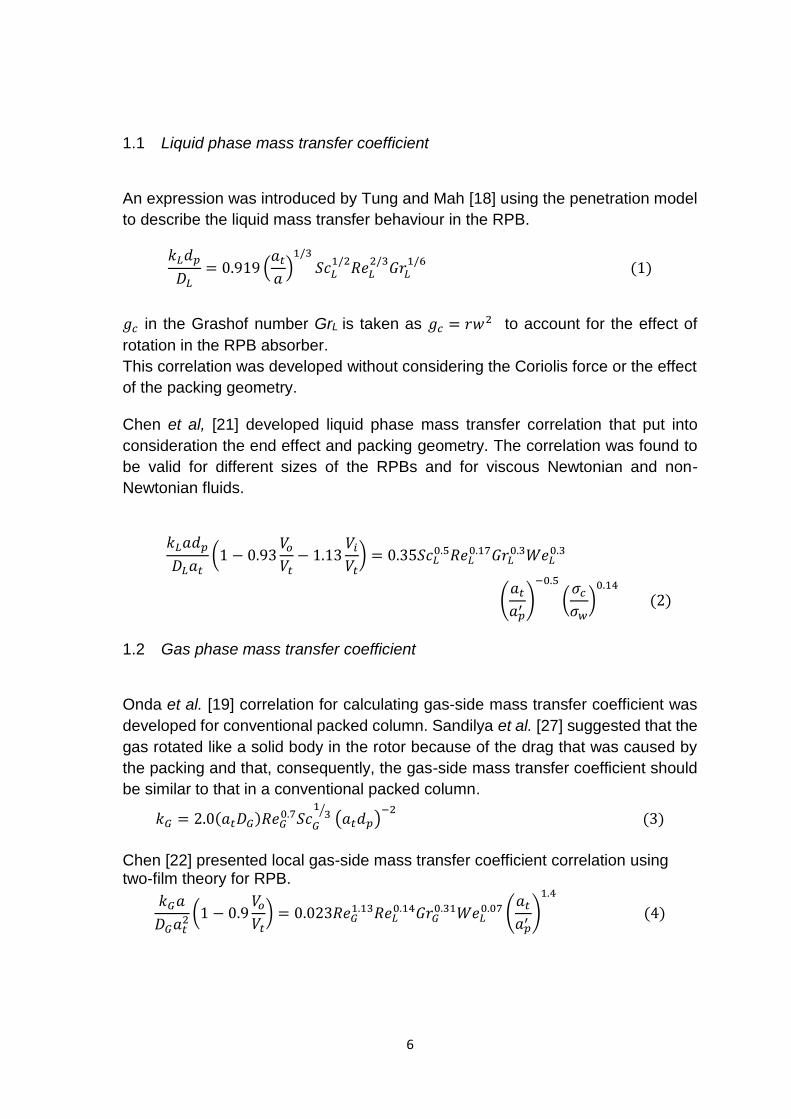
1.1 Liquid phase mass transfer coefficient
An expression was introduced by Tung and Mah [18] using the penetration model
to describe the liquid mass transfer behaviour in the RPB.
𝑘𝐿𝑑𝑝
𝐷𝐿= 0.919 (
𝑎𝑡
𝑎)
1/3
𝑆𝑐𝐿1/2
𝑅𝑒𝐿2/3
𝐺𝑟𝐿1/6
(1)
𝑔𝑐 in the Grashof number GrL is taken as 𝑔𝑐 = 𝑟𝑤2 to account for the effect of
rotation in the RPB absorber.
This correlation was developed without considering the Coriolis force or the effect
of the packing geometry.
Chen et al, [21] developed liquid phase mass transfer correlation that put into
consideration the end effect and packing geometry. The correlation was found to
be valid for different sizes of the RPBs and for viscous Newtonian and non-
Newtonian fluids.
𝑘𝐿𝑎𝑑𝑝
𝐷𝐿𝑎𝑡(1 − 0.93
𝑉𝑜
𝑉𝑡− 1.13
𝑉𝑖
𝑉𝑡) = 0.35𝑆𝑐𝐿
0.5𝑅𝑒𝐿0.17𝐺𝑟𝐿
0.3𝑊𝑒𝐿0.3
(𝑎𝑡
𝑎𝑝′
)
−0.5
(𝜎𝑐
𝜎𝑤)
0.14
(2)
1.2 Gas phase mass transfer coefficient
Onda et al. [19] correlation for calculating gas-side mass transfer coefficient was
developed for conventional packed column. Sandilya et al. [27] suggested that the
gas rotated like a solid body in the rotor because of the drag that was caused by
the packing and that, consequently, the gas-side mass transfer coefficient should
be similar to that in a conventional packed column.
𝑘𝐺 = 2.0(𝑎𝑡𝐷𝐺)𝑅𝑒𝐺0.7𝑆𝑐𝐺
13⁄ (𝑎𝑡𝑑𝑝)
−2 (3)
Chen [22] presented local gas-side mass transfer coefficient correlation using two-film theory for RPB.
𝑘𝐺𝑎
𝐷𝐺𝑎𝑡2 (1 − 0.9
𝑉𝑜
𝑉𝑡) = 0.023𝑅𝑒𝐺
1.13𝑅𝑒𝐿0.14𝐺𝑟𝐺
0.31𝑊𝑒𝐿0.07 (
𝑎𝑡
𝑎𝑝′
)
1.4
(4)

7
1.3 Total gas-liquid interfacial area
Total gas-liquid interfacial area is calculated with the Onda et al. [19] correlation.
𝑎
𝑎𝑡= 1 − 𝑒𝑥𝑝 [−1.45 (
𝜎𝑐
𝜎)
0.75
𝑅𝑒𝐿0.1𝑊𝑒𝐿
0.2𝐹𝑟𝐿−0.05] (5)
Similarly, 𝑔𝑐 in the Froude number FrL is taken as 𝑔𝑐 = 𝑟𝑤2 to account for the
effect of rotation in the RPB absorber.
Luo et al. [23] studied gas-liquid effective interfacial area in an RPB considering
different types of packing, also taking into account the effect of fibre diameter and
opening of the wire mesh.
𝑎
𝑎𝑡= 66510𝑅𝑒𝐿
−1.41𝐹𝑟𝐿−0.12𝑊𝑒𝐿
1.21𝜑−0.74 (6)
1.4 Liquid hold-up
Liquid holdup correlation by Burns et al. [20] is given as:
∈𝐿= 0.039 (𝑔𝑐
𝑔𝑜)
−0.5
(𝑈
𝑈𝑜)
0.6
(𝑣
𝑣𝑜)
0.22
(7)
𝑔𝑜 = 100 𝑚 𝑠−2, 𝑈𝑜 = 1 𝑐𝑚 𝑠−1, 𝑣𝑜 = 1 𝑐𝑆 = 10−6 𝑚2 𝑠−1
𝑈 =𝑄𝐿
2𝜋𝑟𝑍 (8)
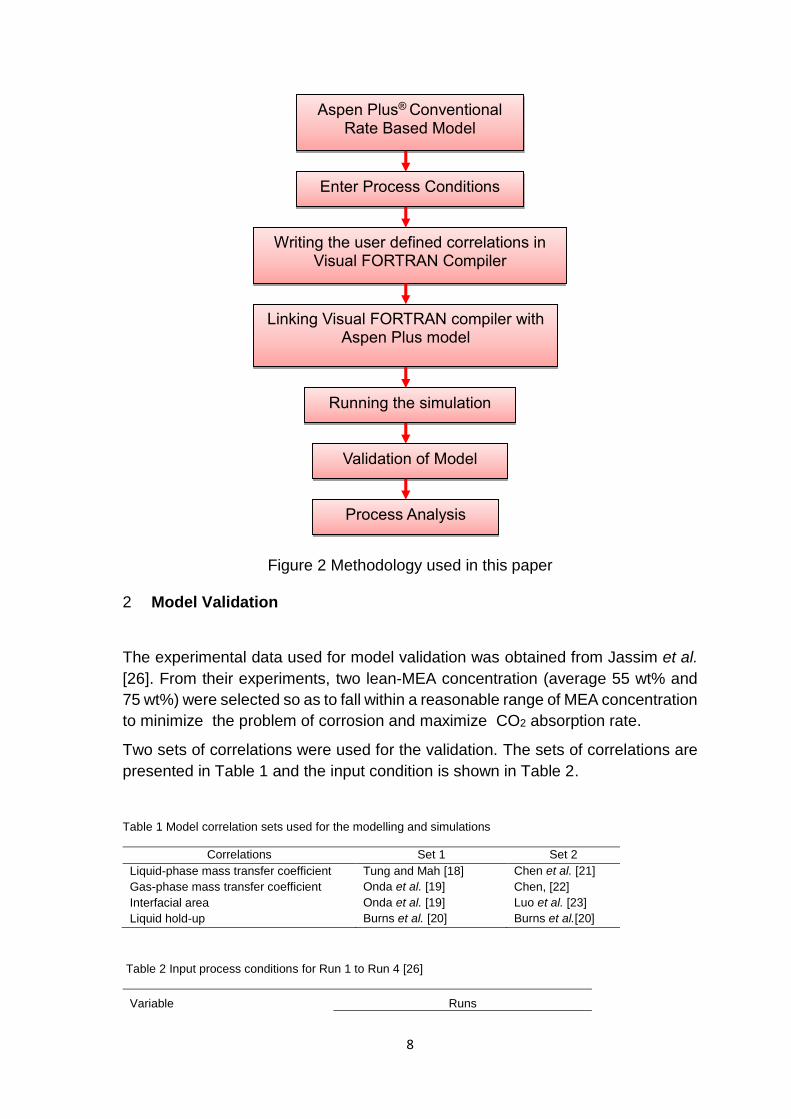
1.5 Modelling and simulation methodology
The procedure used in this paper for modelling and simulation of the RPB is shown
in Figure 2.
8
Figure 2 Methodology used in this paper
2 Model Validation
The experimental data used for model validation was obtained from Jassim et al.
[26]. From their experiments, two lean-MEA concentration (average 55 wt% and
75 wt%) were selected so as to fall within a reasonable range of MEA concentration
to minimize the problem of corrosion and maximize CO2 absorption rate.
Two sets of correlations were used for the validation. The sets of correlations are
presented in Table 1 and the input condition is shown in Table 2.
Table 1 Model correlation sets used for the modelling and simulations
Correlations Set 1 Set 2
Liquid-phase mass transfer coefficient Tung and Mah [18] Chen et al. [21]
Gas-phase mass transfer coefficient Onda et al. [19] Chen, [22]
Interfacial area Onda et al. [19] Luo et al. [23]
Liquid hold-up Burns et al. [20] Burns et al.[20]
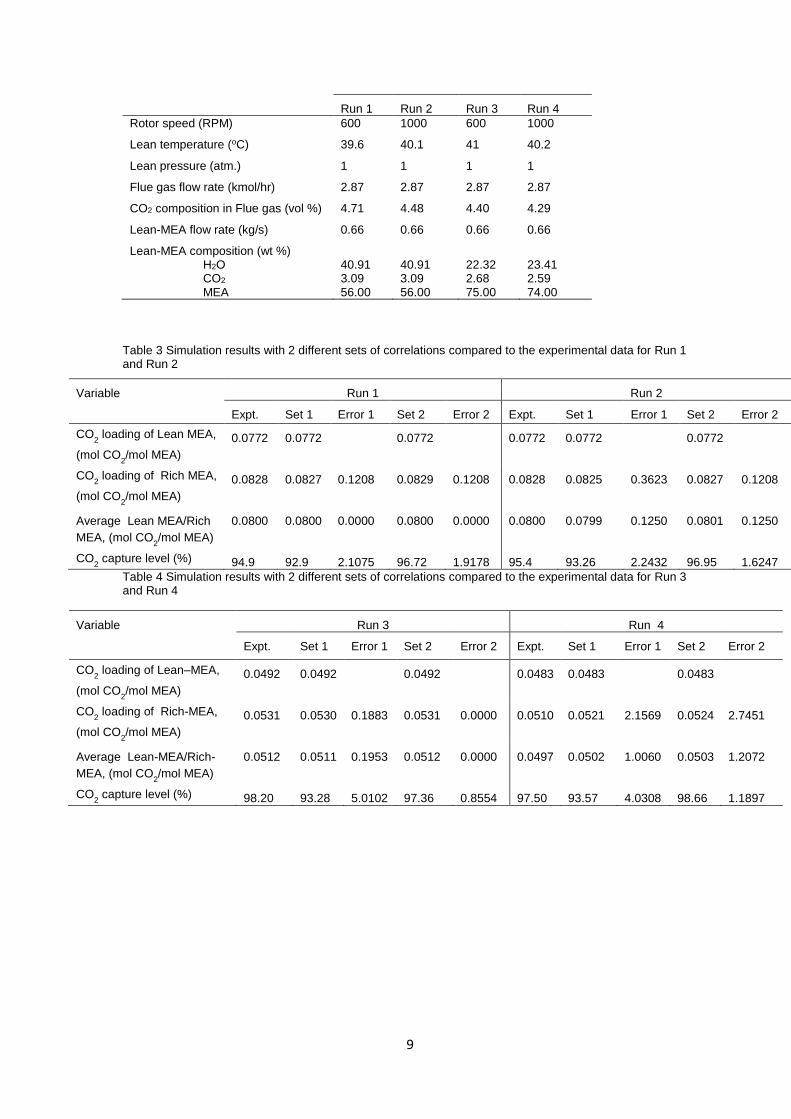
Table 2 Input process conditions for Run 1 to Run 4 [26]
Variable Runs
Aspen Plus® Conventional
Rate Based Model
Enter Process Conditions
Writing the user defined correlations in Visual FORTRAN Compiler
Linking Visual FORTRAN compiler with Aspen Plus model
Running the simulation
Validation of Model
Process Analysis
9
Run 1 Run 2 Run 3 Run 4
Rotor speed (RPM) 600 1000 600 1000
Lean temperature (oC) 39.6 40.1 41 40.2
Lean pressure (atm.) 1 1 1 1
Flue gas flow rate (kmol/hr) 2.87 2.87 2.87 2.87
CO2 composition in Flue gas (vol %) 4.71 4.48 4.40 4.29
Lean-MEA flow rate (kg/s) 0.66 0.66 0.66 0.66
Lean-MEA composition (wt %) H2O CO2 MEA
40.91 3.09 56.00
40.91 3.09 56.00
22.32 2.68 75.00
23.41 2.59 74.00
Table 3 Simulation results with 2 different sets of correlations compared to the experimental data for Run 1 and Run 2
Variable Run 1 Run 2
Expt. Set 1 Error 1 Set 2 Error 2 Expt. Set 1 Error 1 Set 2 Error 2
CO2 loading of Lean MEA,
(mol CO2/mol MEA)
0.0772 0.0772
0.0772 0.0772 0.0772
0.0772
CO2 loading of Rich MEA,
(mol CO2/mol MEA)
0.0828 0.0827
0.1208 0.0829 0.1208 0.0828 0.0825
0.3623 0.0827 0.1208
Average Lean MEA/Rich
MEA, (mol CO2/mol MEA)
0.0800 0.0800
0.0000 0.0800 0.0000 0.0800 0.0799
0.1250 0.0801 0.1250
CO2 capture level (%) 94.9 92.9 2.1075 96.72 1.9178 95.4 93.26 2.2432 96.95 1.6247
Table 4 Simulation results with 2 different sets of correlations compared to the experimental data for Run 3 and Run 4
Variable Run 3 Run 4
Expt. Set 1 Error 1 Set 2 Error 2 Expt. Set 1 Error 1 Set 2 Error 2
CO2 loading of Lean–MEA,
(mol CO2/mol MEA)
0.0492 0.0492
0.0492 0.0483 0.0483
0.0483
CO2 loading of Rich-MEA,
(mol CO2/mol MEA)
0.0531 0.0530
0.1883 0.0531 0.0000 0.0510 0.0521
2.1569 0.0524 2.7451
Average Lean-MEA/Rich-
MEA, (mol CO2/mol MEA)
0.0512 0.0511
0.1953 0.0512 0.0000 0.0497 0.0502
1.0060 0.0503 1.2072
CO2 capture level (%) 98.20 93.28 5.0102 97.36 0.8554 97.50 93.57 4.0308 98.66 1.1897
10
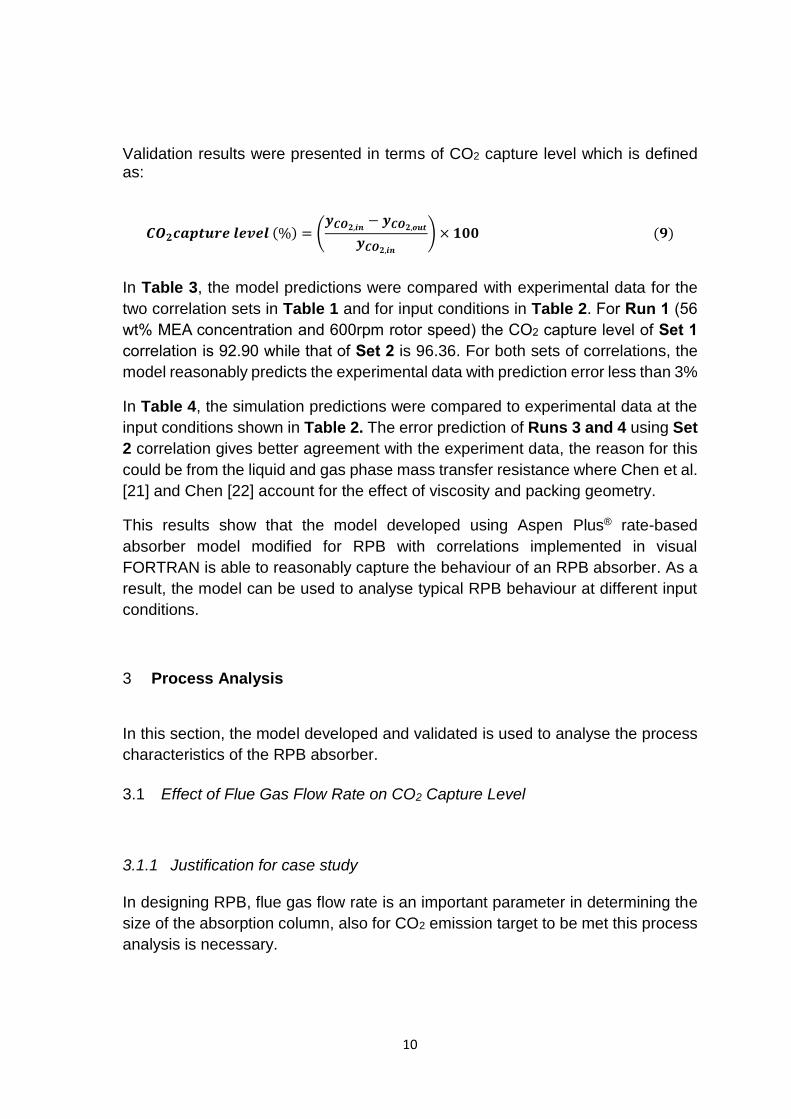
Validation results were presented in terms of CO2 capture level which is defined as:
𝑪𝑶𝟐𝒄𝒂𝒑𝒕𝒖𝒓𝒆 𝒍𝒆𝒗𝒆𝒍 (%) = (𝒚𝑪𝑶𝟐,𝒊𝒏
− 𝒚𝑪𝑶𝟐,𝒐𝒖𝒕
𝒚𝑪𝑶𝟐,𝒊𝒏
) × 𝟏𝟎𝟎 (𝟗)
In Table 3, the model predictions were compared with experimental data for the
two correlation sets in Table 1 and for input conditions in Table 2. For Run 1 (56
wt% MEA concentration and 600rpm rotor speed) the CO2 capture level of Set 1
correlation is 92.90 while that of Set 2 is 96.36. For both sets of correlations, the
model reasonably predicts the experimental data with prediction error less than 3%
In Table 4, the simulation predictions were compared to experimental data at the
input conditions shown in Table 2. The error prediction of Runs 3 and 4 using Set
2 correlation gives better agreement with the experiment data, the reason for this
could be from the liquid and gas phase mass transfer resistance where Chen et al.
[21] and Chen [22] account for the effect of viscosity and packing geometry.
This results show that the model developed using Aspen Plus® rate-based
absorber model modified for RPB with correlations implemented in visual
FORTRAN is able to reasonably capture the behaviour of an RPB absorber. As a
result, the model can be used to analyse typical RPB behaviour at different input
conditions.
3 Process Analysis
In this section, the model developed and validated is used to analyse the process
characteristics of the RPB absorber.
3.1 Effect of Flue Gas Flow Rate on CO2 Capture Level
3.1.1 Justification for case study
In designing RPB, flue gas flow rate is an important parameter in determining the
size of the absorption column, also for CO2 emission target to be met this process
analysis is necessary.
11
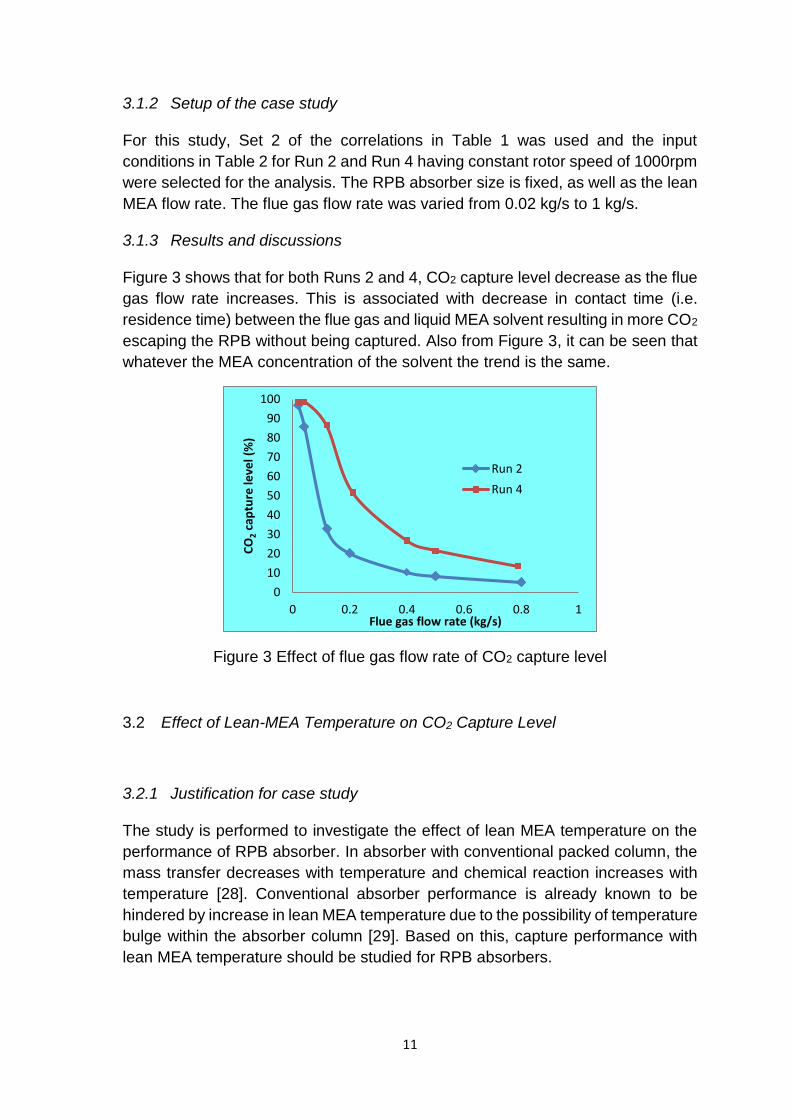
3.1.2 Setup of the case study
For this study, Set 2 of the correlations in Table 1 was used and the input
conditions in Table 2 for Run 2 and Run 4 having constant rotor speed of 1000rpm
were selected for the analysis. The RPB absorber size is fixed, as well as the lean
MEA flow rate. The flue gas flow rate was varied from 0.02 kg/s to 1 kg/s.
3.1.3 Results and discussions
Figure 3 shows that for both Runs 2 and 4, CO2 capture level decrease as the flue
gas flow rate increases. This is associated with decrease in contact time (i.e.
residence time) between the flue gas and liquid MEA solvent resulting in more CO2
escaping the RPB without being captured. Also from Figure 3, it can be seen that
whatever the MEA concentration of the solvent the trend is the same.
Figure 3 Effect of flue gas flow rate of CO2 capture level
3.2 Effect of Lean-MEA Temperature on CO2 Capture Level
3.2.1 Justification for case study
The study is performed to investigate the effect of lean MEA temperature on the
performance of RPB absorber. In absorber with conventional packed column, the
mass transfer decreases with temperature and chemical reaction increases with
temperature [28]. Conventional absorber performance is already known to be
hindered by increase in lean MEA temperature due to the possibility of temperature
bulge within the absorber column [29]. Based on this, capture performance with
lean MEA temperature should be studied for RPB absorbers.
0
10
20
30
40
50
60
70
80
90
100
0 0.2 0.4 0.6 0.8 1
CO
2ca
ptu
re le
vel (
%)
Flue gas flow rate (kg/s)
Run 2
Run 4
12
3.2.2 Setup of the case study
Set 2 correlation is used in the implementation of this case study. Process
conditions are shown in Table 5. Rotor speed of 1000 rpm, lean MEA flow rate of
0.66 kg/s and lean MEA temperature which is varied from 25 oC, 30 oC, 35 oC, 40 oC … to 80 oC at 55 wt% and 75 wt% lean MEA concentrations were used.
Table 5 Process Conditions for lean MEA temperature studies
Variable 55 wt% MEA Con. 75 wt% MEA Con.
Rotor speed (RPM) 1000 1000
Lean pressure (atm.) 1 1
Flue gas flow rate (kmol/hr) 2.87 2.87
Flue gas composition (vol %)
H2O
CO2
N2
17.1
4.4
78.5
17.1
4.4
78.5
Lean-MEA flow rate (kg/s) 0.66 0.66
Lean-MEA composition (wt %)
H2O
CO2
MEA
41.03
3.97
55.00
22.32
2.68
75.00
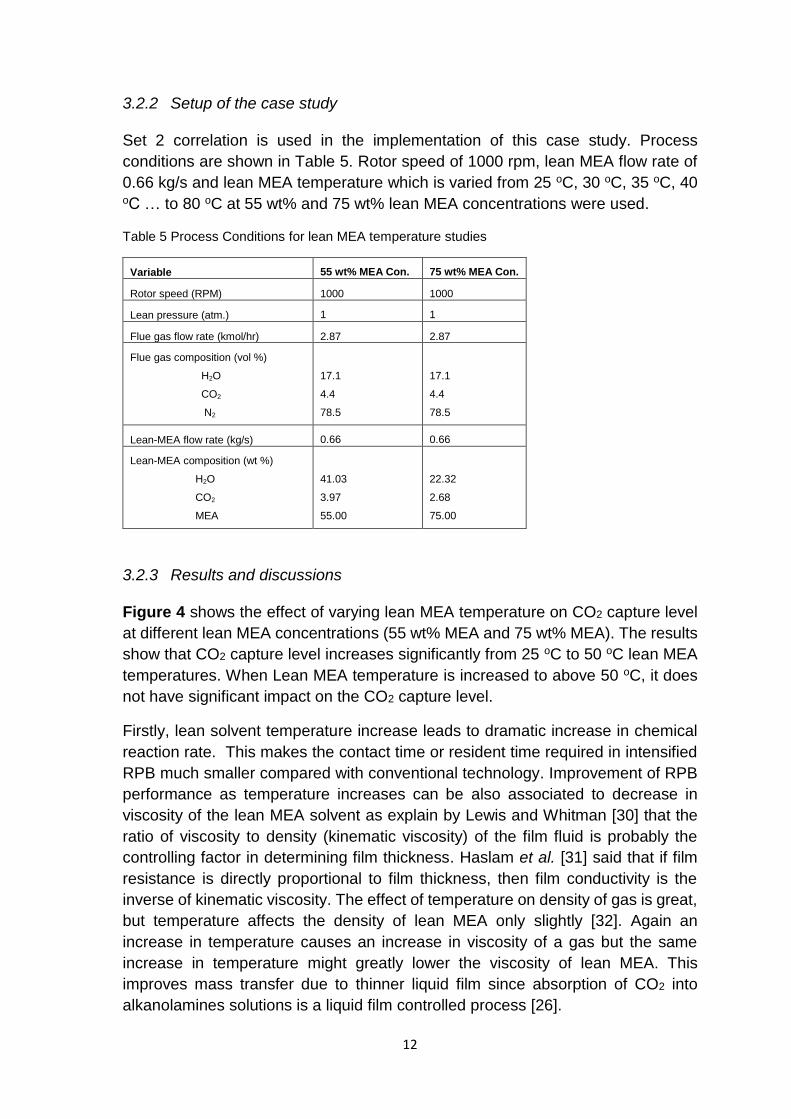
3.2.3 Results and discussions
Figure 4 shows the effect of varying lean MEA temperature on CO2 capture level
at different lean MEA concentrations (55 wt% MEA and 75 wt% MEA). The results
show that CO2 capture level increases significantly from 25 oC to 50 oC lean MEA
temperatures. When Lean MEA temperature is increased to above 50 oC, it does
not have significant impact on the CO2 capture level.
Firstly, lean solvent temperature increase leads to dramatic increase in chemical
reaction rate. This makes the contact time or resident time required in intensified
RPB much smaller compared with conventional technology. Improvement of RPB
performance as temperature increases can be also associated to decrease in
viscosity of the lean MEA solvent as explain by Lewis and Whitman [30] that the
ratio of viscosity to density (kinematic viscosity) of the film fluid is probably the
controlling factor in determining film thickness. Haslam et al. [31] said that if film
resistance is directly proportional to film thickness, then film conductivity is the
inverse of kinematic viscosity. The effect of temperature on density of gas is great,
but temperature affects the density of lean MEA only slightly [32]. Again an
increase in temperature causes an increase in viscosity of a gas but the same
increase in temperature might greatly lower the viscosity of lean MEA. This
improves mass transfer due to thinner liquid film since absorption of CO2 into
alkanolamines solutions is a liquid film controlled process [26].
13
Figure 4 Effect of lean-MEA temperature on CO2 capture level
3.3 Effect of Flue Gas Temperature on CO2 Capture Level
3.3.1 Justification for case study
Moisture content of a flue gas is dependent on temperature, pressure and the type
of fuel used. Study of flue gas temperature is necessary since additional cost will
be incurred in cooling flue gas prior to entering conventional absorber [11, 28].
3.3.2 Setup of the case study
Set 2 correlations in Table 1 were used for the formulation of this case study. Run
2 and 4 were selected which are at 56 wt% and 74 wt% MEA concentration
respectively. The simulations were run at rotor speed of 1000 rpm, the lean-MEA
temperature was kept constant at 40.1 oC for Run 2 and 40.2 oC for Run 4, in both
case flue gas temperature was varied from 30 oC to 80 oC.
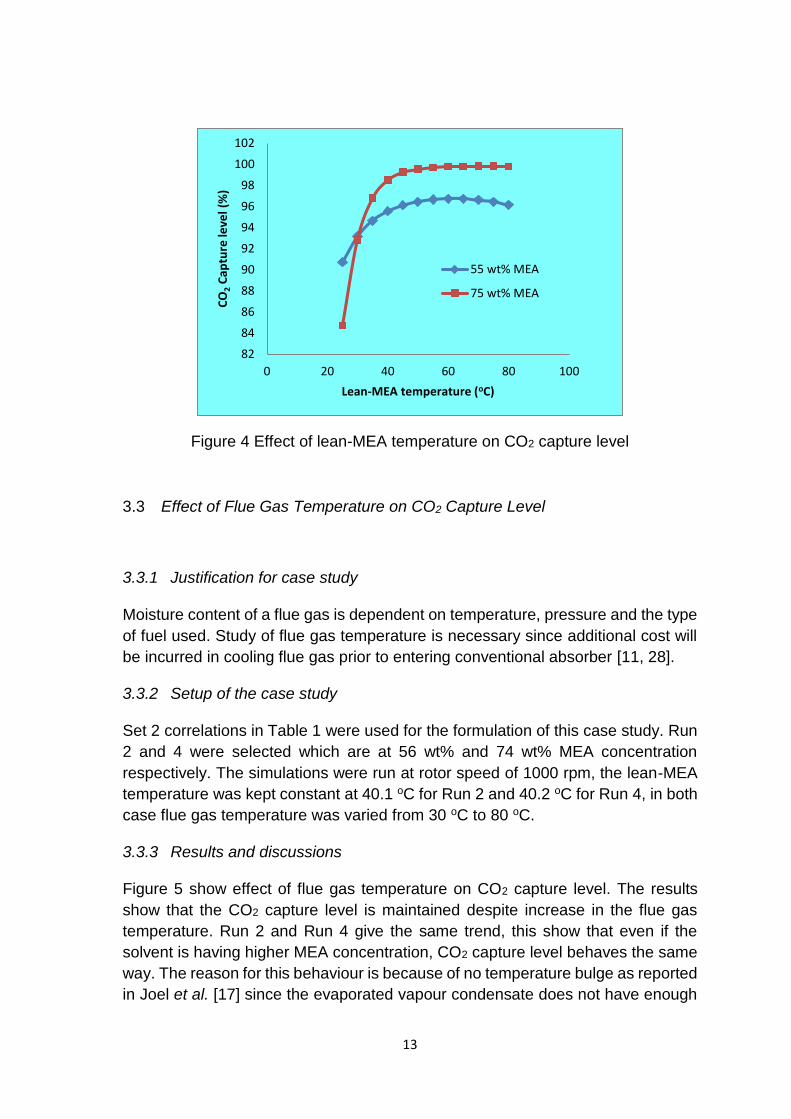
3.3.3 Results and discussions
Figure 5 show effect of flue gas temperature on CO2 capture level. The results
show that the CO2 capture level is maintained despite increase in the flue gas
temperature. Run 2 and Run 4 give the same trend, this show that even if the
solvent is having higher MEA concentration, CO2 capture level behaves the same
way. The reason for this behaviour is because of no temperature bulge as reported
in Joel et al. [17] since the evaporated vapour condensate does not have enough
82
84
86
88
90
92
94
96
98
100
102
0 20 40 60 80 100
CO
2C
aptu
re le
vel (
%)
Lean-MEA temperature (oC)
55 wt% MEA
75 wt% MEA
14
residence time for energy build-up in the column. Again because of high liquid to
gas (L/G) ratio in an RPB, making the CO2 capture level not sensitive to the flue
gas temperature change. The maintained CO2 capture level shown in Figure 5
indicates that flue gas cooling energy cost can be saved.
Figure 5 Effect of flue gas temperature on CO2 capture level
4 Conclusions
Modelling, validation and analysis of a post-combustion CO2 capture with MEA
using intensified absorber was carried out in this paper with two sets of
correlations. The RPB absorber was modelled in Aspen Plus(R) which is
dynamically linked with visual FORTRAN. Rate-based modelling approach was
used and chemical reactions are assumed to be at equilibrium. Experimental data
used for validation were obtained from Jassim et al. [26].
Two sets of correlations were implemented for the validation of the intensified
absorber model and the model predictions showed good agreement with the
experimental results. The second set of correlations gives better prediction
compared to the first set of correlation. Process was analysed regarding the effect
of flue gas flow rate, lean-MEA temperature and flue gas temperature on CO2
capture level in the intensified absorber. It was found that as the lean-MEA
temperature increases the CO2 capture level increases and as the flue gas
temperature increases the CO2 capture level can be maintained, these mean that
cooling duty cost in RPB can be greatly reduced compared with conventional
technology. The result shows mass transfer is improved with the use of RPB, also
95
95.5
96
96.5
97
97.5
98
98.5
99
99.5
100
20 30 40 50 60 70 80 90
CO
2 c
aptu
re le
vel (
%)
Flue gas temperature (oC)
Run 2
Run 4
15
since the RPB absorber is operated at higher temperature reaction rate is also
enhanced.
References
[1] Department of Energy and Climate Change, 2012. Solid Fuels and Derived Gases Statistics: Data Sources and Methodologies. Available at: http://www.decc.gov.uk/en/content/cms/statistics/energy_stats/source/coal/coal.aspx (accessed in 05/2012).
[2] J. A. Moulijn, A. Stankiewicz, J. Grievink, A. Go´rak, Process intensification and process systems engineering: a friendly symbiosis. Comput. Chem. Eng. 2008, 32 (1-2), 3–11.
[3] Oh, T.H., 2010. Carbon capture and storage potential in coal-fired plant in
Malaysia – a review. Renew. Sust. Energy Rev. 14, 2697–2709. [4] Intergovernmental Panel on Climate Change, 2007. Contribution of Working
Group III to the Fourth Assessment Report of the Intergovernmental Panel on Climate Change. Cambridge University Press, Cambridge, United Kingdom/New York, United States.
[5] International Energy Agency, 2010. Carbon Capture and Storage Model
Regulatory Framework, Available at: http://www.iea.org/ccs/legal/model framework.pdf (accessed in May 2013).
[6] N. MacDowell, N. Florin, A. Buchard, J. Hallett, A. Galindo, G. Jackson, C.S.
Adjiman, C.K. Williams, N. Shah, P. Fennell, An overview of CO2 capture technologies. Energy and Environmental Science 3 (2010), 1645–1669.
[7] E.R. Dugas. Pilot plant study of carbon dioxide capture by aqueous monoethanolamine. M.S.E. Thesis. University of Texas, Austin, USA. 2006
[8] A. Lawal, M. Wang, P. Stephenson, H. Yeung, Dynamic modelling of CO2 absorption for post combustion capture in coal-fired power plants. Fuel 88 (2009a) 2455–2462
[9] A. Lawal, M. Wang, P. Stephenson, H. Yeung, Dynamic modeling and simulation of CO2 chemical absorption process for coal-fired power plants. In: de Brito Alves, R.M., Oller do Nascimento, C.A., Chalbaud Biscaia Jr., E. (Eds.), Computer Aided Chemical Engineering. Elsevier, 2009b, 1725–1730.
[10] A. Lawal, M. Wang, P. Stephenson, G. Koumpouras, H. Yeung, Dynamic modelling and analysis of post-combustion CO2 chemical absorption process for coal-fired power plants. Fuel 89 (2010), 2791–2801.
16
[11] H. M. Kvamsdal, J. P. Jakobsen, K. A. Hoff, Dynamic modeling and simulation of a CO2 absorber column for post-combustion CO2 capture. Chemical Engineering and Processing: Process Intensification 48(2009), 135-144
[12] D. Reay, The role of process intensification in cutting greenhouse gas emissions. Applied Thermal Engineering 28(2008), 2011-2019.
[13] C. Ramshaw, R. H. Mallinson,. Mass transfer process. U.S. Petent, 4,283,255, 1981
[14] M. Wang, A. Lawal, P. Stephenson, J. Sidders, C. Ramshaw, Post-combustion CO2 capture with chemical absorption: A state-of-the-art review. Chemical Engineering Research and Design 89(2011), 1609-1624.
[15] BERR, (2006) Advanced power plant using high efficiency boiler/turbine. Report BPB010. BERR, Department for Business Enterprise and Regulatory Reform; Available at: www.berr.gov.uk/files/file30703.pdf. (accessed 04/2012)
[16] A. Lawal, M. Wang, P. Stephenson, O. Obi, Demonstrating full-scale post-combustion CO2 capture for coal-fired power plants through dynamic modelling and simulation. Fuel 101(2012), 115-128.
[17] A. S. Joel, M. Wang, C. Ramshaw, E. Oko, Process analysis of intensified absorber for post-combustion CO2 capture through modelling and simulation. International Journal of Greenhouse Gas Control. Submitted in June, 2013
[18] H. H. Tung, R. S. H. Mah, Modeling liquid mass transfer in higee separation process. Chemical Engineering Communications 39(1985), 147-153.
[19] K. Onda, E. Sada, H. Takeuchi, Gas absorption with chemical reaction in packed columns. Journal of Chemical Engineering of Japan, 1(1968), 62-66.
[20] J. R. Burns, J. N. Jamil, C. Ramshaw, Process intensification: operating characteristics of rotating packed beds — determination of liquid hold-up for a high-voidage structured packing. Chemical Engineering Science 55(2000), 2401-2415.
[21] Y. S. Chen, F. Y. Lin, C. C. Lin, C. Y. Tai, H. S Liu, Packing Characteristics for Mass Transfer in a Rotating Packed Bed. Ind. Eng. Chem. Res. 45(2006), 6846.
[22] Y. S. Chen, Correlations of Mass Transfer Coefficients in a Rotating Packed
Bed. Ind. Eng. Chem. Res., 50(2011), 1778
[23] Y. Luo, G. W. Chu, H. K. Zou, Z. Q. Zhao,M. P. Dudukovic.; J. F. Chen,. Gas – Liquid effective interfacial area in a rotating packed. Industrial and
Engineering Chemistry Research. 51, (2012), 16320-16325.
17
[24] C. Biliyok, A. Lawal, M. Wang, F. Seibert, Dynamic modelling, validation and analysis of post-combustion chemical absorption CO2 capture plant. International Journal of Greenhouse Gas Control 9 (2012) 428–445
[25] AspenTech., 2010. Aspen Physical Properties System – Physical Property Methods. Available at: http://support.aspentech.com/
(accessed in May 2012).
[26] M. S. Jassim, G. Rochelle, D. Eimer, C. Ramshaw, Carbon dioxide absorption and desorption in aqueous monoethanolamine solutions in a rotating packed bed. Industrial & Engineering Chemistry Research 46(2007), 2823-2833
[27] P. Sandilya, D. P. Rao, A. Sharma, G. Biswas, Gas-Phase Mass Transfer in a Centrifugal Contactor. Ind. Eng. Chem. Res., 40(2001), 384.
[28] H.M. Kvamsdal, J. Hetland, G. Haugen, H.F. Svendsen, F. Major, V. Kårstad, G. Tjellander, Maintaining a neutral water balance in a 450 MWe NGCC-CCS power system with post-combustion carbon dioxide capture aimed at offshore operation. International Journal of Greenhouse Gas Control 4 (2010), 613–622.
[29] S. Freguia, G.T. Rochelle, Modeling of CO2 capture by aqueous monoethanolamine. AIChE Journal 49 (2003), 1676–1686.
[30] W. K. Lewis, W. G. Whitman, Principles of gas absorption. Industrial and Engineering Chemistry 16(1924), 1215-1220.
[31] R. T. Haslam, Hershey, R. L., Keen, R. H.,. Effect of gas velocity and temperature on rate of absorption. Industrial and Engineering Chemistry 16(1924), 1224-1230.
[32] R. Maceiras, E. Álvarez, M.Á. Cancela, Effect of temperature on carbon dioxide absorption in monoethanolamine solutions. Chemical Engineering Journal, 138(2008), pp. 295-300